nicole kotras masters thesis
nicole kotras masters thesis
nicole kotras masters thesis

Create successful ePaper yourself
Turn your PDF publications into a flip-book with our unique Google optimized e-Paper software.
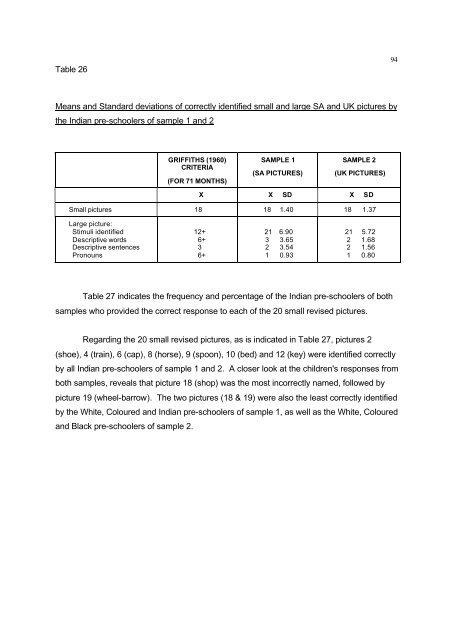
Table 26<br />
Means and Standard deviations of correctly identified small and large SA and UK pictures by<br />
the Indian pre-schoolers of sample 1 and 2<br />
GRIFFITHS (1960)<br />
CRITERIA<br />
(FOR 71 MONTHS)<br />
SAMPLE 1<br />
(SA PICTURES)<br />
SAMPLE 2<br />
(UK PICTURES)<br />
X X SD X SD<br />
Small pictures 18 18 1.40 18 1.37<br />
Large picture:<br />
Stimuli identified<br />
Descriptive words<br />
Descriptive sentences<br />
Pronouns<br />
12+<br />
6+<br />
3<br />
6+<br />
21 6.90<br />
3 3.65<br />
2 3.54<br />
1 0.93<br />
21 5.72<br />
2 1.68<br />
2 1.56<br />
1 0.80<br />
Table 27 indicates the frequency and percentage of the Indian pre-schoolers of both<br />
samples who provided the correct response to each of the 20 small revised pictures.<br />
Regarding the 20 small revised pictures, as is indicated in Table 27, pictures 2<br />
(shoe), 4 (train), 6 (cap), 8 (horse), 9 (spoon), 10 (bed) and 12 (key) were identified correctly<br />
by all Indian pre-schoolers of sample 1 and 2. A closer look at the children's responses from<br />
both samples, reveals that picture 18 (shop) was the most incorrectly named, followed by<br />
picture 19 (wheel-barrow). The two pictures (18 & 19) were also the least correctly identified<br />
by the White, Coloured and Indian pre-schoolers of sample 1, as well as the White, Coloured<br />
and Black pre-schoolers of sample 2.<br />
94