Personality and Individual Differences - Gary Reker's Website
Personality and Individual Differences - Gary Reker's Website
Personality and Individual Differences - Gary Reker's Website

You also want an ePaper? Increase the reach of your titles
YUMPU automatically turns print PDFs into web optimized ePapers that Google loves.
Abstract<br />
Meaning in life of young, middle-aged, <strong>and</strong> older<br />
adults: factorial validity, age, <strong>and</strong> gender invariance of<br />
the Personal Meaning Index (PMI)<br />
<strong>Gary</strong> T. Reker *<br />
Department of Psychology, Trent University, Peterborough, ON, Canada K9J 7B8<br />
Received 15 May 2003; received in revised form 6 February 2004; accepted 26 March 2004<br />
Available online 25 May 2004<br />
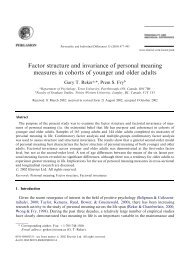
The purpose of the present study was to examine the factorial validity <strong>and</strong> the age <strong>and</strong> gender invariance of<br />
the Personal Meaning Index (PMI), a measure of the existential belief that life is meaningful. A combined<br />
sample of 2065 young ðN ¼ 1152Þ, middle-aged ðN ¼ 483Þ, <strong>and</strong> older ðN ¼ 430Þ adults completed the purpose<br />
<strong>and</strong> coherence subscales of the Life Attitude Profile-Revised (Reker, 1992). Confirmatory factor analysis<br />
<strong>and</strong> multiple-groups confirmatory factor analysis was used to assess the factorial structure, age invariance,<br />
<strong>and</strong> gender invariance of the PMI. The results show that a one-factor congeneric measurement model best<br />
characterizes the underlying structure of the PMI for each age group <strong>and</strong> for both males <strong>and</strong> females. Differential<br />
item functioning across age for males <strong>and</strong> females was found for six PMI items; only two PMI items<br />
were found to be noninvariant across gender. Plausible explanations for the noninvariant PMI items are<br />
offered <strong>and</strong> the practical implications for the use of the PMI in multigroup comparisons are discussed.<br />
Ó 2004 Elsevier Ltd. All rights reserved.<br />
Keywords: Personal meaning index; Factorial validity; Age invariance; Gender invariance<br />
1. Introduction<br />
Since the introduction of the construct of personal meaning by Frankl (1963) <strong>and</strong> Maddi<br />
(1970), considerable attention has been given to the measurement of personal meaning<br />
(Chamberlain & Zika, 1988; Debats, van der Lubbe, & Wezeman, 1993; Reker, 1992, 2000;<br />
* Fax: +1-705-748-1580.<br />
E-mail address: greker@trentu.ca (G.T. Reker).<br />
<strong>Personality</strong> <strong>and</strong> <strong>Individual</strong> <strong>Differences</strong> 38 (2005) 71–85<br />
0191-8869/$ - see front matter Ó 2004 Elsevier Ltd. All rights reserved.<br />
doi:10.1016/j.paid.2004.03.010<br />
www.elsevier.com/locate/paid
72 G.T. Reker / <strong>Personality</strong> <strong>and</strong> <strong>Individual</strong> <strong>Differences</strong> 38 (2005) 71–85<br />
Reker & Chamberlain, 2000). Specifically, the thorny problem of how to define <strong>and</strong> operationalize<br />
personal meaning has been addressed. These attempts have resulted in a proliferation of a diverse<br />
set of conceptual definitions <strong>and</strong> measuring instruments, each reflecting the theoretical orientation<br />
of the researcher (e.g., Antonovsky, 1987; Battista & Almond, 1973; Crumbaugh & Maholick,<br />
1969; Reker & Wong, 1988). The availability of these measures has led to a number of empirical<br />
studies investigating the correlates of meaning, the mediating/moderating role of meaning, <strong>and</strong><br />
age <strong>and</strong> gender differences in personal meaning (e.g., Fry, 2001; Harlow, Newcomb, & Bentler,<br />
1986; Reker, Peacock, & Wong, 1987; Zika & Chamberlain, 1992).<br />
Of particular interest to the current investigation are studies of personal meaning involving<br />
multigroup comparisons (e.g., age differences, gender differences). In any such study, it is<br />
important to demonstrate that the specific meaning measure that is used is structurally valid for<br />
each comparison group. It is equally important to evaluate the structural invariance of meaning<br />
measures so that any observed group differences <strong>and</strong>/or changes over time can be more appropriately<br />
attributed to ‘‘real’’ differences <strong>and</strong>/or changes on the personal meaning construct. While<br />
the factorial validity of meaning measures is normally demonstrated, structural equivalence is<br />
often assumed <strong>and</strong> rarely subjected to empirical scrutiny. Thus, it is often not known whether the<br />
same measure of personal meaning taps the same underlying construct across all comparison<br />
groups, leading to potential confounding <strong>and</strong> misinterpretations of observed mean differences.<br />
To date, a very small number of studies have tested the structural invariance of personal<br />
meaning measures in multigroup comparisons. Van Ranst <strong>and</strong> Marcoen (1997) examined the<br />
factorial validity <strong>and</strong> invariance of the Life Regard Index (LRI: Battista & Almond, 1973) across<br />
samples of young <strong>and</strong> older adults. The LRI is a 28-item, 5-point multidimensional measure<br />
divided into two subscales, Framework <strong>and</strong> Fulfillment. Age invariance was tested separately for<br />
each subscale using individual items as indicators. The factor loadings of the Framework items<br />
were found to be age invariant, but the loadings of the Fulfillment items were not. The authors<br />
concluded that the measurement <strong>and</strong> the structure of the LRI are not equivalent across young <strong>and</strong><br />
older adults <strong>and</strong> urge researchers to exercise caution when using the LRI to study age differences<br />
in meaning in life. Along similar lines, Reker <strong>and</strong> Fry (2003) examined the factor structure <strong>and</strong><br />
factorial invariance of six self-report measures of personal meaning across samples of younger <strong>and</strong><br />
older adults. Invariance, however, was only tested at the scale level using item parcels as indicators.<br />
All six measures were found to be structurally invariant across age for first-order factor<br />
loadings, but some scales were shown to be more resistant to sources of noninvariance compared<br />
to others.<br />
One of the measures of personal meaning that appears to be more resistant to noninvariance is<br />
the Personal Meaning Index (PMI), a 16-item measure of the existential belief that life is<br />
meaningful (Reker, 1992). The PMI is a composite of the Purpose <strong>and</strong> Coherence subscales of the<br />
multidimensional Life Attitude Profile-Revised (LAP-R: Reker, 1992). Although originally<br />
developed for use with elderly populations, the PMI has been applied to all ages ranging from<br />
adolescence to older adulthood (e.g., Bearsley & Cummins, 1999; Fry, 2000; Reker et al., 1987).<br />
Cross-sectional studies across the life span from late adolescence to the old–old have consistently<br />
found that personal meaning, as measured by the PMI, increases with age (Reker, 1992; Reker et<br />
al., 1987). Gender differences on the PMI, favouring females, have also been reported (Fry, 2001;<br />
Reker, 1992; V<strong>and</strong>eCreek, 1991). Furthermore, the PMI has been shown to have very favourable<br />
psychometric properties (Reker, 1992; Reker & Fry, 2003).
Despite the current popularity of the PMI, assessment of its psychometric properties has been<br />
exclusively carried out at the total scale score level. To the author’s knowledge, no study has been<br />
undertaken to examine the structural invariance of the PMI across age groups <strong>and</strong> gender at the<br />
individual item level. Given the frequent use of the PMI in studies of age <strong>and</strong> gender differences, it<br />
is important to demonstrate that the PMI items remain structurally invariant in terms of the<br />
pattern of factor loadings, item distribution characteristics, <strong>and</strong> the pattern of item response<br />
frequencies.<br />
Prior to determining that the PMI items remain age <strong>and</strong> gender invariant, it is necessary to<br />
examine the factor structure of the PMI separately for each age group <strong>and</strong> gender. Based on prior<br />
exploratory <strong>and</strong> confirmatory factor analyses, it is hypothesized that a first-order CFA model best<br />
characterizes the underlying factor structure of the PMI for young, middle-aged, <strong>and</strong> older adults<br />
<strong>and</strong> for males <strong>and</strong> females. For each group, the scale of the latent factor Personal Meaning was<br />
defined by fixing the factor loading of the first item to unity. Each item is hypothesized to have a<br />
nonzero loading on the first-order factor <strong>and</strong> error terms associated with each item are hypothesized<br />
to be uncorrelated.<br />
The purposes of the present study were fourfold: (a) to test the factorial structure of the PMI<br />
separately for young, middle-aged, <strong>and</strong> older adults <strong>and</strong> for males <strong>and</strong> females, (b) to test for<br />
measurement invariance across three age groups <strong>and</strong> gender, (c) to identify sources of item<br />
noninvariance, <strong>and</strong> (d) to examine age <strong>and</strong> gender differences in total meaning scores based on the<br />
invariant PMI items.<br />
2. Method<br />
2.1. Participants <strong>and</strong> procedure<br />
A combined sample of 2065 adult volunteers (females ¼ 1449; males ¼ 616) participated in this<br />
study. Study participants were divided into 3 age groups: young, 16–24 years (males ¼ 280,<br />
females ¼ 872); middle-aged, 25–49 years (males ¼ 148, females ¼ 335); <strong>and</strong> elderly, 50–93 years<br />
(males ¼ 188, females ¼ 242). The mean age of all participants was 34.3 years (range 16–93 years,<br />
SD ¼ 20.0). The young participants were undergraduate psychology <strong>and</strong> gerontology students<br />
who received course credit for their involvement. Middle-aged <strong>and</strong> older adults were recruited<br />
through community newsletters <strong>and</strong> posters placed in churches, seniors lodges, <strong>and</strong> age-segregated<br />
housing complexes, as well as by word of mouth. Participants were drawn from several<br />
studies that examined the relationship between personal meaning <strong>and</strong> psychosocial outcome<br />
variables. For the current study, all participants completed the Personal Meaning Index (PMI), a<br />
measure derived from the Life Attitude Profile-Revised (LAP-R: Reker, 1992).<br />
2.2. Instrumentation<br />
G.T. Reker / <strong>Personality</strong> <strong>and</strong> <strong>Individual</strong> <strong>Differences</strong> 38 (2005) 71–85 73<br />
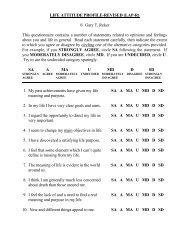
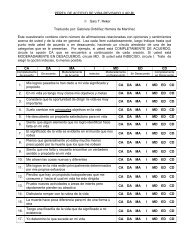
The Personal Meaning Index (PMI) is a 16-item, 7-point Likert scale (strongly agree...strongly<br />
disagree) derived by summing the Purpose <strong>and</strong> Coherence dimensions of the 48-item multidimensional<br />
Life Attitude Profile-Revised (LAP-R: Reker, 1992). Scores can range from 16 to 112.<br />
A high score reflects a strong sense of having achieved life goals, having a mission in life, having a
74 G.T. Reker / <strong>Personality</strong> <strong>and</strong> <strong>Individual</strong> <strong>Differences</strong> 38 (2005) 71–85<br />
sense of direction, having a sense of order <strong>and</strong> reason for existence, <strong>and</strong> having a logically integrated<br />
<strong>and</strong> consistent underst<strong>and</strong>ing of self, others, <strong>and</strong> life in general. Example items include, ‘‘I<br />
have a mission in life that gives me a sense of direction’’; ‘‘My personal existence is orderly <strong>and</strong><br />
coherent’’. The internal consistency <strong>and</strong> 4–6 week temporal stability coefficients for the PMI are<br />
0.91 <strong>and</strong> 0.90, respectively (Reker, 1992). Regarding validity, the PMI shares significant variance<br />
with a number of identical measures including the Purpose in Life test (PIL: Crumbaugh &<br />
Maholick, 1969); the Life Regard Index (LRI: Battista & Almond, 1973), <strong>and</strong> the Sense of<br />
Coherence scale (SOC: Antonovsky, 1987). The PMI also correlates significantly with a number of<br />
related variables including psychological <strong>and</strong> physical well-being, physical health, ego integrity,<br />
internal locus of control, life satisfaction, self-transcendent values, <strong>and</strong> the absence of feelings of<br />
depression <strong>and</strong> alienation (Reker, 1992). For the current combined sample, the alpha coefficient<br />
was found to be 0.91.<br />
2.3. Statistical analysis<br />
Tests for factorial validity, age, <strong>and</strong> gender invariance of PMI items were based on the analyses<br />
of covariance structures, using maximum likelihood estimation procedures. Analyses were conducted<br />
in four stages. In the first stage, six first-order CFA models were estimated separately for<br />
young, middle-aged, <strong>and</strong> older adult males <strong>and</strong> females using EQS methodology (Bentler, 1995).<br />
This procedure serves to confirm the underlying factor structure of the PMI items for each<br />
comparison group <strong>and</strong> fulfils the requirements to testing for factorial invariance (Byrne, 1994).<br />
Since a test of multivariate normality revealed violations of distributional assumptions, model fit<br />
was based on the following fit indices: the Satorra–Bentler scaled chi-square statistic (S–Bv 2 ), the<br />
robust comparative fit index (R-CFI), the comparative fit index (CFI), <strong>and</strong> the root mean square<br />
error of approximation (RMSEA). According to Satorra <strong>and</strong> Bentler (1994), the S–Bv 2 scaled<br />
statistic <strong>and</strong> the R-CFI offer a reliable <strong>and</strong> valid scaling correction for nonnormality. Hu, Bentler,<br />
<strong>and</strong> Kano (1992) provide strong evidence to substantiate the latter. However, given that the R-<br />
CFI is a relatively uncommon index, the st<strong>and</strong>ard CFI will also be reported. Also, given the<br />
exploratory nature of the study, the following conservative recommended minimum criteria were<br />
used to determine acceptable fit of the models to the data: R-CFI > 0.85, CFI > 0.85,<br />
RMSEA < 0.10 (Bentler, 1992). Finally, to achieve well-fitting models, the hypothesized model for<br />
each comparison group was modified by relaxing significant error covariances identified by the<br />
Lagrange Multiplier (LM) chi-square statistic. Such modifications are justified because they<br />
represent nonr<strong>and</strong>om measurement error due to method effects such as item format (Byrne, 1994).<br />
The second stage tested for factorial invariance across young, middle-aged, <strong>and</strong> older adults<br />
<strong>and</strong> across males <strong>and</strong> females. Age invariance was tested separately for males <strong>and</strong> females across<br />
three sets of contrasting age groups: young versus elderly; young versus middle-aged, <strong>and</strong> middleaged<br />
versus elderly. For each contrast, two well-fitting final models were estimated simultaneously<br />
<strong>and</strong> all estimable first-order factor parameters were constrained equal. Gender invariance was<br />
tested separately for each age group: young males versus young females; middle-aged males versus<br />
middle-aged females; <strong>and</strong> older males versus older females. Statistical assessment of age <strong>and</strong><br />
gender invariance was determined by the criteria of goodness-of-fit of the constrained model <strong>and</strong><br />
the probability of equality constraints ðp < 0:05Þ as indexed by the Lagrange Multiplier (LM) test.<br />
Since univariate tests of equality constraints tend to capitalize on chance factors, only items
significant at both the univariate <strong>and</strong> cumulative multivariate levels of analysis were deemed<br />
noninvariant. It should also be noted that the Satorra–Bentler scaled statistic <strong>and</strong> the robust<br />
comparative fit index are not available for multigroup analyses of invariance. Consequently,<br />
model fit for invariance was assessed using the chi-square statistic ðv 2 Þ <strong>and</strong> the comparative fit<br />
index (CFI > 0.85).<br />
In the third stage, the factor loadings, skewness, kurtosis, <strong>and</strong> frequency distributions of<br />
noninvariant PMI items, identified in prior age group <strong>and</strong> gender analyses, were examined in an<br />
effort to underst<strong>and</strong> the basis for their inequality.<br />
In the final stage, the invariant PMI items were summed to create a total personal meaning<br />
score. A two-way ANOVA was conducted to evaluate the presence of age <strong>and</strong> gender main effects<br />
<strong>and</strong> the interaction. For comparison purposes, a second two-way ANOVA was conducted on the<br />
original PMI that included both invariant <strong>and</strong> noninvariant items.<br />
3. Results<br />
3.1. Stage 1: Factorial validity of the PMI<br />
Fit statistics related to the structure of the PMI for age groups <strong>and</strong> gender are presented in<br />
Table 1. As can be seen, all hypothesized models either met or were very close to the minimum fit<br />
criteria, thus yielding a satisfactory fit to the data. Modification indexes identified up to five error<br />
covariances. Significant improvements in model fit, as evidenced by decreases in S–Bv 2 <strong>and</strong> increases<br />
in R-CFIs <strong>and</strong> CFIs (final models), were obtained when the error covariances were allowed<br />
to be freely estimated.<br />
The associated first-order factor loadings of the PMI items for age groups <strong>and</strong> gender are<br />
presented in Table 2. Item numbers refer to the original 48-item LAP-R from which the PMI items<br />
are derived. All parameter estimates are statistically significant ðp < 0:001Þ. Relative to all PMI<br />
items, only item 7 (‘‘The meaning of life is evident in the world around us’’.) exhibited weak, but<br />
acceptable, parameter estimates. The factor loadings for the young <strong>and</strong> middle-aged were generally<br />
similar in magnitude across gender. Of note is the finding that the factor loadings for older<br />
males were consistently stronger compared to older females <strong>and</strong> generally higher compared to<br />
both young <strong>and</strong> middle-aged males <strong>and</strong> females.<br />
3.2. Stage 2: Age <strong>and</strong> gender invariance of the PMI<br />
Testing for age <strong>and</strong> gender invariance was based on the final models (see Table 1). Analyses of<br />
age invariance for males revealed a good fit to the constrained models: young versus elderly,<br />
v2 ð313Þ ¼ 789:05; CFI ¼ 0.90; young versus middle-age, v2 ð313Þ ¼ 769:63; CFI ¼ 0.90; middle-age<br />
versus elderly, v2 ð313Þ ¼ 772:85; CFI ¼ 0.90. Nevertheless, four parameter constraints were found to<br />
be untenable for young versus older males; one was untenable for young versus middle-aged<br />
males. No item was untenable for the middle-aged versus older males. Analysis of age invariance<br />
for females also revealed a good fit to the constrained models: young versus elderly,<br />
v2 ð313Þ ¼ 1058:45; CFI ¼ 0.92; young versus middle-age, v2 ð313Þ ¼ 1046:72; CFI ¼ 0.92; middle-age<br />
¼ 1062:50; CFI ¼ 0.92. For this analysis, one parameter constraint was found<br />
versus elderly, v 2 ð313Þ<br />
G.T. Reker / <strong>Personality</strong> <strong>and</strong> <strong>Individual</strong> <strong>Differences</strong> 38 (2005) 71–85 75
76 G.T. Reker / <strong>Personality</strong> <strong>and</strong> <strong>Individual</strong> <strong>Differences</strong> 38 (2005) 71–85<br />
Table 1<br />
Fit Statistics for Models of the Structure of the PMI for Age Groups <strong>and</strong> Gender<br />
Model v2 S–Bv2 Young<br />
Male<br />
df R-CFI CFI RMSEA<br />
Hypothesized 394.39 300.90 104 0.85 0.83 0.10<br />
Final model (5 error covariances) 286.05 222.93 99 0.90 0.90 0.08<br />
Female<br />
Hypothesized 704.47 520.87 104 0.89 0.89 0.08<br />
Final model (5 error covariances) 489.52 364.82 99 0.93 0.93 0.07<br />
Middle-aged<br />
Male<br />
Hypothesized 280.35 205.82 104 0.86 0.83 0.11<br />
Final model (5 error covariances) 212.22 159.29 99 0.92 0.90 0.09<br />
Female<br />
Hypothesized 425.62 319.24 104 0.84 0.85 0.10<br />
Final model (5 error covariances) 306.55 231.88 99 0.90 0.90 0.08<br />
Elderly<br />
Male<br />
Hypothesized 332.79 182.31 104 0.94 0.89 0.11<br />
Final model (5 error covariances) 246.54 143.12 99 0.96 0.93 0.09<br />
Female<br />
Hypothesized 297.64 208.60 104 0.88 0.86 0.09<br />
Final model (4 error covariances) 233.81 167.29 100 0.92 0.90 0.07<br />
S–B ¼ Satorra–Bentler scaled statistic; R-CFI ¼ robust comparative fit index; CFI ¼ comparative fit index;<br />
RMSEA ¼ root mean square error of approximation.<br />
to be untenable for young versus older females; one was untenable for young versus middle-aged;<br />
<strong>and</strong> two were untenable for the middle-aged versus older females. The PMI items associated with<br />
these parameter constraints, the multivariate LMv2 statistic, <strong>and</strong> the probability values are presented<br />
in Table 3.<br />
Inspection of Table 3 shows that PMI items 2, 18, 35, <strong>and</strong> 31 were found to be noninvariant for<br />
the young versus elderly males. Item 31 showed the smallest discrepancy. A relatively large correlated<br />
error involving items 18 <strong>and</strong> 31 for young ðr ¼ 0:30Þ <strong>and</strong> middle-aged ðr ¼ 0:23Þ males may<br />
have contributed to this inequality. Item 35 is also noninvariant in the young versus middle-aged<br />
comparison. In sum, items 2, 18, <strong>and</strong> 35 appear to be the most discrepant across age for males. For<br />
females, PMI items 5, 18, <strong>and</strong> 27 were found to be noninvariant. Item 5 was noninvariant in the<br />
young versus elderly contrast; item 27 was noninvariant in the young versus middle-aged contrast;<br />
<strong>and</strong> items 18 <strong>and</strong> 27 were noninvariant in the middle-aged versus elderly comparison.<br />
Analyses of gender invariance in young, middle-aged, <strong>and</strong> older adults also revealed a good fit<br />
to the constrained models: young males versus young females, v2 ð213Þ ¼ 803:82; CFI ¼ 0.92; middleaged<br />
males versus middle-aged females, v2 ð213Þ ¼ 533:01; CFI ¼ 0.90; older males versus older fe-<br />
¼ 497:97; CFI ¼ 0.92. One parameter constraint involving item 2 (‘‘In my life I have<br />
males, v 2 ð214Þ
G.T. Reker / <strong>Personality</strong> <strong>and</strong> <strong>Individual</strong> <strong>Differences</strong> 38 (2005) 71–85 77<br />
Table 2<br />
First-order Factor Loadings of the PMI for Age Groups <strong>and</strong> Gender<br />
Item Young Middle-aged Elderly<br />
Male Female Male Female Male Female<br />
PMI 1 0.44 0.45 0.47 0.45 0.67 0.56<br />
PMI 2 0.71 0.64 0.70 0.67 0.74 0.66<br />
PMI 5 0.69 0.77 0.68 0.75 0.81 0.69<br />
PMI 7 0.32 0.47 0.38 0.37 0.54 0.39<br />
PMI 12 0.61 0.59 0.55 0.55 0.66 0.57<br />
PMI 16 0.60 0.58 0.62 0.63 0.77 0.67<br />
PMI 18 0.46 0.56 0.57 0.62 0.74 0.50<br />
PMI 26 0.67 0.66 0.71 0.68 0.65 0.49<br />
PMI 27 0.73 0.69 0.69 0.61 0.79 0.74<br />
PMI 29 0.71 0.70 0.74 0.72 0.84 0.70<br />
PMI 31 0.49 0.57 0.65 0.56 0.76 0.56<br />
PMI 35 0.48 0.55 0.69 0.63 0.74 0.56<br />
PMI 37 0.79 0.75 0.74 0.77 0.77 0.74<br />
PMI 38 0.58 0.61 0.64 0.59 0.67 0.60<br />
PMI 46 0.54 0.50 0.64 0.49 0.70 0.50<br />
PMI 48 0.53 0.59 0.60 0.58 0.79 0.55<br />
All factor loadings are statistically significant ðp < 0:001Þ.<br />
Table 3<br />
Summary Statistics for Noninvariance across Age for Males <strong>and</strong> Females<br />
Constrained parameter Multivariate LMv2 Males<br />
Young versus Elderly<br />
p<br />
2 In my life I have very clear goals <strong>and</strong> aims 7.32 0.007<br />
18 Basically, I am living the kind of life I want to live 7.11 0.008<br />
35 I have a sense that parts of my life fit together into a unified<br />
pattern<br />
6.35 0.012<br />
31 In achieving life’s goals, I have felt completely fulfilled 4.68 0.030<br />
Young versus Middle-aged<br />
35 I have a sense that parts of my life fit together into a unified<br />
pattern<br />
10.77 0.001<br />
Females<br />
Young versus Elderly<br />
5 I have discovered a satisfying life purpose 8.56 0.003<br />
Young versus Middle-aged<br />
27 In thinking of my life, I see a reason for my being here 6.64 0.010<br />
Middle-aged versus Elderly<br />
18 Basically, I am living the kind of life I want to live 8.07 0.004<br />
27 In thinking of my life, I see a reason for my being here 7.27 0.007
78 G.T. Reker / <strong>Personality</strong> <strong>and</strong> <strong>Individual</strong> <strong>Differences</strong> 38 (2005) 71–85<br />
very clear goals <strong>and</strong> aims’’) was found to be untenable in the young male versus female comparison<br />
(LMv 2 ¼ 7.04, p ¼ 0:008); item 18 (‘‘Basically, I am living the kind of life I want to live’’)<br />
was found untenable in the elderly male versus female comparison (LMv 2 ¼ 7.00, p ¼ 0:008). No<br />
item was found to be untenable in the middle-aged. Of note is the finding that items 2 <strong>and</strong> 18 were<br />
previously shown to be noninvariant across age as well.<br />
3.3. Stage 3: Analyses of item characteristics for noninvariant PMI items<br />
Invariance testing revealed that several PMI items were differentially valid across age groups<br />
<strong>and</strong> gender. Why should this be the case? To answer this question it is informative to compare the<br />
factor loading (size reflects item salience), skewness, kurtosis, <strong>and</strong> frequency distribution of the<br />
noninvariant items across the relevant age <strong>and</strong> gender constrasts.<br />
3.3.1. Noninvariant PMI items across age<br />
The item statistics across age groups for males <strong>and</strong> females are presented in Table 4. For males,<br />
items 2, 18, 35, <strong>and</strong> 31 are relevant to the young versus elderly contrast. Item 2, ‘‘In my life I have<br />
very clear goals <strong>and</strong> aims’’, appears to have similar salience for both the young <strong>and</strong> elderly (0.71<br />
versus 0.74). More elderly than the young (7.2%) agree (response option ‘6’), while more of the<br />
young (9.3%) moderately <strong>and</strong> strongly disagree (options ‘3’ <strong>and</strong> ‘1’). Item 18, ‘‘Basically, I am<br />
living the kind of life I want to live’’, is more salient for the elderly (0.74 versus 0.46). More elderly<br />
(18.6%) agree <strong>and</strong> strongly agree (options ‘6’ <strong>and</strong> ‘7’), but also disagree <strong>and</strong> strongly disagree<br />
(6.4%, options ‘2’ <strong>and</strong> ‘1’). Item 35, ‘‘I have a sense that parts of my life fit together into a unified<br />
pattern’’ is more salient for the elderly compared to the young (0.74 versus 0.48). More elderly<br />
(14.3%) agree <strong>and</strong> strongly agree (options ‘6’ <strong>and</strong> ‘7’), while more young adults (9.0%) are<br />
undecided <strong>and</strong> moderately disagree (options ‘4’ <strong>and</strong> ‘3’). Item 35 is also noninvariant for young<br />
versus middle-aged. Inspection of Table 4 shows that item 35 is more salient for the middle-aged<br />
(0.69 versus 0.48), <strong>and</strong> more young compared to elderly males (11.7%) select the undecided (‘4’)<br />
category. Finally, item 31, ‘‘In achieving life’s goals, I have felt completely fulfilled’’, is more<br />
salient for the elderly (0.75 versus 0.53). More elderly males (37.2%) agree <strong>and</strong> strongly agree<br />
(options ‘6’ <strong>and</strong> ‘7’), while more younger males remain undecided or moderately disagree (37.5%).<br />
For females, items 5, 18, <strong>and</strong> 27 were found to be noninvariant across age. Item 5, ‘‘I have<br />
discovered a satisfying life purpose’’, was noninvariant in the young versus the elderly contrast.<br />
Inspection of Table 4 shows that item 5 is slightly more salient for the young (0.77 versus 0.69).<br />
More younger females (8.2%) chose the undecided (‘4’) category, while more older females<br />
(19.4%) agree <strong>and</strong> strongly agree (options ‘6’ <strong>and</strong> ‘7’) with the item. The main discrepancy,<br />
however, can be seen in the much larger kurtotic value for the elderly compared to the young (2.05<br />
versus 0.01). Item 18, ‘‘Basically, I am living the kind of life I want to live’’, was noninvariant in<br />
the middle-aged versus elderly contrast. The item is more salient for the middle-aged (0.62 versus<br />
0.50). Interestingly, more middle-aged females (13.8%) both moderately disagree <strong>and</strong> moderately<br />
agree (options ‘3’ <strong>and</strong> ‘5’) with the item, while more elderly females (15.9%) agree <strong>and</strong> strongly<br />
agree (options ‘6’ <strong>and</strong> ‘7’). Again, kurtosis is much larger in the elderly compared to the middleaged<br />
(2.76 versus 0.99). Item 27, ‘‘In thinking of my life, I see a reason for my being here’’, was<br />
noninvariant in both the young versus middle-aged <strong>and</strong> the middle-aged versus elderly contrasts.<br />
In the young versus middle-aged comparison, item 27 is more salient for the young (0.69 versus
Table 4<br />
Item Statistics for Noninvariant PMI Items across Age for Males <strong>and</strong> Females<br />
Item Factor<br />
loading a<br />
Males<br />
2 In my life I have<br />
very clear goals<br />
<strong>and</strong> aims<br />
18 Basically, I am<br />
living the kind of<br />
life I want to live<br />
35 I have a sense that<br />
parts of my life fit<br />
together into a<br />
unified pattern<br />
31 In achieving life’s<br />
goals, I have felt<br />
completely fulfilled<br />
Females<br />
5 I have discovered a<br />
satisfying life<br />
purpose<br />
18 Basically, I am<br />
living the kind of<br />
life I want to live<br />
27 In thinking of my<br />
life, I see a reason<br />
for my being here<br />
a St<strong>and</strong>ardized parameter estimate.<br />
b SK ¼ skewness, KU ¼ kurtosis.<br />
c Expressed in percentages.<br />
G.T. Reker / <strong>Personality</strong> <strong>and</strong> <strong>Individual</strong> <strong>Differences</strong> 38 (2005) 71–85 79<br />
Sampling<br />
distributionb Frequency distributionc SK KU 1 2 3 4 5 6 7<br />
Young 0.71 )0.80 )0.27 4.3 6.1 10.4 7.5 22.9 26.8 22.1<br />
Elderly 0.74 )1.00 0.28 1.1 9.6 4.3 5.9 22.7 34.0 17.5<br />
Young 0.46 )1.00 0.39 1.1 6.4 7.9 5.4 28.2 36.8 14.3<br />
Elderly 0.74 )1.36 0.69 2.7 11.2 2.1 3.2 11.2 51.6 18.1<br />
Young 0.48 )0.81 0.51 2.1 2.9 8.6 16.4 30.0 31.8 8.2<br />
Middle 0.69 )0.96 0.08 2.7 6.8 10.8 4.7 27.7 37.8 9.5<br />
Elderly 0.74 )1.04 0.37 2.1 7.5 4.8 11.2 20.2 41.0 13.3<br />
Young 0.53 )0.13 )0.79 4.3 12.5 21.1 16.4 27.9 13.6 4.3<br />
Elderly 0.75 )0.59 )0.91 4.8 15.9 9.6 3.2 29.3 29.3 7.9<br />
Young 0.77 )0.76 0.01 1.4 5.4 8.5 13.6 25.1 33.1 12.8<br />
Elderly 0.69 )1.38 2.05 1.2 2.9 3.7 5.4 21.5 40.1 25.2<br />
Middle 0.62 )1.20 0.99 1.8 5.1 7.8 3.0 29.2 40.6 12.5<br />
Elderly 0.50 )1.67 2.76 0.4 5.4 2.9 2.1 20.2 53.7 15.3<br />
Young 0.69 )1.21 1.36 0.8 3.1 5.2 7.0 21.7 42.3 19.9<br />
Middle 0.61 )1.54 3.09 0.9 1.8 3.3 4.2 19.7 46.8 23.6<br />
Elderly 0.74 )1.51 2.26 1.2 4.1 3.3 6.2 19.8 50.4 14.9<br />
0.61); more middle-aged females (8.2%) agree <strong>and</strong> strongly agree (options ‘6’ <strong>and</strong> ‘7’). Regarding<br />
the middle-aged versus elderly contrast, item 27 is more salient in elderly females (0.74 versus<br />
0.61); more elderly compared to middle-aged females (5.9%) seem to both agree <strong>and</strong> disagree<br />
(options ‘6’ <strong>and</strong> ‘2’) with the item. In comparison to the young, the kurtotic values are generally<br />
much higher in middle-aged <strong>and</strong> elderly females (1.36 versus 3.09 <strong>and</strong> 2.26, respectively).<br />
3.3.2. Noninvariant PMI items across gender<br />
The noninvariant item statistics across gender for the young <strong>and</strong> the elderly are presented in<br />
Table 5. Item 2, ‘‘In my life I have very clear goals <strong>and</strong> aims’’, is more salient for young males<br />
compared to young females (0.71 versus 0.64). More males (4.3%) are undecided (option ‘4’) <strong>and</strong><br />
select the disagree end (13.3%) of the response options (‘1’, ‘2’, <strong>and</strong> ‘3’), whereas more females
80 G.T. Reker / <strong>Personality</strong> <strong>and</strong> <strong>Individual</strong> <strong>Differences</strong> 38 (2005) 71–85<br />
Table 5<br />
Item Statistics for Noninvariant PMI Items across Gender for Young <strong>and</strong> Older Adults<br />
Item Factor<br />
loading a<br />
Young<br />
2 In my life I have<br />
very clear goals<br />
<strong>and</strong> aims<br />
Elderly<br />
18 Basically, I am<br />
living the kind of<br />
life I want to live<br />
a St<strong>and</strong>ardized parameter estimate.<br />
b SK ¼ skewness, KU ¼ kurtosis.<br />
c Expressed in percentages.<br />
(14.5%) agree <strong>and</strong> strongly agree (options ‘6’ <strong>and</strong> ‘7’). Item 18, ‘‘Basically, I am living the kind of<br />
life I want to live’’, is more salient for older males compared to older females (0.74 versus 0.50).<br />
More older males (8.1%) disagree <strong>and</strong> strongly disagree (options ‘2’ <strong>and</strong> ‘1’), while more older<br />
females (9.0%) moderately agree (‘5’) with the item. Finally, all items were found to be gender<br />
invariant for the middle-aged.<br />
In summary, invariance testing <strong>and</strong> analyses of item characteristics identified items 2, 5, 18, 27,<br />
31, <strong>and</strong> 35 to be nonequivalent across age groups <strong>and</strong> gender. Of these items 2, 18, 27, <strong>and</strong> 35<br />
appear to be the most problematic in that they share noninvariance across more than one comparison<br />
group, while items 5 <strong>and</strong> 31 are unique to only one age contrast. Consequently, the four<br />
problematic items were removed to create a modified PMI-12 that is age <strong>and</strong> gender invariant.<br />
With nonequivalence controlled, it is now possible to test for age <strong>and</strong> gender differences <strong>and</strong> to<br />
compare the results with scores based on the original 16-item PMI.<br />
3.4. Stage 4: Age <strong>and</strong> gender differences<br />
Sampling distributionb<br />
Frequency distributionc SK KU 1 2 3 4 5 6 7<br />
Male 0.71 )0.80 )0.27 4.3 6.1 10.4 7.5 22.9 26.8 22.1<br />
Female 0.64 )1.29 1.48 0.8 4.1 4.6 3.2 23.8 35.0 28.4<br />
Male 0.74 )1.36 0.69 2.7 11.2 2.1 3.2 11.2 51.6 18.1<br />
Female 0.50 )1.67 2.76 0.4 5.4 2.9 2.1 20.2 53.7 15.3<br />
The PMI-12 total score means <strong>and</strong> st<strong>and</strong>ard deviations for age groups <strong>and</strong> gender are presented<br />
in Table 6. Statistically significant main effects were found for age (F ð2; 2059Þ ¼16:79,<br />
p < 0:0000), gender (F ð1; 2059Þ ¼14:95, p < 0:0001), <strong>and</strong> the age by gender interaction<br />
(F ð2; 2059Þ ¼3:08, p < 0:05).<br />
Inspection of the means in Table 6 reveals that personal meaning increases with age <strong>and</strong> that<br />
females experience higher levels of personal meaning compared to males. This finding, however,<br />
must be qualified by the significant interaction effect. Inspection of the means in Table 6 shows<br />
that only young <strong>and</strong> middle-aged females experience higher levels of personal meaning compared<br />
to young <strong>and</strong> middle-aged males. Older males <strong>and</strong> females express almost identical levels of<br />
personal meaning, largely due to a sharp <strong>and</strong> significant increase in meaning in elderly males.<br />
When the analysis was repeated for the original 16-item PMI, the significant main effects for age<br />
<strong>and</strong> gender remained but the age by gender interaction disappeared.
Table 6<br />
Means <strong>and</strong> St<strong>and</strong>ard Deviations of the PMI-12 as a Function of Age Group <strong>and</strong> Gender<br />
Gender Age Group<br />
Young Middle-aged Elderly Combined<br />
Mean SD N Mean SD N Mean SD N Mean SD N<br />
Males 55.1 12.0 280 56.3 12.3 148 60.4 14.5 188 57.3 13.1 616<br />
Females 58.0 11.0 872 60.3 10.8 335 60.6 11.2 242 59.6 11.0 1449<br />
Combined 56.5 11.3 1152 58.3 11.5 483 60.5 12.8 430 58.4 11.7 2065<br />
4. Discussion<br />
G.T. Reker / <strong>Personality</strong> <strong>and</strong> <strong>Individual</strong> <strong>Differences</strong> 38 (2005) 71–85 81<br />
The main aim of this study was to examine the factorial validity <strong>and</strong> factorial invariance of the<br />
16-item PMI across young, middle-aged, <strong>and</strong> older adults <strong>and</strong> males <strong>and</strong> females. It was expected<br />
that a one-factor congeneric measurement model would best characterize the underlying structure<br />
of the PMI in each group. It was also expected that the factor structure would remain age <strong>and</strong><br />
gender invariant.<br />
Regarding factorial validity, the results clearly support the hypothesized factor structure for<br />
each age group <strong>and</strong> gender. The overall findings are consistent with previous exploratory <strong>and</strong><br />
confirmatory factor analytic studies of the PMI (Reker, 1992; Reker & Fry, 2003). The assessment<br />
of factor structure in those prior studies was limited to extreme age group comparisons involving<br />
the young <strong>and</strong> the elderly. The present study extends previous findings by demonstrating that the<br />
structure of the PMI is replicable <strong>and</strong> generalizable to large samples of young, middle-aged, <strong>and</strong><br />
older adults as well as to males <strong>and</strong> females.<br />
The fact that the underlying factor structure is similar for each age group <strong>and</strong> gender offers no<br />
guarantee that the individual items will remain invariant across these groups. Indeed, this was not<br />
the case for six PMI items. Thus, the expectation that all PMI items would be fully age <strong>and</strong> gender<br />
invariant was only partially supported.<br />
In attempting to explain the noninvariance for the most discrepant PMI items across age<br />
groups <strong>and</strong> gender, it is useful to interpret the findings within a developmental framework. Item 2,<br />
‘‘In my life I have very clear goals <strong>and</strong> aims’’, was found to be noninvariant in the young versus<br />
elderly male contrast. Analysis of this item, although equally salient to young <strong>and</strong> older adults,<br />
revealed that more of the young males do not see themselves as having very clear goals <strong>and</strong> aims.<br />
This was also clearly evident in the gender contrast for young adults with more than one-quarter<br />
of the males indicating that they did not have very clear goals <strong>and</strong> aims. Likewise, the endorsement<br />
pattern for item 31, ‘‘In achieving life’s goals, I have felt completely fulfilled’’, was similar to<br />
that of item 2 in that more elderly males agree <strong>and</strong> strongly agree, while more younger males<br />
remain undecided or moderately disagree. Arnett’s (2000) developmental stage of emerging<br />
adulthood, characterized by a transition period between adolescents <strong>and</strong> young adults (18–25<br />
years), might offer an explanation for the differential validity of these items. During this stage<br />
individuals explore a broad range of life experiences, begin to make enduring personal decisions,<br />
<strong>and</strong> strive to find a personal niche in society. Life for the emerging adult male may thus be more<br />
variegated, less directed toward a specific purpose, <strong>and</strong> more open to alternative courses of action.<br />
Consequently, goal strivings are in flux <strong>and</strong> remain unfulfilled. The question remains as to why
82 G.T. Reker / <strong>Personality</strong> <strong>and</strong> <strong>Individual</strong> <strong>Differences</strong> 38 (2005) 71–85<br />
item 2 is noninvariant across males <strong>and</strong> females. Marcia (1993) suggests that differences may exist<br />
in how men <strong>and</strong> women develop a sense of identity during emerging adulthood. The goals <strong>and</strong><br />
aims of young males tend to be actualized through ideological domains (e.g., religious, political,<br />
occupational), while the goals <strong>and</strong> aims of young females are more directed toward interpersonal<br />
domains (e.g., friendship, dating, family). Goal clarity may be more readily achievable through<br />
tangible interpersonal encounters as opposed to less tangible ideological pursuits.<br />
Item 5, ‘‘I have discovered a satisfying life purpose’’, was found to be noninvariant across age<br />
for the young versus elderly female comparison. More of the young females either don’t know or<br />
indicate that they have not yet discovered a satisfying life purpose, while a clear majority of elderly<br />
females indicate that they have. Frankl (1963) postulated that meaning in life must be<br />
discovered which implies that life experiences <strong>and</strong> the passage of time should provide the context<br />
for the discovery of a satisfying life purpose. In support of Frankl’s (1963) view, Reker et al.<br />
(1987) found a significant linear increase in life purpose, particularly in females, across five<br />
developmental stages from young adulthood to the old–old. Alternatively, the extreme positive<br />
endorsement of this item by elderly females (elevated kurtosis) may reflect a tendency to respond<br />
in a socially desirable manner. In support of such a possibility, Reker et al. (1987) found that<br />
females compared to males scored higher on a related measure of having a sense of control <strong>and</strong><br />
being responsible for one’s life which, in turn, was significantly correlated with a measure of social<br />
desirability.<br />
Item 18, ‘‘Basically, I am living the kind of life I want to live’’, was found to be noninvariant<br />
across age for both males <strong>and</strong> females. It was of much greater concern for elderly males compared<br />
to young males. While the majority of elderly males indicated that they were living the kind of life<br />
they wished to live, a significant percentage indicated that they did not. A similar pattern of response<br />
was also evident for females but this time the comparison was across the middle-aged <strong>and</strong><br />
the elderly. In the gender contrast involving the elderly, more elderly males seemed not to be living<br />
the kind of life they wished to live, while more elderly females showed the reverse pattern. Item 18<br />
is very much anchored to the present situation. Differential item validity may be reflected in what<br />
is currently happening in the lives of the different age cohorts. Some of the middle-aged females<br />
tended to be more ambivalent in their response perhaps reflecting the added stresses <strong>and</strong> strains of<br />
motherhood, familial obligations, <strong>and</strong>/or balancing of work in the home with work outside the<br />
home. Some of the older adults, particularly the males, may be responding to personal (e.g.,<br />
retirement), physical (e.g., acute health problems), or social (e.g., reduced social network) changes<br />
that are disrupting their lives, while the lives of the young <strong>and</strong> middle-aged adults remain relatively<br />
unchanged. This ‘‘here <strong>and</strong> now’’ temporal explanation for noninvariance is supported by<br />
Reker <strong>and</strong> Fry’s (2003) finding that the Self Transcendence Scale (Reed, 1991), a measure of<br />
personal meaning assessed by concrete events at the present time, showed the most serious<br />
departure from age invariance when compared to more abstract measures of personal meaning.<br />
Item 35, ‘‘I have a sense that parts of my life fit together into a unified pattern’’, was of much<br />
greater concern for the middle-aged <strong>and</strong> elderly compared to the young adult males. In both<br />
comparisons, it was clear that more of the young were undecided, while more middle-aged <strong>and</strong><br />
elderly indicated that their lives were organized <strong>and</strong> integrated. Young adults are confronted by a<br />
variety of life experiences with little time <strong>and</strong> opportunity to consolidate their position in life. By<br />
midlife, the issues of young adulthood seem to be resolved in favor of a more unified perspective<br />
on life. In support of this line of reasoning, Dittmann-Kohli <strong>and</strong> Westerhof (2000) provide
G.T. Reker / <strong>Personality</strong> <strong>and</strong> <strong>Individual</strong> <strong>Differences</strong> 38 (2005) 71–85 83<br />
empirical evidence that a person’s meaning system becomes more integrated <strong>and</strong> consolidated<br />
with increasing age.<br />
Item 27, ‘‘In thinking of my life, I see a reason for my being here’’, was found to be noninvariant<br />
in both the young versus the elderly <strong>and</strong> middle-aged versus the elderly females. The<br />
source of noninvariance, however, cannot be readily explained within a developmental framework.<br />
Given the relatively similar pattern of responses by middle-aged <strong>and</strong> elderly females to item<br />
27, it is likely that the findings of noninvariance are due to significant differences in kurtosis. As<br />
with item 5, the clustering of scores at the positive end of the scale might reflect the operation of a<br />
particular type of response set (e.g., acquiescence) or response style (socially desirable responding).<br />
In the original st<strong>and</strong>ardization sample (Reker, 1992), item 27 correlated significantly with a<br />
measure of social desirability ðr ¼ 0:40Þ. However, the invocation of response bias, as a methodological<br />
explanation for noninvariance, remains speculative <strong>and</strong> will need to be examined in<br />
future work with the PMI.<br />
What then are the practical implications for the use of the PMI in multigroup comparisons?<br />
Generally, the results indicate that a small number of PMI items are more sensitive to a lack of<br />
invariance across age groups than across gender. Furthermore, two PMI items found to be<br />
noninvariant across gender are also noninvariant across age. It follows that one practical solution<br />
to both age <strong>and</strong> gender invariance concerns is to remove the noninvariant items from the PMI.<br />
The immediate consequence of such a strategy is a less reliable scale. However, when these items<br />
are removed, the alpha coefficient for the current sample drops marginally to 0.88, down from<br />
0.91. Furthermore, alpha coefficients remain at or above 0.86 in all six age groups by gender<br />
combinations. On the other h<strong>and</strong>, it must be recognized that this is the first study to be conducted<br />
at the individual item level. It is possible that the differential validity across age <strong>and</strong> gender for<br />
some PMI items is due to sampling variability. It may be prudent to await the results of future<br />
studies on similar populations before firm conclusions can be reached. In the meantime, however,<br />
it is recommended that researchers, practitioners, <strong>and</strong> others wishing to conduct multigroup<br />
comparisons of personal meaning use the modified 12 item PMI.<br />
When the modified 12 item PMI is used in multigroup analysis, both age <strong>and</strong> gender differences<br />
emerged. The increase in personal meaning with age <strong>and</strong> the finding that females, in general,<br />
report experiencing higher levels of personal meaning is consistent with the results of previous<br />
studies (Fry, 2001; Reker, 1992; Reker et al., 1987; V<strong>and</strong>eCreek, 1991). Gender differences in the<br />
sample of older adults, however, were not found in this analysis. Interestingly, it is the males who<br />
contribute significantly to achieving a gender balance in personal meaning in older adults. It is<br />
important to note that when the original 16 item PMI is used as the dependent variable, the age by<br />
gender interaction is no longer significant, providing support for the argument that the use of a<br />
measure containing noninvariant items can lead to different interpretations of mean differences in<br />
multigroup comparisons.<br />
This study has a number of strengths <strong>and</strong> weaknesses. First, unlike previous investigations, age<br />
invariance testing was not limited to extreme age groups but also included middle-aged adults<br />
drawn from the general population. This allowed for a finer distinction <strong>and</strong> more exact pinpointing<br />
of where the source of any noninvariance on the PMI might be embedded. Second, given<br />
the relatively large sample sizes, it was possible to test for age invariance independent of gender<br />
<strong>and</strong> to test for gender invariance independent of age. Third, the current study examined the item<br />
characteristics of the PMI using a statistical methodology often associated with classical test
84 G.T. Reker / <strong>Personality</strong> <strong>and</strong> <strong>Individual</strong> <strong>Differences</strong> 38 (2005) 71–85<br />
theory. A future study might consider an item response theory analysis of the PMI (see for<br />
example, Gray-Little, Williams, & Hancock, 1997) that could add unique information <strong>and</strong> provide<br />
a more complete underst<strong>and</strong>ing of differential item functioning. Finally, while age <strong>and</strong> gender<br />
invariance of the PMI was tested in a cross-sectional analysis, the study design did not allow for<br />
testing the structural invariance across time. When invariance is demonstrated over time, any<br />
observed changes on individual PMI items can be attributed to real changes, not to item instability.<br />
Future studies should track changes on PMI items for the same age groups at different<br />
points in time.<br />
In summary, the findings of the present investigation offer some insights into how well individual<br />
PMI items operate to measure the construct of personal meaning. Consistent with prior<br />
research, the factorial structure of the PMI is unidimensional, replicable, <strong>and</strong> generalizable to<br />
three different age groups <strong>and</strong> to males <strong>and</strong> females. Nonetheless, age <strong>and</strong> gender differences exist<br />
in the functioning of some PMI items, suggesting that either the items are given differential<br />
interpretations or are differentially endorsed by the comparison groups. Developmental <strong>and</strong><br />
methodological explanations were offered to account for these inequalities, with the recommendation<br />
that, in the short term, the PMI be modified by removing the noninvariant items. It was<br />
clearly demonstrated that such modifications have the potential to minimize misinterpretations of<br />
mean differences. Finally, it is gratifying to learn that current <strong>and</strong> past research continues to<br />
support the utility of the PMI as a reliable <strong>and</strong> valid operational measure of the construct of<br />
personal meaning.<br />
References<br />
Antonovsky, A. (1987). Unravelling the mystery of health. San Francisco: Jossey-Bass.<br />
Arnett, J. J. (2000). Emerging adulthood: A theory of development from the late teens through the twenties. American<br />
Psychologist, 55, 469–480.<br />
Battista, J., & Almond, R. (1973). The development of meaning in life. Psychiatry, 36, 409–427.<br />
Bearsley, C., & Cummins, R. A. (1999). No place called home: Life quality <strong>and</strong> purpose of homeless youths. Journal of<br />
Social Distress <strong>and</strong> the Homeless, 8, 207–226.<br />
Bentler, P. M. (1992). On the fit of models to covariances <strong>and</strong> methodology to the Bulletin. Psychological Bulletin, 112,<br />
400–404.<br />
Bentler, P. M. (1995). EQS structural equations program manual. Encino, CA: Multivariate Software, Inc.<br />
Byrne, B. M. (1994). Structural equation modeling with EQS <strong>and</strong> EQS/windows. Thous<strong>and</strong> Oaks: Sage Publications.<br />
Chamberlain, K., & Zika, S. (1988). Measuring meaning in life: An examination of three scales. <strong>Personality</strong> <strong>and</strong><br />
<strong>Individual</strong> <strong>Differences</strong>, 9, 589–596.<br />
Crumbaugh, J. C., & Maholick, L. T. (1969). Manual of instruction for the purpose in life test. Munster, IN:<br />
Psychometric Affiliate.<br />
Debats, D. L., van der Lubbe, P. M., & Wezeman, F. R. A. (1993). On the psychometric properties of the life regard<br />
index (LRI): A measure of meaningful life. An evaluation in three independent samples based on the Dutch version.<br />
<strong>Personality</strong> <strong>and</strong> <strong>Individual</strong> <strong>Differences</strong>, 14, 337–345.<br />
Dittmann-Kohli, F., & Westerhof, G. J. (2000). The personal meaning system in a life-span perspective. In G. T. Reker<br />
& K. Chamberlain (Eds.), Exploring existential meaning: Optimizing human development across the life span (pp. 107–<br />
122). Thous<strong>and</strong> Oaks, CA: Sage Publications.<br />
Frankl, V. E. (1963). Man’s search for meaning. New York: Pocket Books.<br />
Fry, P. S. (2000). Religious involvement, spirituality, <strong>and</strong> personal meaning for life: Existential predictors of<br />
psychological well-being in community-residing <strong>and</strong> institutional care elders. Aging <strong>and</strong> Mental Health, 4, 375–387.
G.T. Reker / <strong>Personality</strong> <strong>and</strong> <strong>Individual</strong> <strong>Differences</strong> 38 (2005) 71–85 85<br />
Fry, P. S. (2001). The unique contribution of key existential factors to the prediction of psychological well-being of<br />
older adults following spousal loss. The Gerontologist, 41, 1–13.<br />
Gray-Little, B., Williams, V. S. L., & Hancock, T. D. (1997). An item response theory analysis of the Rosenberg selfesteem<br />
scale. <strong>Personality</strong> <strong>and</strong> Social Psychology Bulletin, 23, 443–451.<br />
Harlow, L. L., Newcomb, M. D., & Bentler, P. M. (1986). Depression, self-derogation, substance use, <strong>and</strong> suicide<br />
ideation: Lack of purpose in life as a mediational factor. Journal of Clinical Psychology, 42, 5–21.<br />
Hu, L.-T., Bentler, P. M., & Kano, Y. (1992). Can test statistics in covariance structure analysis be trusted?<br />
Psychological Bulletin, 112, 351–362.<br />
Maddi, S. R. (1970). The search for meaning. In M. Page (Ed.), Nebraska symposium on motivation (Vol. 17, pp. 134–<br />
183). Lincoln, NB: University of Nebraska Press.<br />
Marcia, J. (1993). The status of statuses: Research review. In J. Marcia, A. Waterman, D. Matteson, S. Archer, & J.<br />
Orlofsky (Eds.), Ego identity: A h<strong>and</strong>book for psychological research (pp. 22–41). New York: Springer-Verlag.<br />
Reed, P. G. (1991). Self-transcendence <strong>and</strong> mental health in the oldest–old adults. Nursing Research, 40, 5–11.<br />
Reker, G. T. (1992). Manual of the Life Attitude Profile-Revised. Peterborough, ON: Student Psychologists Press.<br />
Reker, G. T. (2000). Theoretical perspectives, dimensions, <strong>and</strong> measurement of existential meaning. In G. T. Reker &<br />
K. Chamberlain (Eds.), Exploring existential meaning: Optimizing human development across the life span (pp. 107–<br />
122). Thous<strong>and</strong> Oaks, CA: Sage Publications.<br />
Reker, G. T.& Chamberlain, K. (Eds.). (2000). Exploring existential meaning: Optimizing human development across the<br />
life span. Thous<strong>and</strong> Oaks, CA: Sage Publications.<br />
Reker, G. T., & Fry, P. S. (2003). Factor structure <strong>and</strong> invariance of personal meaning measures in cohorts of younger<br />
<strong>and</strong> older adults. <strong>Personality</strong> <strong>and</strong> <strong>Individual</strong> <strong>Differences</strong>, 35, 977–993.<br />
Reker, G. T., Peacock, E. J., & Wong, P. T. P. (1987). Meaning <strong>and</strong> purpose in life <strong>and</strong> well-being: A life-span<br />
perspective. Journal of Gerontology, 42, 44–49.<br />
Reker, G. T., & Wong, P. T. P. (1988). Aging as an individual process: Toward a theory of personal meaning. In J. E.<br />
Birren & V. L. Bengtson (Eds.), Emergent theories of aging (pp. 214–246). New York: Springer Publishing Company.<br />
Satorra, A., & Bentler, P. M. (1994). Corrections to test statistics <strong>and</strong> st<strong>and</strong>ard errors in covariance structure analysis.<br />
In A. von Eye & C. C. Clogg (Eds.), Latent variable analysis: Applications to developmental research (pp. 399–419).<br />
Newbury Park, CA: Sage.<br />
V<strong>and</strong>eCreek, L. (1991). Identifying the spiritually needy patient: The role of demographics. The Caregiver Journal, 8,<br />
38–47.<br />
Van Ranst, N., & Marcoen, A. (1997). Meaning in life of young <strong>and</strong> elderly adults: An examination of the factorial<br />
validity <strong>and</strong> invariance of the life regard index. <strong>Personality</strong> <strong>and</strong> <strong>Individual</strong> <strong>Differences</strong>, 22, 877–884.<br />
Zika, S., & Chamberlain, K. (1992). On the relation between meaning in life <strong>and</strong> psychological well-being. British<br />
Journal of Psychology, 83, 133–145.