Henkel Annual Report 2011 - Henkel AG & Co. KGaA Annual Report ...
Henkel Annual Report 2011 - Henkel AG & Co. KGaA Annual Report ...
Henkel Annual Report 2011 - Henkel AG & Co. KGaA Annual Report ...

You also want an ePaper? Increase the reach of your titles
YUMPU automatically turns print PDFs into web optimized ePapers that Google loves.
<strong>Henkel</strong> <strong>Annual</strong> <strong>Report</strong> <strong>2011</strong> Group management report<br />
Net assets and financial position<br />
61<br />
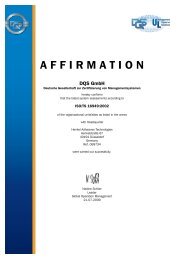
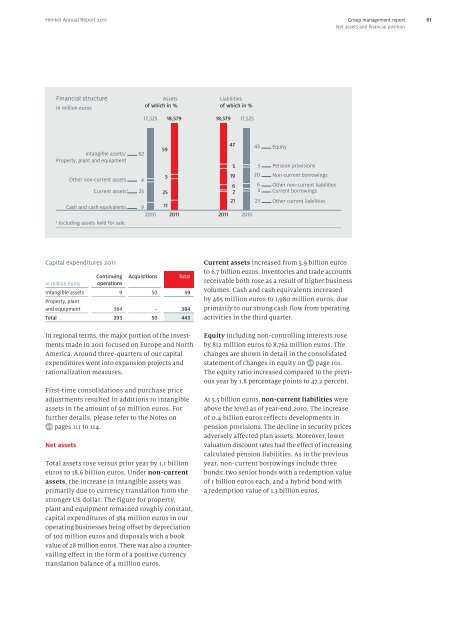
Financial structure<br />
in million euros<br />
Intangible assets/<br />
Property, plant and equipment<br />
Capital expenditures <strong>2011</strong><br />
<strong>Co</strong>ntinuing Acquisitions Total<br />
in million euros operations<br />
Intangible assets<br />
Property, plant<br />
9 50 59<br />
and equipment 384 – 384<br />
Total 393 50 443<br />
In regional terms, the major portion of the investments<br />
made in <strong>2011</strong> focused on Europe and North<br />
America. Around three-quarters of our capital<br />
expenditures went into expansion projects and<br />
rationalization measures.<br />
First-time consolidations and purchase price<br />
adjustments resulted in additions to intangible<br />
assets in the amount of 50 million euros. For<br />
further details, please refer to the Notes on<br />
pages 111 to 114.<br />
Net assets<br />
Other non-current assets<br />
Current assets 1<br />
Cash and cash equivalents<br />
1 Including assets held for sale.<br />
Assets<br />
of which in %<br />
17,525<br />
9<br />
2010<br />
18,579<br />
11<br />
<strong>2011</strong><br />
Total assets rose versus prior year by 1.1 billion<br />
euros to 18.6 billion euros. Under non-current<br />
assets, the increase in intangible assets was<br />
primarily due to currency translation from the<br />
stronger US dollar. The figure for property,<br />
plant and equipment remained roughly constant,<br />
capital expenditures of 384 million euros in our<br />
operating businesses being offset by depreciation<br />
of 302 million euros and disposals with a book<br />
value of 28 million euros. There was also a countervailing<br />
effect in the form of a positive currency<br />
translation balance of 4 million euros.<br />
62<br />
4<br />
59<br />
5<br />
25 25<br />
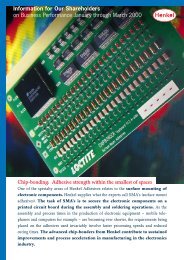
Liabilities<br />
of which in %<br />
18,579<br />
<strong>2011</strong><br />
47<br />
5<br />
19<br />
6<br />
2<br />
21<br />
17,525<br />
2010<br />
45<br />
3<br />
20<br />
6<br />
3<br />
23<br />
Equity<br />
Pension provisions<br />
Non-current borrowings<br />
Other non-current liabilities<br />
Current borrowings<br />
Other current liabilities<br />
Current assets increased from 5.9 billion euros<br />
to 6.7 billion euros. Inventories and trade accounts<br />
receivable both rose as a result of higher business<br />
volumes. Cash and cash equivalents increased<br />
by 465 million euros to 1,980 million euros, due<br />
primarily to our strong cash flow from operating<br />
activities in the third quarter.<br />
Equity including non-controlling interests rose<br />
by 812 million euros to 8,762 million euros. The<br />
changes are shown in detail in the consolidated<br />
statement of changes in equity on page 101.<br />
The equity ratio increased compared to the previous<br />
year by 1.8 percentage points to 47.2 percent.<br />
At 5.5 billion euros, non-current liabilities were<br />
above the level as of year-end 2010. The increase<br />
of 0.4 billion euros reflects developments in<br />
pension provisions. The decline in security prices<br />
adversely affected plan assets. Moreover, lower<br />
valuation discount rates had the effect of increasing<br />
calculated pension liabilities. As in the previous<br />
year, non-current borrowings include three<br />
bonds: two senior bonds with a redemption value<br />
of 1 billion euros each, and a hybrid bond with<br />
a redemption value of 1.3 billion euros.