STANDARD introduction Tao Cheng.pdf - standard - UCL
STANDARD introduction Tao Cheng.pdf - standard - UCL
STANDARD introduction Tao Cheng.pdf - standard - UCL

Create successful ePaper yourself
Turn your PDF publications into a flip-book with our unique Google optimized e-Paper software.
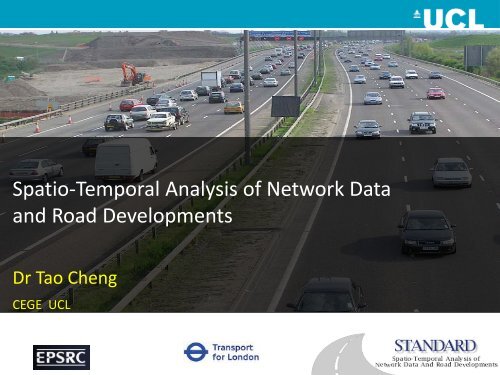
Spatio-Temporal Analysis of Network Data<br />
and Road Developments<br />
Dr <strong>Tao</strong> <strong>Cheng</strong><br />
CEGE <strong>UCL</strong>
Workshop today<br />
Session 1: Spatio-Temporal Data Infrastructures<br />
Muhammad Adnan: Real time geodemographics: requirements and challenges<br />
Andrew Crooks: Developing operational urban models using London’s spatial data infrastructure<br />
Jonathan Turner: Data sources for monitoring road network performance in London<br />
Berk Anbaroglu (<strong>UCL</strong> CEGE): Spatio-temporal outlier analysis<br />
Garavig Tanaksaranond (<strong>UCL</strong> CEGE): Visualising traffic data<br />
Adel Bolbol (<strong>UCL</strong> CEGE) Analyzing travel behaviour through geotagging<br />
Session 2: Road Networks and Complex Systems<br />
Andy Emmonds: Research challenges in understanding London’s road network performance<br />
Jingxi Dong: Performance evaluation of urban road network using GPS-equipped probe vehicles<br />
<strong>Tao</strong> <strong>Cheng</strong>: Integrated spatio-temporal data mining for network complexity<br />
Session 3: Representation and Analysis of Network Data<br />
Tomoki Nakaya: Visualising crime clusters in a space-time cube<br />
Chris Brunsdon: Visualising and modelling complex social systems<br />
Benjamin Heydecker: Analysing road traffic data<br />
Session 4: <strong>STANDARD</strong><br />
Mike Batty: A land use transport model for greater London
• Data<br />
– Synthesis (MA)<br />
– Measurement/re-use (AC)<br />
– Monitoring (JT)<br />
– Modelling (AB)<br />
• Visualisation<br />
– Traffic flows (GT)<br />
– Outliers (BA)<br />
– 3D (TN)<br />
– Complexity (CB)<br />
• Interaction<br />
– Networks (BH)<br />
– Performance (AE, JD)<br />
– ST Dynamics (MB, TC)
Background<br />
• Large cities are increasingly crowded - population &<br />
mobility<br />
• Traffic congestion affects both the economy and daily<br />
life.<br />
• It is difficult and expensive to increase the capacity of<br />
the road network.
City of London<br />
• cost of congestion<br />
- £3 billion per year<br />
• Mayor’s traffic priorities<br />
– reduce congestion and smooth traffic flows<br />
• Remove western extension of CC<br />
(27/11/2008)<br />
• Olympic Game 2012<br />
– travel time to London Olympic sites
Challenge (1) - Network Complexity<br />
1) Dynamics<br />
2) Spatial dependence<br />
3) Spatio-temporal interactions<br />
4) Heterogeneity
Aim<br />
• To quantitatively measure road network<br />
performance<br />
• To understand causes of traffic congestion<br />
– association between traffic and interventions<br />
• traffic flow, speed/journey time<br />
• incidents, road works, signal changes and bus lane changes<br />
• Case study – London
What’s new?<br />
• data-driven, mining<br />
• integrated space and time<br />
– ST associations<br />
• combine regression analysis with machine<br />
learning<br />
– improve the sensitivity and explanatory power<br />
• study the heterogeneity and scale of road<br />
performance<br />
– optimal scale for monitoring
London Road Networks<br />
Cordons<br />
Central, Inner, Outer<br />
Screenlines<br />
Thames,<br />
Northern,<br />
five radials<br />
four peripherals
Challenge (2) - Data issues<br />
• massive – 20GB monthly<br />
• multi-sourced related to 5 different networks<br />
• different scales (density & frequency)<br />
• variable data quality<br />
• contain conflicts, errors, mistakes and gaps
Traffic Flow Surveys<br />
• NMC (National manual count annual data)<br />
• ATC (Automatic Count) – 20 MB<br />
• different time periods, intervals and accuracy
Traffic speed (and hence journey time) data<br />
• MCOS (Moving Car Observer Surveys)<br />
– Centre, Inner, and Outer<br />
– least accurate of the datasets<br />
• ITIS (GPS vehicle tracking system) - 2GB<br />
– major A roads and bus routes in town with 2000 probes<br />
– medium accuracy<br />
• ANPR (Automatic Number Plate Reading) – 6 GB<br />
– main roads in the central and west extensions of CCZs<br />
– 5-minute intervals, 5 vehicle groups,<br />
– high accuracy<br />
– available since March 2008<br />
• At least 5 networks<br />
– boundaries do not fully align
LTIS incident and event data - 20MB<br />
• works, hazards, accidents, signal faults, special events,<br />
breakdowns, security, and other causes<br />
• DfT have all these data as map or as text files<br />
- Minimal, Moderate, Serious or Severe<br />
subjective ?<br />
unrecorded?<br />
not geocoded?<br />
not broadcast on the traffic Link website, creating<br />
problems in analysis and reporting.<br />
There are uncertainties and gaps in the intervention data
Methodology: some preliminary thoughts<br />
• accommodate network structure (topology &<br />
geometry)<br />
• model multi-variable spatio-temporal correlations<br />
• investigate network heterogeneity<br />
– STWR<br />
• model impacts of interventions<br />
– STARIMA & DRNN; hybrid; STANN<br />
• Traffic pattern clustering and long-term<br />
prediction<br />
– STANN; STSVM<br />
• sensitivity analysis and accuracy assessment<br />
• simulate congestion in the short term
Phase 1:<br />
Data/Network<br />
Conflation<br />
F2/F1/S<br />
Pattern S/F1<br />
Clustering<br />
2.1<br />
Phase 2: Integrated Spatio-Temporal Data Mining<br />
Pattern F1/F2<br />
Transition<br />
2.2<br />
DRNN GWR SVM<br />
Intervention<br />
Analysis F2/F1<br />
2.3<br />
Performance<br />
Prediction S/F1/F2<br />
2.4<br />
STARIMA<br />
Mode F1/F2/S<br />
Updating<br />
2.5<br />
Phase 3: A Web-base Platform for Dynamic Visualization and Simulation F2/F1<br />
Figure 1: Main tasks and workflow of the project<br />
Key: work conducted by F1 1st research fellow; F2 2nd research fellow; S research student.
Team (April 2009 – March 2012)<br />
• <strong>UCL</strong><br />
– Dr <strong>Tao</strong> <strong>Cheng</strong> (PI), Senior Lecturer in GIS<br />
– Prof. Benjamin Heydecker (Co-I), Professor of Transport Studies<br />
– Dr Jingxin Dong, Transport Modelling (F1)<br />
– Dr Jiaqiu Wang, GIS (F2)<br />
– RS, MSc in GIS – SVM/GWR<br />
– EngD, MSc in Transport – Simulation<br />
– 3 visiting scholars, each 2 months<br />
Other PhDs<br />
– Mr Berk Anbaroglu (RS), BSc in Computer Science – outlier<br />
detection<br />
– Ms Garavig Tanaksaranond (RS), MSc in GIS – dynamic<br />
visualization<br />
• TfL RNP&R<br />
– Mr Andy Emmonds, Principal Transport Analyst<br />
– Mr Mike Tarrier, Head of RNP&R<br />
– Mr Jonathan Turner, Performance Analyst
Advisory Committee<br />
• Prof. Harry Timmermans, GIS-T and transport, Eindhoven<br />
Technical University - ETU;<br />
• Prof. Stewart Fotheringham, GRW, National University of<br />
Ireland (Maynooth) – NUIM;<br />
• Prof. Mikhail Kanevski, SVM, Institute of Geomatics and<br />
Analysis of Risk (IGAR), University of Lausanne,<br />
Switzerland<br />
• Prof. Peter Jones, CTS, <strong>UCL</strong><br />
• Dr Antony Steed, Computer Science, <strong>UCL</strong><br />
• Dr Katherine Blair, Directorate of Road Network<br />
Performance, TfL<br />
• Mr Jason Robinson, Chief Engineer, Urban Traffic Control<br />
(UTC), TfL
Website<br />
- news<br />
- workshops<br />
- publications<br />
- sample data<br />
- competitions<br />
- discussion<br />
<strong>standard</strong>.cege.ucl.ac.uk<br />
www.ucl.ac.uk/<strong>standard</strong>
Acknowledgements<br />
National High-tech R&D Program<br />
(863 Program)