Special Eurobarometer 'European social reality'
Special Eurobarometer 'European social reality'
Special Eurobarometer 'European social reality'

You also want an ePaper? Increase the reach of your titles
YUMPU automatically turns print PDFs into web optimized ePapers that Google loves.
<strong>Special</strong> EUROBAROMETER 273 “European Social Reality” Report<br />
1.5 Work<br />
In this section we examine the <strong>social</strong> realities of work in more detail. Firstly some<br />
contextual demographic information 19 about the surveyed population:<br />
Half of the respondents claim to be in work. The working half of the sample<br />
consists of manual workers (42%), other employees (24%) managers (18%)<br />
and self-employed people (15%).<br />
A quarter of the interviewees is retired (25%), one in ten looks after the<br />
home (10%) the same proportion is a student (10%) and 6% is unemployed.<br />
1.5.1 Job satisfaction<br />
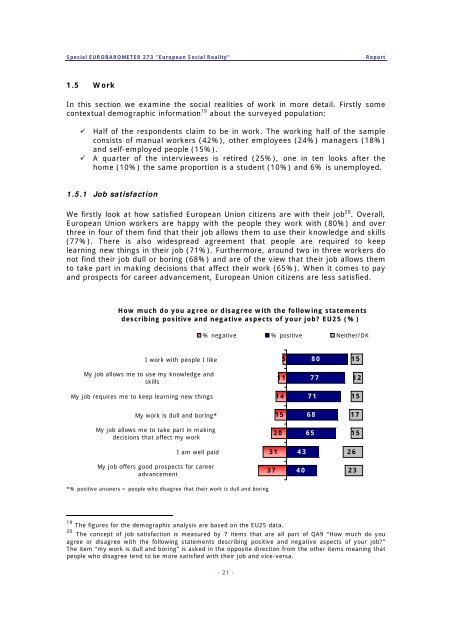
We firstly look at how satisfied European Union citizens are with their job 20 . Overall,<br />
European Union workers are happy with the people they work with (80%) and over<br />
three in four of them find that their job allows them to use their knowledge and skills<br />
(77%). There is also widespread agreement that people are required to keep<br />
learning new things in their job (71%). Furthermore, around two in three workers do<br />
not find their job dull or boring (68%) and are of the view that their job allows them<br />
to take part in making decisions that affect their work (65%). When it comes to pay<br />
and prospects for career advancement, European Union citizens are less satisfied.<br />
How much do you agree or disagree with the following statements<br />
describing positive and negative aspects of your job? EU25 (%)<br />
I work with people I like<br />
My job allows me to use my knowledge and<br />
skills<br />
My job requires me to keep learning new things<br />
My work is dull and boring*<br />
My job allows me to take part in making<br />
decisions that affect my work<br />
I am well paid<br />
My job offers good prospects for career<br />
advancement<br />
*% positive answers = people who disagree that their work is dull and boring<br />
% negative % positive Neither/DK<br />
19 The figures for the demographic analysis are based on the EU25 data.<br />
20 The concept of job satisfaction is measured by 7 items that are all part of QA9 “How much do you<br />
agree or disagree with the following statements describing positive and negative aspects of your job?”<br />
The item “my work is dull and boring” is asked in the opposite direction from the other items meaning that<br />
people who disagree tend to be more satisfied with their job and vice-versa.<br />
- 21 -<br />
37<br />
20<br />
31<br />
5<br />
11<br />
14<br />
15<br />
43<br />
40<br />
80<br />
77<br />
71<br />
68<br />
65<br />
15<br />
12<br />
15<br />
17<br />
15<br />
26<br />
23