Download PDF, 1698 kB - Evira
Download PDF, 1698 kB - Evira
Download PDF, 1698 kB - Evira

You also want an ePaper? Increase the reach of your titles
YUMPU automatically turns print PDFs into web optimized ePapers that Google loves.
5 OATS<br />
5.1 Average oat quality<br />
Finnish Grain Quality in 2012<br />
Of the samples sent in for the monitoring of the grain harvest, 31 per cent were oats,<br />
and the cultivated area was also 31 per cent and 30 per cent of the grain harvest was<br />
oats.<br />
For oats there are two different quality categories depending on the end use. The<br />
minimum quality requirement for feed oats is generally a hectolitre weight of 52 kg and<br />
for milling quality oats for food use the hectolitre weight required is 58 kg. The hectolitre<br />
weights for oats were very high in 2012, the average being 57.9 kg (the median was<br />
58.4 kg). A total of 96 per cent of the oat samples had a hectolitre weight over 52 kg<br />
and 59 per cent had a hectolitre weight over 58 kg.<br />
Based on hectolitre weight the share of samples qualifying as feed oats and milling<br />
oats was the highest for the decade (figure 15). It should still be noted that especially<br />
oats were found to contain raised levels of deoxynivalenol (DON) in the whole country,<br />
which in some cases have exceeded the limit of 1 750 µg/kg set for food use. This<br />
decreased somewhat the share of oats qualifying for food use.<br />
The average protein content of oats was 10.9 per cent (the median was 12.1 per cent),<br />
which is the lowest for more than two decades. The average quality information for oats<br />
for the years 1990–2012 is presented in table 9. The fluctuation of the average values<br />
of hectolitre weight and protein content for oats and barley for the last ten years is<br />
illustrated in the pictures (figures 19-20).<br />
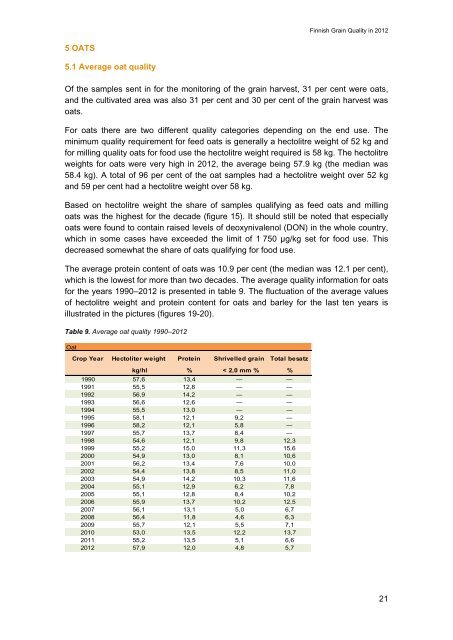
Table 9. Average oat quality 1990–2012<br />
Oat<br />
Crop Year Hectoliter weight Protein Shrivelled grain Total besatz<br />
kg/hl % < 2,0 mm % %<br />
1990 57,6 13,4 ― ―<br />
1991 55,5 12,8 ― ―<br />
1992 56,9 14,2 ― ―<br />
1993 56,6 12,6 ― ―<br />
1994 55,5 13,0 ― ―<br />
1995 58,1 12,1 9,2 ―<br />
1996 58,2 12,1 5,8 ―<br />
1997 55,7 13,7 8,4 ―<br />
1998 54,6 12,1 9,8 12,3<br />
1999 55,2 15,0 11,3 15,6<br />
2000 54,9 13,0 8,1 10,6<br />
2001 56,2 13,4 7,6 10,0<br />
2002 54,4 13,8 8,5 11,0<br />
2003 54,9 14,2 10,3 11,6<br />
2004 55,1 12,9 6,2 7,8<br />
2005 55,1 12,8 8,4 10,2<br />
2006 55,9 13,7 10,2 12,5<br />
2007 56,1 13,1 5,0 6,7<br />
2008 56,4 11,8 4,6 6,3<br />
2009 55,7 12,1 5,5 7,1<br />
2010 53,0 13,5 12,2 13,7<br />
2011 55,2 13,5 5,1 6,6<br />
2012 57,9 12,0 4,8 5,7<br />
21