Photovoltaics in Buildings A Design Guide - DTI Home Page
Photovoltaics in Buildings A Design Guide - DTI Home Page
Photovoltaics in Buildings A Design Guide - DTI Home Page

You also want an ePaper? Increase the reach of your titles
YUMPU automatically turns print PDFs into web optimized ePapers that Google loves.
<strong>Photovoltaics</strong> <strong>in</strong> Build<strong>in</strong>gs<br />
A <strong>Design</strong> <strong>Guide</strong><br />
Max Fordham & Partners In Association<br />
with Feilden Clegg Architects<br />
The work described <strong>in</strong> this report was carried out under contract as part of the New and Renewable Energy Programme, managed by ETSU on<br />
behalf of the Department of Trade and Industry. The views and judgements expressed <strong>in</strong> this report are those of the contractor and do not<br />
necessarily reflect those of ETSU or the Department of Trade and Industry.
ii<br />
<strong>Photovoltaics</strong> <strong>in</strong> Build<strong>in</strong>gs<br />
A <strong>Design</strong> <strong>Guide</strong><br />
Report No ETSU S/P2/00282/REP<br />
March 1999<br />
PROJECT TEAM<br />
Max Fordham & Partners<br />
42/43 Gloucester Crescent<br />
London<br />
NW1 7PE<br />
Randall Thomas (Pr<strong>in</strong>cipal Author)<br />
Tim Gra<strong>in</strong>ger<br />
Feilden Clegg Architects<br />
Bath Brewery<br />
Toll Bridge Road<br />
Bath<br />
BA1 7DE<br />
Bill Geth<strong>in</strong>g<br />
Mike Keys<br />
Illustrations:<br />
Anthony Leitch <strong>Design</strong><br />
66 St. Albans Road<br />
K<strong>in</strong>gston upon Thames<br />
K<strong>in</strong>gston<br />
KT2 5HH<br />
First Published 1999<br />
© Crown Copyright 1999
Contents<br />
1. Introduction 1<br />
2. What are photovoltaics? 4<br />
2.1 Introduction 4<br />
2.2 PVs 4<br />
2.3 How much energy do PV systems produce? 8<br />
3. PVs on build<strong>in</strong>gs 15<br />
3.1 Introduction 15<br />
3.2 The Brief 15<br />
3.3 Site considerations 16<br />
3.4 Build<strong>in</strong>g type 16<br />
3.5 <strong>Design</strong> and construction 19<br />
3.6 Forms and systems 21<br />
3.7 What difference do PVs make? 27<br />
4. Costs and siz<strong>in</strong>g 31<br />
4.1 Introduction 31<br />
4.2 Costs 31<br />
4.3 Siz<strong>in</strong>g the array 32<br />
4.4 The future of costs 37<br />
5. PVs <strong>in</strong> build<strong>in</strong>gs 39<br />
5.1 Introduction 39<br />
5.2 Grid-connection and meter<strong>in</strong>g 39<br />
5.3 System considerations 40<br />
5.4 Modules and cables 43<br />
5.5 Plant rooms 45<br />
6. Case study 47<br />
6.1 Introduction 47<br />
6.2 Site and brief 47<br />
6.3 <strong>Design</strong> development 51<br />
6.4 Future detailed design 55<br />
6.5 Project data 55<br />
Appendix A 57<br />
References and bibliography 61<br />
Glossary 62<br />
Illustration acknowledgements 65<br />
Contacts 66<br />
iii
iv<br />
List of Tables<br />
Table 2.1 PV efficiencies 5<br />
Table 2.2 Comparison of array outputs (MWh/y)<br />
(London data; unshaded arrays) 12<br />
Table 3.1 Annual approximate electrical energy requirement 18<br />
Table 3.2 Roof systems 25<br />
Table 3.3 Facade systems 26<br />
Table 4.1 Approximate costs of conventional systems (<strong>in</strong>stalled) 31<br />
Table 4.2 Approximate costs of PV cladd<strong>in</strong>g systems (<strong>in</strong>stalled) 31<br />
Table 4.3 Basic data for a PV <strong>in</strong>stallation 36<br />
Table 6.1 Data summary 55<br />
List of Figures<br />
Figure 1.1 Model of the design for a PV canopy at the<br />
Earth Centre, Doncaster 1<br />
Figure 1.2 Solar Office, Doxford (near Newcastle upon Tyne) 1<br />
Figure 1.3 BP Solar Showcase 2<br />
Figure 1.4 Solar irradiation over Europe (kWh/m 2 /y) 3<br />
Figure 2.1 Diagram of PV pr<strong>in</strong>ciple 4<br />
Figure 2.2 Direct and diffuse radiation 4<br />
Figure 2.3 PV modules on a solar plane 4<br />
Figure 2.4 Solar Office, Doxford 4<br />
Figure 2.5 A Cambridge tree, near an array of 17th century<br />
solar collectors (ie w<strong>in</strong>dows) 5<br />
Figure 2.6 Crystall<strong>in</strong>e silicon cell 5<br />
Figure 2.7 Typical module constructions 6<br />
Figure 2.8 TFS us<strong>in</strong>g amorphous silicon 6<br />
Figure 2.9 TFS module with metal back<strong>in</strong>g sheet and plastic cover 6<br />
Figure 2.10 Schematic of a typical grid-connected PV system 7<br />
Figure 2.11 Module Man (with apologies to Le Corbusier) 7<br />
Figure 2.12 Tilt and azimuth 8<br />
Figure 2.13 UK annual average solar radiation (kWh/m 2 /day) 9<br />
Figure 2.14 Yearly irradiation map for London 10<br />
Figure 2.15 Yearly irradiation map for Cambridge 10<br />
Figure 2.16 Irradiation map for Leeds 10<br />
Figure 2.17 Irradiation map for Eskdalemuir 11<br />
Figure 2.18 An approximate energy balance for a wall-mounted<br />
PV module (based on clear sky radiation data for<br />
London at noon on June 21) 11<br />
Figure 3.1 Shad<strong>in</strong>g effects by neighbour<strong>in</strong>g build<strong>in</strong>gs 17<br />
Figure 3.2 Self-shad<strong>in</strong>g considerations 17<br />
Figure 3.3 Electrical energy demand of the BRE<br />
Environmental Build<strong>in</strong>g 18<br />
Figure 3.4 Domestic electrical demands and PV outputs 18<br />
Figure 3.5 Electrical demand and PV output for a school 19<br />
Figure 3.6 Low-energy design without PVs 20<br />
Figure 3.7 Build<strong>in</strong>g-<strong>in</strong>tegrated PVs 22-4<br />
Figure 3.8 Ventilated PV roof 25<br />
Figure 3.9 Curta<strong>in</strong> wall<strong>in</strong>g detail 26<br />
Figure 3.10 Ra<strong>in</strong>screen cladd<strong>in</strong>g 27<br />
Figure 3.11 Analogy between facades and roofs 27<br />
Figure 3.12 <strong>Design</strong> considerations for saw-tooth northlight roofs 28<br />
Figure 3.13 The effect of PVs on the design of a low-energy<br />
office build<strong>in</strong>g 28<br />
Figure 4.1 Approximate cost breakdown of a PV <strong>in</strong>stallation<br />
(approximate size 40kWp) 32<br />
Figure 4.2 Cost breakdown of a 2kWp <strong>in</strong>stallation for a<br />
s<strong>in</strong>gle house 32
Figure 4.3 Unit electricity cost 34<br />
Figure 5.1 A grid-connected PV <strong>in</strong>stallation 39<br />
Figure 5.2 PV Installation at the BRE Environmental Build<strong>in</strong>g 41<br />
Figure 5.3 Alternative <strong>in</strong>verter arrangements 41<br />
Figure 5.4 Junction boxes on a free-stand<strong>in</strong>g roof-mounted<br />
<strong>in</strong>stallation 43<br />
Figure 5.5 Junction boxes 43<br />
Figure 5.6 Cable ways at the Doxford Solar Office 44<br />
Figure 6.1 Site plan 47<br />
Figure 6.2 Initial site plann<strong>in</strong>g 47<br />
Figure 6.3 Build<strong>in</strong>g mass<strong>in</strong>g 48<br />
Figure 6.4 Roof proposal 49<br />
Figure 6.5 Annual electrical demand and PV supply 50<br />
Figure 6.6 Weekly demand pattern 50<br />
Figure 6.7 Roof configurations 52<br />
Figure 6.8 Services strategy and notional air paths 52<br />
Figure 6.9 Bowl<strong>in</strong>g green ventilation strategy 52<br />
Figure 6.10 South elevation 53<br />
Figure 6.11 F<strong>in</strong>al scheme 53<br />
Figure 6.12 System schematic 54<br />
Figure A.1 Spectral distribution of solar radiation at the<br />
earth’s surface 57<br />
Figure A.2 Spectral response of a monocrystall<strong>in</strong>e PV cell 57<br />
Figure A.3 Variation of module power with irradiance 57<br />
Figure A.4 Series and parallel arrangements 58<br />
Figure A.5 Current/voltage (I-V) curve 58<br />
Figure A.6 Typical I-V curves at vary<strong>in</strong>g irradiances 58<br />
Figure A.7 Cell efficiency as a function of temperature 59<br />
Figure A.8 The effect of shad<strong>in</strong>g 59<br />
Figure A.9 Inverter performance 60<br />
v
vi<br />
Acknowledgements<br />
We would like to thank the follow<strong>in</strong>g people who gave generously of their<br />
time, <strong>in</strong> provid<strong>in</strong>g useful guidance, <strong>in</strong> show<strong>in</strong>g us around PV <strong>in</strong>stallations, or <strong>in</strong><br />
review<strong>in</strong>g the draft text:<br />
Dr Susan Roaf<br />
Mr Bill Dunster<br />
Dr Aidan Duffy<br />
Ms Helen Lloyd<br />
Mr David Lloyd Jones<br />
Ms Donna Munro<br />
Dr Nicola Pearsall<br />
Ms Sara Wigglesworth.<br />
With special thanks to those who did all three: Nicola Pearsall and David<br />
Lloyd Jones.<br />
Our thanks are due also to various manufacturers and system <strong>in</strong>stallers<br />
<strong>in</strong>clud<strong>in</strong>g BP Solar, EETS (Dr Bruce Cross), Schüco (Mr John Stamp), W<strong>in</strong>d and<br />
Sun (Mr Steve Wade) and SMA for <strong>in</strong>valuable discussions and <strong>in</strong>formation.<br />
It goes without say<strong>in</strong>g (but perhaps not without writ<strong>in</strong>g) that any errors or<br />
misunderstand<strong>in</strong>gs are due to us alone. We welcome all comments.<br />
Note to readers<br />
One <strong>in</strong>tention of this publication is to provide an overview for those <strong>in</strong>volved<br />
<strong>in</strong> build<strong>in</strong>g and build<strong>in</strong>g services design and for students of these discipl<strong>in</strong>es.<br />
It is not <strong>in</strong>tended to be exhaustive or def<strong>in</strong>itive and it will be necessary for<br />
users of the <strong>Guide</strong> to exercise their own professional judgement when<br />
decid<strong>in</strong>g whether or not to abide by it.<br />
It cannot be guaranteed that any of the material <strong>in</strong> the book is appropriate<br />
to a particular use. Readers are advised to consult all current Build<strong>in</strong>g<br />
Regulations, British Standards or other applicable guidel<strong>in</strong>es, Health and<br />
Safety codes and so forth, as well as up-to-date <strong>in</strong>formation on all materials<br />
and products.
1<br />
Introduction<br />
If the 19th century was the age of coal and the 20th of oil, the 21st will be<br />
the age of the sun.<br />
Solar energy is set to play an ever-<strong>in</strong>creas<strong>in</strong>g role <strong>in</strong> generat<strong>in</strong>g the form, and<br />
affect<strong>in</strong>g the appearance and construction, of build<strong>in</strong>gs. The pr<strong>in</strong>cipal reason<br />
for this is that photovoltaic (PV) systems which produce electricity directly<br />
from solar radiation are becom<strong>in</strong>g more widespread as their advantages<br />
become apparent and as costs fall. PVs are an advanced materials<br />
technology that will help us design build<strong>in</strong>gs which are environmentally<br />
responsible, responsive and excit<strong>in</strong>g. These will take a variety of forms as<br />
shown <strong>in</strong> Figures 1.1, 1.2 and 1.3. In Figure 1.1 the PVs are part of the roof<br />
structure; <strong>in</strong> the other figures they form the south-fac<strong>in</strong>g walls.<br />
This <strong>Guide</strong> provides an overview of how PVs work and are <strong>in</strong>corporated <strong>in</strong><br />
the design of build<strong>in</strong>gs; it gives the <strong>in</strong>formation that designers and, <strong>in</strong><br />
particular, architects, need. It is for those who wish to assess the feasibility of<br />
us<strong>in</strong>g PVs <strong>in</strong> a specific project, for those who have already decided to use<br />
PVs and want to know how to do so and for those with the foresight to want<br />
to plan their build<strong>in</strong>gs for PVs <strong>in</strong> the future. The last category has its<br />
Figure 1.1<br />
Model of the design for a PV canopy at<br />
the Earth Centre, Doncaster<br />
Figure 1.2<br />
Solar Office, Doxford (near Newcastle<br />
upon Tyne)<br />
1
2<br />
Figure 1.3<br />
BP Solar Showcase<br />
counterpart <strong>in</strong> designers and build<strong>in</strong>g owners <strong>in</strong> New York who <strong>in</strong> the latter<br />
part of the 19th century built lift shafts and fitted the lifts themselves later<br />
when f<strong>in</strong>ances permitted. Although most applications of build<strong>in</strong>g-<strong>in</strong>tegrated<br />
PVs are not cost-effective at present, it is anticipated that they will be <strong>in</strong> the<br />
not too distant future (Chapter 4).<br />
We have addressed new build<strong>in</strong>gs especially and covered a number of<br />
build<strong>in</strong>g types and sectors; much of the technology could be applied as a<br />
retrofit to exist<strong>in</strong>g build<strong>in</strong>gs. Our focus is on PV systems which are build<strong>in</strong>g<strong>in</strong>tegrated<br />
and grid-connected. PVs are a proven, commercially-available<br />
technology. In grid-connected systems, the PVs operate <strong>in</strong> parallel with the<br />
grid, so if the PV supply is less than demand the grid supplies the balance;<br />
when there is excess energy from the PV system it can be fed back to the<br />
grid. Build<strong>in</strong>g-<strong>in</strong>tegrated, grid-connected systems have the follow<strong>in</strong>g<br />
advantages:<br />
• The cost of the PV wall or roof can be offset aga<strong>in</strong>st the cost of the<br />
build<strong>in</strong>g element it replaces.<br />
• Power is generated on site and replaces electricity which would<br />
otherwise be purchased at commercial rates.<br />
• By connect<strong>in</strong>g to the grid the high cost of storage associated with<br />
stand-alone systems is avoided and security of supply is ensured.<br />
• There is no additional requirement for land.<br />
One of our start<strong>in</strong>g po<strong>in</strong>ts is that PVs should be considered as an <strong>in</strong>tegral<br />
part of the overall environmental strategy of energy-efficient build<strong>in</strong>g design.<br />
PVs will be a key element <strong>in</strong> further<strong>in</strong>g this approach to build<strong>in</strong>g and will help<br />
us move towards what we call Positive Energy Architecture, ie build<strong>in</strong>gs which<br />
are net energy producers over the course of a year rather than consumers.
Another start<strong>in</strong>g po<strong>in</strong>t was plant<strong>in</strong>g our feet firmly <strong>in</strong> the UK - the <strong>Guide</strong> deals<br />
with its weather conditions. However, as can be seen from Figure 1.4, annual<br />
irradiation is similar <strong>in</strong> much of Northern Europe (sometimes referred to<br />
poetically as ‘the cloudy North’) and the grow<strong>in</strong>g PV movements <strong>in</strong>, for<br />
example, Germany and the Netherlands should encourage us.<br />
The <strong>Guide</strong> is set out <strong>in</strong> a way that mimics the design process:<br />
• Chapter 2 <strong>in</strong>troduces some basic PV concepts.<br />
• Chapter 3 discusses the site and build<strong>in</strong>g and the design options.<br />
• Chapter 4 exam<strong>in</strong>es costs and siz<strong>in</strong>g.<br />
• Chapter 5 looks at the <strong>in</strong>tegration of PVs <strong>in</strong>side the build<strong>in</strong>g.<br />
In addition we <strong>in</strong>clude an actual design study, an Appendix sett<strong>in</strong>g out a<br />
number of technical po<strong>in</strong>ts and a Glossary.<br />
We have tried to set out the issues <strong>in</strong> a straightforward manner but it should<br />
be remembered that real design is always iterative, often illogical and<br />
occasionally <strong>in</strong>spired - the art is <strong>in</strong> atta<strong>in</strong><strong>in</strong>g the right mixture.<br />
We hope the <strong>Guide</strong> will give an idea of the variety and flexibility of PVs<br />
and of their design and aesthetic potential; if we as a design community are<br />
successful, our local and global environments will be enhanced.<br />
Figure 1.4<br />
Solar irradiation over Europe<br />
(kWh/m 2 /y)<br />
3
4<br />
Figure 2.1<br />
Diagram of PV pr<strong>in</strong>ciple<br />
Figure 2.2<br />
Direct and diffuse radiation<br />
Figure 2.3<br />
PV modules on a solar plane<br />
Figure 2.4<br />
Solar Office, Doxford<br />
2<br />
What are photovoltaics?<br />
2.1 Introduction<br />
PV systems convert solar radiation <strong>in</strong>to electricity. They are not to be<br />
confused with solar panels which use the sun’s energy to heat water (or air)<br />
for water and space heat<strong>in</strong>g. This chapter looks at PVs and exam<strong>in</strong>es a<br />
number of issues of <strong>in</strong>terest to designers <strong>in</strong>clud<strong>in</strong>g:<br />
• PV module size and shape.<br />
• Colour.<br />
• Manufactur<strong>in</strong>g technology.<br />
• Environmental issues.<br />
• Energy production.<br />
2.2 PVs<br />
The most common PV devices at present are based on silicon. When the<br />
devices are exposed to the sun, direct current (DC) flows as shown <strong>in</strong> Figure<br />
2.1 (see Appendix A for greater detail). PVs respond to both direct and<br />
diffuse radiation (Figure 2.2) and their output <strong>in</strong>creases with <strong>in</strong>creas<strong>in</strong>g<br />
sunsh<strong>in</strong>e or, more technically, irradiance (Figure A.3).<br />
PVs are ubiquitous. They power calculators and navigation buoys, form the<br />
w<strong>in</strong>gs of satellites and solar planes (Figure 2.3), and are beg<strong>in</strong>n<strong>in</strong>g to appear<br />
on cars. As we saw <strong>in</strong> Chapter 1, a number of build<strong>in</strong>gs <strong>in</strong> the UK use them,<br />
eg, the Solar Office <strong>in</strong> Doxford (Figures 1.2 and 2.4).
Common PVs available are monocrystall<strong>in</strong>e silicon, polycrystall<strong>in</strong>e silicon<br />
and th<strong>in</strong> film silicon (us<strong>in</strong>g amorphous silicon). A typical crystall<strong>in</strong>e cell might<br />
be 100 x 100mm. Cells are comb<strong>in</strong>ed to form modules. Table 2.1 shows<br />
typical efficiencies.<br />
Table 2.1<br />
PV efficiencies<br />
Type<br />
1. Monocrystall<strong>in</strong>e silicon<br />
2. Polycrystall<strong>in</strong>e silicon<br />
3. Th<strong>in</strong>-film silicon (us<strong>in</strong>g<br />
amorphous silicon)<br />
Approximate<br />
cell efficiency a<br />
%<br />
13-17 (1)<br />
12-15 (1)<br />
5 (3)<br />
a. Efficiencies are determ<strong>in</strong>ed under standard test conditions (STC).<br />
Approximate<br />
module efficiency a<br />
%<br />
12-15 (2)<br />
11-14 (2)<br />
4.5-4.9 (3)<br />
Theoretical maximum efficiencies are about 30%. Actual efficiencies are<br />
improv<strong>in</strong>g. In solar car races PVs with efficiencies of about 25% are be<strong>in</strong>g<br />
used. New materials such as copper <strong>in</strong>dium diselenide (CIS) and cadmium<br />
telluride (CdTe) are be<strong>in</strong>g <strong>in</strong>vestigated (CdTe modules are <strong>in</strong> pilot production).<br />
Novel approaches such as produc<strong>in</strong>g multijunction cells which use a wider part<br />
of the solar spectrum are another aspect of a drive to <strong>in</strong>crease efficiency.<br />
It is also useful to keep efficiencies <strong>in</strong> perspective. A tree (Figure 2.5) relies<br />
on photosynthesis, a process which has been function<strong>in</strong>g <strong>in</strong> seed plants for<br />
over 100,000,000 years and only converts 0.5-1.5% of the absorbed light<br />
<strong>in</strong>to chemical energy (4).<br />
More recently, the national grid has proved only 25-30% efficient <strong>in</strong> provid<strong>in</strong>g<br />
us with electricity from fossil fuels.<br />
Crystall<strong>in</strong>e silicon cells consist of p-type and n-type silicon (Appendix A) and<br />
electrical contacts as shown schematically <strong>in</strong> Figure 2.6.<br />
Figure 2.5<br />
A Cambridge tree, near an array of 17th<br />
century solar collectors (ie w<strong>in</strong>dows)<br />
Figure 2.6<br />
Crystall<strong>in</strong>e silicon cell<br />
5
6<br />
Figure 2.7<br />
Typical module constructions<br />
a. Glass/EVA/Tedlar/Polyester/Tedlar<br />
b. Glass/Res<strong>in</strong>/Glass<br />
Figure 2.8<br />
TFS us<strong>in</strong>g amorphous silicon<br />
The cells, which are of low voltage, are jo<strong>in</strong>ed <strong>in</strong> series to form a module of<br />
a higher, more useful voltage. The modules (Figure 2.7) are constructed like a<br />
sandwich (and sometimes referred to as lam<strong>in</strong>ates) and have a back<strong>in</strong>g sheet<br />
and a cover of low-iron glass which protects the front surface of the material<br />
while ma<strong>in</strong>ta<strong>in</strong><strong>in</strong>g a high transmissivity. A structural frame is used <strong>in</strong> a number<br />
of designs to protect the glass.<br />
The back<strong>in</strong>g sheet need not, however, be opaque. At the Doxford Solar<br />
Office (Figure 1.2), the PV cells are encapsulated between two layers of glass<br />
with transparent spac<strong>in</strong>g between cells (Figure 2.7(b)); thus light passes<br />
through the transparent areas. This produces an effect <strong>in</strong>side the build<strong>in</strong>g<br />
which <strong>in</strong> the architect’s words is like “sunlight filtered through trees”.<br />
Th<strong>in</strong> film silicon (TFS) PVs us<strong>in</strong>g amorphous silicon are manufactured by a<br />
vapour deposition process. Between the p and n layers is the i (for <strong>in</strong>tr<strong>in</strong>sic)<br />
layer. Overall, thicknesses are much less than with crystall<strong>in</strong>e technologies,<br />
hence the name. Typically, the cells are lam<strong>in</strong>ated <strong>in</strong>to glass (Figure 2.8) but<br />
modules can also be made flexible by us<strong>in</strong>g plastics (Figure 2.9) or metal.<br />
Modules electrically connected together <strong>in</strong> series (Figure A.4) are often<br />
referred to as a str<strong>in</strong>g and a group of connected str<strong>in</strong>gs as an array. An<br />
array is also a generic term for any group<strong>in</strong>g of modules connected <strong>in</strong> series<br />
and/or parallel. Power from the array (Figure 2.10) goes to a Power<br />
Condition<strong>in</strong>g Unit (PCU). PCU is a general term for the device (or devices)<br />
which converts the electrical output from the PV array <strong>in</strong>to a suitable form for<br />
the build<strong>in</strong>g. Most commonly, the PCU has a pr<strong>in</strong>cipal component, an <strong>in</strong>verter<br />
(which converts DC to alternat<strong>in</strong>g current, AC) and associated control and<br />
protection equipment. PCU and <strong>in</strong>verter are sometimes loosely used<br />
<strong>in</strong>terchangeably. The AC output from the PCU goes to a distribution board <strong>in</strong><br />
the build<strong>in</strong>g or to the grid if supply exceeds demand.<br />
Figure 2.9<br />
TFS module with metal<br />
back<strong>in</strong>g sheet and<br />
plastic cover
Generally, grid-connected PV systems are most efficient when the array<br />
experiences uniform conditions. This tends to favour the same orientation and<br />
tilt for all modules, similar module and cell types and sizes, uniform<br />
temperature conditions and so forth.<br />
Crystall<strong>in</strong>e silicon modules come <strong>in</strong> a variety of sizes and shapes, although<br />
rectangular patterns of 0.3m 2 to say 1.5m 2 have been most common to date<br />
(Figure 2.11). The weight of a 0.5m by 1.2m framed module is about 7.5kg. The<br />
lam<strong>in</strong>ate (without the frame) is about 4.5kg.<br />
Larger modules of 1.5m by 2.0m have been used <strong>in</strong> <strong>in</strong>stallations (5) and at<br />
least one manufacturer has modules up to 2.1m by 3.5m available to meet the<br />
needs of the build<strong>in</strong>g market. With larger modules cost reductions are<br />
possible through lower wir<strong>in</strong>g costs and simpler fram<strong>in</strong>g arrangements.<br />
TFS modules are commercially available up to 1-1.2m wide by 1.5-1.7m long;<br />
the modules at the BRE (Figure 3.7(f)) were 0.93m by 1.35m. At the smaller end<br />
of the scale, <strong>in</strong> the US, amorphous silicon is be<strong>in</strong>g used for flexible PV roof<br />
sh<strong>in</strong>gles.<br />
Monocrystall<strong>in</strong>e silicon modules normally appear as a solid colour, rang<strong>in</strong>g<br />
from blue to black. A wider variety of colours is available but at a cost of<br />
lower efficiency s<strong>in</strong>ce their colour comes from reflection of some of the<br />
<strong>in</strong>cident light which would otherwise be absorbed. As an example, magenta<br />
or gold results <strong>in</strong> a lost of efficiency of about 20%. Polycrystall<strong>in</strong>e modules<br />
are normally blue (but aga<strong>in</strong> other colours are available) and have a multifaceted<br />
appearance which has a certa<strong>in</strong> ‘shimmer’. Look<strong>in</strong>g at a<br />
polycrystall<strong>in</strong>e array is a bit like look<strong>in</strong>g at a very starry night sky except<br />
that the background is blue rather than black. The appearance of TFS is<br />
uniform, with a dark matt surface, <strong>in</strong> some ways like t<strong>in</strong>ted glass; colours<br />
<strong>in</strong>clude grey, brown and black. Obviously, for all PV types it is best to see<br />
several <strong>in</strong>stallations to appreciate their vary<strong>in</strong>g aesthetics.<br />
Figure 2.10<br />
Schematic of a typical grid-connected<br />
PV system<br />
Figure 2.11<br />
Module Man (with apologies to<br />
Le Corbusier)<br />
7
8<br />
Figure 2.12<br />
Tilt and azimuth<br />
PVs have long lifetimes. There are <strong>in</strong>stallations that have been <strong>in</strong> operation for<br />
15 years or more. The design life of standard glass/EVA/TedlarTM modules<br />
is more than 20 years; EVA is ethylene v<strong>in</strong>yl acetate. Both crystall<strong>in</strong>e silicon<br />
and TFS modules are often guaranteed by manufacturers for 10 years to<br />
produce 90% of their rated output. Guarantees are designed to ensure, for<br />
example, that electrical <strong>in</strong>tegrity is ma<strong>in</strong>ta<strong>in</strong>ed <strong>in</strong> a wide variety of vary<strong>in</strong>g<br />
weather conditions; the PV mechanism at the cell level itself is not the issue<br />
and will function, <strong>in</strong> pr<strong>in</strong>ciple, <strong>in</strong>def<strong>in</strong>itely.<br />
Environmentally, PVs have the significant advantages of produc<strong>in</strong>g no<br />
pollutant emissions <strong>in</strong> use and, by replac<strong>in</strong>g grid-generated electricity with<br />
solar energy used ma<strong>in</strong>ly on site, reduc<strong>in</strong>g CO2, NOx (nitrogen oxides) and<br />
SOx (SO2 and SO3) emissions.<br />
Energy is, of course, required for their production but the energy payback<br />
period (the time for the PV <strong>in</strong>stallation to produce as much energy as is<br />
required for manufacture) is <strong>in</strong> the order of five years; as an example, for the<br />
monocrystall<strong>in</strong>e <strong>in</strong>stallation at the Northumberland Build<strong>in</strong>g at the University<br />
of Northumbria, the figure was 6.1 years (6).<br />
A life cycle analysis has been carried out to exam<strong>in</strong>e other potential<br />
environmental impacts of PVs. In general for the manufactur<strong>in</strong>g processes for<br />
crystall<strong>in</strong>e silicon and amorphous silicon there are no environmental issues<br />
which raise concern (7).<br />
Some reservations have been expressed about the environmental impact of<br />
new materials, particularly cadmium telluride (CdTe). However, the production<br />
process can be designed so that cadmium is not emitted and manufacturers<br />
are actively develop<strong>in</strong>g recycl<strong>in</strong>g techniques to avoid disposal problems. The<br />
prudent approach is to keep the situation under review.<br />
2.3 How much energy do PV systems produce?<br />
The output from build<strong>in</strong>g-<strong>in</strong>tegrated PV <strong>in</strong>stallations is the output of the PV<br />
array less the losses <strong>in</strong> the rest of the system. The output from the array will<br />
depend on:<br />
• The daily variation due to the rotation of the earth and the seasonal<br />
one (due to the orientation of the earth’s axis and the movement of<br />
the earth about the sun).<br />
• Location ie the solar radiation available at the site.<br />
• Tilt (Figure 2.12).<br />
• Azimuth ie orientation with respect to due south (Figure 2.13).<br />
• Shadow<strong>in</strong>g.<br />
• Temperature.<br />
For purposes of standardisation and comparison, PV modules are tested <strong>in</strong><br />
STCs of 1000W/m 2 and 25 0 C. Thus a monocrystall<strong>in</strong>e module of 1m 2 with an<br />
efficiency of 15% (Table 2.1) is rated at 150W peak, or 150Wp; note that this<br />
is DC (and is before conversion to AC). Arrays of PVs will often be referred<br />
to <strong>in</strong> these terms, eg the 2kWp array at the BRE Environmental Build<strong>in</strong>g (Figure<br />
3.7(f)). The maximum power an <strong>in</strong>stallation can produce will usually be<br />
somewhat lower than the peak power. One reason for this is that 1000W/m 2
is a high level of solar radiation achieved only <strong>in</strong> very sunny conditions.<br />
Nonetheless, <strong>in</strong> London <strong>in</strong> clear sky conditions a south-fac<strong>in</strong>g wall at noon <strong>in</strong><br />
early December can receive about 650W/m 2 and a south-fac<strong>in</strong>g surface<br />
tilted at 22.5 0 from the horizontal at noon <strong>in</strong> late June will receive about<br />
945W/m 2 . Other reasons for lower output are higher temperatures, less than<br />
optimal orientation, overshadow<strong>in</strong>g and so forth.<br />
2.3.1 Location, tilt and azimuth<br />
While the maximum output is of value, the more important figure for gridconnected<br />
systems is the annual energy production. If we return to our list of<br />
output factors and look at location, Figure 2.13 shows a solar map of the UK<br />
and gives the maximum annual amount of energy available on a horizontal<br />
surface.<br />
While this is useful as a guide to the basic energy available what we need<br />
to know is the total annual solar radiation on a surface tilted so that the<br />
output is maximised. This can be done laboriously from tabular data or more<br />
quickly by computer programmes with meteorological data bases (computer -<br />
based design tools for PV systems are becom<strong>in</strong>g more common and easier to<br />
use). Figures 2.14 to 2.17 give data for the four cities of Figure 2.13. Note that<br />
the maps show the effects of variations <strong>in</strong> irradiation as a function of<br />
orientation and tilt.<br />
The maximum annual <strong>in</strong>cident solar radiation (and hence output) is usually at<br />
an orientation of about due south and at a tilt from the horizontal equal to<br />
the latitude of the site m<strong>in</strong>us 20 0 . Thus, Eskdalemuir at a latitude of 55 0 19’ N<br />
has a maximum annual irradiation of 920kWh/m 2 /y at an orientation 5 0 or<br />
so west of south and at a tilt of about 36 0 . An encourag<strong>in</strong>g aspect is that the<br />
total annual output is 95% of maximum over a surpris<strong>in</strong>gly wide range of<br />
orientations and tilts.<br />
Figure 2.13<br />
UK annual average solar<br />
radiation (kWh/m 2 /day)<br />
9
10<br />
Figure 2.14<br />
Yearly irradiation map for London<br />
Figure 2.15<br />
Yearly irradiation map for Cambridge<br />
Figure 2.16<br />
Yearly irradiation map for Leeds
If we take a 50m 2 monocrystall<strong>in</strong>e silicon array (efficiency 15%; nom<strong>in</strong>al<br />
array power 7.5 kWp) ) with a tilt of 20 0 and an azimuth of 30 0<br />
(correspond<strong>in</strong>g to an orientation of 150 0 ) the uncorrected annual output, which<br />
we will call, S, is:<br />
50 x 920 x 0.15 x 0.95 = 6555 kWh/y<br />
2.3.2 Shadow<strong>in</strong>g and temperature<br />
Shadow<strong>in</strong>g will depend on the geography of the site, neighbour<strong>in</strong>g build<strong>in</strong>gs<br />
and self-shad<strong>in</strong>g by the architectural forms, all of which are considered <strong>in</strong> the<br />
next chapter; the effects of shadow<strong>in</strong>g can be mitigated somewhat through<br />
system design. For the present exercise no loss due to shad<strong>in</strong>g is assumed.<br />
The performance of PV modules decreases with <strong>in</strong>creas<strong>in</strong>g temperature (the<br />
drop <strong>in</strong> performance is somewhat more marked for crystall<strong>in</strong>e silicon than<br />
amorphous silicon (Appendix A)). <strong>Design</strong>s for build<strong>in</strong>g-<strong>in</strong>tegrated PVs need to<br />
consider this from the outset <strong>in</strong> order to allow air to flow over the backs of<br />
the modules to ma<strong>in</strong>ta<strong>in</strong> high performance. It is also likely to be necessary<br />
with all types of module to avoid unwanted heat ga<strong>in</strong> <strong>in</strong>to the space (which<br />
could cause discomfort and <strong>in</strong>crease any cool<strong>in</strong>g load). Figure 2.18 shows an<br />
approximate energy balance at a typical monocrystall<strong>in</strong>e module.<br />
Figure 2.17<br />
Yearly irradiation map for Eskdalemuir<br />
Figure 2.18<br />
An approximate energy balance for a<br />
wall-mounted PV module (based on clear<br />
sky radiation data for London at noon on<br />
June 21)<br />
11
12<br />
Table 2.2<br />
Comparison of array outputs (MWh/y) (London data; unshaded arrays)<br />
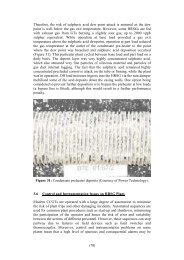
Build<strong>in</strong>g-<strong>in</strong>tegrated modules can reach 20-40 0 C above ambient <strong>in</strong> conditions<br />
of high radiation (Chapter 3). For each 1 0 C <strong>in</strong>crease <strong>in</strong> cell temperature above<br />
25 0 C the power output decreases by about 0.4-0.5% (Appendix A). (So, as a<br />
very rough approximation over the year we might estimate the loss at 15 0 C x<br />
0.45%/ 0 C or 6.8%). In practice it is easier to comb<strong>in</strong>e the loss due to<br />
temperature with a number of others such as dust and mismatch (Appendix A)<br />
<strong>in</strong> a correction factor we will call, K, which is taken at about 0.9.<br />
To complete the system, losses <strong>in</strong> the other components ie the balance of<br />
system (BOS) (power condition<strong>in</strong>g unit, wir<strong>in</strong>g, etc) must be accounted for,<br />
<strong>in</strong>clud<strong>in</strong>g conversion of DC to AC <strong>in</strong> the PCU. These are discussed <strong>in</strong> more<br />
detail <strong>in</strong> Appendix A - for the present a loss factor, L, of 0.8 will be used.<br />
In summary, for unshaded <strong>in</strong>stallations the approximate annual energy<br />
production of the system, which we will call, E, is given by<br />
E = S x K x L<br />
In the example above E= 6555 x 0.9 x 0.8 = 4720kWh/y, or approximately<br />
94kWh/m 2 y. A very approximate rule of thumb is that 1m 2 of monocrystall<strong>in</strong>e<br />
PV array at a reasonable tilt and orientation and <strong>in</strong> an efficient system will<br />
give about 100kWh/y.<br />
The output can also be related to the peak rat<strong>in</strong>g of the <strong>in</strong>stallation. Thus, our<br />
system with its 50m 2 monocrystall<strong>in</strong>e array has an output of 4720kWh/y or<br />
12.9kWh/day. If this is divided by the peak power of 7.5kWp we have<br />
what is known as the f<strong>in</strong>al yield of 1.7 kWh/kWp/day; this is also<br />
sometimes seen expressed on an annual basis, <strong>in</strong> this case, approximately<br />
620kWh/kWp. Such figures are used to compare PV systems of vary<strong>in</strong>g<br />
characteristics, eg size.<br />
Another common way of assess<strong>in</strong>g <strong>in</strong>stallations is the Performance Ratio<br />
which is discussed <strong>in</strong> Appendix A.<br />
For comparison, Table 2.2 gives the output of a number of different 50m 2<br />
arrays.<br />
Position TFS Monocrystall<strong>in</strong>e silicon<br />
1. Vertical wall<br />
2. Roof 30 0<br />
3. Roof 45 0<br />
45 0 east<br />
of south<br />
south<br />
15 0 west<br />
of south<br />
45 0 east<br />
of south<br />
south<br />
15 0 west<br />
of south<br />
2.00 2.15 2.13 3.50 3.75 3.72<br />
2.96 3.09 3.08 5.18 5.41 5.38<br />
2.86 3.03 3.01 5.00 5.30 5.26
KEY POINTS<br />
1. PVs produce DC which <strong>in</strong> grid-connected systems is converted to AC.<br />
2. PVs respond to direct and diffuse radiation.<br />
3. The more sunsh<strong>in</strong>e, the greater the output.<br />
4. Efficiencies range roughly from 5-15%.<br />
5. PV cells do not let light through but modules can be constructed so<br />
that some areas are transparent and some are opaque.<br />
6. PV systems tend to be most efficient when the array experiences<br />
uniform conditions. <strong>Design</strong>ers can facilitate this.<br />
7. Modules come <strong>in</strong> various sizes and shapes. Appearance varies with<br />
the type of PV.<br />
8. A number of PV <strong>in</strong>stallations have been <strong>in</strong> operation for 15 years or<br />
more.<br />
9. Energy payback periods for PVs are short.<br />
10. <strong>Design</strong>ers have a key <strong>in</strong>fluence on the follow<strong>in</strong>g factors that affect PV<br />
output:<br />
• Tilt.<br />
• Azimuth.<br />
• Shadow<strong>in</strong>g.<br />
• Temperature.<br />
11. For grid-connected systems the annual energy production is the key<br />
figure.<br />
12. Exact orientation is not critical. A range of orientations and tilts give<br />
95% of the maximum output.<br />
13. Shadow<strong>in</strong>g is to be avoided wherever possible.<br />
14. Ventilation needs to be provided to remove heat from the modules.<br />
15. A rule of thumb is that 1m 2 of monocrystall<strong>in</strong>e PV array reasonably<br />
positioned and <strong>in</strong> an efficient system will give about 100kWh/y.<br />
13
14<br />
REFERENCES<br />
1. Private communication, BP Solar, April 1998.<br />
2. Anon, (1996), Solar Electric - Build<strong>in</strong>g <strong>Home</strong>s with Solar Power.<br />
London: Greenpeace.<br />
3. Private communication, Intersolar, April 1998. These figures are longterm<br />
stabilised efficiencies achieved after an <strong>in</strong>itial degradation of<br />
performance.<br />
4. Bowen, H.J.M., (1965), Introduction to Botany. Newnes, London, p.119.<br />
5. IT Power, (1996), Development of Photovoltaic Cladd<strong>in</strong>g Systems.<br />
ETSU S/P2/00216/REP. ETSU: Harwell.<br />
6. Baumann, A.E., Ferguson, R.A.D. and Hill, R., (1997), External Costs of<br />
the Toledo 1MW PV Plant and the Newcastle 40kW BIPV Facade.<br />
14th EC PVSC Conference, Barcelona.<br />
7. Environmental Resources Management, (1996), A Study Into Life Cycle<br />
Environmental Impacts of Photovoltaic Technologies. ETSU<br />
S/P2/00240/REP. ETSU: Harwell.<br />
FURTHER READING<br />
1. Hill, R., (1998), PV Cells and Modules. Renewable Energy World, 1 (1),<br />
pp.22-26.<br />
2. Anon. (undated), Photovoltaic Technologies and their Future Potential.<br />
Commission of the European Communities Directorate-General for<br />
Energy (XVII). EAB Energie - Anlagen, Berl<strong>in</strong>.<br />
3. Studio E Architects, (1995), <strong>Photovoltaics</strong> <strong>in</strong> Build<strong>in</strong>gs - A Survey of<br />
<strong>Design</strong> Tools, ETSU S/P2/00289/REP. ETSU: Harwell.
3<br />
PVs on build<strong>in</strong>gs<br />
3.1 Introduction<br />
PVs offer enormous potential to build<strong>in</strong>g designers but, as an architect has<br />
said, “it has to be done right from the start” - they should not be an<br />
afterthought. PVs can <strong>in</strong>fluence the build<strong>in</strong>g’s orientation, footpr<strong>in</strong>t, layout and<br />
form; they will affect the build<strong>in</strong>g fabric and will be an important element of<br />
the environmental and build<strong>in</strong>g systems. They need to be considered as an<br />
<strong>in</strong>tegral part of the energy strategy of the build<strong>in</strong>g and of its function<strong>in</strong>g. The<br />
<strong>in</strong>tegration of PVs with the other build<strong>in</strong>g elements is critical to success.<br />
Appearance and aesthetics are, as ever, especially important.<br />
This chapter looks at the site, build<strong>in</strong>g type and load analysis - all factors <strong>in</strong><br />
assess<strong>in</strong>g the suitability of PVs. It then looks at the <strong>in</strong>fluence of PVs on the<br />
build<strong>in</strong>g. Because PVs are currently an expensive technology it is important to<br />
use them as optimally as possible. A parallel can perhaps be drawn with the<br />
history of glaz<strong>in</strong>g. In the Middle Ages, glass was expensive and each<br />
w<strong>in</strong>dow was valued highly. Now we have them wherever we want them.<br />
3.2 The Brief<br />
It is very important to start with a well-def<strong>in</strong>ed brief, ie a clear idea of what<br />
one is try<strong>in</strong>g to achieve, and then to determ<strong>in</strong>e if PVs are applicable. If they<br />
are, they need to be part of the <strong>in</strong>itial build<strong>in</strong>g concept and must comply with<br />
the architect’s design needs as well as the eng<strong>in</strong>eer’s functional ones.<br />
Reasons for want<strong>in</strong>g to use PVs <strong>in</strong>clude:<br />
• Supply<strong>in</strong>g on site all or, more likely, a portion of the annual electrical<br />
requirement of the build<strong>in</strong>g <strong>in</strong> order to reduce runn<strong>in</strong>g costs.<br />
• Supply<strong>in</strong>g the maximum power demand, or, more probably, some<br />
fraction of it.<br />
• Mak<strong>in</strong>g a contribution to the environment.<br />
• Mak<strong>in</strong>g a statement about <strong>in</strong>novative architectural and eng<strong>in</strong>eer<strong>in</strong>g<br />
design.<br />
• Us<strong>in</strong>g them as a demonstration or educational project.<br />
The use of PVs should be part of the overall energy strategy for the build<strong>in</strong>g.<br />
Each project needs careful thought as the PV area required can vary<br />
enormously accord<strong>in</strong>g to the desired goal.<br />
PVs are worth consider<strong>in</strong>g if the follow<strong>in</strong>g key factors are right:<br />
• Location: The solar radiation at the site is important and the build<strong>in</strong>g<br />
on the site needs to have good access to it.<br />
• Usage: The build<strong>in</strong>g type should have an electrical requirement that<br />
means that much of the output from the <strong>in</strong>stallation can be used on<br />
site.<br />
• <strong>Design</strong>: PVs will affect the form and aesthetics - the community, the<br />
client and the designers all need to be satisfied with the result.<br />
15
16<br />
3.3 Site considerations<br />
In brief, the more solar radiation and the more uniform the radiation is on the<br />
array, the better. The location of the site is obviously of importance -<br />
generally, as one goes farther north there is less solar energy available<br />
(Figure 2.13). Ed<strong>in</strong>burgh receives about 90% of the annual amount of solar<br />
energy received <strong>in</strong> London.<br />
The topography of the site should be studied. The local w<strong>in</strong>d regime should<br />
be considered as part of the strategy for ventilat<strong>in</strong>g the build<strong>in</strong>g. The matter<br />
is complex because <strong>in</strong> the w<strong>in</strong>ter a microclimate with low w<strong>in</strong>d speeds is to<br />
be preferred as it reduces heat loss due to <strong>in</strong>filtration. In the summer, some<br />
w<strong>in</strong>d is preferable as it can improve comfort dur<strong>in</strong>g the day, assist night-time<br />
cool<strong>in</strong>g, and depend<strong>in</strong>g on the design, improve PV performance by reduc<strong>in</strong>g<br />
the temperature of the PV panels (see below). The art is <strong>in</strong> achiev<strong>in</strong>g the right<br />
balance.<br />
It is desirable to have a site with as little shad<strong>in</strong>g by hills and other<br />
geographical features as possible as this reduces the electrical output.<br />
Overshadow<strong>in</strong>g by trees is to be similarly avoided wherever feasible.<br />
Because of the way PV modules are wired, shadow<strong>in</strong>g from any source can<br />
have what might seem to be a disproportionate effect. This is expla<strong>in</strong>ed <strong>in</strong><br />
more detail <strong>in</strong> Appendix A. The implications for the architectural design are<br />
that obstructions are to be avoided wherever possible, whether they are<br />
telephone poles, chimneys, trees, other build<strong>in</strong>gs or even other parts of the<br />
array itself. Where shad<strong>in</strong>g is unavoidable careful selection of components<br />
and configuration of the array can help m<strong>in</strong>imise losses.<br />
In urban areas overshadow<strong>in</strong>g by other build<strong>in</strong>gs is common. Figure 3.1 gives a<br />
very approximate estimate of losses due to shad<strong>in</strong>g. Computer programmes<br />
are available to assist <strong>in</strong> analys<strong>in</strong>g these losses<br />
Self-shad<strong>in</strong>g due to the architectural form should also be avoided. Figure 3.2<br />
<strong>in</strong>dicates a few strategies to adopt.<br />
Orientation is important but there is some flexibility for designers. It is<br />
desirable to locate the build<strong>in</strong>g on the site so that it is approximately with<strong>in</strong><br />
±20 0 of due south; this will permit collection of about 95% or more of the<br />
energy available at a variety of tilt angles (Figure 2.14); with<strong>in</strong> ±30 0 of due<br />
south, the figure drops slightly. The pr<strong>in</strong>cipal difference between a surface<br />
orientated 15 0 east of south and 15 0 west of south is <strong>in</strong> the period of time the<br />
radiation is received rather than its total amount.<br />
3.4 Build<strong>in</strong>g type<br />
Currently <strong>in</strong> the UK PV electricity is more expensive than that from the grid.<br />
Thus, given a build<strong>in</strong>g-<strong>in</strong>tegrated PV <strong>in</strong>stallation, us<strong>in</strong>g as much of the energy<br />
<strong>in</strong> the build<strong>in</strong>g makes more f<strong>in</strong>ancial sense than export<strong>in</strong>g to the grid. The<br />
amount of PV energy usable on site is related to the size of the array and the<br />
magnitude and pattern of the demand (Chapter 4).<br />
A wide range of build<strong>in</strong>g types from offices to hotels to <strong>in</strong>dustrial build<strong>in</strong>gs<br />
can use PVs. Office blocks have good PV potential because their electricity<br />
demand is significant year-round (<strong>in</strong>clud<strong>in</strong>g the summer) and because demand<br />
is highest between 9am and 5pm. Thus, the match between demand and PV<br />
supply is good.<br />
Houses, on the other hand, are <strong>in</strong> use <strong>in</strong> some way seven days a week but<br />
tend to use energy day and night. Nonetheless, there are likely to be<br />
<strong>in</strong>dividuals (and, perhaps, electricity suppliers) <strong>in</strong>terested <strong>in</strong> their PV potential.<br />
Commercial and <strong>in</strong>dustrial build<strong>in</strong>gs with large roof areas available also offer<br />
significant scope for PVs.
Figure 3.1<br />
Shad<strong>in</strong>g effects by neighbour<strong>in</strong>g<br />
build<strong>in</strong>gs<br />
Figure 3.2<br />
Self-shad<strong>in</strong>g considerations<br />
17
18<br />
Figure 3.3<br />
Electrical energy demand of the<br />
BRE Environmental Build<strong>in</strong>g<br />
Figure 3.4<br />
Domestic electrical demands and<br />
PV outputs<br />
a)<br />
Energy consumption, of course, varies with both type and the <strong>in</strong>dividual<br />
build<strong>in</strong>g, so a design team will need to carry out a prelim<strong>in</strong>ary build<strong>in</strong>gspecific<br />
analysis. Table 3.1 gives some <strong>in</strong>dicative electrical energy demands.<br />
Table 3.1<br />
Annual approximate electrical energy requirement<br />
Build<strong>in</strong>g Electrical energy requirement<br />
kWh/m 2 /y<br />
1. BRE Environmental Build<strong>in</strong>g (1)<br />
2. Good Practice Office Build<strong>in</strong>g<br />
36<br />
(non-air-conditioned; open plan) (2) 53<br />
3. Low-energy House (3) 15-25<br />
4. Schoola 20<br />
a. Estimated from data <strong>in</strong> reference 4; based on 1660 hours <strong>in</strong> use per year<br />
Figure 3.3 shows the electrical load pattern for the very energy-efficient BRE<br />
Environmental Build<strong>in</strong>g which was designed to improve on ‘best practice’ by<br />
30%. The build<strong>in</strong>g is not air-conditioned and the load is slightly higher <strong>in</strong><br />
‘w<strong>in</strong>ter’ than <strong>in</strong> summer because of the need to run additional plant such as<br />
heat<strong>in</strong>g pumps.<br />
Figure 3.4(a) shows a representative annual load pattern for a house (with<br />
non-electric heat<strong>in</strong>g) and the output from a 1.8kWp PV <strong>in</strong>stallation. Figure<br />
3.4(b) looks at a representative daily power demand pattern for a fiveperson<br />
household (no two households are identical) and compares it with the<br />
output from a 3kWp PV <strong>in</strong>stallation. Power is the product of current and<br />
b)
voltage and is the load at a moment <strong>in</strong> time - th<strong>in</strong>k of a 100W bulb, for<br />
example. Energy is the product of power and time. A 1kW load which is on<br />
for 1 hour will consume 1kWh of energy. We are all familiar with this from our<br />
domestic electricity (energy) bills.<br />
Note the variability of the daily load (due <strong>in</strong> part to some appliances with<br />
high power requirements be<strong>in</strong>g used but only for short periods) and the<br />
significant even<strong>in</strong>g demand when the PV output is negligible.<br />
Figure 3.5 shows the electrical load pattern for a junior and <strong>in</strong>fant school<br />
with 300 pupils compared with the predicted output from a 440m 2 PV array.<br />
The school has a very low <strong>in</strong>stalled light<strong>in</strong>g load (12W/m 2 ). Note the much<br />
lower electricity consumption <strong>in</strong> August dur<strong>in</strong>g school holidays.<br />
If the site has good solar exposure and if the demand and supply pattern are<br />
reasonably matched, the design is developed further.<br />
3.5 <strong>Design</strong> and construction<br />
A brief guides (or effectively constra<strong>in</strong>s) the design process. A certa<strong>in</strong> amount<br />
of floor area will need to be located on a particular site, access to daylight<br />
will be required <strong>in</strong> many of the spaces, costs will limit floor-to-ceil<strong>in</strong>g heights,<br />
and so forth. An ‘image’ of the build<strong>in</strong>g usually results from the brief.<br />
For example, a brief that made no reference to PVs but called for a typical<br />
low-energy design suitable, for example, for suburban offices, might result <strong>in</strong><br />
the build<strong>in</strong>g sketched <strong>in</strong> Figure 3.6. One feature of it, and almost every other<br />
build<strong>in</strong>g is that it uses solar energy - for daylight<strong>in</strong>g throughout the year and<br />
as passive solar ga<strong>in</strong> <strong>in</strong> the w<strong>in</strong>ter. What PVs do is provide an additional use<br />
of the sun’s energy to produce electricity.<br />
Now, if the question, “What difference do PVs make?” were asked, what<br />
would the response be?<br />
Firstly, <strong>in</strong> construction terms, build<strong>in</strong>g-<strong>in</strong>tegrated PV systems need to play the<br />
same role as the traditional wall and roof<strong>in</strong>g cladd<strong>in</strong>g elements they replace.<br />
Consequently, they must address all the normal issues, for example:<br />
• Appearance.<br />
• Weather tightness and protection from the elements.<br />
• W<strong>in</strong>dload<strong>in</strong>g.<br />
• Lifetime of materials and risks and consequences of failure.<br />
• Safety (construction, fire, electrical, etc.).<br />
• Cost.<br />
Figure 3.5<br />
Electrical demand and PV output for a<br />
school<br />
19
20<br />
Figure 3.6<br />
Low-energy design without PVs<br />
In addition, there are a number of more particular aspects, often associated<br />
with be<strong>in</strong>g able to use the electricity produced, namely:<br />
• Avoidance of self shad<strong>in</strong>g (as mentioned above).<br />
• Heat generation and ventilation.<br />
• Provision of accessible routes for connectors and cables (discussed <strong>in</strong><br />
Chapter 5).<br />
• Ma<strong>in</strong>tenance (discussed <strong>in</strong> Chapter 5).<br />
As PVs can have a marked impact on a build<strong>in</strong>g's appearance it is important<br />
to consult with the plann<strong>in</strong>g authorities at an early stage to obta<strong>in</strong> their views<br />
on the proposals.<br />
If we look at heat generation and ventilation there are three aspects of<br />
particular <strong>in</strong>terest:<br />
1. The effect of potentially high temperatures.<br />
2. The desirability of ventilat<strong>in</strong>g the back of the modules to improve<br />
efficiency.<br />
3. The possible use of the heat from the back of the modules.<br />
Potentially high temperatures<br />
The potentially high temperatures associated with build<strong>in</strong>g elements<br />
specifically designed to capture the sun’s radiation need careful<br />
consideration. The lifetime of materials, thermal movement, temperature<br />
cycl<strong>in</strong>g, suitability of electrical cables <strong>in</strong> high temperatures and so on need<br />
to be thought about carefully. In general, as long as the heat from PV modules<br />
does not build up and is removed by ventilation (normally, natural ventilation),<br />
there should not be a problem. As mentioned <strong>in</strong> Chapter 2, <strong>in</strong> conditions of<br />
high radiation, say 700-750W/m 2 , modules can reach up to 40 0 C above<br />
ambient, say 70 0 C (5), but this will obviously depend on module design and<br />
build<strong>in</strong>g context. Higher temperatures can, however, occur (6) and this should<br />
be discussed with the manufacturers when consider<strong>in</strong>g modules.
Ventilation and modules<br />
Chapter 2 also po<strong>in</strong>ted out the importance of adequate ventilation to keep<br />
the temperatures as low as possible to improve module performance.<br />
There are many ways of do<strong>in</strong>g this, vary<strong>in</strong>g from ventilation gaps <strong>in</strong><br />
ra<strong>in</strong>screen cladd<strong>in</strong>g (discussed below) to comb<strong>in</strong><strong>in</strong>g the module ventilation<br />
with the build<strong>in</strong>g ventilation (Chapter 6). A rule of thumb is to provide an air<br />
gap of 100mm (7). However, at least one study <strong>in</strong>dicates that performance is<br />
improved with gaps up to 200mm or more (8).<br />
Use of the module heat<br />
The heat given off at the back of the panels (Figure 2.18) is potentially of<br />
value dur<strong>in</strong>g the heat<strong>in</strong>g season. It is possible to use it directly or to recover<br />
it by a system of duct<strong>in</strong>g - both a prototype ventilated facade (9) and a<br />
demonstration build<strong>in</strong>g have done this (10). However, an important question<br />
rema<strong>in</strong>s about the economical viability of do<strong>in</strong>g so. This is particularly the<br />
case for highly energy-efficient build<strong>in</strong>gs which often have very low space<br />
heat<strong>in</strong>g demands. (Such an office, when <strong>in</strong> operation dur<strong>in</strong>g the day, may<br />
need no additional heat other than that from the occupants and other casual<br />
ga<strong>in</strong>s at external temperatures above 8 0 C or 9 0 C.) Obviously the simplest,<br />
least expensive ways of us<strong>in</strong>g the heat from the back of the PVs are most<br />
likely to be viable and to be adopted.<br />
Other possibilities of us<strong>in</strong>g the waste heat also exist. For example, PV panels<br />
could <strong>in</strong>corporate water pipes l<strong>in</strong>ked to space or domestic hot water<br />
systems but such other possibilities tend to be of greater cost and<br />
complexity.<br />
Outside the heat<strong>in</strong>g season, or more precisely anytime the heat is not<br />
needed, it is important that it does not cause overheat<strong>in</strong>g and contribute to<br />
the build<strong>in</strong>g’s cool<strong>in</strong>g load. This requires consideration of the ventilation<br />
patterns <strong>in</strong> the build<strong>in</strong>g and thought should be given to ensur<strong>in</strong>g that <strong>in</strong> w<strong>in</strong>dy<br />
conditions <strong>in</strong> summer heat from the modules does not lead to discomfort.<br />
3.6 Forms and systems<br />
Cont<strong>in</strong>u<strong>in</strong>g with the effect of <strong>in</strong>troduc<strong>in</strong>g PVs <strong>in</strong>to the brief, the next step might<br />
be to consider the design options.<br />
There are three basic ways of <strong>in</strong>tegrat<strong>in</strong>g PVs <strong>in</strong> build<strong>in</strong>gs:<br />
• Roof-based systems.<br />
• Facade systems.<br />
• Sunshades and sunscreens.<br />
Figure 3.7 shows a number of these; non-<strong>in</strong>tegrated options such as PVs on<br />
<strong>in</strong>dependent frames on roofs and PVs on walkways and other ancillary<br />
structures are not covered here but, obviously, much of this <strong>Guide</strong> is also<br />
applicable to them.<br />
The path to successful design lies between PVs impos<strong>in</strong>g too great a<br />
constra<strong>in</strong>t on the build<strong>in</strong>g and simply tack<strong>in</strong>g PVs on to a form (most likely a<br />
box) that has already been designed. Real build<strong>in</strong>gs have forms and angles<br />
that need to respond to more than the PV array output and this needs to be<br />
acknowledged <strong>in</strong> develop<strong>in</strong>g the design.<br />
21
22<br />
Figure 3.7<br />
Build<strong>in</strong>g-<strong>in</strong>tegrated PVs<br />
a) Incl<strong>in</strong>ed roof<br />
b) Roof with <strong>in</strong>tegrated tiles<br />
c) Saw-toothed north light roof<br />
d) Curved roof/wall
Figure 3.7 (cont<strong>in</strong>ued)<br />
e) Atrium<br />
f) Vertical<br />
g) Vertical with w<strong>in</strong>dows<br />
23
24<br />
Figure 3.7 (cont<strong>in</strong>ued)<br />
h) Incl<strong>in</strong>ed PVs with w<strong>in</strong>dows<br />
i) Incl<strong>in</strong>ed wall with w<strong>in</strong>dows<br />
j) Fixed sunshades<br />
k) Moveable sunshades<br />
Notes:<br />
PVs are <strong>in</strong>dicated by thick dark l<strong>in</strong>es<br />
Semi-transparent PVs are <strong>in</strong>dicated by broken thick dark l<strong>in</strong>es
3.6.1 Roof-based systems<br />
Roofs have a number of attractions as sites for PVs:<br />
• They are often free from over-shadow<strong>in</strong>g.<br />
• The roof slope can be selected for high performance (Figure 2.14).<br />
• It may be easier to <strong>in</strong>tegrate PVs aesthetically and functionally <strong>in</strong>to a<br />
roof than a wall.<br />
Table 3.2 lists the ma<strong>in</strong> systems available.<br />
Table 3.2<br />
Roof systems<br />
Position of PVs System Characteristic<br />
1. Incl<strong>in</strong>ed roof a. PV roof panels Comb<strong>in</strong>ed with roof<br />
structural system.<br />
b. PV roof tiles Roof tiles are familiar<br />
products and are likely<br />
to f<strong>in</strong>d easy acceptance.<br />
2. Saw-tooth north light roofs a. PV panels Allow daylight<strong>in</strong>g.<br />
3. Curved roof a. Opaque PV Extends design<br />
flexible substrate possibilities.<br />
(sheet metal or<br />
synthetic material)<br />
or rigid modules<br />
arranged on a<br />
curve<br />
4. Atrium a. PV roof panels As for the <strong>in</strong>cl<strong>in</strong>ed roof.<br />
Variations <strong>in</strong>clude partglaz<strong>in</strong>g,<br />
part-opaque PVs<br />
and semi-transparent PVs.<br />
Note that saw-toothed roofs represent a family of designs. The most<br />
common has a north-fac<strong>in</strong>g vertical glazed surface for daylight<strong>in</strong>g. Another<br />
design <strong>in</strong> the family is transparent PV skylights set <strong>in</strong>to a ‘flat’ roof.<br />
Ventilat<strong>in</strong>g roof systems<br />
Roof systems are likely to be easier to ventilate than facade systems and<br />
any unwanted heat ga<strong>in</strong>s, be<strong>in</strong>g above the occupancy height, are likely to<br />
have less effect than for facade systems.<br />
For <strong>in</strong>cl<strong>in</strong>ed roof designs one approach is to have a subframe for mount<strong>in</strong>g<br />
the PV modules onto the roof structure. This is shown <strong>in</strong> Figure 3.8. This allows<br />
an air space (100mm if possible) between the modules and the roof structure<br />
(which <strong>in</strong>corporates the <strong>in</strong>sulation). For many saw-toothed roof designs,<br />
open<strong>in</strong>g north lights can take away the heat.<br />
Figure 3.8<br />
Ventilated PV roof<br />
25
26<br />
Figure 3.9<br />
Curta<strong>in</strong> wall<strong>in</strong>g detail<br />
Note: cable conta<strong>in</strong>ment strategy shown here is<br />
normally only used where system voltage are less<br />
than 120V.<br />
3.6.2 Facade systems<br />
Facades have significant potential. Much PV cladd<strong>in</strong>g can be considered to<br />
be panes of glass to which PV cells are applied and so the extensive<br />
experience of glazed facades can be built upon. In addition, modules can be<br />
easily <strong>in</strong>corporated <strong>in</strong>to other proven systems such as ra<strong>in</strong>-screen cladd<strong>in</strong>g.<br />
Table 3.3 lists the ma<strong>in</strong> systems available.<br />
Table 3.3<br />
Facade systems<br />
Position of PVs System Characteristics and comments<br />
Vertical wall Curta<strong>in</strong> wall<strong>in</strong>g Standard, economical construction.<br />
PVs can be mixed, ie some be<strong>in</strong>g<br />
opaque and some semi-transparent.<br />
Vertical wall Ra<strong>in</strong>screen Ra<strong>in</strong>screen designs <strong>in</strong>corporate a<br />
cladd<strong>in</strong>g ventilation gap which is<br />
advantageous <strong>in</strong> gett<strong>in</strong>g rid of heat;<br />
the gap can also be used for runn<strong>in</strong>g<br />
cables.<br />
Vertical wall Glaz<strong>in</strong>g or PV efficiency improved.<br />
with <strong>in</strong>cl<strong>in</strong>ed PVs ra<strong>in</strong>screen Complexity of construction<br />
cladd<strong>in</strong>g <strong>in</strong>creased.<br />
Potential to provide shad<strong>in</strong>g of<br />
w<strong>in</strong>dows (if desired) but a degree<br />
of self-shad<strong>in</strong>g.<br />
Incl<strong>in</strong>ed wall Glaz<strong>in</strong>g Potentially enhanced architectural<br />
<strong>in</strong>terest.<br />
PV output is improved compared<br />
with a vertical wall.<br />
Less efficient use of build<strong>in</strong>g floor<br />
area.<br />
Fixed sunshades Glaz<strong>in</strong>g Can enhance architectural <strong>in</strong>terest.<br />
Entails a loss of daylight.<br />
Moveable sunshades Glaz<strong>in</strong>g Can enhance architectural <strong>in</strong>terest.<br />
Entails some loss of light but less<br />
than with fixed shades.<br />
Increased PV output compared with<br />
all fixed systems.<br />
Curta<strong>in</strong> wall<strong>in</strong>g systems<br />
Curta<strong>in</strong> wall<strong>in</strong>g systems are a well-established technology used <strong>in</strong> numerous<br />
prestige projects such as city centre offices. The mullion/transom stick<br />
system is the most common. Vision areas are normally double-glazed and<br />
non-vision areas are either opaque glass or <strong>in</strong>sulated metal panels. PV<br />
modules can be <strong>in</strong>corporated easily as factory-assembled double-glazed<br />
units. The outer pane might be lam<strong>in</strong>ated glass-PV-res<strong>in</strong>-glass and the <strong>in</strong>ner<br />
pane, glass, with a sealed air gap between; the overall thickness of the<br />
module would typically be under 30mm.<br />
Numerous design options are available. For example, a facade could consist<br />
of a comb<strong>in</strong>ation of glazed areas for vision and opaque PV panels or it could<br />
have PV modules with opaque areas and transparent ones (as <strong>in</strong> Figure 1.2).<br />
Careful consideration needs to be given to the junction box positions and<br />
cable route<strong>in</strong>g. Figure 3.9 shows a representative detail.
Ra<strong>in</strong>screen cladd<strong>in</strong>g systems<br />
Ra<strong>in</strong>screen cladd<strong>in</strong>g systems normally consist of panels (often coated<br />
alum<strong>in</strong>ium) set slightly off from the build<strong>in</strong>g (on, for example, cladd<strong>in</strong>g rails) to<br />
allow for dra<strong>in</strong>age and ventilation. As such they are very suitable for PV<br />
<strong>in</strong>tegration. The ventilation gap (which needs to be adequate, eg 100mm or<br />
more if possible, and unobstructed) has the beneficial effect of reduc<strong>in</strong>g<br />
temperatures, thus enhanc<strong>in</strong>g performance; it also provides space for cable<br />
routes. Figure 3.10 shows typical arrangements.<br />
3.7 What difference do PVs make?<br />
Hav<strong>in</strong>g reviewed the various systems, we can now return to the question of<br />
‘What difference do PVs make to build<strong>in</strong>g design?’<br />
The ma<strong>in</strong> po<strong>in</strong>ts to address are:<br />
• Orientation.<br />
• Footpr<strong>in</strong>t.<br />
• Facade.<br />
• Section.<br />
A build<strong>in</strong>g orientated to the south for daylight<strong>in</strong>g, passive solar ga<strong>in</strong> and free<br />
of overshad<strong>in</strong>g is em<strong>in</strong>ently suitable for PVs. Similarly, a footpr<strong>in</strong>t with the<br />
long axis runn<strong>in</strong>g east-west thus giv<strong>in</strong>g a large south-fac<strong>in</strong>g wall area and<br />
potentially a large south-fac<strong>in</strong>g roof is advantageous for PVs.<br />
The facade is more complex. First, note that <strong>in</strong> many ways a wall is simply a<br />
roof rotated by about 90 0 and many of the issues are the same as shown <strong>in</strong><br />
Figure 3.11. Another important po<strong>in</strong>t is that the solar ga<strong>in</strong> through w<strong>in</strong>dows and<br />
rooflights is immediately beneficial (provided, of course, that it does not<br />
cause any problems, such as overheat<strong>in</strong>g).<br />
The key po<strong>in</strong>t is that <strong>in</strong> both elements, vary<strong>in</strong>g requirements compete for the<br />
available surface area and thus conflicts arise. How much of a south facade<br />
should be glazed for daylight<strong>in</strong>g and how much allocated to PV modules?<br />
Should a roof be all PV panels? Or none? Or someth<strong>in</strong>g <strong>in</strong> between?<br />
Figure 3.10<br />
Ra<strong>in</strong>screen cladd<strong>in</strong>g<br />
Figure 3.11<br />
Analogy between facades and roofs<br />
27
28<br />
Figure 3.12<br />
<strong>Design</strong> considerations for saw-tooth<br />
northlight roofs<br />
Figure 3.13<br />
The effect of PVs on the design of a lowenergy<br />
office build<strong>in</strong>g<br />
Figure 3.12 illustrates some of these considerations us<strong>in</strong>g a saw-tooth<br />
northlight roof as an example.<br />
In practice the conflicts are resolved dur<strong>in</strong>g development of the design and<br />
the solutions are build<strong>in</strong>g-specific and relate back to the brief. For example,<br />
one reason a south-fac<strong>in</strong>g facade is unlikely to be 100% glazed is that it<br />
would probably lead to overheat<strong>in</strong>g (or high energy consumption for cool<strong>in</strong>g)<br />
<strong>in</strong> summer. Low-energy offices, for example, have approximately 30-45% of<br />
the south facade as glaz<strong>in</strong>g. Thus, PVs could readily be used <strong>in</strong> much of the<br />
55-70% of the wall that is normally opaque.<br />
The effect on the section will depend on the size of the PV array and the<br />
system selected. Tak<strong>in</strong>g the easier case of the roof first, if the PVs are roofmounted<br />
the section will tend to offset the east-west ridge to the north and<br />
perhaps vary the roof tilt angle to improve PV performance. The south facade<br />
could rema<strong>in</strong> vertical or might be tilted back.<br />
Figure 3.13 summarises the pr<strong>in</strong>cipal factors for this rather simple study.<br />
Obviously, it only touches on the issues.
KEY POINTS<br />
1. PVs need to be considered as an <strong>in</strong>tegral part of the energy strategy<br />
of a build<strong>in</strong>g.<br />
2. Appearance and aesthetics are key issues.<br />
3. PVs make a positive contribution to the environment.<br />
4. It is essential that shad<strong>in</strong>g (by topographical features, other build<strong>in</strong>gs,<br />
or features of the PV build<strong>in</strong>g itself) be m<strong>in</strong>imised so as not to impair<br />
performance.<br />
5. There should be a good match between the build<strong>in</strong>g’s energy demand<br />
pattern and the energy available from the PV array.<br />
6. PV modules need to be adequately ventilated so as to lower<br />
temperatures and thus ma<strong>in</strong>ta<strong>in</strong> good performance.<br />
7. There are a wide range of architectural ways of successfully<br />
<strong>in</strong>tegrat<strong>in</strong>g PVs with build<strong>in</strong>gs and, <strong>in</strong> particular, roof and facade<br />
systems.<br />
8. PVs can affect the orientation, the footpr<strong>in</strong>t, the facade and the section<br />
of build<strong>in</strong>gs.<br />
29
30<br />
REFERENCES<br />
1. Anon, (1995), A Performance Specification for the Energy Efficient<br />
Office of the Future. BRECSU, BRE, Watford.<br />
2. Anon, (1991), BRECSU Energy Efficiency <strong>in</strong> Offices. Energy Consumption<br />
<strong>Guide</strong> 19. BRECSU, BRE, Watford.<br />
3. Anon, (1996), Review of Ultra-Low-Energy <strong>Home</strong>s. DoE General<br />
Information Report 39. BRECSU, BRE, Watford.<br />
4. Anon, (1991), Energy Audits and Surveys. AM5.CIBSE, London.<br />
5. IT Power, (1996), Development of Photovoltaic Cladd<strong>in</strong>g Systems. ETSU<br />
S/P2/002161/REP, p.84. ETSU: Harwell.<br />
6. Ibid, p.21.<br />
7. Sick, F. and Erge, T. (Eds), (1996), <strong>Photovoltaics</strong> <strong>in</strong> Build<strong>in</strong>gs, p.28, James<br />
and James, London.<br />
8. Br<strong>in</strong>kworth, B.J., Cross, B.M., Marshall, R.H and Yang, H., (1997), Thermal<br />
Regulation of Photovaltaic Cladd<strong>in</strong>g. Solar Energy, 61 (3), pp.169-178.<br />
9. IT Power, (1996), Development of Photovoltaic Cladd<strong>in</strong>g Systems. ETSU<br />
S/P2/00216/REP. ETSU: Harwell.<br />
10. Anon, (1998), G8 Solar Showcase. Renewable Energy World 1 (1), p.58.<br />
FURTHER READING<br />
Studio E Architects, (1997), Evaluation Criteria for the Review of PV-<br />
Integrated Build<strong>in</strong>g Projects <strong>in</strong> the UK. ETSU S/P2/00267/REP. ETSU:<br />
Harwell.
4<br />
Costs and siz<strong>in</strong>g<br />
4.1 Introduction<br />
This chapter discusses the <strong>in</strong>ter-related issues of costs and siz<strong>in</strong>g.<br />
4.2 Costs<br />
In theory a PV <strong>in</strong>stallation can be sized and the cost calculated afterwards,<br />
much as eng<strong>in</strong>eers might size a heat<strong>in</strong>g system which is <strong>in</strong>dispensable for a<br />
build<strong>in</strong>g. However, because PVs are an option and <strong>in</strong> the case of build<strong>in</strong>g<strong>in</strong>tegrated,<br />
grid-connected systems, the grid supply is always available (and<br />
currently at a lower unit price), siz<strong>in</strong>g and cost<strong>in</strong>g <strong>in</strong> practice proceed<br />
iteratively. Thus, before look<strong>in</strong>g at determ<strong>in</strong><strong>in</strong>g the area of PV array we will<br />
exam<strong>in</strong>e some basic costs.<br />
A major attraction of build<strong>in</strong>g-<strong>in</strong>tegrated PVs is that the cost of the elements<br />
they replace can be offset aga<strong>in</strong>st the PV cost. How significant is this? Table<br />
4.1 gives data for various conventional systems.<br />
Table 4.1<br />
Approximate costs of conventional systems (<strong>in</strong>stalled)<br />
Wall systems £/m 2<br />
• Cavity wall (brick exterior, block <strong>in</strong>terior) 50-60 (1 )<br />
• Ra<strong>in</strong>screen overcladd<strong>in</strong>g (steel) 190 (2)<br />
• Stone cladd<strong>in</strong>g 300 (2)<br />
• Double glaz<strong>in</strong>g cladd<strong>in</strong>g system 350 (2)<br />
• Granite-faced precast concrete cladd<strong>in</strong>g 640 (2)<br />
• Polished stone cladd<strong>in</strong>g 850-1500 (3)<br />
Roof systems<br />
• Roof<strong>in</strong>g tiles (concrete or clay) 32 (1 )<br />
• Alum<strong>in</strong>ium pitched roof 44 (1 )<br />
In comparison with these figures, Table 4.2 gives typical costs for a number<br />
of PV systems. Note that these are approximate and that lower costs can be<br />
achieved.<br />
Table 4.2<br />
Approximate costs of PV cladd<strong>in</strong>g systems a, b (<strong>in</strong>stalled) (4)<br />
Wall systems £/m 2<br />
• Ra<strong>in</strong>screen cladd<strong>in</strong>g systems 600<br />
• Curta<strong>in</strong> wall<strong>in</strong>g us<strong>in</strong>g glass/glass modules 780<br />
Roof systems<br />
• PV roof<strong>in</strong>g tiles for a hous<strong>in</strong>g estate 500<br />
• PV modules on a pitched roof of a large office 650<br />
a. Based on crystall<strong>in</strong>e silicon technology.<br />
b. Balance of system (BOS) costs are <strong>in</strong>cluded <strong>in</strong> the figures.<br />
31
32<br />
Figure 4.1<br />
Approximate cost breakdown of a PV<br />
<strong>in</strong>stallation (approximate size 40kWp)<br />
Figure 4.2<br />
Cost breakdown of a 2kWp<br />
<strong>in</strong>stallation for a s<strong>in</strong>gle house<br />
The breakdown of the total costs of the systems <strong>in</strong> Table 4.2 depends on the<br />
system but is roughly as shown <strong>in</strong> Figure 4.1.<br />
Crystall<strong>in</strong>e PV arrays (un<strong>in</strong>stalled) might cost between £320-480/m 2 (5).<br />
The Power Condition<strong>in</strong>g Unit (PCU) is a major element of the balance of<br />
system costs. PCUs currently cost <strong>in</strong> the region of £800-1000 (un<strong>in</strong>stalled)<br />
per kW output for 3-5kW systems and less for larger systems due, <strong>in</strong> part, to<br />
economies of scale. For example, a 70kW DC to three phase AC PCU will<br />
have an un<strong>in</strong>stalled cost of about £42,000 or £600 per kW output. This<br />
works out to an un<strong>in</strong>stalled cost of roughly £70/m 2 of crystall<strong>in</strong>e silicon<br />
module.<br />
Meter<strong>in</strong>g is a small element of BOS costs. A simple one-way meter might<br />
cost £200-400 (un<strong>in</strong>stalled); two-way meters (see Chapter 5) will cost <strong>in</strong> the<br />
region of £400-700 (un<strong>in</strong>stalled).<br />
The results of a study that looked at the cost of a one-off 2kWp gridconnected<br />
s<strong>in</strong>gle house are shown <strong>in</strong> Figure 4.2 (6). Costs have fallen<br />
somewhat s<strong>in</strong>ce this work was done but it rema<strong>in</strong>s a useful approximation.<br />
Note the higher percentage cost of the modules compared with Figure 4.1<br />
due, most likely, to the scale of the <strong>in</strong>stallation. Bulk purchas<strong>in</strong>g tends to<br />
significantly reduce module cost and total costs.<br />
In general, PV systems are significantly higher <strong>in</strong> cost than conventional<br />
cladd<strong>in</strong>g systems. In some cases, however, such as a number of stone<br />
cladd<strong>in</strong>g systems of the type used <strong>in</strong> prestige office build<strong>in</strong>gs, PVs could be<br />
used as cost-effective replacements.<br />
Other cost issues, energy saved over the lifetime of the <strong>in</strong>stallation and cost<br />
per kWh are exam<strong>in</strong>ed below.<br />
4.3 Siz<strong>in</strong>g the array<br />
In siz<strong>in</strong>g a grid-connected PV array there are a number of key po<strong>in</strong>ts to keep<br />
<strong>in</strong> m<strong>in</strong>d:<br />
1. On-site use of energy:<br />
For a given <strong>in</strong>stallation the more of the energy that can be used on<br />
site the better; this is pr<strong>in</strong>cipally because, given the current price<br />
differential between PV and grid electricity, us<strong>in</strong>g the energy on site<br />
makes more f<strong>in</strong>ancial sense.<br />
2. Contribution to the overall load:<br />
Siz<strong>in</strong>g is usually on the basis of a contribution to the overall load for<br />
the build<strong>in</strong>g rather than to meet a particular load (eg light<strong>in</strong>g).<br />
3. Contribution to the annual load:<br />
Usually siz<strong>in</strong>g is to determ<strong>in</strong>e the contribution to the total annual load<br />
but one can also consider the contribution to the annual load dur<strong>in</strong>g<br />
daylight hours.<br />
4. Available area:<br />
The available roof and facade area may restrict the array size,<br />
particularly <strong>in</strong> smaller <strong>in</strong>stallations such as houses.<br />
5. Budget:<br />
Often the available budget is the dom<strong>in</strong>ant constra<strong>in</strong>t.
The approach outl<strong>in</strong>ed below is to help designers make broad decisions;<br />
actual siz<strong>in</strong>g is normally done with a computer model (often a PV<br />
manufacturer’s) and real weather data. Given a particular location with its<br />
solar <strong>in</strong>put, a PV module type and a brief for a build<strong>in</strong>g, what is a sensible<br />
size of array and what will its output be? And what are the costs?<br />
Let us exam<strong>in</strong>e a case where the purpose of the PV <strong>in</strong>stallation is to meet a<br />
reasonable percentage of the annual energy demand. In practice, one might<br />
start with a goal of, say, 20-40%; <strong>in</strong> addition, let us assume that most of the<br />
energy provided is to be used on site. Note that it is usually difficult to use<br />
100% of the energy on site because given a vary<strong>in</strong>g demand and a vary<strong>in</strong>g<br />
supply there are likely to be times when supply exceeds demand - a simple<br />
case might be an office build<strong>in</strong>g with its much lower weekend demand. For<br />
our example, we will use a two-storey office build<strong>in</strong>g <strong>in</strong> the London area with<br />
a total floor area of 900m 2 and an extremely low electrical energy<br />
consumption of 32kWh/m 2 /y. The build<strong>in</strong>g is oriented towards the south and<br />
is not overshadowed.<br />
One way of proceed<strong>in</strong>g is as follows:<br />
1. Exam<strong>in</strong>e the pattern of the electrical demand and determ<strong>in</strong>e the<br />
annual electrical energy requirements of the build<strong>in</strong>g. In this case the<br />
base ‘summer’ and ‘w<strong>in</strong>ter’ loads were estimated to be approximately,<br />
15 and 21kW, respectively. (The base w<strong>in</strong>ter load, for example, is<br />
made up of 10W/m 2 for small power, 8W/m 2 for light<strong>in</strong>g and<br />
5W/m 2 for miscellaneous uses). The annual electricity consumption is<br />
28,800kWh/m 2 .<br />
2. Estimate the cost and area very approximately. From our rule of<br />
thumb, a PV <strong>in</strong>stallation with monocrystall<strong>in</strong>e silicon panels on a south<br />
fac<strong>in</strong>g tilted surface might provide 100kWh/m 2 /y and the additional<br />
cost compared with conventional roof<strong>in</strong>g materials at approximately<br />
£50/m 2 might be £600/m 2 . Thus if the goal were to produce as<br />
much electricity as the annual demand, about 288m 2 of array would<br />
be required at an additional cost of about £173,000. The cost of a<br />
non-PV energy-efficient office build<strong>in</strong>g might be £800/m 2 or <strong>in</strong> this<br />
case £720,000. Thus, although the PV cost appears high we are<br />
now armed with a benchmark.<br />
With regard to area, the 288m 2 requirement might be fitted on the<br />
roof or on a comb<strong>in</strong>ation of the south facade and roof.<br />
3. Aim at some fraction of the total requirement. How one might decide<br />
what fraction is discussed below and <strong>in</strong> Chapter 6.<br />
33
34<br />
Figure 4.3<br />
Unit electricity cost<br />
Figure 4.3 shows a graph of the notional unit cost of electricity.<br />
The unit cost of all PV electricity produced falls with <strong>in</strong>creas<strong>in</strong>g array size<br />
because of economies of scale. The cost of the electricity produced and<br />
used on site <strong>in</strong>itially falls (Zone A) because of economies of scale but as the<br />
array size gets larger it is likely that all the electricity cannot be used on site<br />
and so more will be exported. S<strong>in</strong>ce this electricity is not bought back at<br />
cost, the unit price of electricity used on site rises (Zone B).<br />
In practice, the form of the curve and the po<strong>in</strong>t of ‘m<strong>in</strong>imum’ cost will depend<br />
on the specific PV <strong>in</strong>stallation. An approach based on siz<strong>in</strong>g for the ‘m<strong>in</strong>imum’<br />
cost, Cm<strong>in</strong>, could be labelled the IMBY strategy, ie ‘<strong>in</strong> my backyard’, and<br />
represents that of a client adopt<strong>in</strong>g a ‘rational’ approach to their PV<br />
<strong>in</strong>stallation. More altruistic clients who wished to reduce CO 2 emissions for<br />
society as a whole could opt for larger arrays.<br />
A start to a solution is to exam<strong>in</strong>e the load pattern. If we consider a build<strong>in</strong>g<br />
with a somewhat higher base power demand <strong>in</strong> w<strong>in</strong>ter than <strong>in</strong> summer (as is<br />
likely to be the case <strong>in</strong> naturally ventilated offices), then siz<strong>in</strong>g the array to<br />
meet the summer base load will tend to ensure that the w<strong>in</strong>ter output (when<br />
the array output is less) will also be used on site. This is an array size which<br />
will export little energy and so is likely to be <strong>in</strong> Zone A.
If we chose to provide an array that could meet the summer base load of<br />
15kW on a sunny day <strong>in</strong> June at noon, the siz<strong>in</strong>g procedure could be:<br />
1. Determ<strong>in</strong>e the solar irradiation on the array for the proposed azimuth<br />
and tilt, eg due south and 30°, giv<strong>in</strong>g approximately 900W/m 2 (7).<br />
2. Multiply this by the efficiency of the panel, eg 0.15 and then correct<br />
for losses <strong>in</strong> the total system, eg take a factor of 0.75.<br />
Then the approximate power produced is:<br />
or<br />
900 x 0.15 x 0.75 = 101W/m 2<br />
0.10 kW/m 2<br />
3. Divide the summer base load by this figure:<br />
15kW = 150m 2<br />
0.10kW/m 2<br />
As before, the additional cost might be £600/m 2 or approximately £90,000.<br />
Aga<strong>in</strong> this might be considered high but it gives us another benchmark.<br />
Note also that this part of the procedure gives a way of siz<strong>in</strong>g if, for some<br />
reason, a particular load is to be met.<br />
4. At this po<strong>in</strong>t, it might be decided to let a budget dom<strong>in</strong>ate and limit<br />
the cost of the PV <strong>in</strong>stallation, either as a fixed sum, eg £50,000, or<br />
as a proportion of the build<strong>in</strong>g cost, eg 10% of a total build<strong>in</strong>g cost<br />
<strong>in</strong>clud<strong>in</strong>g PVs of £800,000, or £80,000. (NB We will assume this is<br />
based on the actual PV cost of £650/m 2 .)<br />
Choos<strong>in</strong>g the latter, for £80,000 we would have a monocrystall<strong>in</strong>e<br />
PV <strong>in</strong>stallation with approximately 120m 2 of roof panel. (Obviously,<br />
we could have a PV facade or a mixture of the two.) S<strong>in</strong>ce 120m 2 is<br />
less than that required to meet the summer base load we are <strong>in</strong> Zone<br />
A of Figure 4.3. An array of 120m 2 would be approximately 18kWp.<br />
The annual output of this system (referr<strong>in</strong>g to Figure 2.14) would be<br />
approximately:<br />
120m 2 x 1045kWh/m 2 /y x 0.15 x 0.75= 14,000kWh/y<br />
35
36<br />
If a system lifetime of 25 years is assumed (component lifetime is<br />
discussed further <strong>in</strong> Chapter 5), the total output is 350,000kWh.<br />
More detailed analysis would give the output used with<strong>in</strong> the<br />
build<strong>in</strong>g, ie the on site energy sav<strong>in</strong>gs - <strong>in</strong> this case, 75% will be<br />
assumed on the basis of results and predictions from similar build<strong>in</strong>gs.<br />
This gives 10,500kWh/y or 262,500kWh over a 25 year period.<br />
Similarly, further analysis would provide the percentage of the total<br />
annual electrical load provided by the PVs - <strong>in</strong> this case, it would be<br />
about 36%.<br />
For a very simple measure of cost, the capital cost of £80,000 is<br />
divided by the number of kWh, 262,500, giv<strong>in</strong>g £0.30/kWh.<br />
Table 4.3 summarises this and some related data.<br />
Table 4.3<br />
Basic data for a PV <strong>in</strong>stallation<br />
• Build<strong>in</strong>g floor area 900m 2<br />
• PV array area 120m 2<br />
• PV nom<strong>in</strong>al array rat<strong>in</strong>g 18kWp<br />
• Installed cost of the PV system £80,000<br />
• Total annual output of PV-generated electricity 14,000kWh/y<br />
• PV output used with<strong>in</strong> the build<strong>in</strong>g 10,500kWh/y<br />
• Contribution to annual electrical demand 36%<br />
• PV output used with<strong>in</strong> the build<strong>in</strong>g over a 25 year lifetime 262,500kWh<br />
• Simple cost £0.30/kWh<br />
A more detailed analysis is provided <strong>in</strong> the case study of Chapter 6.<br />
It is also possible to do simple straight payback calculations by divid<strong>in</strong>g the<br />
cost of the system by the annual sav<strong>in</strong>gs due to supply<strong>in</strong>g part of the<br />
electricity demand us<strong>in</strong>g PVs. The payback periods, however, are currently<br />
considerably longer than 25 years.
4.4 The future of costs<br />
Generally, given present PV system costs and efficiencies, build<strong>in</strong>g-<strong>in</strong>tegrated<br />
PV systems are not cost-effective. Where PVs replace a range of expensive,<br />
prestige cladd<strong>in</strong>g, they are expected to be cost-effective after the year<br />
2005; if supportive polices are <strong>in</strong>troduced, PV-<strong>in</strong>tegrated build<strong>in</strong>gs are<br />
expected to become commercial realities by 2010 (8). The op<strong>in</strong>ion of the<br />
<strong>in</strong>dustry is that build<strong>in</strong>g-<strong>in</strong>tegrated PV systems will achieve wider economic<br />
viability between 2010 and 2020 (9).<br />
Costs have fallen significantly over the past 10-15 years and are expected to<br />
cont<strong>in</strong>ue to do so. The driv<strong>in</strong>g forces for this <strong>in</strong>clude:<br />
1. Increased module efficiencies. For example, efficiencies of crystall<strong>in</strong>e<br />
silicon modules are expected to <strong>in</strong>crease by one quarter between<br />
now and 2010 (10).<br />
2. Development of lower-cost th<strong>in</strong> film and other technologies.<br />
3. Lower production costs as a volume market leads to, for example,<br />
improved manufactur<strong>in</strong>g techniques and starts to drive costs down.<br />
4. Reduced system costs. For example, the costs of components such as<br />
PCUs are expected to fall.<br />
5. Reduced <strong>in</strong>stallation costs as the market develops and experience is<br />
ga<strong>in</strong>ed.<br />
In the meantime, PVs <strong>in</strong> build<strong>in</strong>gs provide direct environmental advantages<br />
and also serve as a statement of environmental <strong>in</strong>terest.<br />
An important environmental benefit is a reduction <strong>in</strong> CO2 emissions. In the<br />
example above, which can be taken as representative, each square metre of<br />
PV panel will avoid approximately 1800kg of CO2 emissions over a 25 year<br />
lifetime. (This <strong>in</strong>cludes the CO2 emissions avoided by exported energy.) At<br />
present, it is difficult to add CO2 emissions and money, but that situation<br />
could change.<br />
37
38<br />
KEY POINTS<br />
1. The cost of PVs can be offset aga<strong>in</strong>st the cost of the build<strong>in</strong>g<br />
elements they replace. Nonetheless, PV costs are presently high.<br />
2. Siz<strong>in</strong>g a PV <strong>in</strong>stallation tends to be an iterative process <strong>in</strong> which<br />
energy requirements, area available and costs are exam<strong>in</strong>ed.<br />
3. PV electricity replaces conventionally-generated power and so<br />
provides an environmental benefit of reduced CO2 emissions. At<br />
present this is difficult to evaluate monetarily.<br />
REFERENCES<br />
1. Davis, Langdon and Everest (Ed.), (1998), Spon’s Architects’ and<br />
Builders’ Price Book. E&FN Spon: London.<br />
2. ECOTEC, ECD and NPAC, (1998), The Value of Electricity Generated<br />
from Photovoltaic Power Systems <strong>in</strong> Build<strong>in</strong>gs. ETSU<br />
S/P2/00279/REP. ETSU: Harwell.<br />
3. Ibid., p. 23.<br />
4. Ibid., p. 23.<br />
5. Ibid., p. Case 2a.wk4.<br />
6 Greenpeace with orig<strong>in</strong>al research by Halcrow Gilbert Associates,<br />
(1996), Build<strong>in</strong>g <strong>Home</strong>s with Solar Power. Greenpeace, London.<br />
7 Solar Radiation data is available from a number of sources <strong>in</strong>clud<strong>in</strong>g<br />
the CIBSE <strong>Guide</strong>.<br />
8. See reference 2, p. 84.<br />
9. See reference 2, p. 52.<br />
10. See reference 2, p. 24.
5<br />
PVs <strong>in</strong> build<strong>in</strong>gs<br />
5.1 Introduction<br />
Hav<strong>in</strong>g determ<strong>in</strong>ed that PVs are suitable, and hav<strong>in</strong>g done an approximate<br />
load analysis and siz<strong>in</strong>g of the array, the designer can move on to select<strong>in</strong>g<br />
the components and develop<strong>in</strong>g their <strong>in</strong>tegration with<strong>in</strong> the build<strong>in</strong>g. This<br />
chapter exam<strong>in</strong>es a number of these aspects of the PV system.<br />
5.2 Grid-connection and meter<strong>in</strong>g<br />
Figure 5.1 shows a grid-connected PV <strong>in</strong>stallation, thus develop<strong>in</strong>g Figure 2.10<br />
<strong>in</strong> more detail. Obviously, it is notional - the actual design will require the<br />
services of electrical eng<strong>in</strong>eers. Note that the <strong>in</strong>clusion and arrangement of<br />
components will also vary with the system and the manufacturers.<br />
Figure 5.1<br />
A grid-connected PV <strong>in</strong>stallation<br />
39
40<br />
Start<strong>in</strong>g with the grid, it is essential to contact the electricity supplier early<br />
on and obta<strong>in</strong> its permission to connect, whether or not any electricity will<br />
be exported to the grid (and similarly whether or not it will be paid for).<br />
Clients with grid-connected PV build<strong>in</strong>gs will need to ensure that the<br />
<strong>in</strong>stallation will cause no safety hazards and will comply with technical<br />
regulations and recommendations, and that the quality of the power will be<br />
acceptable for export to the grid. For example, the grid’s electricity suppliers<br />
are likely to require that, <strong>in</strong> the event of a loss of ma<strong>in</strong>s power, the PV<br />
<strong>in</strong>stallation will close down automatically. This is to give the grid<br />
ma<strong>in</strong>tenance eng<strong>in</strong>eers a dead system on which to carry out repairs. As one<br />
supplier says, their guidel<strong>in</strong>e to customers is that “you must not <strong>in</strong>terfere with<br />
anyone else”.<br />
It is also important to check early on whether the supply authority will pay<br />
for any electricity exported as this has an impact on the economics of the<br />
system (as mentioned <strong>in</strong> Chapter 4). The answer may vary from not pay<strong>in</strong>g at<br />
all to payment of some part of the cost of produc<strong>in</strong>g the electricity. Whether<br />
there will be any significant additional charges for operat<strong>in</strong>g an embedded<br />
generator (ie a private generator connected to the grid) should also be<br />
checked.<br />
Meter<strong>in</strong>g grid-connected systems is an area currently <strong>in</strong> flux as the open<strong>in</strong>g<br />
up of the electricity market leads to changes to supply and meter<strong>in</strong>g<br />
arrangements. Leav<strong>in</strong>g aside the more technical considerations, the basic<br />
options are:<br />
1. One-way meter<strong>in</strong>g:<br />
Meter<strong>in</strong>g on the <strong>in</strong>com<strong>in</strong>g supply and no meter<strong>in</strong>g on the PV output.<br />
2. Two-way meter<strong>in</strong>g with two meters:<br />
One meter for energy imported from the grid and one for energy<br />
exported to it.<br />
3. One meter run two ways:<br />
In a number of countries outside the UK where the buy<strong>in</strong>g and sell<strong>in</strong>g<br />
prices are the same, one meter is used and run backwards when<br />
energy is exported to the grid.<br />
The meter<strong>in</strong>g strategy to adopt will follow from discussions with the supplier.<br />
Meter<strong>in</strong>g is a chang<strong>in</strong>g field - future developments will <strong>in</strong>clude electronic<br />
meters and, <strong>in</strong> 2000, the right for customers to buy meters <strong>in</strong> an open market.<br />
5.3 System considerations<br />
The build<strong>in</strong>g ma<strong>in</strong> switchboard <strong>in</strong> a typical domestic <strong>in</strong>stallation is s<strong>in</strong>gle<br />
phase 230V AC and, <strong>in</strong> larger build<strong>in</strong>gs, three phase 415V AC. Thus, the DC<br />
output of the PV arrays (Figure 5.1) needs to be converted to AC. PV modules<br />
are often at very approximately 12V or 24V (this may <strong>in</strong> fact be 18.5V at<br />
maximum power for a typical monocrystall<strong>in</strong>e module). The modules are<br />
normally connected <strong>in</strong> such a way as to produce a higher voltage from the<br />
array (Figure A.4) with the exact voltage depend<strong>in</strong>g on the system. In<br />
electrical systems, up to 120V DC is def<strong>in</strong>ed as extra low voltage and from<br />
120V to 1500V (between conductors) DC is low voltage. A broad range of<br />
voltages from, say, 50V to over 700V is <strong>in</strong> use <strong>in</strong> build<strong>in</strong>g-<strong>in</strong>tegrated PV<br />
applications. At the BRE Environmental Build<strong>in</strong>g (Figure 5.2) the output from the<br />
2kWp array is a nom<strong>in</strong>al 96V DC. At the Doxford Solar Office, the output<br />
from the 74kWp array is a nom<strong>in</strong>al 350V DC. The choice of voltage is<br />
determ<strong>in</strong>ed by a number of conflict<strong>in</strong>g factors. Higher voltages are favoured<br />
because of lower power losses but lower voltages tend to be safer. Array<br />
configuration, PCU selection and cable selection are also important<br />
considerations.
Power Condition<strong>in</strong>g Units<br />
The PCU shown <strong>in</strong> Figure 5.1 is <strong>in</strong>tegral to the optimal and safe operation of<br />
the PV <strong>in</strong>stallation. In grid-connected systems it is likely to conta<strong>in</strong>:<br />
• An <strong>in</strong>verter for DC to AC conversion.<br />
• A maximum power po<strong>in</strong>t tracker (Appendix A) which may be part of<br />
the <strong>in</strong>verter.<br />
• Protection devices on the DC side.<br />
• Protection devices on the AC side/utility <strong>in</strong>terface.<br />
The <strong>in</strong>verter converts the DC output of the array to an AC which is<br />
compatible with the grid’s voltage, phase, power factor and frequency<br />
characteristics. Inverters can operate over a range of voltages - for example,<br />
at the BRE Environmental Build<strong>in</strong>g the <strong>in</strong>verter is set at a voltage range of 75-<br />
150V DC and converts to 240V 50Hz AC.<br />
Figure 5.1 is a typical s<strong>in</strong>gle <strong>in</strong>verter configuration - other options are shown<br />
schematically <strong>in</strong> Figure 5.3. The choice depends on a number of factors<br />
<strong>in</strong>clud<strong>in</strong>g the module configuration, accessibility, cost, overshadow<strong>in</strong>g, and<br />
plant room plann<strong>in</strong>g.<br />
In Figure 5.3(a) the array has been divided <strong>in</strong>to two halves, or sub-arrays,<br />
each supply<strong>in</strong>g one <strong>in</strong>verter. This can be a way of reduc<strong>in</strong>g DC cabl<strong>in</strong>g losses<br />
but needs to be balanced aga<strong>in</strong>st the cost of two <strong>in</strong>verters rather than one.<br />
In Figure 5.3(b) str<strong>in</strong>g <strong>in</strong>verters are shown. These can similarly help reduce the<br />
amount of DC wir<strong>in</strong>g required for larger <strong>in</strong>stallations and also lead to lower<br />
voltages.<br />
Figure 5.2<br />
PV <strong>in</strong>stallation at the BRE<br />
Environmental Build<strong>in</strong>g<br />
a) Array (left)<br />
b) Power condition<strong>in</strong>g units<br />
(below, left)<br />
Figure 5.3<br />
Alternative <strong>in</strong>verter arrangements<br />
a) Sub-array <strong>in</strong>verters<br />
b) Str<strong>in</strong>g <strong>in</strong>verters<br />
41
42<br />
Correct <strong>in</strong>verter selection is essential because the electrical output of the<br />
system depends greatly on its performance. Given the high capital cost of PV<br />
systems it is important to optimise the value of all components <strong>in</strong>clud<strong>in</strong>g the<br />
<strong>in</strong>verter.<br />
In the UK the <strong>in</strong>stallation will usually be operat<strong>in</strong>g at well below the nom<strong>in</strong>al<br />
array power. An approximate estimate is that the average output dur<strong>in</strong>g<br />
daylight hours might be only 15-20% of the nom<strong>in</strong>al array rat<strong>in</strong>g. Normally an<br />
<strong>in</strong>verter will be selected on the basis of the follow<strong>in</strong>g:<br />
• Rated power: The <strong>in</strong>verter rat<strong>in</strong>g is normally 75-80% of the array<br />
rat<strong>in</strong>g. This is discussed <strong>in</strong> Appendix A.<br />
• Efficiencies: Modern <strong>in</strong>verters can achieve efficiencies of over 90%.<br />
• Self consumption losses: A small amount (say 0.5-4%) of the rated<br />
DC power is needed for the <strong>in</strong>verter to operate.<br />
Inverters may also <strong>in</strong>corporate the utility grid <strong>in</strong>terface and provide an<br />
automatic disconnect feature if the grid supply is lost and automatic restart<br />
after the grid fault is cleared.<br />
Although <strong>in</strong>verters are electronic solid state devices and have no mov<strong>in</strong>g<br />
parts they can produce a humm<strong>in</strong>g noise. This and their need for ventilation<br />
are discussed below.<br />
PV systems (as other electrical systems) have some significant advantages<br />
over water-based solar heat<strong>in</strong>g systems <strong>in</strong> that they are easier to design,<br />
<strong>in</strong>stall, operate and ma<strong>in</strong>ta<strong>in</strong>. In addition, compared to other electrical<br />
systems, PVs with their lack of mov<strong>in</strong>g parts and high reliability of<br />
components require little ma<strong>in</strong>tenance. Ma<strong>in</strong>tenance of the array exterior<br />
simply consists of clean<strong>in</strong>g the glass to remove grime and dust occasionally<br />
as part of a normal build<strong>in</strong>g ma<strong>in</strong>tenance programme.<br />
As with other electrical systems, PVs should be exam<strong>in</strong>ed regularly to check<br />
aga<strong>in</strong>st any damage to equipment or cables, loose connections, and so forth.<br />
The PCU should be checked from time to time <strong>in</strong> accordance with the<br />
manufacturers’ <strong>in</strong>structions. PCUs are normally guaranteed for one or two<br />
years and have an expected lifetime of 20 years or more.<br />
PV modules and PCUs specified should meet the relevant <strong>in</strong>ternational<br />
standards.<br />
Safety<br />
The <strong>in</strong>tegration of PVs with the build<strong>in</strong>g should be considered <strong>in</strong> terms of<br />
construction and access for ma<strong>in</strong>tenance, <strong>in</strong> the normal way follow<strong>in</strong>g the<br />
CDM (Construction <strong>Design</strong> and Management) Regulations.<br />
Safety is a standard consideration with all electrical <strong>in</strong>stallations. Contact<br />
with the front surfaces of the modules poses no danger. The particular issues<br />
that apply to PVs are:<br />
1. Current is produced dur<strong>in</strong>g a wide variety of light conditions and so<br />
to ‘switch off’ the <strong>in</strong>stallation one needs, for example, to cover the<br />
modules with someth<strong>in</strong>g opaque.<br />
2. There is less familiarity with<strong>in</strong> the build<strong>in</strong>g <strong>in</strong>dustry with DC compared<br />
with AC.<br />
3. Voltages can be higher than the familiar 240V s<strong>in</strong>gle phase AC.<br />
Safety issues should be well documented for both <strong>in</strong>stallers and ma<strong>in</strong>tenance<br />
personnel.
Earth<strong>in</strong>g and Lightn<strong>in</strong>g Protection<br />
The basic issues are set out briefly <strong>in</strong> Appendix A.<br />
Monitor<strong>in</strong>g<br />
Monitor<strong>in</strong>g of the <strong>in</strong>stallation is useful because, as a m<strong>in</strong>imum, it allows<br />
identification of any problems <strong>in</strong> operation and helps the performance of the<br />
system to be reviewed. More extensive monitor<strong>in</strong>g will provide additional<br />
<strong>in</strong>formation such as a detailed comparison of actual output with <strong>in</strong>itial<br />
predicted figures.<br />
5.4 Modules and cables<br />
Normally PV modules have junction boxes at the rear which conta<strong>in</strong> space<br />
for connections and may conta<strong>in</strong> bypass diodes (see Glossary). The modules<br />
are normally l<strong>in</strong>ked by ‘daisy cha<strong>in</strong>s’ (ie cables loop <strong>in</strong> to one module and<br />
then out to another) as shown <strong>in</strong> Figure 5.4, a photograph of an <strong>in</strong>dependent<br />
roof-mounted PV <strong>in</strong>stallation <strong>in</strong> Dubl<strong>in</strong>.<br />
Figure 5.5 shows another group<strong>in</strong>g of junction boxes and a draw<strong>in</strong>g of a<br />
similar type of box.<br />
a) Junction boxes<br />
Figure 5.4<br />
Junction boxes on a free-stand<strong>in</strong>g roofmounted<br />
<strong>in</strong>stallation<br />
Figure 5.5<br />
Junction boxes<br />
b) Module junction box<br />
43
44<br />
Figure 5.6<br />
Cable ways at the Doxford Solar Office<br />
Cables jo<strong>in</strong> the PV components together and as for any electrical <strong>in</strong>stallation<br />
they need to be suitable for their environment and for the loads carried. Thus,<br />
where cables are run <strong>in</strong> areas subject to heat build-up at the rear of modules,<br />
their size will need to be <strong>in</strong>creased to allow for the higher temperatures.<br />
Similarly, if cables are run where water vapour can enter, eg <strong>in</strong> ra<strong>in</strong> screen<br />
cladd<strong>in</strong>g systems, the cables, cable ways and junction boxes must be suitably<br />
selected.<br />
Cables should generally be <strong>in</strong>accessible to occupants but accessible to<br />
ma<strong>in</strong>tenance personnel. Figure 5.6 is a view from the <strong>in</strong>terior of the back of<br />
the facade at the Doxford Solar Office where the cables are run neatly and<br />
safely <strong>in</strong> the mullions and transoms.<br />
Cables are usually double <strong>in</strong>sulated and may be s<strong>in</strong>gle core or multi-core. A<br />
technical issue worth mention<strong>in</strong>g here is that, with PVs, protection aga<strong>in</strong>st<br />
certa<strong>in</strong> potential conditions such as faults to earth need to be dealt with at<br />
the design and <strong>in</strong>stallation stage - specialists will advise on the measures<br />
(which are likely to <strong>in</strong>clude double <strong>in</strong>sulation) to be taken.<br />
Routes should be as short as practical to facilitate <strong>in</strong>stallation and to<br />
m<strong>in</strong>imise cost and voltage drop. A rule of thumb is to limit the voltage drop<br />
from array to PCU to 2.5% or less. An example of cable size is given <strong>in</strong><br />
Chapter 6.<br />
The numerous cables <strong>in</strong>volved obviously need to be considered carefully to<br />
avoid marr<strong>in</strong>g the build<strong>in</strong>g’s aesthetics. This is a particularly important issue<br />
with PV cladd<strong>in</strong>g systems and also where arrays are semi-transparent.<br />
Future developments<br />
The DC systems most commonly <strong>in</strong> use (which are the basis of this chapter)<br />
have the disadvantages of be<strong>in</strong>g less familiar than AC, of requir<strong>in</strong>g more<br />
specialised equipment and of sometimes operat<strong>in</strong>g at higher voltages.<br />
Consequently, work is be<strong>in</strong>g carried out to <strong>in</strong>tegrate the PV module with the<br />
<strong>in</strong>verter to produce AC-modules. These could lead to lower design and<br />
<strong>in</strong>stallation costs and facilitate the acceptability of PV. Such systems are<br />
available but have not yet been widely used <strong>in</strong> the UK.
5.5 Plant rooms<br />
Ideally the plant room will be as close to the PV array as possible for ease<br />
of route<strong>in</strong>g and to m<strong>in</strong>imise energy losses <strong>in</strong> the cables.<br />
In a domestic <strong>in</strong>stallation of say 3kWp the PCU might be wall-mounted <strong>in</strong>side<br />
a closet along with the <strong>in</strong>com<strong>in</strong>g ma<strong>in</strong>s supply and meter. The PCU might take<br />
up a space 600mm high by 400mm wide by 150mm deep.<br />
In larger build<strong>in</strong>gs the plant room is likely to have the follow<strong>in</strong>g:<br />
• The DC switchgear.<br />
• The PCU.<br />
• The ma<strong>in</strong> AC switchgear.<br />
• The ma<strong>in</strong>s <strong>in</strong>comer and meters.<br />
If the PV <strong>in</strong>stallation is monitored as is recommended, space should also be<br />
allocated for the equipment.<br />
The space requirement for the DC switchgear and the PCU is obviously<br />
additional to that of the normal electrical plant room and will vary with the<br />
size of the <strong>in</strong>stallation. At the 2kWp BRE Environmental Build<strong>in</strong>g the DC<br />
switches and PCUs are wall mounted (Figure 5.2) and the additional space<br />
requirement is no more than, say, 1.5m 2 of floor space. At the 39.5kWp<br />
Northumberland Build<strong>in</strong>g (Figure 3.7(h)) the approximate dimensions of the DC<br />
switch panel and the PCU are 2.0m W x 2.0m H x 0.4m D and 2m W x 2m<br />
H x 0.6m D, respectively. The floor area used is about 12.5m 2 (but perhaps<br />
could be reduced slightly). A very rough rule of thumb is an additional plant<br />
room area equal to 3-5% of the array area is required if a s<strong>in</strong>gle PCU or<br />
several large sub-array PCUs are used.<br />
The small PCUs at the BRE are quiet but larger units can produce a significant<br />
‘hum’ as mentioned above. One guidel<strong>in</strong>e for specifiers suggests a limitation<br />
of 55dBA for PCUs (a modern, “quiet” dishwasher produces about 45-50dBA).<br />
Switchgear is robust and will function adequately at temperatures from -4 0 C<br />
to 40 0 C; it must of course be protected from the weather. The manufacturers’<br />
requirements should be checked for both switchgear and PCUs. A typical<br />
large PCU might require a temperature range of 1 0 C to 38 0 C. As much as 5-<br />
10% of a PCU’s nom<strong>in</strong>al output can be lost as waste heat and so ventilation<br />
will be required to prevent excessive temperatures. Normally, supplementary<br />
heat<strong>in</strong>g will not be needed but, as this depends on the build<strong>in</strong>g construction,<br />
the ventilation system etc it needs to be checked for each build<strong>in</strong>g.<br />
Access to the plant room should be restricted as is common practice.<br />
45
46<br />
KEY POINTS<br />
1. Grid-connected PV <strong>in</strong>stallations convert DC from the PV arrays <strong>in</strong>to<br />
AC for use <strong>in</strong> the build<strong>in</strong>g with any unused power be<strong>in</strong>g exported to<br />
the grid.<br />
2. There are a number of alternative array configurations and <strong>in</strong>verter<br />
arrangements. The selection will depend on factors such as module<br />
configuration, accessibility, cost, overshadow<strong>in</strong>g and plant room<br />
plann<strong>in</strong>g.<br />
3. PCUs have an expected lifetime of 20 years or more.<br />
4. Safety is, as ever, a paramount consideration. The particular issues of<br />
PV electricity such as the production of current <strong>in</strong> a wide variety of<br />
light conditions need to be known to all.<br />
5. Monitor<strong>in</strong>g of the <strong>in</strong>stallation is useful for identify<strong>in</strong>g any problems<br />
and for review<strong>in</strong>g performance.<br />
6. PV cable runs need to be <strong>in</strong>tegrated with the build<strong>in</strong>g design.<br />
7. Plant room space needs to be allotted for the PCU and associated<br />
equipment. The plant room needs to be ventilated.<br />
FURTHER READING<br />
1. Halcrow Gilbert Associates, (1993), Grid Connection of Photovoltaic<br />
Systems. ETSU S 1394-P1, ETSU: Harwell.<br />
2. Halcrow Gilbert Associates, (1993), <strong>Guide</strong>l<strong>in</strong>es on the Grid<br />
Connection of Photovoltaic Systems. ETSU S 1394 - P2, ETSU:<br />
Harwell.<br />
3. Munro, D. and Thornycroft, J., (Undated), Grid Connect<strong>in</strong>g PV Build<strong>in</strong>gs.<br />
In 21 AD Architectural Digest for the 21st Century <strong>Photovoltaics</strong>, Eds.<br />
Roaf, S and Walker, V. Oxford Brookes University.<br />
4. Sacks, T., (1997), Shadows Loom Over the Solar Era. Electrical<br />
Review 27 May - 4 June, pp.25-28.<br />
5. Newcastle <strong>Photovoltaics</strong> Applications Centre. Architecturally<br />
Integrated Grid-Connected PV Facade at the University of<br />
Northumbria. ETSU S/P2/00171/REP, ETSU: Harwell.
6<br />
Case Study<br />
6.1 Introduction<br />
This chapter discusses the prelim<strong>in</strong>ary design of a build<strong>in</strong>g-<strong>in</strong>tegrated PV<br />
system. It is broadly based on a new-build project for the Cambridge Botanic<br />
Garden but has been simplified and developed (1). The <strong>in</strong>tention is to provide<br />
a visitors centre/office accommodation and a bowls club under a s<strong>in</strong>gle<br />
roof. This rather unusual comb<strong>in</strong>ation of facilities is due <strong>in</strong> large part to the<br />
presence of an exist<strong>in</strong>g bowls club on part of the site which is to be<br />
demolished to make room for the new facilities.<br />
6.2 Site and brief<br />
Cambridge enjoys a moderate amount of sunlight (981kWh/m 2 /y on a<br />
horizontal surface), is temperate (mean annual temperature 9.6 0 C; mean<br />
temperature June to August 15.7 0 C), and is fairly dry (mean annual ra<strong>in</strong>fall<br />
540mm).<br />
Figure 6.1 shows the site plan.<br />
The flat site (typical of much of Cambridgeshire) is bordered on the north by<br />
the Botanic Garden and on the south by a busy road.<br />
The brief called for:<br />
• A total gross area of about 3950m 2 divided <strong>in</strong>to:<br />
a. an exhibition and <strong>in</strong>formation/teach<strong>in</strong>g area of 650m 2<br />
b. adm<strong>in</strong>istrative offices of 1300m 2<br />
c. a six-lane <strong>in</strong>door bowl<strong>in</strong>g green with associated<br />
chang<strong>in</strong>g rooms and WCs; area about 1600m 2<br />
d. a cafe/bar of 400m 2 .<br />
• An external bowl<strong>in</strong>g green.<br />
• Car park<strong>in</strong>g facilities.<br />
• Reasonable capital costs - as yet not def<strong>in</strong>ed at this early stage.<br />
The client has a professional, special <strong>in</strong>terest <strong>in</strong> environmental design and<br />
<strong>in</strong>structed the design team to develop an <strong>in</strong>tegrated, low-energy approach<br />
and exam<strong>in</strong>e energy, materials, water use and waste recycl<strong>in</strong>g <strong>in</strong> detail.<br />
Under the energy topic three particular areas were identified for<br />
<strong>in</strong>vestigation:<br />
• The use of PVs.<br />
• Daylight<strong>in</strong>g of the <strong>in</strong>door bowl<strong>in</strong>g green (to reduce the artificial<br />
light<strong>in</strong>g energy demand).<br />
• Natural ventilation of all spaces.<br />
Prelim<strong>in</strong>ary site analysis led to the <strong>in</strong>itial concept shown <strong>in</strong> Figure 6.2.<br />
This was pr<strong>in</strong>cipally to l<strong>in</strong>k the visitors centre and offices to the Botanic<br />
Garden as well as to distance them from the noise and pollution of the road.<br />
The footpr<strong>in</strong>ts of the bowl<strong>in</strong>g greens are def<strong>in</strong>ed by functional requirements;<br />
the visitors centre and offices are more flexible.<br />
Figure 6.1<br />
Site plan<br />
Figure 6.2<br />
Initial site plann<strong>in</strong>g<br />
47
48<br />
Figure 6.3<br />
Build<strong>in</strong>g mass<strong>in</strong>g<br />
The design team then began to exam<strong>in</strong>e what the implications on form would<br />
be with particular attention to PVs and daylight<strong>in</strong>g. The team knew that PVs<br />
were not normally immediately f<strong>in</strong>ancially viable but needed to set out the<br />
facts to the client and wished, as far as possible, to allow for future flexibility.<br />
From the brief it was possible to develop the design. As daylight<strong>in</strong>g of the<br />
bowl<strong>in</strong>g green (particularly) needed to be fairly uniform, this part of the<br />
build<strong>in</strong>g was likely to be s<strong>in</strong>gle storey, say, about 5.5m <strong>in</strong> height. Build<strong>in</strong>g costs<br />
favoured a two or three storey visitors centre and offices area; however, this<br />
would make the build<strong>in</strong>g more prom<strong>in</strong>ent from <strong>in</strong>side the Garden. After<br />
considerable discussion with all concerned parties, <strong>in</strong>clud<strong>in</strong>g the planners, a<br />
three storey proposal was adopted. The mass<strong>in</strong>g shown <strong>in</strong> Figure 6.3 resulted.<br />
Internal plann<strong>in</strong>g was also considered and, particularly, the area to the north<br />
of the wall separat<strong>in</strong>g the bowl<strong>in</strong>g green and visitors centre. It was thought<br />
that this zone would be used for spaces without a daylight<strong>in</strong>g requirement<br />
such as WCs or with a need for blackout such as conference rooms.<br />
The design team cont<strong>in</strong>ued their <strong>in</strong>itial assessment of PV feasibility by look<strong>in</strong>g<br />
at a number of factors <strong>in</strong>clud<strong>in</strong>g:<br />
• Suitability of the site <strong>in</strong> general.<br />
• Availability of surface area.<br />
• Occupancy of the build<strong>in</strong>g and load.<br />
• Likely array size, cost and generation pattern.<br />
Simultaneously, to avoid abortive work, prelim<strong>in</strong>ary discussions took place<br />
with local planners and the electricity supplier <strong>in</strong> order to assess whether PV<br />
proposals were likely to be considered favourably. The response was<br />
encourag<strong>in</strong>g <strong>in</strong> both cases.<br />
Site<br />
The site is free of obstructions and was judged to be very suitable. There is<br />
some potential loss of north sky diffuse radiation due to the Garden’s tall<br />
trees but this is not significant. S<strong>in</strong>ce the build<strong>in</strong>gs face south and the car park<br />
and road are ‘dead’ zones, there is very good solar access.
Surface area<br />
To assess this required further development of the build<strong>in</strong>g form. Based on<br />
common practice <strong>in</strong> low-energy office design (Chapter 3) it was decided that<br />
the visitor centre/office should aim at a floor width of about 15m at most to<br />
allow for natural ventilation. Thus, the form of the visitors centre/office area<br />
was confirmed as a rectangular block with the long axis runn<strong>in</strong>g east-west.<br />
As for the <strong>in</strong>door bowl<strong>in</strong>g green, it was necessary to study the daylight<strong>in</strong>g <strong>in</strong><br />
more detail to determ<strong>in</strong>e the area left for PVs on either the roof or south wall.<br />
Discussion with <strong>in</strong>door bowlers (who sometimes have a marked aversion to<br />
daylight) conv<strong>in</strong>ced the design team that direct sunlight needed to be<br />
excluded and that good uniformity of daylight over all lanes would be<br />
required. Thus, a roof light<strong>in</strong>g scheme was selected. For architectural <strong>in</strong>terest,<br />
to avoid the factory-like appearance of normal saw-tooth northlight roofs<br />
and potentially to <strong>in</strong>crease the PV capacity a concept sketch of successive<br />
‘waves’ was drawn (Figure 6.4).<br />
The daylight factor of 6-8% required to provide 500 lux for bowl<strong>in</strong>g much of<br />
the time without artificial light<strong>in</strong>g meant that the bowl<strong>in</strong>g green roof area<br />
available for PVs was about 750m 2 . In addition the upper portion of the<br />
south facade (leav<strong>in</strong>g the lower part free because of shad<strong>in</strong>g by cars) with<br />
an area of 60m 2 was available and the roof of the offices with a plan area<br />
of 650m 2 was potentially available. The module loads were assessed<br />
structurally and it was considered that they could easily be accommodated.<br />
Occupancy and load<br />
The likely occupancy of the build<strong>in</strong>g is favourable to PVs as <strong>in</strong>door bowl<strong>in</strong>g<br />
takes place from 9am until 9pm seven days a week throughout the year. The<br />
visitors centre will also be <strong>in</strong> operation seven days a week throughout the<br />
year; the offices will be occupied on weekdays. Overall, this means that<br />
there will always be a load on site for the PVs to supply and therefore less<br />
electricity will be exported.<br />
Figure 6.4<br />
Roof proposal<br />
49
50<br />
Figure 6.5<br />
Annual electrical demand and PV supply<br />
Figure 6.6<br />
Weekly demand pattern<br />
The load<strong>in</strong>g of the build<strong>in</strong>g had to be exam<strong>in</strong>ed <strong>in</strong> detail. For the visitors<br />
centre and office area an electrical consumption of 30-35kWh/m 2 /y was<br />
estimated based on an energy-efficient build<strong>in</strong>g (Chapter 3). For the bowl<strong>in</strong>g<br />
green each aspect (artificial light<strong>in</strong>g, small power for cafe/bar, etc.) was<br />
studied result<strong>in</strong>g <strong>in</strong> an estimate of 35-40kWh/m 2 y. Figure 6.5 shows the<br />
annual energy demand pattern (and PV supply - see below); Figure 6.6 shows<br />
a typical weekly power demand <strong>in</strong> summer.<br />
Array size and cost<br />
As can be seen from Figure 6.6 the typical summer daytime m<strong>in</strong>imum power<br />
demand or base load is 25kW dur<strong>in</strong>g the week and 12kW at weekends;<br />
dur<strong>in</strong>g the w<strong>in</strong>ter it is slightly higher because of additional light<strong>in</strong>g and plant<br />
loads, eg heat<strong>in</strong>g pumps.<br />
If the PV <strong>in</strong>stallation were sized to provide an on-site maximum of 25kW <strong>in</strong><br />
summer we would be fairly confident of be<strong>in</strong>g able to use most of the energy<br />
produced on site (because supply will usually be less than the base demand).<br />
At this stage assum<strong>in</strong>g a performance ratio of 0.75 (to account for system<br />
losses) leads to a nom<strong>in</strong>al required array rat<strong>in</strong>g of about 33kWp to meet the<br />
summer base load. The output from this array for a typical week <strong>in</strong> June is<br />
also plotted <strong>in</strong> Figure 6.6.
If monocrystall<strong>in</strong>e silicon cells were used this might require an area of<br />
approximately 235m 2 and might entail an <strong>in</strong>stalled cost of about £150,000<br />
(Chapter 4).<br />
At this po<strong>in</strong>t the design team knew the area required was available but did<br />
not know if the client had the money. In the meantime, the approximate cost<br />
of the build<strong>in</strong>g was estimated at £900/m 2 or £3,550,000 without PVs, so<br />
the PV cost would represent very roughly (allow<strong>in</strong>g for partial replacement of<br />
the metal roof<strong>in</strong>g system that had been costed) about 5% of the build<strong>in</strong>g cost.<br />
The design team then met the client to present its f<strong>in</strong>d<strong>in</strong>gs. There was some<br />
disappo<strong>in</strong>tment at the cost and the fact that the entire roof would not be PV<br />
modules. There was discussion about whether the electricity supplier would<br />
pay for energy exported and, if so, how much. As the answers were not<br />
known, it was decided to err on the side of caution and discount any<br />
contribution for the time be<strong>in</strong>g. In the end, the additional cost was judged to<br />
be acceptable and worthwhile on the basis of the percentage of the build<strong>in</strong>g<br />
cost, the environmental benefits and the educational value.<br />
In order to make the maximum public statement about the <strong>in</strong>stallation, the<br />
client requested that the PV modules be at the southernmost part of the<br />
bowl<strong>in</strong>g green roof and on its south facade. He also asked that the rema<strong>in</strong><strong>in</strong>g<br />
bowl<strong>in</strong>g green roof be designed so that it could be used for PVs <strong>in</strong> the future<br />
when costs had fallen. The design team returned to their draw<strong>in</strong>g boards (or<br />
more precisely their computer screens).<br />
6.3 <strong>Design</strong> development<br />
The follow<strong>in</strong>g aspects of the design were then developed:<br />
• Optimisation of the daylight<strong>in</strong>g and PV capability of the roof.<br />
• PVs and the natural ventilation strategy.<br />
• Choice of module.<br />
• Siz<strong>in</strong>g and cost<strong>in</strong>g.<br />
• System considerations.<br />
• The PV <strong>in</strong>stallation <strong>in</strong>side the build<strong>in</strong>g.<br />
Daylight<strong>in</strong>g and PVs<br />
The <strong>in</strong>itial assumption of a daylight factor of 6-8% was ma<strong>in</strong>ta<strong>in</strong>ed and a<br />
uniformity ratio of about 0.5 specified. Numerous configurations were<br />
studied us<strong>in</strong>g computer modell<strong>in</strong>g - Figure 6.7 shows three of them.<br />
The ma<strong>in</strong> conclusions of the exercise (which looked at electrical energy but<br />
did not go <strong>in</strong>to energy for space heat<strong>in</strong>g which was thought to be a lesser<br />
consideration) were:<br />
• The optimum angle for a stand-alone array <strong>in</strong> Cambridge is about 31 0 ;<br />
this is consistent with the rule-of-thumb of latitude less 20 0 . A uniform<br />
roof based on this has a comparatively low daylight factor, thus<br />
higher electrical costs.<br />
• By <strong>in</strong>creas<strong>in</strong>g the angle to 45 0 daylight is improved; the PV output,<br />
however, drops because the angle is not optimal and self-shad<strong>in</strong>g<br />
losses are higher.<br />
• If the 45 0 tilt is ma<strong>in</strong>ta<strong>in</strong>ed, <strong>in</strong>creas<strong>in</strong>g the height of successive ridges<br />
reduces self-shad<strong>in</strong>g and <strong>in</strong>creases the PV output. The daylight factor,<br />
however, drops slightly.<br />
Figure 6.7(c) suited the <strong>in</strong>itial ‘wave’ concept, provided good daylight<strong>in</strong>g and<br />
offered significant PV potential. There was a great deal of discussion about<br />
the <strong>in</strong>creased structural complexity and costs result<strong>in</strong>g from non-uniformity<br />
and the appearance of the roof from the <strong>in</strong>side but, <strong>in</strong> the end, it was agreed<br />
to take forward this design.<br />
51
52<br />
Figure 6.7<br />
Roof configurations<br />
Figure 6.8<br />
Services strategy and notional air paths<br />
Figure 6.9<br />
Bowl<strong>in</strong>g green ventilation<br />
strategy<br />
PVs and the natural ventilation strategy<br />
The need to provide conference room facilities <strong>in</strong> the visitors centre and<br />
offices area and future flexibility led to a strategy of a raised floor for<br />
services and air distribution as <strong>in</strong>dicated <strong>in</strong> Figure 6.8.<br />
The bowl<strong>in</strong>g green ventilation strategy (Figure 6.9) was developed to both<br />
ventilate the <strong>in</strong>ternal space and take the heat away from the back of the PV<br />
modules to prevent a layer of hot air form<strong>in</strong>g at high level.<br />
The architect considered a variety of wall constructions and favoured, on<br />
grounds of appearance and functional performance, a ra<strong>in</strong>screen cladd<strong>in</strong>g<br />
system. As this was also perfectly suited to PV panels on the front facade of<br />
the bowl<strong>in</strong>g green it was chosen.
Choice of module<br />
For the build<strong>in</strong>g the architect chose an elegant white steel frame with green<br />
ra<strong>in</strong>screen cladd<strong>in</strong>g panels. Monocrystall<strong>in</strong>e modules were selected on the<br />
basis of cost and an appearance which complemented that of the build<strong>in</strong>g.<br />
Siz<strong>in</strong>g and cost<strong>in</strong>g<br />
The design was reviewed and it was decided to adopt the bowl<strong>in</strong>g green<br />
south facade shown <strong>in</strong> Figure 6.10. This allowed 60m 2 of PV modules on the<br />
facade or 8.8kWp.<br />
On the roof us<strong>in</strong>g the basic design of Figure 6.7(c) it was possible to put <strong>in</strong><br />
114m 2 of PV modules per saw-tooth or 16.8kWp. It was decided to have PVs<br />
on the front roof and the upper half of the second saw-tooth as well as the<br />
south facade, thus giv<strong>in</strong>g a total of 34kWp or about 23kW on a sunny June<br />
afternoon (the output is slightly lower than the 25kW aimed for because of<br />
the reduced performance of the south facade modules). The annual output<br />
from this PV <strong>in</strong>stallation is shown <strong>in</strong> Figure 6.5.<br />
Figure 6.11 shows a sketch of the f<strong>in</strong>al scheme. Sketches and a rough<br />
schematic were sent to manufacturers for review, cost<strong>in</strong>g and an analysis of<br />
the output. The manufacturers were asked to keep <strong>in</strong> m<strong>in</strong>d the client’s <strong>in</strong>tention<br />
to expand the <strong>in</strong>stallation <strong>in</strong> the future.<br />
The manufacturers’ responses varied and some quotes were higher than <strong>in</strong>itial<br />
estimates. It was decided to proceed optimistically and use the £150,000<br />
figure cited above and an expected output of 25,000kWh/y. Although no<br />
detailed analysis was carried out, rough checks <strong>in</strong>dicated that we would be<br />
<strong>in</strong> Zone A of Figure 4.3.<br />
Figure 6.10<br />
South elevation<br />
Figure 6.11<br />
F<strong>in</strong>al scheme<br />
53
54<br />
Figure 6.12<br />
System schematic<br />
Note: Earth<strong>in</strong>g arrangements not shown<br />
System considerations<br />
The prelim<strong>in</strong>ary PV system design assumed that the PVs would be split <strong>in</strong>to<br />
sub-arrays each with its own <strong>in</strong>verter and that the <strong>in</strong>com<strong>in</strong>g electrical supply,<br />
ma<strong>in</strong> switchgear, meters, power conditioners and various data,<br />
communications and control panels would all be located <strong>in</strong> the electrical<br />
switchgear room.<br />
Figure 6.12 shows a schematic of the system at this prelim<strong>in</strong>ary design stage.<br />
Start<strong>in</strong>g at the ma<strong>in</strong>s <strong>in</strong>comer there is a three phase and neutral cable. Two<br />
meters are <strong>in</strong>cluded <strong>in</strong> the schematic (however, this is subject to discussion<br />
with the electricity supplier). There are four PCUs (each with their own<br />
maximum power po<strong>in</strong>t tracker) <strong>in</strong>cluded, each rated at approximately 7kW.<br />
One PCU is for the vertical south facade which will receive less irradiation<br />
than the PVs mounted on the <strong>in</strong>cl<strong>in</strong>ed roofs. The rema<strong>in</strong><strong>in</strong>g three PCUs have<br />
been <strong>in</strong>cluded <strong>in</strong> order to modularise the system based upon sub-arrays of<br />
equal area.<br />
Each sub-array has five str<strong>in</strong>gs and each str<strong>in</strong>g has eight modules. The<br />
modules are connected together so that each str<strong>in</strong>g operates at a system<br />
voltage of 280V. The voltage was kept reasonably low for safety. Sub-array<br />
term<strong>in</strong>ation boxes, approximately 0.5m x 0.5m x 0.2m, are housed at high<br />
level <strong>in</strong> the bowl<strong>in</strong>g green at the east end of each sub-array. The sub-array<br />
term<strong>in</strong>ation boxes are then connected back to the appropriate <strong>in</strong>verter, thus<br />
reduc<strong>in</strong>g the number of cables runn<strong>in</strong>g through the bowl<strong>in</strong>g green. The subarray<br />
term<strong>in</strong>ation boxes conta<strong>in</strong> isolation switches for <strong>in</strong>dividual str<strong>in</strong>gs,<br />
block<strong>in</strong>g diodes for the str<strong>in</strong>gs, DC fuses and test<strong>in</strong>g po<strong>in</strong>ts. Good access<br />
was provided to the roof to allow for clean<strong>in</strong>g of the modules and the<br />
northlight w<strong>in</strong>dows, for ma<strong>in</strong>tenance of the open<strong>in</strong>g light mechanisms, and for<br />
<strong>in</strong>spection of all electrics.<br />
Plann<strong>in</strong>g the PV <strong>in</strong>stallation <strong>in</strong>side the build<strong>in</strong>g<br />
The architect wanted to know:<br />
• The size and the position of the plant room.<br />
• Where the cables were go<strong>in</strong>g to run.<br />
• How big they were.<br />
The mechanical and electrical plant rooms were both positioned just to the<br />
north of the north-east corner of the <strong>in</strong>door bowl<strong>in</strong>g hall to allow for<br />
ventilation for the boilers and the PV switchgear room (Figure 6.13). This fairly<br />
central position, although distant from the first PV modules, was thought to be<br />
appropriate over the life of the build<strong>in</strong>g when other PV sub-arrays will be<br />
positioned much closer to it. It was also thought that if more space for PV<br />
equipment became necessary <strong>in</strong> the future it could come from the adjacent<br />
storeroom.<br />
In the electrical switchgear room, approximately 40m 2 is required for<br />
standard equipment and approximately 10m 2 of additional space is required<br />
for PV related equipment. Thus, the PV plant floor area is about 4-5% of the<br />
total array area.<br />
All cables were run <strong>in</strong>ternally ma<strong>in</strong>ly with<strong>in</strong> the support<strong>in</strong>g framework.<br />
In the <strong>in</strong>door bowl<strong>in</strong>g hall, cables run to the plant room from the sub-array<br />
term<strong>in</strong>ation boxes with<strong>in</strong> two compartment trunk<strong>in</strong>g (50mm x 100mm overall)<br />
elegantly concealed at high level. The eight cables are each approximately<br />
15mm overall diameter.
6.4 Future detailed design<br />
It was anticipated that the detailed design stage would address the<br />
follow<strong>in</strong>g po<strong>in</strong>ts:<br />
• A roof construction detail that would allow for easy substitution of<br />
PV modules for metal sheet<strong>in</strong>g.<br />
• <strong>Design</strong> of the office roof to allow <strong>in</strong>corporation of PV modules.<br />
• Bond<strong>in</strong>g and lightn<strong>in</strong>g protection.<br />
6.5 Project data<br />
Table 6.1 summarises the pr<strong>in</strong>cipal data <strong>in</strong>clud<strong>in</strong>g cost and performance<br />
predictions.<br />
Table 6.1<br />
Data summary<br />
Build<strong>in</strong>g<br />
• Floor area (m 2 ) 3,950<br />
• Electrical demand (kWh/y) 137,000<br />
PV System Roof South Aggregate<br />
facade<br />
• Nom<strong>in</strong>al array rat<strong>in</strong>g (kWp) 25.2 8.8 34.0<br />
• Area of PVs (m 2 ) 170 60 230<br />
• System rat<strong>in</strong>g<br />
(W/m 2 (array) 110 80 102<br />
(W/m 2 (floor area) a - - 6<br />
• Assumed performance ratio 0.75 0.75 0.75<br />
• Solar energy available to<br />
array (kWh/y) 193,000 48,500 241,500<br />
• Total electrical energy<br />
provided by PV system<br />
(kWh/y) 20,000 5,000 25,000<br />
• Estimated energy use on site<br />
(kWh/y) a - - 22,500<br />
• Total avoided CO2<br />
emissions per year due to<br />
PV <strong>in</strong>stallation (kg) 12,400 3,100 15,500<br />
• Estimated <strong>in</strong>stalled cost of<br />
PV system (£) a - - 150,000<br />
a The aggregate total figure has not been separated <strong>in</strong>to components<br />
55
56<br />
REFERENCES<br />
1. For the purposes of this <strong>Guide</strong> the authors have simplified the build<strong>in</strong>g<br />
<strong>in</strong> numerous ways and developed their own cost estimates based on<br />
this. In the description of the later stages we have imag<strong>in</strong>ed how the<br />
design team, client and other parties might have reacted because the<br />
actual process had not progressed that far - we freely admit an<br />
element of ‘<strong>in</strong>formed’ poetic licence <strong>in</strong> the chapter.<br />
PROJECT PRINCIPALS<br />
Client: The Botanic Garden of the University of Cambridge<br />
Architect: Saunders Boston<br />
Environmental Eng<strong>in</strong>eers: Max Fordham & Partners
Appendix A<br />
A.1 The Photovoltaic Effect<br />
This is the basic process by which a PV cell converts solar radiation <strong>in</strong>to<br />
electricity. In crystall<strong>in</strong>e silicon cells a p-n junction (‘p’ for positive, ‘n’ for<br />
negative) is formed (Figure 2.1) by diffus<strong>in</strong>g phosphorous <strong>in</strong>to the silicon and<br />
<strong>in</strong>troduc<strong>in</strong>g a small quantity of boron. This results <strong>in</strong> an electric field be<strong>in</strong>g<br />
formed. When photons, ‘particles’ of solar energy, are absorbed by a PV cell,<br />
electrons under the <strong>in</strong>fluence of the field move out towards the surface. This<br />
flow or current is ‘harnessed’ by an external circuit with a load.<br />
A typical monocrystall<strong>in</strong>e cell of, say, 100mm by 100mm <strong>in</strong> bright sunsh<strong>in</strong>e of<br />
1000W/m 2 might produce a current of 3 amps at 0.5 volts giv<strong>in</strong>g 1.5 watts<br />
of power.<br />
A.2 The Environment and PVs<br />
a: North sky daylight <strong>in</strong>cluded for reference<br />
Figure A.1 shows the spectral distribution, ie the amount of radiation at<br />
various wavelengths, of solar radiation.<br />
Solar radiation can be divided <strong>in</strong>to direct and diffuse radiation. In the UK the<br />
diffuse component is high - <strong>in</strong> London 60% of the total annual irradiation on a<br />
horizontal surface is diffuse and <strong>in</strong> Glasgow the figure is very similar at 61%.<br />
The radiation climate is also very variable and can quickly change from<br />
bright sunsh<strong>in</strong>e to heavy clouds. Ideally, the total PV <strong>in</strong>stallation from array to<br />
<strong>in</strong>verter will react optimally to all the characteristics of the environment.<br />
PV cells respond ma<strong>in</strong>ly to visible radiation (wavelengths of approximately<br />
400nm-700nm) but also to some UV (below 400nm) and some <strong>in</strong>frared<br />
(above 700nm). Figure A.2 shows the response of a monocrystall<strong>in</strong>e cell;<br />
amorphous silicon cells have a somewhat different curve with a peak<br />
between 500nm-600nm. (The absorption characteristics of PV cells<br />
obviously affect the design. For example, normal glass conta<strong>in</strong>s traces of iron<br />
which cause the glass to absorb strongly <strong>in</strong> the visible green range. S<strong>in</strong>ce PV<br />
cells can use this energy, PV modules <strong>in</strong>corporate low-iron glass.)<br />
Fortunately, PVs respond to diffuse radiation as well as direct radiation.<br />
Output varies with <strong>in</strong>tensity as shown <strong>in</strong> Figure A.3. A heavily overcast sky<br />
might have an <strong>in</strong>tensity of 50W/m 2 with a diffuse component of 95-100%<br />
and a cloudless blue sky might have an <strong>in</strong>tensity of 900W/m 2 with a diffuse<br />
component of 20%.<br />
Efficiency also varies somewhat with <strong>in</strong>tensity with slightly lower values at<br />
lower <strong>in</strong>tensities (1).<br />
Figure A.1<br />
Spectral distribution of solar<br />
radiation at the earth’s surface<br />
Figure A.2<br />
Spectral response of a<br />
monocrystall<strong>in</strong>e PV cell<br />
Figure A.3<br />
Variation of module power with<br />
irradiance<br />
57
58<br />
Figure A.4<br />
Series and parallel arrangements<br />
Figure A.5<br />
Current/voltage (I-V) curve<br />
Figure A.6<br />
Typical I-V curves at vary<strong>in</strong>g<br />
irradiances<br />
A.3 How to read a PV module data sheet<br />
Firstly, read with caution as there is not yet a uniform way of present<strong>in</strong>g<br />
<strong>in</strong>formation. In addition to the construction and physical characteristics and<br />
warranty conditions, the follow<strong>in</strong>g items are likely to be <strong>in</strong>cluded:<br />
1. Cell type, eg monocrystall<strong>in</strong>e silicon.<br />
2. Cell specifications, eg 36 series-connected cells. (See Figure A.4 for<br />
series and parallel arrangements.)<br />
3. Physical Conditions<br />
There may be an <strong>in</strong>dication of the wide-rang<strong>in</strong>g conditions <strong>in</strong> which<br />
PV modules can be used. For example:<br />
Temperature: - 40 0 C to 85 0 C<br />
Relative humidity: 0% to 100%<br />
W<strong>in</strong>d load<strong>in</strong>g: Up to 80km/h.<br />
4. Electrical characteristics (eg for a module of 1.2m x 0.5m)<br />
Nom<strong>in</strong>al peak power 90.0W<br />
Voltage at peak power 18.5V<br />
Current at peak power 4.9A<br />
Short circuit current 5.2A<br />
Figure A.5 shows a typical curve of module performance under STCs.<br />
The short circuit current is the current at zero voltage. The correspond<strong>in</strong>g<br />
po<strong>in</strong>t of zero current, ie ‘no connected loads’, is the open circuit voltage.<br />
Power is the product of current and voltage and from the curve it can be<br />
determ<strong>in</strong>ed that the maximum power of 90W is produced at a voltage of<br />
approximately 18.5V and a current of 4.9A.<br />
At lower irradiances, power falls as shown <strong>in</strong> Figure A.6.<br />
Note that the effect of vary<strong>in</strong>g temperature is also <strong>in</strong>cluded. At higher<br />
temperatures efficiency falls, and more so with crystall<strong>in</strong>e silicon cells than<br />
amorphous silicon as shown <strong>in</strong> Figure A.7. The PV module data sheet should<br />
give a value for this variation of efficiency with temperature.<br />
The function of a maximum power po<strong>in</strong>t tracker (Chapter 4) is to alter the<br />
effective load resistance so that the array will operate near the maximum<br />
power po<strong>in</strong>t <strong>in</strong> variable <strong>in</strong>put conditions, ie under chang<strong>in</strong>g skies with their<br />
vary<strong>in</strong>g irradiances and <strong>in</strong> vary<strong>in</strong>g temperatures.<br />
A.4 Shad<strong>in</strong>g<br />
The effect of shad<strong>in</strong>g can be understood by referr<strong>in</strong>g to the series<br />
arrangement <strong>in</strong> Figure A.4. Because the cells are <strong>in</strong> series, if the performance<br />
of one cell is impaired by shad<strong>in</strong>g, the output current from the whole str<strong>in</strong>g is<br />
affected and m<strong>in</strong>or shad<strong>in</strong>g can result <strong>in</strong> a major loss of energy. This is<br />
illustrated by Figure A.8.<br />
A.5 Mismatch<br />
Mismatch refers to the losses due to differences <strong>in</strong> the I-V characteristics<br />
(Figure A.5) of the modules <strong>in</strong> a PV array.<br />
In Chapter 2 mismatch losses have been <strong>in</strong>cluded <strong>in</strong> the correction factor, K.
A.6 Balance of system losses<br />
In Chapter 2 the balance of system (BOS) loss, L, was mentioned. It accounts<br />
for factors such as the follow<strong>in</strong>g, which are listed with very approximate<br />
values (expressed as a percentage of the array output (‘E’ <strong>in</strong> Chapter 2):<br />
• Cable losses - 1-3%<br />
• Losses at the PCU and particularly at the <strong>in</strong>verter - say 10-15%<br />
• Meter<strong>in</strong>g and utility <strong>in</strong>terface control losses - less than 1%.<br />
Thus, an overall figure of 0.8 for L is a reasonable start<strong>in</strong>g po<strong>in</strong>t.<br />
A.7 Performance ratio and siz<strong>in</strong>g<br />
The follow<strong>in</strong>g discussion cont<strong>in</strong>ues the procedure started <strong>in</strong> Chapter 2.<br />
The Performance Ratio (PR) is the f<strong>in</strong>al yield (kWh/kWp/day) divided by the<br />
reference yield. It can be expressed either as a decimal fraction or as a<br />
percentage.<br />
The reference yield is based on the <strong>in</strong>-plane irradiance and represents the<br />
theoretically available energy per day per kWp <strong>in</strong>stalled. Typical PR values<br />
are 60-75% but higher values are achieved.<br />
Rough array siz<strong>in</strong>g is sometimes done us<strong>in</strong>g estimates of the PR <strong>in</strong> the<br />
follow<strong>in</strong>g way:<br />
1. Assume a value for the PR, say, 0.7.<br />
2. Determ<strong>in</strong>e the solar irradiation on the actual array. For example, <strong>in</strong> our<br />
Chapter 2 example we have 920kWh/m 2 /y x 0.15 (module efficiency)<br />
x 0.95 correction factor for tilt and azimuth or 131kWh/m 2 /y.<br />
3. The output of the PV system, then, will be:<br />
0.7 x 131kWh/m 2 /y = 92kWh/m 2 /y.<br />
The PR equals the product of K and L <strong>in</strong> Chapter 2.<br />
A.8 Inverter selection<br />
As mentioned <strong>in</strong> Chapter 5, <strong>in</strong>verter selection is a key element <strong>in</strong> the PV<br />
system design process.<br />
Figure A.9(a) shows generalised <strong>in</strong>verter performance and A.9(b) the<br />
performance of one of the small <strong>in</strong>verters used at the BRE Environmental<br />
Build<strong>in</strong>g (Figure 5.2(b)).<br />
With all <strong>in</strong>verters, efficiency is impaired at very low levels of irradiance and,<br />
s<strong>in</strong>ce there are energy losses <strong>in</strong> the <strong>in</strong>verter, there is a po<strong>in</strong>t below which it<br />
does not make sense to use the PV DC electricity.<br />
Similarly, with all <strong>in</strong>verters, operat<strong>in</strong>g conditions <strong>in</strong> the UK mean that for a<br />
significant part of the time efficiency is <strong>in</strong> the 20-80% range. In practice, this<br />
means that a balance needs to be struck between los<strong>in</strong>g some of the<br />
available energy at very high irradiance levels and operat<strong>in</strong>g at a somewhat<br />
higher efficiency <strong>in</strong> lower irradiation levels. Current experience <strong>in</strong> the UK<br />
<strong>in</strong>dicates optimal performance is at a siz<strong>in</strong>g of approximately 75-80% of the<br />
array rat<strong>in</strong>g (2). This is broadly <strong>in</strong> l<strong>in</strong>e with a European suggestion that<br />
optimal performance may be obta<strong>in</strong>ed us<strong>in</strong>g <strong>in</strong>verters with a rat<strong>in</strong>g of 70-<br />
90% of the nom<strong>in</strong>al rat<strong>in</strong>g of the array (3); however, as the authors say, “this<br />
will depend on the climate and the shape of the <strong>in</strong>verter performance<br />
characteristic.”<br />
Figure A.7<br />
Cell efficiency as a function of<br />
temperature<br />
Figure A.8<br />
The effect of shad<strong>in</strong>g<br />
59
60<br />
Figure A.9<br />
Inverter performance<br />
a) generalised <strong>in</strong>verter performance<br />
b) Characteristics of the <strong>in</strong>verters used<br />
at the BRE Environmental Build<strong>in</strong>g<br />
Aga<strong>in</strong>, each situation needs to be analysed and this is normally done at a<br />
later detailed design stage.<br />
A.9 Earth<strong>in</strong>g and lightn<strong>in</strong>g protection<br />
Earth<strong>in</strong>g and lightn<strong>in</strong>g protection is an area that requires an eng<strong>in</strong>eer<strong>in</strong>g<br />
assessment of the build<strong>in</strong>g’s construction and electrical system and advice<br />
from an electrical eng<strong>in</strong>eer.<br />
The design of PV modules isolates the electrical system from the support<strong>in</strong>g<br />
structure, eg the module frame. Broadly speak<strong>in</strong>g, most UK PV systems do not<br />
connect the DC side of the electrical system to earth. The support<strong>in</strong>g<br />
structure, on the other hand, <strong>in</strong> most systems is earthed. The AC side of the<br />
system is connected to the build<strong>in</strong>g’s normal electrical system’s earth.<br />
With regard to lightn<strong>in</strong>g protection, PV <strong>in</strong>stallations do not require lightn<strong>in</strong>g<br />
protection systems per se. Protection aga<strong>in</strong>st deleterious effects to sensitive<br />
parts of the <strong>in</strong>stallation is often provided by surge protection devices. If the<br />
build<strong>in</strong>g has a lightn<strong>in</strong>g protection system, common practice is to connect the<br />
support<strong>in</strong>g structure to the lightn<strong>in</strong>g protection system.<br />
REFERENCES<br />
1. Mason, N.B., Bruton, T.M. and Heasman, K.C, (1997), kWh/kWp<br />
Energy Production from LGBG Cell Modules <strong>in</strong> Northern Europe. Paper<br />
presented at the 12th German National PV Symposium Staffelste<strong>in</strong>.<br />
2. N. Pearsall, Newcastle <strong>Photovoltaics</strong> Applications Centre, (1998),<br />
Private communication.<br />
3. Anon. (undated), Photovoltaic Technologies and their Future Potential.<br />
Commission of the European Communities, Directorate-General for<br />
Energy (XVII). EAB Energie - Anlagen, Berl<strong>in</strong>.<br />
FURTHER READING<br />
Laukamp, H. (1994), The Basic German Electric Safety Standard and its<br />
Application to PV Systems. 12th European Conference PVSEC, Amsterdam.<br />
Halcrow Gilbert Associates, (1993), Grid Connection of Photovoltaic<br />
Systems. ETSU S 1394-P1. ETSU: Harwell.
References and Bibliography<br />
We list below a number of sources of <strong>in</strong>formation (<strong>in</strong> most cases previously<br />
referred to <strong>in</strong> the text) that we have found particularly useful.<br />
Publications<br />
1. Newcastle <strong>Photovoltaics</strong> Applications Centre. Architecturally<br />
Integrated Grid-Connected PV Facade at the University of<br />
Northumbria. ETSU S/P2/00171/REP, ETSU: Harwell.<br />
2. 21 AD Architectural Digest for the 21st Century <strong>Photovoltaics</strong>. Eds. Roaf,<br />
S. and Walker, V. Oxford Brookes University.<br />
3. Sick, F. and Erge, T., Eds, (1996), <strong>Photovoltaics</strong> <strong>in</strong> Build<strong>in</strong>gs. James and<br />
James, London.<br />
4. Humm, O. and Togweiler, P., (1993), <strong>Photovoltaics</strong> <strong>in</strong> Architecture.<br />
Birkhauser, Basel.<br />
5. ECOTEC, ECD and NPAC, (1998), The Value of Electricity Generated<br />
from Photovoltaic Power Systems <strong>in</strong> Build<strong>in</strong>gs. ETSU S/P2/00279/REP.<br />
ETSU: Harwell.<br />
6. BP Solar, (1993), A Study of the Feasibility of Photovoltaic Modules as<br />
a Commercial Build<strong>in</strong>g Cladd<strong>in</strong>g Component. ETSU S/P2/00131/REP.<br />
ETSU: Harwell.<br />
7. Studio E Architects, (1995), <strong>Photovoltaics</strong> <strong>in</strong> Build<strong>in</strong>gs - A Survey of<br />
<strong>Design</strong> Tools. ETSU S/P2/00289/REP. ETSU - Harwell.<br />
8. Halcrow Gilbert Associates, (1993), Grid Connection of Photovoltaic<br />
Systems. ETSU S 1394-P1, ETSU: Harwell.<br />
9. Laukamp, H., (1994), The Basic German Electric Safety Standard and its<br />
Application to PV Systems. 12th European Conference PVSEC,<br />
Amsterdam.<br />
Web Sites<br />
BP Solar Web site: www.bp.com/bpsolar/<strong>in</strong>dex.html<br />
US Department of Environment Web site: www.eren.doe.gov/pv/<br />
61
62<br />
Glossary<br />
Air Mass Number A measure of the path length of sunlight<br />
through the atmosphere; expressed <strong>in</strong><br />
comparison with unit path length where the<br />
sun is directly overhead; used to def<strong>in</strong>e the<br />
<strong>in</strong>tensity and spectral distribution of sunlight.<br />
Air Mass 1.5 (AM1.5) The air mass number when the direction of the<br />
sun is 48° from the overhead position.<br />
Alternat<strong>in</strong>g Current (AC) Electric current <strong>in</strong> which the direction of flow<br />
is reversed at frequent <strong>in</strong>tervals. The<br />
conventional grid supply is AC with an<br />
alternat<strong>in</strong>g frequency of 50Hz.<br />
Amorphous The condition of a solid <strong>in</strong> which the atoms<br />
are not arranged <strong>in</strong> an orderly pattern; not<br />
crystall<strong>in</strong>e.<br />
Balance of System (BOS) The parts of a PV system other than the PV<br />
array itself, eg support structures, wir<strong>in</strong>g,<br />
power condition<strong>in</strong>g units etc.<br />
Block<strong>in</strong>g Diode * A diode connected <strong>in</strong> series to a PV str<strong>in</strong>g; it<br />
protects its modules from a reverse power<br />
flow and thus aga<strong>in</strong>st the risk of thermal<br />
destruction of solar cells.<br />
Bypass Diode * A diode fitted <strong>in</strong> parallel with each cell str<strong>in</strong>g<br />
of a module to prevent overheat<strong>in</strong>g (hot spot)<br />
of a cell due to localised shad<strong>in</strong>g.<br />
Conversion Efficiency The ratio of the electrical energy produced<br />
by a PV cell (or module) to the energy from<br />
sunlight <strong>in</strong>cident on the cell (or module). This is<br />
usually quoted for standard test conditions<br />
(STCs).<br />
Crystall<strong>in</strong>e The condition of a solid where the atoms are<br />
arranged <strong>in</strong> an ordered pattern.<br />
Daylight Factor * The illum<strong>in</strong>ance received at a po<strong>in</strong>t <strong>in</strong>doors,<br />
from a sky of known or assumed lum<strong>in</strong>ance<br />
distribution, expressed as a percentage of the<br />
horizontal illum<strong>in</strong>ance outdoors from an<br />
unobstructed hemisphere of the same sky.<br />
Diffuse Radiation Solar radiation scattered by the atmosphere.<br />
Direct Current (DC) Electric current which flows <strong>in</strong> one direction.<br />
Direct Radiation Solar radiation transmitted directly through the<br />
atmosphere.<br />
Electron Negatively charged atomic particle; an<br />
electric current is the movement of electrons<br />
through a material.
Global Irradiance The total irradiance (sunlight <strong>in</strong>tensity) fall<strong>in</strong>g<br />
on a surface; the sum of the direct and diffuse<br />
irradiance.<br />
Grid 1. The patterned metal contact on the top of<br />
the PV cell.<br />
2.Common name for the electrical distribution<br />
system.<br />
Irradiance The <strong>in</strong>tensity of solar radiation on a surface<br />
(W/m 2 ).<br />
Irradiation The amount of solar energy received on a<br />
surface (kWh/m 2 ).<br />
Kilowatt (kW) Unit of power equal to 1000W.<br />
Kilowatt-hour (kWh) Unit of energy equal to 1000Wh.<br />
Load Any device or appliance (or set of devices or<br />
appliances) which is us<strong>in</strong>g electrical power.<br />
Low-emissivity Glass * Glass with a low-emissivity coat<strong>in</strong>g on one<br />
surface; this allows short wavelength energy<br />
from the sun to pass through but reflects long<br />
wavelength energy back <strong>in</strong>, eg from a room.<br />
Megawatt (MW) Unit of power equal to 1,000,000W.<br />
Megawatt-hour (MWh) Unit of energy equal to 1,000,000Wh.<br />
Micron Unit of thickness equal to 10 -6 m.<br />
Multi-junction Cells * Two (or more) different cells with more than<br />
one p-n junction; such an arrangement allows<br />
a greater portion of the sun’s spectrum to be<br />
converted to electricity.<br />
Nom<strong>in</strong>al Array Power The power rat<strong>in</strong>g of an array <strong>in</strong> Wp, as<br />
measured under standard test conditions<br />
(STCs).<br />
Performance Ratio Ratio of the system yield to the <strong>in</strong>cident solar<br />
irradiation <strong>in</strong> the array plane.<br />
Photon A quantity of light hav<strong>in</strong>g a fixed energy<br />
dependent on the wavelength of the light.<br />
Photovoltaic (PV) Cell Semiconductor device that converts light to<br />
electricity us<strong>in</strong>g the photovoltaic effect.<br />
P-N Junction A junction formed between two<br />
semiconductors of different dop<strong>in</strong>g types; the<br />
usual configuration for a PV cell.<br />
Standard Test Conditions Standard test conditions are def<strong>in</strong>ed as an<br />
(STCs) irradiance of 1000W/m 2 at normal<br />
<strong>in</strong>cidence, a spectral distribution of that<br />
irradiance equivalent to AM1.5 and a cell<br />
temperature of 25 0 C.<br />
63
64<br />
System Yield Useful energy supplied to the load by the PV<br />
system expressed as a function of the nom<strong>in</strong>al<br />
array power (kWh/day per kWp).<br />
Uniformity Ratio * The ratio of the m<strong>in</strong>imum illum<strong>in</strong>ance to the<br />
average illum<strong>in</strong>ance.<br />
Watt (W) Unit of power.<br />
Watt-hour (Wh) Unity of energy; one Wh is consumed when<br />
one W of power is used for a period of one<br />
hour.<br />
Watt peak (Wp) Power output of a PV module under standard<br />
test conditions (STCs).<br />
Notes:<br />
1. This glossary is almost entirely the work of the National Photovoltaic<br />
Applications Centre. The present authors have made only m<strong>in</strong>or<br />
alterations to certa<strong>in</strong> terms or <strong>in</strong>troduced a small number of others<br />
<strong>in</strong>dicated by an asterix. The def<strong>in</strong>ition of block<strong>in</strong>g diodes comes from<br />
<strong>Photovoltaics</strong> <strong>in</strong> Build<strong>in</strong>gs (see bibliography) whilst the def<strong>in</strong>ition of<br />
bypass diodes come from ‘Stand alone PV systems: Guarantee of<br />
Results’, ETSU S/P2/00237/REP.<br />
2. ‘Light’ is used <strong>in</strong> common speech and <strong>in</strong> the text <strong>in</strong> a number of<br />
overlapp<strong>in</strong>g ways; the same is true for ‘sunlight’. Visible radiation<br />
(400-700nm) is commonly called light but ‘light’ is also used to<br />
describe a broader range of the electromagnetic spectrum. Similarly,<br />
‘sunlight’ is also referred to as sunsh<strong>in</strong>e or solar radiation. ‘Sunlight’ is<br />
normally broken down <strong>in</strong>to three components: ultraviolet, visible light<br />
and <strong>in</strong>frared.
Illustration Acknowledgements<br />
The author and publishers would like to thank the follow<strong>in</strong>g <strong>in</strong>dividuals and organisations for permission to reproduce<br />
material. We have made every effort to contact and acknowledge copyright holders, but if any errors have been made we<br />
would be happy to correct them at a later pr<strong>in</strong>t<strong>in</strong>g.<br />
A number of the orig<strong>in</strong>al illustrations have been redrawn for uniformity of style.<br />
Figures 2.14, 2.15 and 2.16 were produced by the authors us<strong>in</strong>g the Meteonorm 3.0 computer program. The idea for the form<br />
comes from the ECOFYS solar energy irradiation disk.<br />
Figure 1.1 Courtesy of Feilden Clegg Architects.<br />
Figure 1.2 Courtesy of Akeler Developments.<br />
Figure 1.3 Courtesy of ETSU/Department of Trade and Industry.<br />
Figure 1.4 Anon. (undated), Photovoltaic Technologies and their Future Potential. Commission of the European Communities<br />
Directorate - General XVII for Energy. EAB Energie - Anlagen, Berl<strong>in</strong>.<br />
Figure 2.3 Courtesy of NASA.<br />
Figure 2.4 Courtesy of Akeler Developments.<br />
Figure 2.5 Courtesy Max Fordham and Partners.<br />
Figure 2.9 Sick, F. and Erge, T., Eds, (1996), <strong>Photovoltaics</strong> <strong>in</strong> Build<strong>in</strong>gs. James and James, London.<br />
Figure 2.13 ETSU R82 Climate <strong>in</strong> the UK.<br />
Figure 2.17 Based on data from IT Power, (1996), Development of Photovoltaic Cladd<strong>in</strong>g Systems. ETSU S/P2/00216/REP, p.84.<br />
ETSU: Harwell.<br />
Figure 3.4(a) 21 AD Architectural Digest for the 21st Century, <strong>Photovoltaics</strong>. Eds. Roaf, S. and Walker, V. Oxford Brookes University.<br />
p.10-11, German 2000 Project. Roaf, S.<br />
Figure 3.4(b) Humm, O. and Toggweiler, P., (1993), <strong>Photovoltaics</strong> <strong>in</strong> Architecture. Birkhauser Verlag, Basel.<br />
Figure 3.5 BP Solar, (1993), A Study of the Feasibility of Photovoltaic Modules as a Commercial Build<strong>in</strong>g Cladd<strong>in</strong>g Component.<br />
ETSU S/P2/00131/REP. ETSU: Harwell.<br />
Figure 3.7(a) Courtesy of Nigel Francis Photography, Oxford. “The Roaf House, Oxford.”<br />
Figure 3.7(b) Courtesy of Redland Roof<strong>in</strong>g. “PV700 <strong>in</strong>tegrated <strong>in</strong>to a concrete tiled roof <strong>in</strong> Germany.”<br />
Figure 3.7(c) Courtesy of Ganz and Muller Architects. “Ecole Polytechnique Fédérale de Lausanne, Switzerland.”<br />
Figure 3.7(d) Courtesy of ETSU/Department of Trade and Industry. “The BP Solar showcase.”<br />
Figure 3.7(e) Courtesy Bear Associates. “National Environmental Education Centre, Netherlands.”<br />
Figure 3.7(f) Courtesy Max Fordham and Partners. “Build<strong>in</strong>g 16, The Build<strong>in</strong>g Research Establishment.”<br />
Figure 3.7(g) Photo by Schüco International KG. “Schüco International HQ.”<br />
Figure 3.7(h) Courtesy of BP Solar. “The Northumberland Build<strong>in</strong>g, University of Northumbria.”<br />
Figure 3.7(i) Courtesy Dennis Gilbert. "Doxford Solar Office."<br />
Figure 3.7(j) Courtesy of Tenum AG, Switzerland. ”The Öko-Bürohaus, Liestal.”<br />
Figure 3.7(k) Courtesy Colt International Limited. “Tess<strong>in</strong> Innkeepers Association.“<br />
Figure 3.8 Courtesy BP Solar.<br />
Figure 3.9 BP Solar (1993). A Study of the Feasibility of Photovoltaic Modules as a Commercial Build<strong>in</strong>g Cladd<strong>in</strong>g Component.<br />
ETSU S/P2/00131/REP. ETSU: Harwell.<br />
Figure 4.2 Based on data from Halcrow Gilbert Associates.<br />
Figure 5.2(a) Courtesy Max Fordham and Partners<br />
Figure 5.2(b) Courtesy Max Fordham and Partners<br />
Figure 5.3(a) Courtesy SMA Regelsysteme D-34266 Niestetal.<br />
Figure 5.3(b) Courtesy SMA Regelsysteme D-34266 Niestetal.<br />
Figure 5.4(a) Courtesy Max Fordham and Partners<br />
Figure 5.4(b) Courtesy Max Fordham and Partners<br />
Figure 5.5(a) Sick, F. and Erge, T., Eds, (1996), <strong>Photovoltaics</strong> <strong>in</strong> Build<strong>in</strong>gs. James and James, London.<br />
Figure 5.5(b) Courtesy BP Solar.<br />
Figure 5.6 Courtesy David Lloyd Jones, Studio E Architects.<br />
Figure A.1 Moon, P., (1940), Proposed standard solar radiation curve for eng<strong>in</strong>eer<strong>in</strong>g use. Journal of the Frankl<strong>in</strong> Institute, V230,<br />
p. 583 courtesy of the Frankl<strong>in</strong> Institute, Philadelphia, PA.<br />
Figure A.2 Courtesy of BP Solar.<br />
Figure A.3 21 AD Architectural Digest for the 21st Century, <strong>Photovoltaics</strong>. Eds. Roaf, S. and Walker, V. Oxford Brookes University.<br />
p.17-18, PV Module and System Development <strong>in</strong> Build<strong>in</strong>g Integration. Scott, R. D. W.<br />
Figure A.6 Sick, F. and Erge, T., Eds, (1996), <strong>Photovoltaics</strong> <strong>in</strong> Build<strong>in</strong>gs. James and James, London.<br />
Figure A.7 Humm, O. and Togweiler, P., (1993), <strong>Photovoltaics</strong> <strong>in</strong> Architecture. Birkhauser Verlag, Basel.<br />
Figure A.8 Sick, F. and Erge, T., Eds, (1996), <strong>Photovoltaics</strong> <strong>in</strong> Build<strong>in</strong>gs. James and James, London.<br />
Figure A.9 Anon. (undated), Photovoltaic Technologies and their Future Potential. Commission of the European Communities<br />
Directorate - General XVII for Energy. EAB Energie - Anlagen, Berl<strong>in</strong>.<br />
65
66<br />
Contacts<br />
Information on Dealers and System<br />
photovoltaics manufacturers <strong>in</strong>stallers/build<strong>in</strong>g<br />
<strong>in</strong>tegration<br />
The British Photovoltaic<br />
Association (PV-UK)<br />
The Warren,<br />
Bramshill Road, Eversley,<br />
Hants. RG27 0PR<br />
Tel: 0118 932 4418<br />
Fax: 0118 973 0820<br />
ETSU<br />
Harwell, Didcot,<br />
Oxon OX11 0RA<br />
Tel: 01235 432450<br />
Fax: 01235 433131<br />
Beco Batteries Ltd.<br />
8-10 Speedwell Units,<br />
Nelson Road,<br />
Dartmouth,<br />
Devon, TQ6 9SZ<br />
Tel: 01803 833 636<br />
Fax: 01803 835 379<br />
UK distributor of Solarex<br />
products.<br />
BP Solar Ltd.<br />
PO Box 191, Chertsey Road,<br />
Sunbury-on-Thames,<br />
Middlesex TW16 7XA<br />
Tel: 01932 779 543<br />
Fax: 01932 762 686<br />
Manufacturer of PV cells,<br />
modules and systems.<br />
Colt Group Ltd.<br />
New Lane, Havant,<br />
Hants. PO9 2LY<br />
Tel: 01705 451 111<br />
Fax: 01705 454 220<br />
Manufacturers and<br />
developers of architecturally<br />
<strong>in</strong>tegrated PV systems.<br />
Intersolar Ltd.<br />
Cock Lane,<br />
High Wycombe,<br />
Bucks HP13 7DE<br />
Tel: 01494 452 941<br />
Fax: 01494 437 045<br />
Manufacturer of PV modules<br />
and consumer products.<br />
Marlec Eng<strong>in</strong>eer<strong>in</strong>g Co. Ltd.<br />
Rutland House,<br />
Trevithick Road,<br />
Corby,<br />
Northants NN17 1XY<br />
Tel: 01536 201 588<br />
Fax: 01536 400 211<br />
Manufacturer of renewable<br />
energy systems. Agents for<br />
Solarex products.<br />
NAPS (UK)<br />
Neste Advanced Power<br />
Systems (UK),<br />
PO Box 83,<br />
Ab<strong>in</strong>gdon,<br />
Oxon OX14 2TB<br />
Tel: 01235 529 749<br />
Fax: 01235 553 450<br />
Module manufacturers and<br />
system suppliers.<br />
Pennmaritime Solar<br />
Baxter House,<br />
48 Church Road,<br />
Chavey Down, Ascot,<br />
Berks SL5 8RR<br />
Tel: 01344 891 118<br />
Fax: 01344 891 119<br />
System suppliers and UK<br />
distributor for Siemens Solar<br />
products.<br />
Pilk<strong>in</strong>gton Solar International<br />
Fourth Avenue,<br />
Deeside Industrial Park,<br />
Deeside,<br />
Clwyd CH5 2NR<br />
Tel: 01244 833 265<br />
Fax: 01244 288 473<br />
Suppliers of OPTISOL brand<br />
architectural PV products.<br />
Schuco International KG<br />
Whitehall Avenue,<br />
K<strong>in</strong>gston, Milton Keynes,<br />
Bucks MK10 0AL<br />
Tel: 01908 282 111<br />
Fax: 01908 282 124<br />
Manufacturers and suppliers<br />
of PV facades.<br />
Energy Equipment Test<strong>in</strong>g<br />
Service (EETS)<br />
104 Portmanmoor Road<br />
Industrial Estate,<br />
Cardiff CF2 2HB<br />
Tel: 01222 490 871<br />
Fax: 01222 454 887<br />
W<strong>in</strong>d and Sun<br />
The Howe,<br />
Watl<strong>in</strong>gton,<br />
Oxon OX9 5EX<br />
Tel: 01491 613 859<br />
Fax: 01491 614 164<br />
W<strong>in</strong>dsund Energy Systems<br />
Ltd.<br />
Unit 3,<br />
Industrial Estate.<br />
Spott Road,<br />
Dunbar<br />
East Lothian EH42 1RS<br />
Tel: 01368 863 981<br />
Fax: 01368 863 981<br />
ETSU can be contacted for <strong>in</strong>formation on national and <strong>in</strong>ternational PV programmes and<br />
research and fund<strong>in</strong>g opportunities.