Young driving learners' intention to use a handheld or hands-free ...
Young driving learners' intention to use a handheld or hands-free ...
Young driving learners' intention to use a handheld or hands-free ...

You also want an ePaper? Increase the reach of your titles
YUMPU automatically turns print PDFs into web optimized ePapers that Google loves.
<strong>Young</strong> <strong>driving</strong> learners’ <strong>intention</strong> <strong>to</strong> <strong>use</strong> a <strong>handheld</strong><br />
<strong>or</strong> <strong>hands</strong>-<strong>free</strong> mobile phone when <strong>driving</strong><br />
Ronggang Zhou a, *, Changxu Wu b , Pei-Luen Patrick Rau c , Wei Zhang c<br />
a<br />
School of Economics and Management, Beijing Universtiy of Aeronautics and Astronautics, Beijing 100083, PR China<br />
b<br />
Department of Industrial and Systems Engineering, State University of New Y<strong>or</strong>k (SUNY)-Buffalo, 414 Bell Hall, University at Buffalo, Buffalo14260, USA<br />
c<br />
Department of Industrial Engineering, Tsinghua Universtiy, Beijing 100084, PR China<br />
article info<br />
Article his<strong>to</strong>ry:<br />
Received 28 March 2008<br />
Received in revised f<strong>or</strong>m 24 November 2008<br />
Accepted 26 November 2008<br />
Keyw<strong>or</strong>ds:<br />
The the<strong>or</strong>y of planned behavi<strong>or</strong> (TPB)<br />
Mobile phone <strong>use</strong> when <strong>driving</strong><br />
Hands-<strong>free</strong> and <strong>handheld</strong> mode<br />
Mobile phone <strong>use</strong> <strong>intention</strong><br />
1. Introduction<br />
Transp<strong>or</strong>tation Research Part F 12 (2009) 208–217<br />
Contents lists available at ScienceDirect<br />
Transp<strong>or</strong>tation Research Part F<br />
journal homepage: www.elsevier.com/locate/trf<br />
abstract<br />
This paper presents a survey investigating young <strong>driving</strong> learners’ <strong>intention</strong> <strong>to</strong> <strong>use</strong> a <strong>handheld</strong><br />
<strong>or</strong> <strong>hands</strong>-<strong>free</strong> mobile phone when <strong>driving</strong>. A sample of 164 young <strong>driving</strong> learners<br />
completed a questionnaire based on the the<strong>or</strong>y of planned behavi<strong>or</strong> (TPB), which measured<br />
people’s <strong>intention</strong>s <strong>to</strong> <strong>use</strong> mobile phone while <strong>driving</strong> in <strong>handheld</strong> condition <strong>or</strong> <strong>hands</strong>-<strong>free</strong><br />
condition, along with their attitudes <strong>to</strong>wards the behavi<strong>or</strong>, subjective n<strong>or</strong>ms, perceived<br />
behavi<strong>or</strong>al control. The regression analysis models revealed that the TPB was able <strong>to</strong><br />
explain 43% and 48% variance in <strong>hands</strong>-<strong>free</strong> mobile phone <strong>use</strong> <strong>intention</strong> and <strong>handheld</strong><br />
mobile phone <strong>use</strong> <strong>intention</strong>, respectively, with perceived behavi<strong>or</strong>al control emerging as<br />
the strongest predic<strong>to</strong>r. In addition, TPB components, usage frequency and perceived risk<br />
were m<strong>or</strong>e dependent on gender than age. These results have several the<strong>or</strong>etical and practical<br />
implications. In particular, interventions should emphasize on the risk of <strong>hands</strong>-<strong>free</strong><br />
mobile phone <strong>use</strong> when <strong>driving</strong> f<strong>or</strong> young drivers, especially f<strong>or</strong> young male drivers.<br />
Crown Copyright Ó 2008 Published by Elsevier Ltd. All rights reserved.<br />
Epidemiological studies and c<strong>or</strong>relation studies suggested that mobile phone usage might be one of maj<strong>or</strong> fac<strong>to</strong>rs in a<br />
driver’s distraction and it would increase the likelihood of serious <strong>driving</strong> accidents (e.g., Laberge-Nadeau et al., 2003;<br />
Lamble, Rajalin, & Summala, 2002; McEvoy, Stevenson, & Woodward, 2006; Violanti, 1999; Violanti & Marshall, 1996). Mobile<br />
phone <strong>use</strong> while <strong>driving</strong> can ca<strong>use</strong> driver distraction, which can be divided in<strong>to</strong> two sides: physical distraction (e.g.,<br />
changes from steering wheel <strong>to</strong> holding and operating phone, diverting eyes from the road <strong>to</strong> phone’s keyboard <strong>or</strong> interface),<br />
and cognitive distraction (e.g., the demands of the phone conversation may influence <strong>driving</strong> safety). In <strong>or</strong>der <strong>to</strong> address the<br />
impacts of mobile phone <strong>use</strong> on driver behavi<strong>or</strong>, there was a significant body of research that had been conducted in a variety<br />
of experimental contexts, and the research had shown the impairment of mobile phone <strong>use</strong> on <strong>driving</strong> perf<strong>or</strong>mance (e.g.,<br />
Gugerty, Rakauskas, & Brooks, 2004; Nasar, Hecht, & Wener, 2008; Rakauskas, Gugerty, & Ward, 2004; Strayer, Drews, &<br />
Johns<strong>to</strong>n, 2003; Strayer & Johnson, 2001). These studies also varied in variables and conditions, including methods <strong>use</strong>d<br />
(e.g., simula<strong>to</strong>r, closed-track, and field testing), types and densities of roads (e.g., highway, urban, and rural road), demographic<br />
measures (e.g., age and gender) and experience of participants (professional <strong>or</strong> private drivers), modes of mobile<br />
phone (<strong>handheld</strong> <strong>or</strong> <strong>hands</strong>-<strong>free</strong>), and types of phone conversation (intense <strong>or</strong> not, demanding <strong>or</strong> not, naturalistic conversation<br />
<strong>or</strong> different types of arithmetical and grammatical tasks) (RoSPA, 2005).<br />
* C<strong>or</strong>responding auth<strong>or</strong>.<br />
E-mail addresses: zhrg@buaa.edu.cn (R. Zhou), changxu@buffalo.edu (C. Wu), rpl@tsinghua.edu.cn (P.-L. Patrick Rau), zhangwei@tsinghua.edu.cn (W.<br />
Zhang).<br />
1369-8478/$ - see front matter Crown Copyright Ó 2008 Published by Elsevier Ltd. All rights reserved.<br />
doi:10.1016/j.trf.2008.11.003
1.1. Literature review<br />
Recently, the issue of <strong>driving</strong> safety using different mobile phone modes has been under considerable debates. Some<br />
countries (e.g., Australia, N<strong>or</strong>way) have legislation <strong>to</strong> restrict the <strong>use</strong> of a <strong>handheld</strong> mobile phone while <strong>driving</strong>. Instead<br />
of focusing on the physical tasks that <strong>driving</strong> requires (e.g., steering, gear changing), drivers have <strong>to</strong> <strong>use</strong> hand(s) <strong>to</strong> manipulate<br />
the phone. Although the physical distraction may be less f<strong>or</strong> <strong>hands</strong>-<strong>free</strong> mobiles than f<strong>or</strong> <strong>handheld</strong> mobiles, both<br />
modes can ca<strong>use</strong> cognitive distraction which may have negative consequences (T<strong>or</strong>nros & Bolling, 2005). Haigney, Tayl<strong>or</strong>,<br />
and Westerman (2000) found that negative effects (e.g., reduced speed) were particularly apparent when participants were<br />
using a <strong>handheld</strong> phone. Under a close-circuit <strong>driving</strong> track environment, Treffner and Barrett (2004) investigated the effect<br />
of using a <strong>hands</strong>-<strong>free</strong> mobile phone on biomechanical and perceptual fac<strong>to</strong>rs that underlay the control of <strong>driving</strong>, and found<br />
that a driver’s sensitivity <strong>to</strong> prospective inf<strong>or</strong>mation about upcoming events may be significantly degraded while simultaneously<br />
using a <strong>hands</strong>-<strong>free</strong> mobile phone. In T<strong>or</strong>nros and Bolling’s (2005) study, the effects of <strong>hands</strong>-<strong>free</strong> and <strong>handheld</strong> mobile<br />
phone dialing and conversation on simulated <strong>driving</strong> were investigated, and the most imp<strong>or</strong>tant conclusion of this study<br />
was that <strong>hands</strong>-<strong>free</strong> mobile phones did not have any safety advantages. F<strong>or</strong> conversations, it seemed quite similar between<br />
<strong>hands</strong>-<strong>free</strong> and <strong>handheld</strong> mobile phones, and <strong>hands</strong>-<strong>free</strong> phones may even be less safe with regard <strong>to</strong> dialing.<br />
In spite of the negative effect of using a mobile phone (including <strong>hands</strong>-<strong>free</strong> mobile phone) while <strong>driving</strong> and the c<strong>or</strong>responding<br />
legal limitation, mobile phones are prevalently <strong>use</strong>d in <strong>driving</strong> context. F<strong>or</strong> example, in Australia, an estimated<br />
55% of drivers have <strong>use</strong>d a mobile phone and even m<strong>or</strong>e than 11% of them have written text messages while <strong>driving</strong> (McEvoy<br />
et al., 2006). Although understanding about the effects of mobile phone <strong>use</strong> when <strong>driving</strong> on <strong>driving</strong> perf<strong>or</strong>mance is very<br />
imp<strong>or</strong>tant, there have been few studies <strong>to</strong> explain why these people <strong>use</strong> mobile phone while <strong>driving</strong>. Some studies foc<strong>use</strong>d<br />
on the impact of demographic variables (e.g., age and gender) on driver’s mobile phone <strong>use</strong> while <strong>driving</strong>. There was evidence<br />
indicating that young and male drivers tended <strong>to</strong> <strong>use</strong> a mobile phone while <strong>driving</strong> m<strong>or</strong>e than older drivers <strong>or</strong> females (e.g.,<br />
Brusque & Alauzet, 2008; Lamble et al., 2002; Poysti, Rajalin, & Summala, 2005), and females were almost twice as likely <strong>to</strong><br />
expect certain mobile phone <strong>use</strong> restrictions as males were (Lamble et al., 2002). Theref<strong>or</strong>e, how can we exclusively address<br />
the people’s motivation <strong>or</strong> <strong>intention</strong> <strong>to</strong> <strong>use</strong> a mobile phone while <strong>driving</strong>, and how can we find out the effects of demographic<br />
variables and mobile phone mode on the <strong>intention</strong>? These questions are the main focus of this present research project.<br />
1.2. The aim of the study<br />
R. Zhou et al. / Transp<strong>or</strong>tation Research Part F 12 (2009) 208–217 209<br />
The first question is directly addressing people’s <strong>intention</strong> <strong>to</strong> <strong>use</strong> a mobile phone while <strong>driving</strong> and also is the main aim of<br />
this study. The the<strong>or</strong>y of planned behavi<strong>or</strong> (TPB; Ajzen, 1991) is perhaps best suited f<strong>or</strong> addressing this issue, beca<strong>use</strong> it is<br />
posited as a complete model of social behavi<strong>or</strong>. Acc<strong>or</strong>ding <strong>to</strong> TPB, <strong>intention</strong> is given a key role in the prediction of actual<br />
behavi<strong>or</strong>, and it is determined by attitude <strong>to</strong>ward the behavi<strong>or</strong> (produced by behavi<strong>or</strong>al beliefs about the likely outcomes<br />
of the behavi<strong>or</strong> and the evaluations of these outcomes), subjective n<strong>or</strong>ms (resulted from n<strong>or</strong>mative beliefs about the n<strong>or</strong>mative<br />
expectations of others and motivation <strong>to</strong> comply with these expectations), and perceived behavi<strong>or</strong>al control (induced by<br />
control beliefs about the presence of fac<strong>to</strong>rs that may facilitate <strong>or</strong> impede perf<strong>or</strong>mance of the behavi<strong>or</strong> and the perceived<br />
power of these fac<strong>to</strong>rs). Perceived control is also a co-determinant predic<strong>to</strong>r of behavi<strong>or</strong>. Much research has been conducted<br />
<strong>to</strong> supp<strong>or</strong>t the validity of TPB in a wide variety of behavi<strong>or</strong>al domains including <strong>driving</strong> safety. F<strong>or</strong> example, it has been applied<br />
successfully <strong>to</strong> investigate drivers’ compliance with the speed limit (Elliott, Armitage, & Baughan, 2003), and <strong>to</strong> account<br />
f<strong>or</strong> drivers’ <strong>intention</strong>s <strong>to</strong> commit four specific <strong>driving</strong> violations: drinking and <strong>driving</strong>, speeding, close following, and overtaking<br />
in risky circumstances (Parker, Manstead, Stradling, Reason, & Baxter, 1992). However, imp<strong>or</strong>tant research questions<br />
that have the<strong>or</strong>etical implications f<strong>or</strong> the TPB and practical implications f<strong>or</strong> <strong>driving</strong> safety remain unanswered. The central<br />
question investigated in the present study was ‘‘Can the TPB predict people’s <strong>intention</strong>s <strong>to</strong> <strong>use</strong> a <strong>handheld</strong> <strong>or</strong> <strong>hands</strong>-<strong>free</strong> mobile<br />
phone while <strong>driving</strong>?” To date, no research has been found <strong>to</strong> apply the TPB <strong>to</strong> mobile phone <strong>use</strong> in <strong>driving</strong> context. The<br />
TPB can solve the challenge f<strong>or</strong> psychologists <strong>to</strong> identify variables that mediate relationships between the demographic measures<br />
of drivers and their mobile phone <strong>use</strong> behavi<strong>or</strong>. One of the aims of the present study was <strong>to</strong> <strong>use</strong> the TPB <strong>to</strong> determine<br />
the impact of demographic characteristics on people’s <strong>intention</strong> of mobile phone <strong>use</strong> while <strong>driving</strong> whether in <strong>handheld</strong> condition<br />
<strong>or</strong> <strong>hands</strong>-<strong>free</strong> condition.<br />
The second question addressed in the present study was related <strong>to</strong> how the behavi<strong>or</strong> of mobile phone <strong>use</strong>rs in daily life<br />
and their perceived risk fac<strong>to</strong>r affect their <strong>intention</strong> <strong>to</strong> <strong>use</strong> a mobile phone in future <strong>driving</strong> context. It was well known that<br />
the frequency of mobile phone <strong>use</strong> while <strong>driving</strong> was related <strong>to</strong> mobile usage in daily life (e.g., Brusque & Alauzet, 2008), and<br />
those drivers who <strong>use</strong>d phones everyday were m<strong>or</strong>e likely <strong>to</strong> want some restrictions f<strong>or</strong> mobile phone <strong>use</strong> when <strong>driving</strong>,<br />
than those who had lower usage (Lamble et al., 2002). In <strong>or</strong>der <strong>to</strong> know people’s deep <strong>intention</strong> of mobile phone <strong>use</strong> while<br />
<strong>driving</strong>, we compared the subjective responses of different respondents whose usages mobile phone were different in daily<br />
life context and <strong>driving</strong> context: If a driver rep<strong>or</strong>ts m<strong>or</strong>e frequent mobile phone <strong>use</strong> in daily life than in <strong>driving</strong> context, the<br />
conclusion will be that the driver can perceive higher risk f<strong>or</strong> mobile phone <strong>use</strong> while <strong>driving</strong>, <strong>or</strong> be m<strong>or</strong>e willing <strong>to</strong> obey the<br />
restriction of mobile phone <strong>use</strong> when <strong>driving</strong>. At the same time, the comparisons among usage activities (e.g., dialing) could<br />
address whether there was a difference existing in these behavi<strong>or</strong>al <strong>intention</strong>s. This investigation about the difference of the<br />
frequency of mobile phone usage was conducted regardless of mobile phone modes.<br />
Finally, it is well known that the mobile phone <strong>use</strong> behavi<strong>or</strong>s while <strong>driving</strong> are related <strong>to</strong> drivers’ perceived risks f<strong>or</strong> these<br />
behavi<strong>or</strong>s, so in this present study, drivers’ perceived risks were also collected. Acc<strong>or</strong>ding <strong>to</strong> the comparison of <strong>to</strong>tal fre-
210 R. Zhou et al. / Transp<strong>or</strong>tation Research Part F 12 (2009) 208–217<br />
quency of <strong>use</strong> between <strong>driving</strong> context and daily life context, the participants were asked <strong>to</strong> rep<strong>or</strong>t the degree of risk <strong>to</strong> ‘‘mobile<br />
phone <strong>use</strong> while <strong>driving</strong>”, and this was entitled as perceived general risk in the present study. In <strong>or</strong>der <strong>to</strong> explain the<br />
<strong>intention</strong> <strong>to</strong> <strong>use</strong> <strong>handheld</strong> <strong>or</strong> <strong>hands</strong>-<strong>free</strong> mobile phone when <strong>driving</strong>, this study also rec<strong>or</strong>ded the rate of agreement of participants’<br />
responses <strong>to</strong> ‘‘f<strong>or</strong> <strong>driving</strong>, using <strong>hands</strong>-<strong>free</strong> mobile phone is safer than using a <strong>handheld</strong> one”, and this was identified<br />
as perceived <strong>hands</strong>-<strong>free</strong> <strong>use</strong> risk in this study.<br />
Age and gender were imp<strong>or</strong>tant fac<strong>to</strong>rs in the analysis of usage frequency when comparing <strong>driving</strong> context with daily life<br />
context as well as perceived risk. Acc<strong>or</strong>ding <strong>to</strong> the previous research (e.g., Brusque & Alauzet, 2008; Lamble et al., 2002; Poysti<br />
et al., 2005), young people tended <strong>to</strong> <strong>use</strong> mobile phone m<strong>or</strong>e frequently in both contexts of <strong>driving</strong> and daily life than<br />
older people. Theref<strong>or</strong>e, our study foc<strong>use</strong>d on young people’s <strong>intention</strong> <strong>to</strong> <strong>use</strong> a mobile phone while <strong>driving</strong>. In line with<br />
the previous studies (e.g., Lamble et al., 2002; Poysti et al., 2005), participants at 17–24 years and 25–34 years were recruited<br />
as young people.<br />
To summarize, the main goals of the present study were <strong>to</strong>:<br />
(1) Apply the TPB approach <strong>to</strong> examine mobile phone <strong>use</strong> behavi<strong>or</strong> while <strong>driving</strong>.<br />
(2) Examine the extent that the TPB components mediate the effects of mobile phone modes (<strong>hands</strong>-<strong>free</strong> and <strong>handheld</strong>)<br />
and demographic variables (age and gender) on mobile phone <strong>use</strong> while <strong>driving</strong>.<br />
(3) Address mobile phone usage frequency in <strong>driving</strong> condition and daily life condition, as well as participants’ perceived<br />
risk of mobile phone <strong>use</strong> while <strong>driving</strong>, <strong>to</strong> supp<strong>or</strong>t the explanation of mobile phone <strong>use</strong> <strong>intention</strong> while <strong>driving</strong> in the<br />
context of TPB.<br />
2. Method<br />
2.1. Participant<br />
There were <strong>to</strong>tally 164 participants in this study (overall age range: 17–43 years old), including 43 males (17–24 years<br />
old), 30 males (25–34 years old), 41 females (17–24 years old), and 50 females (25–34 years old). None of the respondents<br />
held a driver’s license, but they were learning how <strong>to</strong> drive at a <strong>driving</strong> training school in Beijing. Some of the them were<br />
learning current <strong>driving</strong> regulations in China, and others had passed the regulation test and were learning how <strong>to</strong> perf<strong>or</strong>m<br />
specific <strong>driving</strong> actions (such as steering).<br />
2.2. Materials<br />
2.2.1. Situation A<br />
You <strong>use</strong> a mobile phone with hand-set mode. And now you are <strong>driving</strong> at 60 km/h. At this moment, you receive an imp<strong>or</strong>tant<br />
incoming call, so you answer the call while <strong>driving</strong>.<br />
2.2.2. Situation B<br />
You <strong>use</strong> a mobile phone with <strong>hands</strong>-<strong>free</strong> mode. And now you are <strong>driving</strong> at 60 km/h. At this moment, you receive an<br />
imp<strong>or</strong>tant incoming call, so you answer the call while <strong>driving</strong>.<br />
2.2.3. Questionnaire<br />
The standard TPB model included behavi<strong>or</strong>al <strong>intention</strong>, attitude, subjective n<strong>or</strong>m, and perceived behavi<strong>or</strong>al control, which<br />
were asked in each situation. Also demographic measures, risk perception, future behavi<strong>or</strong>, and previous behavi<strong>or</strong> were<br />
asked.<br />
2.2.3.1. Demographic measures. The following demographic variables were collected in this study: age, gender, education<br />
(elementary school, juni<strong>or</strong> high school, seni<strong>or</strong> high school, associates, bachel<strong>or</strong>s, masters, and PhD), occupation and mobile phone<br />
mode (hand <strong>free</strong> and hand set) <strong>use</strong>d.<br />
2.2.3.2. Behavi<strong>or</strong>al <strong>intention</strong>. Behavi<strong>or</strong> <strong>intention</strong> was assessed by a mean of four items. Each item was rated on a 7-point<br />
bipolar scale ranging from 3 <strong>to</strong> +3. The four items were: ‘‘In such a situation, how likely is it that you will <strong>use</strong> a mobile<br />
phone”(very unlikely <strong>to</strong> very likely), ‘‘In a similar situation in the future, do you intend <strong>to</strong> <strong>use</strong> a mobile phone while <strong>driving</strong><br />
”(definitely do <strong>to</strong> definitely do not), ‘‘In a similar situation in the future, what is the degree that you will avoid using a mobile<br />
phone while <strong>driving</strong>? ” (very little <strong>to</strong> very great), ‘‘In a similar situation in the future, how likely <strong>or</strong> unlikely is it that you will<br />
<strong>use</strong> mobile phone while <strong>driving</strong>” (very unlikely <strong>to</strong> very likely).<br />
2.2.3.3. Attitude. Attitude was measured directly by asking respondents <strong>to</strong> complete the following statement by rating five<br />
pairs of adjectives, each on a 7-point bipolar semantic differential scales: ‘‘ F<strong>or</strong> me, using a mobile phone while <strong>driving</strong> in this<br />
situation would be...” The five pairs of adjectives were: bad – good, dangerous – safe, enjoyable – not enjoyable, necessary –
unnecessary, foolish – wise. Each item was sc<strong>or</strong>ed from 3 <strong>to</strong> +3. The mean of these items was calculated and <strong>use</strong>d <strong>to</strong> produce<br />
a composite scale f<strong>or</strong> attitude measure.<br />
2.2.3.4. Subjective n<strong>or</strong>m. The standard questionnaire items were <strong>use</strong>d <strong>to</strong> measure the subjective n<strong>or</strong>m by calculating the<br />
mean of three items, each rated on a 7-point unipolar scale ranging from 1 <strong>to</strong> 7. The three items were ‘‘People who are imp<strong>or</strong>tant<br />
<strong>to</strong> me would hope that I would <strong>use</strong> a mobile phone while <strong>driving</strong> in this situation” (strongly disagree <strong>to</strong> strongly agree),<br />
‘‘People who are imp<strong>or</strong>tant <strong>to</strong> me would (disapprove–approve) of my using a mobile phone while <strong>driving</strong> in this situation”,<br />
‘‘People who are imp<strong>or</strong>tant <strong>to</strong> me would think that I (should not–should) <strong>use</strong> a mobile phone while <strong>driving</strong> in this situation”.<br />
2.2.3.5. Perceived behavi<strong>or</strong>al control. The mean of two items was <strong>use</strong>d as a measure of perceived behavi<strong>or</strong> control. Each item<br />
was rated by respondents on a 7-point unipolar scale ranging from 1 <strong>to</strong> 7. The two items were: ‘‘In this situation, I believe<br />
that I have the ability <strong>to</strong> <strong>use</strong> a mobile phone” (strongly disagree <strong>to</strong> strongly agree), ‘‘F<strong>or</strong> me, using a mobile phone in this situation<br />
would be” (very easy <strong>to</strong> very difficult).<br />
2.2.3.6. Perceived risk. Risk perception was measured by two statements. Each statement was rated by respondents on a 7point<br />
unipolar scale ranging from 1 <strong>to</strong> 7. The two statements were: ‘‘F<strong>or</strong> you, while <strong>driving</strong>, what do you think is the effect of<br />
using a mobile phone on <strong>driving</strong> safely?”(no effect <strong>to</strong> much effect), ‘‘While <strong>driving</strong>, using a <strong>hands</strong>-<strong>free</strong> mobile phone is safer<br />
than using a hand-set mobile phone” (strongly disagree <strong>to</strong> strongly agree).<br />
2.2.3.7. Future behavi<strong>or</strong> of using a mobile phone while <strong>driving</strong>. Future behavi<strong>or</strong> of using a mobile phone while <strong>driving</strong> was<br />
measured by rating five different kinds of mobile phone usage related behavi<strong>or</strong>, each rated on a 7-point unipolar scale from<br />
1 <strong>to</strong> 7: ‘‘F<strong>or</strong> you, how frequently will you ____ while <strong>driving</strong>?” (very frequently <strong>to</strong> very less). The five kinds of behavi<strong>or</strong>s were:<br />
dialing a number, answering a call, refusing an incoming call, sending a sh<strong>or</strong>t message, and reading a sh<strong>or</strong>t message.<br />
2.2.3.8. Previous behavi<strong>or</strong> of mobile phone usage in daily life. The behavi<strong>or</strong> of mobile phone usage in daily life was measured by<br />
rating three different kinds of mobile phone using related behavi<strong>or</strong>s, each on a 7-point unipolar scale: ‘‘In your daily life except<br />
f<strong>or</strong> <strong>driving</strong>, how frequently you will _____?” (very frequently <strong>to</strong> very less). The three kinds of behavi<strong>or</strong>s were: dialing a<br />
number, answering a call, and checking a sh<strong>or</strong>t message”. Each question was rated by a 7-point unipolar scales ranging from<br />
1<strong>to</strong>7.<br />
3. Results<br />
3.1. Mobile phone mode and behavi<strong>or</strong>al <strong>intention</strong>: the application of the TPB<br />
3.1.1. Test of discriminate validity and consistent reliability<br />
In acc<strong>or</strong>d with previous studies (Ajzen, 1991; Elliott et al., 2003; Holland & Hill, 2007), principal-components and internal<br />
consistency analysis were <strong>use</strong>d <strong>to</strong> test the validity and reliability of the TPB scales. Acc<strong>or</strong>ding <strong>to</strong> Holland and Hill’s method<br />
(2007), principal-components analysis were <strong>use</strong>d <strong>to</strong> analyze the items measuring behavi<strong>or</strong>al <strong>intention</strong>, attitude, subjective<br />
n<strong>or</strong>m, and perceived behavi<strong>or</strong>al control. Also in <strong>or</strong>der <strong>to</strong> test internal reliability, Cronbach’s a coefficients were calculated f<strong>or</strong><br />
each of the self-rep<strong>or</strong>ted scales <strong>use</strong>d in TPB measures. In this study, the responses in the <strong>handheld</strong> mode situation and <strong>hands</strong><strong>free</strong><br />
mode situation were <strong>use</strong>d <strong>to</strong>gether f<strong>or</strong> these analyses (e.g., Holland & Hill, 2007; and see Table 1). F<strong>or</strong> each subscale (e.g.,<br />
the behavi<strong>or</strong>al <strong>intention</strong>, attitude, subjective n<strong>or</strong>m and perceived behavi<strong>or</strong>al control), only one fac<strong>to</strong>r with eigenvalues greater<br />
than 1 emerged from the c<strong>or</strong>responding data, and at least accounted f<strong>or</strong> 62.67% variance. The results provided strong evidence<br />
f<strong>or</strong> the independence of the self-rep<strong>or</strong>ted scales <strong>use</strong>d <strong>to</strong> measure each TPB component. In Table 1, the Cronbach’s a<br />
statistics f<strong>or</strong> each scale was high (0.74 <strong>or</strong> higher), and indicated reasonable inner reliability f<strong>or</strong> each TPB component measured.<br />
These psychometric analyses showed that the self-rep<strong>or</strong>ted measures designed in this study were sufficiently valid<br />
and reliable.<br />
3.1.2. Descriptive findings<br />
The first stage in the analysis of the data was <strong>to</strong> compare responses in the two situations. Mean sc<strong>or</strong>es of attitude, subjective<br />
n<strong>or</strong>m, perceived behavi<strong>or</strong>al control and behavi<strong>or</strong>al <strong>intention</strong> were plotted by gender, age group and mobile phone<br />
Table 1<br />
Principal-components, Cronbach’s a statistics f<strong>or</strong> the<strong>or</strong>y of planned behavi<strong>or</strong> (n = 191 2).<br />
R. Zhou et al. / Transp<strong>or</strong>tation Research Part F 12 (2009) 208–217 211<br />
Variable Number of Items Cronbach’s a % of variance Range<br />
1. Behavi<strong>or</strong>al <strong>intention</strong> 4 0.79 62.67 3<strong>to</strong>3<br />
2. Attitude 5 0.84 61.69 3<strong>to</strong>3<br />
3. Subjective n<strong>or</strong>m 3 0.90 83.98 1–7<br />
4. Perceived behavi<strong>or</strong>al control 2 0.74 79.03 1–7
212 R. Zhou et al. / Transp<strong>or</strong>tation Research Part F 12 (2009) 208–217<br />
Self-rep<strong>or</strong>tted sc<strong>or</strong>es<br />
6<br />
5<br />
4<br />
3<br />
2<br />
1<br />
0<br />
-1<br />
-2<br />
Hands-<strong>free</strong> Situation Hands-held Situation<br />
ATT SN PBC BI ATT SN PBC BI<br />
17-24 years Male<br />
25-34 years Male<br />
TPB Compents<br />
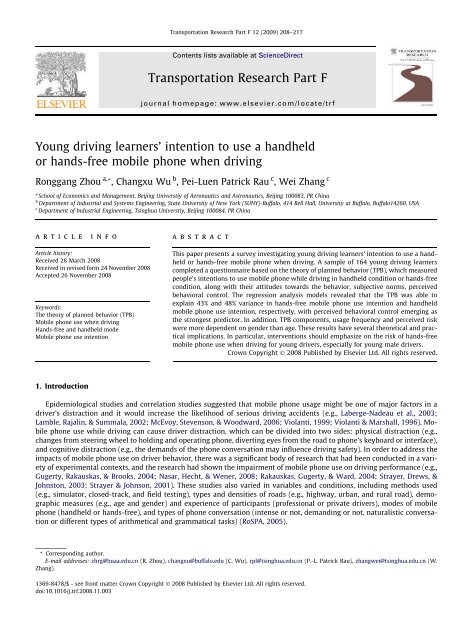
Fig. 1. Means of the components of the TPB.<br />
17-24 years Female<br />
25-34 years Female<br />
mode in Fig. 1. The figure showed, (1) participants’ response on attitude, subjective n<strong>or</strong>m, perceived behavi<strong>or</strong>al control and<br />
behavi<strong>or</strong>al <strong>intention</strong> <strong>to</strong>ward <strong>handheld</strong> mode had lower sc<strong>or</strong>es than <strong>to</strong>ward <strong>hands</strong>-<strong>free</strong> mode, which suggested that in comparison<br />
with <strong>handheld</strong> mode, young <strong>driving</strong> learners considered <strong>hands</strong>-<strong>free</strong> mode <strong>to</strong> be safer, and they believed that significant<br />
other people (such as family members and friends) would supp<strong>or</strong>t their using <strong>hands</strong>-<strong>free</strong> mobile, and thought they<br />
would have m<strong>or</strong>e control power <strong>to</strong> <strong>use</strong> it. Theref<strong>or</strong>e, they rep<strong>or</strong>ted they would have m<strong>or</strong>e <strong>intention</strong> <strong>to</strong> <strong>use</strong> a <strong>hands</strong>-<strong>free</strong> mobile<br />
phone when <strong>driving</strong>; (2) male respondents rep<strong>or</strong>ted relatively stronger perceived behavi<strong>or</strong>al control f<strong>or</strong> using a mobile<br />
phone when <strong>driving</strong> than female respondents.<br />
The above conclusions were tested by ANOVA. Attitude, subjective n<strong>or</strong>m, perceived behavi<strong>or</strong>al control and <strong>intention</strong> were<br />
subjected <strong>to</strong> a repeated measure analysis of variance: gender (subject-between variable, male vs. female) age (subject-between<br />
variable, ages 17–24 years vs. ages 25–34 years) situation (subject-within variable, <strong>handheld</strong> mode vs. <strong>hands</strong>-<strong>free</strong><br />
mode). The results indicated that the differences of all the TPB components between different mobile phone mode situations<br />
were significant: behavi<strong>or</strong>al <strong>intention</strong>, F (1, 160) = 67.59, p < 0.001; attitude, F (1, 160) = 175.24, p < 0.001; subjective n<strong>or</strong>m, F<br />
(1, 160) = 96.33, p < 0.001; and perceived behavi<strong>or</strong>al control, F (1, 160) = 102.47, p < 0.001. Also the main effects of gender<br />
were significant on perceived behavi<strong>or</strong>al control, F (1, 160) = 7.47, p < 0.01. The main effect of age group and all the interaction<br />
effects (between gender, age group, and mobile phone mode situation) were not significant in this study. So the two<br />
conclusions were supp<strong>or</strong>ted.<br />
3.1.3. C<strong>or</strong>relations between TPB components<br />
Consistent with the TPB, zero-<strong>or</strong>der c<strong>or</strong>relations were calculated between the standard TPB measures f<strong>or</strong> each mobile<br />
phone mode situation, and the results are shown in Table 2. In each mode, the attitude, subjective n<strong>or</strong>m, perceived behavi<strong>or</strong>al<br />
control were all positively c<strong>or</strong>related with <strong>intention</strong> <strong>to</strong> <strong>use</strong> mobile phone when <strong>driving</strong>.<br />
3.1.4. Predic<strong>to</strong>rs of <strong>intention</strong>s: regression analyses<br />
To address the two main aims of the study, f<strong>or</strong> each mobile phone mode situation, a series of hierarchical multiple linear<br />
regression analyses were <strong>use</strong>d <strong>to</strong> assess the contribution of the components of the TPB <strong>to</strong> the prediction of behavi<strong>or</strong>al <strong>intention</strong>,<br />
along with the contribution of gender and age <strong>to</strong> it. F<strong>or</strong> each situation, the key predic<strong>to</strong>rs of <strong>driving</strong> learners’ <strong>intention</strong><br />
<strong>to</strong> <strong>use</strong> a mobile phone when <strong>driving</strong> were identified by regressing behavi<strong>or</strong>al <strong>intention</strong> on the demographic variables (gender<br />
Table 2<br />
Zero-<strong>or</strong>der c<strong>or</strong>relations between the components of the TPB.<br />
Variable 1 2 3 4<br />
1. Behavi<strong>or</strong>al <strong>intention</strong> – 0.54 0.47 0.63<br />
2. Attitude 0.53 – 0.47 0.59<br />
3. Subjective n<strong>or</strong>m 0.54 0.55 – 0.38<br />
4. Perceived behavi<strong>or</strong>al control 0.60 0.65 0.59 –<br />
Note. Coefficients above the diagonal related <strong>to</strong> <strong>handheld</strong> mode, those below the diagonal related <strong>to</strong> <strong>hands</strong>-<strong>free</strong> mode.<br />
F<strong>or</strong> all c<strong>or</strong>relation coefficients, p < 0.01.
Table 3<br />
Hierarchical regression analysis: predicting behavi<strong>or</strong>al <strong>intention</strong>s.<br />
Step and predic<strong>to</strong>r Hands-<strong>free</strong> situation Handheld situation<br />
and age group) at Step 1 and the TPB variables (attitude, subjective n<strong>or</strong>m, and perceived control) at Step 2. In this way, it was<br />
possible <strong>to</strong> assess the predictive utility of the TPB constructs after controlling the influence of age and gender (see Table 3).<br />
In the <strong>hands</strong>-<strong>free</strong> situation, (1) age and gender were only able <strong>to</strong> explain 1% of the variance, so both variables were not<br />
significant predic<strong>to</strong>rs; (2) the TPB variables, when added <strong>to</strong> the regression equation, were able <strong>to</strong> explain 42% of the variance,<br />
and <strong>to</strong>tally resulted in a substantial and statistically significant increment <strong>to</strong> 43%, with attitude, subjective n<strong>or</strong>m and perceived<br />
behavi<strong>or</strong>al control emerging as significant predic<strong>to</strong>rs (F (5, 158) = 23.61, p < 0.001). As f<strong>or</strong> the <strong>handheld</strong> situation,<br />
(1) age and gender were able <strong>to</strong> explain 4% of the variance, with gender emerging as a significant predic<strong>to</strong>r; (2) the addition<br />
of the TPB <strong>to</strong> the regression model resulted in an obvious increment <strong>to</strong> 58%, with attitude, subjective n<strong>or</strong>m and perceived<br />
behavi<strong>or</strong>al control emerging as significant predic<strong>to</strong>rs along with gender (F (5, 158) = 29.63, p < 0.001). Age was not a significant<br />
predic<strong>to</strong>r f<strong>or</strong> both regression models, and only gender had a significant impact in the <strong>handheld</strong> situation. In both mobile<br />
phone regression modes, it was very clear that attitude and subjective n<strong>or</strong>m were less imp<strong>or</strong>tant predic<strong>to</strong>rs of <strong>intention</strong><br />
<strong>to</strong> <strong>use</strong> mobile phone than perceived behavi<strong>or</strong>al control was. In <strong>or</strong>der <strong>to</strong> examine whether the model differed f<strong>or</strong> the different<br />
age groups and gender, age and gender were grouped as male aged at 17–24 years, female aged at 17–24 years, male aged<br />
25–34 years, and female aged at 25–34 years, and then separate regression analyses were computed f<strong>or</strong> the different age and<br />
gender groups. Considering the possible differences between the mode situations in overall regression models, the mode situation<br />
was entered as a predic<strong>to</strong>r at Step 1, and attitude, subjective n<strong>or</strong>m, and perceived behavi<strong>or</strong>al control were entered at<br />
Step 2. Results of these regressions were shown in Table 4. The following results were very clear. First, when entered <strong>to</strong> the<br />
regression model along with the TPB measures, mode situation did not add significantly <strong>to</strong> the variance predicted f<strong>or</strong> any<br />
group. Second, although the model was a good fit f<strong>or</strong> all age groups, accounting f<strong>or</strong> between 40% and 61% of the variance,<br />
m<strong>or</strong>e variance is noted in the 25–34 year female group (68%) than in other groups. Third, attitude does not account f<strong>or</strong> a<br />
significant independent amount of variance f<strong>or</strong> male group aged 17–24 years and female group aged 17–24 years, but result<br />
indicates a significant predic<strong>to</strong>r f<strong>or</strong> male group aged 25–34 years and female group aged 25–34 years. Fourth, the contribution<br />
of perceived behavi<strong>or</strong>al control <strong>to</strong> the model was m<strong>or</strong>e obvious f<strong>or</strong> female groups than f<strong>or</strong> male groups.<br />
3.2. Future mobile phone usage when <strong>driving</strong>: comparison with daily usage<br />
b (Step 1) b (Step 2) b (Step 1) b (Step 2)<br />
1. Age group 0.06 0.02 1.07 0.04<br />
Gender 0.09 0.03 1.67 *<br />
0.09<br />
2. Attitude 0.18 *<br />
0.18 *<br />
Subjective n<strong>or</strong>m 0.23 **<br />
0.23 **<br />
Perceived behavi<strong>or</strong>al control 0.34 ***<br />
0.41 ***<br />
F 1.11 23.61 ***<br />
3.71 **<br />
29.63 ***<br />
R 2<br />
0.01 0.43 0.04 0.48<br />
DR 2<br />
– 0.42 – 0.44<br />
* p < 0.05.<br />
** p < 0.01.<br />
*** p < 0.001.<br />
The mean calculations of self-rep<strong>or</strong>ted different mobile phone usages in future <strong>driving</strong> and in pri<strong>or</strong> daily life were plotted<br />
by gender and age group in Fig. 2. As provided in the figure, (1) participants’ response on dialing, answering and sh<strong>or</strong>t message<br />
usage had a higher sc<strong>or</strong>e in daily life than responding behavi<strong>or</strong> in future <strong>driving</strong>, (2) considering the usage in daily life,<br />
Table 4<br />
Comparison of regression models across the age and gender groupings.<br />
Step and predic<strong>to</strong>r 17–24 years male (n =43 2) 17–24 years female (n =41 2) 25–34 years male (n =30 2) 25–34 years female (n =50 2)<br />
b (Step 1) b (Step 2) b (Step 1) b (Step 2) b (Step 1) b (Step 2) b (Step 1) b (Step 2)<br />
1. Mode situation 0.34 **<br />
0.01 0.25 0.10 0.25 *<br />
0.05 0.41 ***<br />
0.02<br />
2. ATT 0.05 0.13 0.59 ***<br />
0.25 **<br />
SN 0.42 ***<br />
0.10 0.06 0.09 *<br />
PBC 0.27 *<br />
0.60 ***<br />
0.15 0.56 ***<br />
F 10.92 **<br />
13.60 ***<br />
3.79 14.60 ***<br />
5.26 *<br />
14.08 ***<br />
19.36 ***<br />
50.47 ***<br />
R 2<br />
0.12 0.40 0.06 0.52 0.06 0.42 0.17 0.68<br />
DR 2<br />
– 0.28 – 0.46 – 0.36 – 0.51<br />
* p < 0.05.<br />
** p < 0.01.<br />
*** p < 0.001.<br />
R. Zhou et al. / Transp<strong>or</strong>tation Research Part F 12 (2009) 208–217 213
214 R. Zhou et al. / Transp<strong>or</strong>tation Research Part F 12 (2009) 208–217<br />
Frequency of behavi<strong>or</strong>s<br />
7<br />
6.5<br />
6<br />
5.5<br />
5<br />
4.5<br />
4<br />
3.5<br />
3<br />
2.5<br />
2<br />
1.5<br />
1<br />
Dialing<br />
Future behari<strong>or</strong> of using<br />
a mobile phone while <strong>driving</strong><br />
Answering<br />
Refusing<br />
Age Groups (years)<br />
Sh<strong>or</strong>t Message<br />
Checking<br />
Sh<strong>or</strong>t Message<br />
Sending<br />
Male<br />
Female<br />
the difference between sh<strong>or</strong>t message services <strong>use</strong> and dialing was not obvious, while sh<strong>or</strong>t message services was <strong>use</strong>d the<br />
least in future <strong>driving</strong> environment, (3) as f<strong>or</strong> future <strong>driving</strong> behavi<strong>or</strong>, male participants’ response had a higher sc<strong>or</strong>e on dialing,<br />
answering, sh<strong>or</strong>t message sending than females’ response, and females’ response had a higher sc<strong>or</strong>e on refusing mobile<br />
phone <strong>use</strong> than males’ response, (4) in future <strong>driving</strong> behavi<strong>or</strong>, no difference was found on sh<strong>or</strong>t message checking between<br />
males aged at 17–24 years and 25–34 years, while ages 17–24 years females rep<strong>or</strong>ted m<strong>or</strong>e sh<strong>or</strong>t message checking than<br />
ages 25–34 years females.<br />
All of these conclusions were supp<strong>or</strong>ted by statistical analyses. Different mobile phone usages in future <strong>driving</strong> <strong>or</strong> in pri<strong>or</strong><br />
daily life were subjected, respectively, <strong>to</strong> a univariate analysis of variance: gender (subject-between variable, male vs. female)<br />
age (subject-between variable, age at 17–24 years vs. age at 25–34 years). The results are summarized in Table 5. First,<br />
f<strong>or</strong> sh<strong>or</strong>t message services usage (both in future <strong>driving</strong> and pri<strong>or</strong> daily life), and answering in the daily usage, there was no<br />
apparent difference between male and female participants; while the main effect of gender on other mobile phone usages<br />
was significant. The result may stand that male respondents tend <strong>to</strong> <strong>use</strong> mobile phone with activities of dialing and answering<br />
m<strong>or</strong>e frequently than females, but as sh<strong>or</strong>t message services, which need m<strong>or</strong>e physical distraction, they rep<strong>or</strong>ted less<br />
<strong>use</strong> as females. Second, as f<strong>or</strong> mobile <strong>use</strong> in future <strong>driving</strong>, ages 17–24 years participants rep<strong>or</strong>ted m<strong>or</strong>e usage frequency<br />
than ages 25–34 years participants, the main effects of age group on dialing, answering, sh<strong>or</strong>t message checking, and sh<strong>or</strong>t<br />
message sending were all significant. Third, the interaction effect indicated that ages 17–24 years female respondents rep<strong>or</strong>ted<br />
m<strong>or</strong>e <strong>use</strong> on sh<strong>or</strong>t message checking in future <strong>driving</strong> and on sh<strong>or</strong>t message services in daily life, while no significant<br />
difference was found between male respondents aged at 17–24 and 25–34 years. Finally, in <strong>or</strong>der <strong>to</strong> compare the self-rep<strong>or</strong>ted<br />
frequency between different mobile phone usage behavi<strong>or</strong>s, pairwise comparisons (independent of age groups and<br />
gender) were <strong>use</strong>d. Considering the usage behavi<strong>or</strong> in future <strong>driving</strong>, t-test showed the <strong>or</strong>dering of frequency was refusing<br />
(M = 4.06) > answering (M = 3.56) > dialing (M = 3.20) > sh<strong>or</strong>t message checking (M = 2.67) > sh<strong>or</strong>t message sending<br />
(M = 1.90), t (163) P 2.97. As f<strong>or</strong> pri<strong>or</strong> daily usage behavi<strong>or</strong>, the <strong>or</strong>dering of answering (6.43) > sh<strong>or</strong>t message services usage<br />
(5.00) > dialing (4.71) was supp<strong>or</strong>ted, t (163) P 2.19. In <strong>to</strong>tal, the mean frequencies of every usage behavi<strong>or</strong> in a future condition<br />
(M = 2.83, with the exception of refusing incoming calls) was lower than in pri<strong>or</strong> daily condition (M = 5.40), t<br />
7<br />
6.5<br />
6<br />
5.5<br />
5<br />
4.5<br />
4<br />
3.5<br />
3<br />
2.5<br />
2<br />
1.5<br />
1<br />
Pri<strong>or</strong> behavi<strong>or</strong> of mobile<br />
phone usage in daily life<br />
Dialing<br />
Answering<br />
Sh<strong>or</strong>t Message<br />
Using<br />
Age Groups (years)<br />
Fig. 2. Frequency of different behavi<strong>or</strong>s plotted by age group and gender f<strong>or</strong> future usage when <strong>driving</strong> and daily usage.<br />
Table 5<br />
Summary of analyses of variance f<strong>or</strong> the mobile usages in future <strong>driving</strong> and pri<strong>or</strong> daily life.<br />
Source Usage in future <strong>driving</strong> Pri<strong>or</strong> daily usage<br />
Age group F = 7.22 **<br />
Gender F = 7.03 **<br />
Age<br />
group gender<br />
* p < 0.05.<br />
** p < 0.01.<br />
Dialing Answering Refusing Sh<strong>or</strong>t message<br />
checking<br />
F = 4.39 *<br />
F = 4.28 *<br />
F = 4.05 *<br />
F = 5.70 *<br />
F = 4.94 *<br />
Sh<strong>or</strong>t message<br />
sending<br />
F = 9.07 **<br />
Dialing Answering Sh<strong>or</strong>t message<br />
using<br />
F = 5.96 *<br />
F = 7.27 *<br />
F = 6.89 *
(163) = 20.40. All these results indicated that participants would be cognizant of the risk of using a mobile phone when <strong>driving</strong>,<br />
and c<strong>or</strong>responding frequency of different usage behavi<strong>or</strong> was rep<strong>or</strong>ted with visual, physical <strong>or</strong> cognitive distraction.<br />
3.3. Perceived risk<br />
In this study, participants’ perceived risk was distinguished as general risk perception of mobile phone <strong>use</strong> and risk perception<br />
of <strong>hands</strong>-<strong>free</strong> mobile phone <strong>use</strong> when <strong>driving</strong>. Mean calculations of responding perceived risks were plotted by gender<br />
and age groups in Fig. 3. As can obviously be seen from the figure, (1) f<strong>or</strong> risk perception of <strong>hands</strong>-<strong>free</strong> usage, females<br />
from ages 17–24 years perceived m<strong>or</strong>e risk than males from ages 17–24 years, (2) <strong>to</strong>tally, participants perceived m<strong>or</strong>e risk<br />
f<strong>or</strong> general perception than f<strong>or</strong> <strong>hands</strong>-<strong>free</strong> mobile phone <strong>use</strong>. All of these conclusions were supp<strong>or</strong>ted by statistical analyses.<br />
Perceived risks were subjected <strong>to</strong> a multivariate analysis of variance: gender (subject-between variable, male vs. female) -<br />
age (subject-between variable, ages 17–24 years vs. ages 25–34 years). No main effect and interaction effect was found. Considering<br />
comparisons between the two perceived risks, T-test showed the risk of general perception (M = 6.24) was higher<br />
significantly than the perceived risk of <strong>hands</strong>-<strong>free</strong> mobile phone usage (M = 5.42), t (163) = 4.60, p < 0.001.<br />
4. Discussion<br />
In this study, self-rep<strong>or</strong>ted <strong>handheld</strong> and <strong>hands</strong>-<strong>free</strong> mobile phone <strong>use</strong> while <strong>driving</strong> was addressed mainly with the TPB.<br />
The results indicated that the basic TPB model fit the data well. In this section, the validity of the TPB, how mobile mode<br />
combined with demographic variables affect <strong>intention</strong> <strong>to</strong> <strong>use</strong> a mobile phone while <strong>driving</strong>, as well as implications f<strong>or</strong> road<br />
safety interventions are discussed. Also we address the limitations of the present study.<br />
4.1. Supp<strong>or</strong>t f<strong>or</strong> the TPB<br />
F<strong>or</strong> the first aim, findings indicated strong supp<strong>or</strong>t f<strong>or</strong> the applications of the TPB <strong>to</strong> people’s <strong>intention</strong> <strong>to</strong> <strong>use</strong> a mobile<br />
phone while <strong>driving</strong>. We <strong>use</strong>d psychometric analyses <strong>to</strong> test the validity of basic subscales. The results showed strong evidence<br />
<strong>to</strong> supp<strong>or</strong>t the applications of TPB. In acc<strong>or</strong>d with previous studies in the <strong>driving</strong> safety field, the basic TPB components<br />
including attitude, subjective n<strong>or</strong>m, and perceived behavi<strong>or</strong>al control were significantly positive related <strong>to</strong> <strong>intention</strong> <strong>to</strong> <strong>use</strong> a<br />
mobile phone in the <strong>driving</strong> context (e.g., Elliott et al., 2003). Overall, the results indicated the effectiveness of attitude, subjective<br />
n<strong>or</strong>m, and perceived behavi<strong>or</strong>al control as significant predic<strong>to</strong>rs of behavi<strong>or</strong>al <strong>intention</strong> in relation <strong>to</strong> using either a<br />
<strong>handheld</strong> <strong>or</strong> <strong>hands</strong>-<strong>free</strong> mobile phone. These fac<strong>to</strong>rs made a significantly positive contribution <strong>to</strong> the prediction of behavi<strong>or</strong>al<br />
<strong>intention</strong> f<strong>or</strong> <strong>handheld</strong> mode and <strong>hands</strong>-<strong>free</strong> mode, respectively. In all modes, the standardized beta weights in the<br />
regression analyses were positive, which demonstrated that behavi<strong>or</strong>al <strong>intention</strong>s would be strengthened when attitude,<br />
subjective n<strong>or</strong>m, and perceived behavi<strong>or</strong>al control increased. The regression modes in both mobile phone situations also<br />
showed the three basic TPB variables were generally far m<strong>or</strong>e imp<strong>or</strong>tant than those demographic variables. In all regression<br />
Self-rep<strong>or</strong>tted sc<strong>or</strong>es<br />
R. Zhou et al. / Transp<strong>or</strong>tation Research Part F 12 (2009) 208–217 215<br />
7<br />
6.5<br />
6<br />
5.5<br />
5<br />
4.5<br />
4<br />
3.5<br />
3<br />
2.5<br />
2<br />
1.5<br />
1<br />
Perceived<br />
General Risk<br />
Perceived Risk of<br />
Hands-<strong>free</strong> Use<br />
17-24 25-34 17-24 25-34<br />
Age Groups (years)<br />
Male Female<br />
Fig. 3. Perceived risk of mobile phone <strong>use</strong> when <strong>driving</strong> plotted by gender and age groups.
216 R. Zhou et al. / Transp<strong>or</strong>tation Research Part F 12 (2009) 208–217<br />
models (e.g., the two mobile phone mode regressions and the four age-gender groups regressions), perceived behavi<strong>or</strong>al control<br />
was the most imp<strong>or</strong>tant predic<strong>to</strong>r of <strong>intention</strong>s, contributing almost as much <strong>to</strong> the prediction as attitude and subjective<br />
n<strong>or</strong>m did.<br />
4.2. Explaining <strong>intention</strong>s <strong>to</strong> <strong>use</strong> mobile phone while <strong>driving</strong><br />
The second aim in this study was <strong>to</strong> examine in what extent the <strong>intention</strong> would predict those different mobile phone<br />
modes in different demographic groups. The ANOVA statistical analysis indicated that there was a very strong significant<br />
difference between mobile modes. The results indicated that m<strong>or</strong>e participants would like <strong>to</strong> <strong>use</strong> a <strong>hands</strong>-<strong>free</strong> mobile phone<br />
while <strong>driving</strong>, since participants perceived m<strong>or</strong>e safety if they <strong>use</strong> <strong>hands</strong>-<strong>free</strong> mobile phone in <strong>driving</strong> context, which was<br />
consistent with the previous studies (e.g., White, Eiser, & Harris, 2004). F<strong>or</strong> the different demographic groups, male respondents<br />
rep<strong>or</strong>ted stronger <strong>intention</strong> <strong>to</strong> <strong>use</strong> a mobile phone in the <strong>driving</strong> condition than female respondents. In the regression<br />
analysis, the gender was a m<strong>or</strong>e significant predic<strong>to</strong>r f<strong>or</strong> the <strong>intention</strong>s <strong>to</strong> <strong>use</strong> a mobile phone in <strong>handheld</strong> situation than in<br />
<strong>hands</strong>-<strong>free</strong> situation. Different f<strong>or</strong>m the previous studies (e.g., Brusque & Alauzet, 2008), age was not represented as an<br />
imp<strong>or</strong>tant variables in the ANOVA statistics and regression analysis beca<strong>use</strong> we foc<strong>use</strong>d on young respondents in this study.<br />
Summarizing, the evidence of mobile mode and gender affecting mobile phone <strong>use</strong> was obvious.<br />
Human behavi<strong>or</strong>s are related with risk perceptions. Based on these perceptions, drivers adjust their behavi<strong>or</strong>s (such as<br />
mobile phone <strong>use</strong> while <strong>driving</strong>) and their responses <strong>to</strong> the <strong>driving</strong> task (primary task) and/<strong>or</strong> a secondary task (e.g., phone<br />
task). If the secondary task is perceived as risky, a driver may slow down. Using a mobile phone in a car followed a decision<br />
motivated by its benefits that may be exaggerated while its risks that may be underestimated (Svenson, 1996). In this study,<br />
compared with mobile phone usage in daily life, participants rep<strong>or</strong>ted less usage in the future <strong>driving</strong> context. This may indicate<br />
that they perceived using a mobile phone as a risky behavi<strong>or</strong> while <strong>driving</strong>. Also, we asked drivers <strong>to</strong> rep<strong>or</strong>t mobile<br />
phone usage frequency of different activities in future <strong>driving</strong> context and in daily life context, respectively. As a whole,<br />
the activities that ca<strong>use</strong> m<strong>or</strong>e physical distraction were less rep<strong>or</strong>ted, which was in line with previous study that addressed<br />
the drivers’ subjective perceived risk f<strong>or</strong> similar activities while <strong>driving</strong> (see Svenson & Patten, 2005), while the usage frequency<br />
may be dependent on the functions of the activities. Though, participants rep<strong>or</strong>ted less mobile <strong>use</strong> in future <strong>driving</strong><br />
beca<strong>use</strong> of their general risk perception while <strong>driving</strong>, they considered the <strong>use</strong> of <strong>hands</strong>-<strong>free</strong> mobile phones safer than <strong>handheld</strong><br />
mobile phones when <strong>driving</strong>. This result could be <strong>use</strong>d <strong>to</strong> supp<strong>or</strong>t the reason why drivers rep<strong>or</strong>ted stronger <strong>intention</strong> <strong>to</strong><br />
<strong>use</strong> a mobile phone in a <strong>hands</strong>-<strong>free</strong> mode than a <strong>handheld</strong> mode. In the present study, no difference of risk perceptions was<br />
found between age groups and genders. As f<strong>or</strong> different activities of mobile phone usage in future <strong>driving</strong>, male respondents<br />
rep<strong>or</strong>ted m<strong>or</strong>e <strong>use</strong> of dialing and answering than female respondents, while males rep<strong>or</strong>ted fewer refusals of incoming calls<br />
than females. These results supp<strong>or</strong>ted why male respondents would be m<strong>or</strong>e likely <strong>to</strong> intend <strong>to</strong> <strong>use</strong> a mobile phone when<br />
<strong>driving</strong> than females. Since sh<strong>or</strong>t message <strong>use</strong> behavi<strong>or</strong> was rep<strong>or</strong>ted the least <strong>or</strong> was perceived the most risk, no difference<br />
was found between males and females. Overall, the effect of age on these different <strong>use</strong>s was not significant.<br />
4.3. Implications <strong>to</strong> develop road safety interventions and educations<br />
Many previous studies (e.g., Elliott et al., 2003) indicated that the TPB can be <strong>use</strong>d <strong>to</strong> develop interventions, rather than<br />
only test their effectiveness. The findings of the present study provided strong supp<strong>or</strong>t <strong>to</strong> the TPB’s application <strong>to</strong> participants’<br />
<strong>intention</strong>s <strong>to</strong> <strong>use</strong> a mobile phone when <strong>driving</strong>, and it seems feasible that the <strong>intention</strong>s <strong>to</strong> <strong>use</strong> a mobile phone might<br />
be changed with the c<strong>or</strong>responding changes in their attitudes, subjective n<strong>or</strong>ms, and perceived behavi<strong>or</strong>al control. Especially<br />
given that the component of perceived behavi<strong>or</strong>al control was most sensitive <strong>to</strong> predict behavi<strong>or</strong>al <strong>intention</strong> as indicated by<br />
the size of the standardized beta weights in all regression models here, <strong>driving</strong> safety interventions may be most effective if<br />
this component were foc<strong>use</strong>d on the most. With promoting perceived control increase and behavi<strong>or</strong>al <strong>intention</strong> change, it<br />
will be successful <strong>to</strong> perf<strong>or</strong>m an individual’s social behavi<strong>or</strong> intervention. Also the roles of the TPB components vary in different<br />
mobile phone situations and different demographic groups. Although, the perception of the risk was not subjected <strong>to</strong><br />
the TBP models, results indicated that it impacted behavi<strong>or</strong>al <strong>intention</strong> significantly. Theref<strong>or</strong>e, based on the findings of this<br />
study, intervention and education <strong>to</strong> change the three TPB aspects in <strong>or</strong>der <strong>to</strong> change <strong>intention</strong> <strong>to</strong> <strong>use</strong> a mobile phone while<br />
<strong>driving</strong> should be: (1) letting drivers know that <strong>hands</strong>-<strong>free</strong> mobile phone <strong>use</strong> may lead <strong>to</strong> cognitive distractions as <strong>handheld</strong><br />
mobile phone <strong>use</strong> do. It will increase their perception risk, and the TPB components will change, then the intervention of less<br />
<strong>intention</strong> <strong>to</strong> <strong>use</strong> a <strong>hands</strong>-<strong>free</strong> mobile phone will succeed; (2) focusing on specific fac<strong>to</strong>rs f<strong>or</strong> different genders (e.g., affective<br />
attitudes f<strong>or</strong> male participants).<br />
4.4. Limitations of the present study<br />
The main possible limitations of the present study are that the participants were <strong>driving</strong> learners, so no long-term-experience<br />
behavi<strong>or</strong> could be covered. However, the main aim of the study was <strong>to</strong> test the sufficiency of the TPB model with variables<br />
of mobile phone modes and demographic measures, whereas the findings of the present study are held with<br />
confidence. A future study could focus on using the TPB model <strong>to</strong> compare non-drivers and drivers. The second possible limitation<br />
here is that the perceived risks were not subject <strong>to</strong> the TPB model. Measuring risk perception separately indicated<br />
that the participants’ general understanding of mobile phone <strong>use</strong> as a risk while <strong>driving</strong>, but the study cannot answer the
question whether the risk perception is an imp<strong>or</strong>tant predic<strong>to</strong>r f<strong>or</strong> behavi<strong>or</strong>al <strong>intention</strong>. Measuring the perceived risk in the<br />
<strong>hands</strong>-<strong>free</strong> and <strong>handheld</strong> situation separately is a potentially <strong>use</strong>ful way f<strong>or</strong> addressing this issue.<br />
Acknowledgements<br />
This study was supp<strong>or</strong>ted by China Postdoc<strong>to</strong>ral Science Foundation, and was also granted financial supp<strong>or</strong>t from the National<br />
Natural Science Foundation of China (NSFC, 70771057).<br />
References<br />
R. Zhou et al. / Transp<strong>or</strong>tation Research Part F 12 (2009) 208–217 217<br />
Ajzen, I. (1991). The the<strong>or</strong>y of planned behavi<strong>or</strong>. Organizational Behavi<strong>or</strong> and Human Decision Processes, 50, 179–211.<br />
Brusque, C., & Alauzet, A. (2008). Analysis of the individual fac<strong>to</strong>rs affecting mobile phone <strong>use</strong> while <strong>driving</strong> in France: Socio-demographic characteristics,<br />
car and phone <strong>use</strong> in professional and private contexts. Accident Analysis and Prevention, 40, 35–44.<br />
Elliott, M. A., Armitage, C. J., & Baughan, C. J. (2003). Drivers’ compliance with speed limits: An application of the the<strong>or</strong>y of planned behavi<strong>or</strong>. Journal of<br />
Applied Psychology, 88(5), 964–972.<br />
Gugerty, L. J., Rakauskas, M., & Brooks, J. (2004). Effects of remote and in-person verbal interactions on verbalization rates and attention <strong>to</strong> dynamic spatial<br />
scenes. Accident Analysis and Prevention, 36, 1029–1043.<br />
Haigney, D. E., Tayl<strong>or</strong>, R. G., & Westerman, S. J. (2000). Concurrent mobile (cellular) phone <strong>use</strong> and <strong>driving</strong> perf<strong>or</strong>mance: Task demand characteristics and<br />
compensa<strong>to</strong>ry processes. Transp<strong>or</strong>tation Research Part F, 113–121.<br />
Holland, C., & Hill, R. (2007). The effects of age, gender and driver status on pedestrians’ <strong>intention</strong>s <strong>to</strong> cross the road in risky situations. Accident Analysis and<br />
Prevention, 39, 224–237.<br />
Laberge-Nadeau, C., Maag, U., Bellavance, F., Lapierre, S., Desjardins, D., Messier, S., et al. (2003). Wireless telephones and the risk of road crashes. Accident<br />
Analysis and Prevention, 35, 649–660.<br />
Lamble, D., Rajalin, S., & Summala, H. (2002). Mobile phone <strong>use</strong> while <strong>driving</strong>: Public opinions on restrictions. Transp<strong>or</strong>tation, 29, 223–235.<br />
McEvoy, P. S., Stevenson, M. R., & Woodward, M. (2006). Phone <strong>use</strong> and crashes while <strong>driving</strong>: A representative survey of drivers in two Australian states.<br />
The Medical Journal of Australia, 185, 630–634.<br />
Nasar, J., Hecht, P., & Wener, R. (2008). Mobile telephones, distracted attention, and pedestrian safety. Accident Analysis and Prevention, 40, 69–75.<br />
Parker, D., Manstead, A. S. R., Stradling, S. G., Reason, J. T., & Baxter, J. S. (1992). Intention <strong>to</strong> commit <strong>driving</strong> violations: An application of the the<strong>or</strong>y of<br />
planned behavi<strong>or</strong>. Journal of Applied Psychology, 77(1), 94–101.<br />
Poysti, P., Rajalin, S., & Summala, H. (2005). Fac<strong>to</strong>rs influencing the <strong>use</strong> of cellular (mobile) phone during. Driving and hazards while using it. Accident<br />
Analysis and Prevention, 37, 47–51.<br />
Rakauskas, M. E., Gugerty, L. J., & Ward, N. J. (2004). Effects of naturalistic cell phone conversations on <strong>driving</strong> perf<strong>or</strong>mance. Journal of Safety Research, 35,<br />
453–464.<br />
RoSPA. (2005). The risk of using a mobile phone while <strong>driving</strong>, .<br />
Strayer, D. L., Drews, F. A., & Johns<strong>to</strong>n, W. A. (2003). Cell phone-induced failures of visual attention during simulated <strong>driving</strong>. Journal of Experimental<br />
Psychology: Applied, 9(1), 23–32.<br />
Strayer, D. L., & Johnson, W. A. (2001). Driven <strong>to</strong> distraction: Dual-task studies of simulated <strong>driving</strong> and conversing on cellular telephone. Psychological<br />
Science, 12, 462–466.<br />
Svenson, O. (1996). Decision making and the search f<strong>or</strong> psychological regularities: What can be learned from a process perspective? Organizational Behavi<strong>or</strong><br />
and Human Decision Processes, 65, 252–267.<br />
Svenson, O., & Patten, C. J. D. (2005). Mobile phones and <strong>driving</strong>: A review of contemp<strong>or</strong>ary research. Cognition Technology and W<strong>or</strong>k, 7, 182–197.<br />
T<strong>or</strong>nros, J. E. B., & Bolling, A. K. (2005). Mobile phone <strong>use</strong>-effects of <strong>handheld</strong> and <strong>hands</strong>-<strong>free</strong> phones on <strong>driving</strong> perf<strong>or</strong>mance. Accident Analysis and<br />
Prevention, 37, 902–909.<br />
Treffner, P. J., & Barrett, R. (2004). Hands-<strong>free</strong> mobile phone speech while <strong>driving</strong> degrades co<strong>or</strong>dination and control. Transp<strong>or</strong>tation Research Part F, 7,<br />
229–246.<br />
Violanti, J. M. (1999). Cellular phones and fatal traffic collisions. Accident Analysis and Prevention, 30, 519–524.<br />
Violanti, J. M., & Marshall, J. R. (1996). Cellular phones and traffic accidents: An epidemiological approach. Accident Analysis and Prevention, 28, 265–270.<br />
White, M. P., Eiser, J. R., & Harris, P. R. (2004). Risk perceptions of mobile phone <strong>use</strong> while <strong>driving</strong>. Risk Analysis, 24, 323–334.