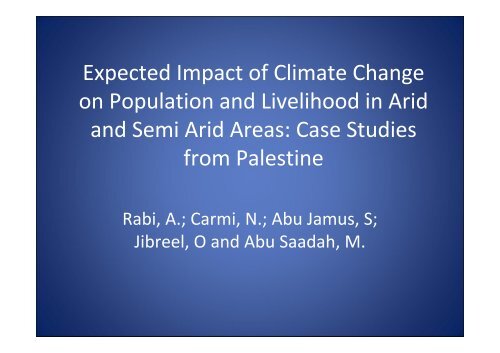
Expected Impact of Climate Change on ... - Feem-project.net
Expected Impact of Climate Change on ... - Feem-project.net
Expected Impact of Climate Change on ... - Feem-project.net

Create successful ePaper yourself
Turn your PDF publications into a flip-book with our unique Google optimized e-Paper software.
<str<strong>on</strong>g>Expected</str<strong>on</strong>g> <str<strong>on</strong>g>Impact</str<strong>on</strong>g> <str<strong>on</strong>g>of</str<strong>on</strong>g> <str<strong>on</strong>g>Climate</str<strong>on</strong>g> <str<strong>on</strong>g>Change</str<strong>on</strong>g><br />
<strong>on</strong> Populati<strong>on</strong> and Livelihood in Arid<br />
and Semi Arid Areas: Case Studies<br />
from Palestine<br />
Rabi, A.; Carmi, N.; Abu Jamus, S;<br />
Jibreel, O and Abu Saadah, M.
Water Problem in Palestine<br />
• Palestine is a semi-arid area with very limited water<br />
resources.<br />
• Additi<strong>on</strong>al stress <strong>on</strong> water resources:<br />
– Growth rate is <strong>on</strong>e <str<strong>on</strong>g>of</str<strong>on</strong>g> the highest worldwide; 3.06% in West<br />
Bank and 3.7% in Gaza while world average is 1.14%.<br />
– Political c<strong>on</strong>flict; destructi<strong>on</strong> or polluti<strong>on</strong> <str<strong>on</strong>g>of</str<strong>on</strong>g> water resources in<br />
additi<strong>on</strong> to limited accessibility.<br />
– Potential impact <str<strong>on</strong>g>of</str<strong>on</strong>g> climate change; which , to date, is not<br />
addressed in water resources management and planning.
Global Temperature Trend Analysis<br />
Source: IPCC, 2007
mm<br />
C o<br />
1100<br />
1000<br />
900<br />
800<br />
700<br />
600<br />
500<br />
400<br />
300<br />
Yearly Rainfall for St#1<br />
200<br />
1940 1950 1960 1970 1980 1990 2000<br />
30<br />
29<br />
28<br />
27<br />
26<br />
25<br />
24<br />
23<br />
22<br />
21<br />
Year<br />
Average (mm/yr) No. <str<strong>on</strong>g>of</str<strong>on</strong>g> Rainy Days<br />
Average Yearly Temperature<br />
20<br />
1960 1965 1970 1975 1980 1985<br />
Year<br />
1990 1995 2000 2005 2010<br />
80<br />
70<br />
60<br />
50<br />
40<br />
30<br />
20<br />
day<br />
St#1<br />
Period: 65 years<br />
Mean annual average rainfall= 526<br />
mm/yr<br />
Mean annual average rainy days= 60<br />
days<br />
<str<strong>on</strong>g>Change</str<strong>on</strong>g> in rainfall trend= -22.4 22.4 mm<br />
(decrease)<br />
<str<strong>on</strong>g>Change</str<strong>on</strong>g> in rainy days trend= -10 10 days<br />
(decrease)<br />
Period: 41 years<br />
Mean annual average temperature=<br />
24.3 C o<br />
<str<strong>on</strong>g>Change</str<strong>on</strong>g> in temperature trend= 2.3<br />
Co (increase)
mm<br />
C o<br />
1100<br />
900<br />
700<br />
500<br />
300<br />
Yearly Rainfall for St#3<br />
100<br />
1939 1949 1959 1969 1979 1989 1999<br />
25<br />
24<br />
23<br />
22<br />
21<br />
20<br />
19<br />
18<br />
17<br />
16<br />
Year<br />
Average (mm/yr) No. <str<strong>on</strong>g>of</str<strong>on</strong>g> Rainy Days Linear (No. <str<strong>on</strong>g>of</str<strong>on</strong>g> Rainy Days)<br />
Average Yearly Temperature<br />
15<br />
1960 1965 1970 1975 1980 1985 1990 1995 2000 2005<br />
Year<br />
y = 0.021x - 20.259<br />
St#3<br />
90<br />
80<br />
70<br />
60<br />
50<br />
40<br />
30<br />
20<br />
day<br />
Period: 97 years<br />
Mean annual average<br />
rainfall= 522.7 mm/yr<br />
Mean annual average rainy<br />
days= 54 days<br />
<str<strong>on</strong>g>Change</str<strong>on</strong>g> in rainfall trend=<br />
106 mm (increase)<br />
<str<strong>on</strong>g>Change</str<strong>on</strong>g> in rainy days trend=<br />
30 days (increase)<br />
Period: 34 years<br />
Mean annual average<br />
temperature= 21.4 C o<br />
<str<strong>on</strong>g>Change</str<strong>on</strong>g> in temperature<br />
trend= 0.7 C o (increase)
mm<br />
C o<br />
500<br />
450<br />
400<br />
350<br />
300<br />
250<br />
200<br />
150<br />
100<br />
50<br />
Yearly Rainfall for St#4<br />
0<br />
1920 1930 1940 1950 1960 1970 1980 1990 2000<br />
28<br />
27<br />
26<br />
25<br />
24<br />
23<br />
22<br />
21<br />
Year<br />
Average (mm/yr) No. <str<strong>on</strong>g>of</str<strong>on</strong>g> Rainy Days Linear (No. <str<strong>on</strong>g>of</str<strong>on</strong>g> Rainy Days)<br />
Average Yearly Temperature<br />
St#4 & St#5<br />
20<br />
1965 1970 1975 1980 1985 1990 1995 2000<br />
Year<br />
60<br />
50<br />
40<br />
30<br />
20<br />
10<br />
day<br />
Period: 75 years<br />
Mean annual average<br />
rainfall= 198.5 mm/yr<br />
Mean annual average<br />
rainy days= 35 days<br />
<str<strong>on</strong>g>Change</str<strong>on</strong>g> in rainfall trend=<br />
28 mm (increase)<br />
<str<strong>on</strong>g>Change</str<strong>on</strong>g> in rainy days<br />
trend= 22 days (increase)<br />
Period: 30 years<br />
Mean annual average<br />
temperature= 25.6 C o<br />
<str<strong>on</strong>g>Change</str<strong>on</strong>g> in temperature<br />
trend= 0.2 C o (increase)
Temperature &<br />
Precipitati<strong>on</strong> Trend<br />
Analysis for the late<br />
20 th century<br />
Where;<br />
Refers to Temperature change in °C<br />
Refers to Precipitati<strong>on</strong> change in mm<br />
Source: Abu Sa’da, 2007<br />
-22.4<br />
2.3<br />
28<br />
0.2<br />
-15<br />
106<br />
0.3<br />
0.7<br />
-38.6<br />
0.1
Water Supply & Demand in West Bank<br />
Year Supply<br />
(MCM/year)<br />
Demand (MCM/year) Deficit<br />
(MCM/year)<br />
Municipal Industrial Agricultural<br />
2005 159 135 11 168 155<br />
2010 159 156 25 190 212<br />
2015 159 181 30 208 260<br />
• Agriculture is the biggest c<strong>on</strong>sumer <str<strong>on</strong>g>of</str<strong>on</strong>g> water.<br />
• Supply is assumed to be c<strong>on</strong>stant over the years.<br />
•Water demand is estimated based <strong>on</strong> populati<strong>on</strong> growth as the fundamental<br />
factor.<br />
Source: PWA, 2007
IPCC 4 th Assessment Report<br />
For the Mediterranean:<br />
• Warming is likely to be in summer.<br />
• Annual precipitati<strong>on</strong> is very likely to decrease.<br />
• The annual number <str<strong>on</strong>g>of</str<strong>on</strong>g> precipitati<strong>on</strong> days is very likely to<br />
decrease.<br />
Terminology Likelihood <str<strong>on</strong>g>of</str<strong>on</strong>g> the occurrence<br />
Likely > 66% probability<br />
Very likely >90% probability
• The frequency and durati<strong>on</strong><br />
<str<strong>on</strong>g>of</str<strong>on</strong>g> drought in the regi<strong>on</strong> is<br />
not fixed over time.<br />
• The time between two<br />
occurrences <str<strong>on</strong>g>of</str<strong>on</strong>g> drought can<br />
be described as random<br />
variable.<br />
• Drought has n<strong>on</strong>-uniform<br />
return periods.<br />
Drought Phenomena<br />
•<br />
Frequency <str<strong>on</strong>g>of</str<strong>on</strong>g> Occurrence (%)<br />
Frequency <str<strong>on</strong>g>of</str<strong>on</strong>g> Occurrence <str<strong>on</strong>g>of</str<strong>on</strong>g> Rain Deficit Years at Jerusalem Central Stati<strong>on</strong><br />
35%<br />
30%<br />
25%<br />
20%<br />
15%<br />
10%<br />
5%<br />
0%<br />
50<br />
Relative Rainfall Deficit (%)
• Both areas are characterized by<br />
an arid and semi arid nature.<br />
• The area <str<strong>on</strong>g>of</str<strong>on</strong>g> case study 1 is mainly<br />
cultivated with irrigated<br />
agriculture (citrus, dates and<br />
vegetables) and is a plain area<br />
that lies as low as 200 m below<br />
sea level<br />
• The area <str<strong>on</strong>g>of</str<strong>on</strong>g> case study 2 is hilly<br />
with steep slopes with elevati<strong>on</strong>s<br />
up to 800 m ASL. Most <str<strong>on</strong>g>of</str<strong>on</strong>g> the<br />
area in case study 2 is not<br />
cultivated and c<strong>on</strong>sidered as<br />
range land used mainly for<br />
grazing while some parts are<br />
classified as nature reserves.<br />
Case Study Areas<br />
Case<br />
Study 2<br />
Case<br />
Study<br />
1
Main Objective:<br />
To evaluate the potential impact <str<strong>on</strong>g>of</str<strong>on</strong>g><br />
climate change <strong>on</strong> agricultural<br />
water demand.<br />
Specific objectives:<br />
Identify the observed trends and<br />
future predicti<strong>on</strong>s (Temperature<br />
and precipitati<strong>on</strong>).<br />
Determine reference<br />
evapotranspirati<strong>on</strong> (ETo ), crop<br />
water requirement (CWR) and<br />
irrigati<strong>on</strong> water requirement<br />
(IWR) under different suggested<br />
climate change scenarios<br />
Case Study 1: Details<br />
Selecti<strong>on</strong> <str<strong>on</strong>g>of</str<strong>on</strong>g> study area:<br />
Jericho district<br />
Selecti<strong>on</strong> <str<strong>on</strong>g>of</str<strong>on</strong>g> computer model<br />
to be used:<br />
CROPWAT computer model;<br />
decisi<strong>on</strong> support system<br />
developed by the Land and<br />
Water Development<br />
Divisi<strong>on</strong> <str<strong>on</strong>g>of</str<strong>on</strong>g> FAO
Jericho District Socio-ec<strong>on</strong>omic pr<str<strong>on</strong>g>of</str<strong>on</strong>g>ile<br />
• 17% <str<strong>on</strong>g>of</str<strong>on</strong>g> HH income is used to purchase water<br />
• 71% <str<strong>on</strong>g>of</str<strong>on</strong>g> populati<strong>on</strong> is less than 30 years<br />
• 15% <str<strong>on</strong>g>of</str<strong>on</strong>g> populati<strong>on</strong> immigrate seas<strong>on</strong>ally<br />
• Unemployment lowest in WB at 9.1% (PCBS,<br />
2008)
Formulati<strong>on</strong> <str<strong>on</strong>g>of</str<strong>on</strong>g> Scenarios<br />
T T+1 T+2 T+3<br />
Reference evapotranspiratio (ET o ) ….. ….. ….. …..<br />
Crop water requirement (CWR) ….. ….. ….. …..<br />
Irrigati<strong>on</strong> water requirement (IWR) ….. ….. ….. …..<br />
Reference evapotranspiratio<br />
(ET o )<br />
P-20% P-10% P P+10% P+20%<br />
….. ….. ….. ….. …..<br />
Crop water requirement (CWR) ….. ….. ….. ….. …..<br />
Irrigati<strong>on</strong> water requirement<br />
(IWR)<br />
….. ….. ….. ….. …..<br />
T T+1 T+2 T+3<br />
P-20% ….. ….. ….. …..<br />
P-10% ….. ….. ….. …..<br />
P ….. ….. ….. …..<br />
P+10% ….. ….. ….. …..<br />
P+20% ….. ….. ….. …..
First: <str<strong>on</strong>g>Impact</str<strong>on</strong>g> <strong>on</strong> Reference Evapotranspirati<strong>on</strong><br />
(ET o)<br />
Average change rate (%) <str<strong>on</strong>g>of</str<strong>on</strong>g> ETo with temperature increase:<br />
Calculated using Penman-M<strong>on</strong>teith equati<strong>on</strong><br />
ET o change<br />
rate<br />
T+1°C T+2°C T+3°C<br />
2.6% 5.3% 8%
Sec<strong>on</strong>d: <str<strong>on</strong>g>Impact</str<strong>on</strong>g> <strong>on</strong> Crop Water Requirement (CWR)<br />
Average change rate (%) <str<strong>on</strong>g>of</str<strong>on</strong>g> CWR with temperature increase;<br />
CWR = Et o *K c<br />
T+1°C T+2°C T+3°C<br />
CWR change rate 2.7% 5.4% 8%
Third: <str<strong>on</strong>g>Impact</str<strong>on</strong>g> <strong>on</strong> Irrigati<strong>on</strong> Water Requirement (IWR)<br />
Annual IWR for the total area under c<strong>on</strong>siderati<strong>on</strong>;<br />
∑ IWR for each crop x corresp<strong>on</strong>ding area<br />
IWR= CWR – effective rain<br />
IWR<br />
(MCM/yea<br />
r)<br />
<str<strong>on</strong>g>Change</str<strong>on</strong>g><br />
rate %<br />
P-20%<br />
21.05<br />
5.53<br />
P-10%<br />
20.24<br />
1.47<br />
P<br />
19.95<br />
0.00<br />
P+10%<br />
19.66<br />
-1.44<br />
P+ 20%<br />
19.38<br />
-2.84.
Fourth: Irrigati<strong>on</strong> Water Demand Under Hypothetical<br />
<str<strong>on</strong>g>Climate</str<strong>on</strong>g> <str<strong>on</strong>g>Change</str<strong>on</strong>g> Scenarios<br />
Deficits:<br />
•Values are expressed in MCM/Year<br />
T T+1 T+2 T+3<br />
P-20% 1.104 1.685 2.285 2.881<br />
P-10% 0.294 0.877 1.469 2.065<br />
P 0.00 0.581 1.172 1.763<br />
P+10% -0.286 0.291 0.880 1.470<br />
P+20% -0.566 0.010 0.596 1.181<br />
As T & Ppt decrease , IWR I deficits ncrease
Policy Recommendati<strong>on</strong>s: case study <strong>on</strong>e<br />
• Further efforts needed to improve the predicti<strong>on</strong>s <str<strong>on</strong>g>of</str<strong>on</strong>g> future<br />
irrigati<strong>on</strong> water requirement for agriculture in Palestine; studies that<br />
c<strong>on</strong>sider the climate change impact <strong>on</strong> rain-fed and greenhouses<br />
agriculture and studies to cover the whole agricultural areas in<br />
Palestine.<br />
• <str<strong>on</strong>g>Climate</str<strong>on</strong>g> change should be addressed in water resources<br />
management and planning, for development <str<strong>on</strong>g>of</str<strong>on</strong>g> future water<br />
resources in Palestine, as <strong>on</strong>e <str<strong>on</strong>g>of</str<strong>on</strong>g> the factors affecting water supply<br />
and demand.<br />
• Adaptati<strong>on</strong> measure should be c<strong>on</strong>sidered to cope with climate<br />
change potential impacts <strong>on</strong> water demand and supply.
Case Study 2:<br />
Socio-ec<strong>on</strong>omic Pr<str<strong>on</strong>g>of</str<strong>on</strong>g>ile<br />
• Daily per capita income is<br />
Objective -Case study 2<br />
• To assess the impact <str<strong>on</strong>g>of</str<strong>on</strong>g> drought <strong>on</strong><br />
livelihood (mainly water availability<br />
for domestic, agriculture and<br />
livestock) <str<strong>on</strong>g>of</str<strong>on</strong>g> marginal and vulnerable<br />
communities and to strengthen the<br />
sustainable coping mechanisms <str<strong>on</strong>g>of</str<strong>on</strong>g> the<br />
people in those areas.
Drought in the Study Area<br />
• The area has<br />
encountered<br />
meteorological drought<br />
• Rainfall was 30 -40%<br />
below average<br />
• This has caused<br />
agricultural drought
<str<strong>on</strong>g>Impact</str<strong>on</strong>g> <str<strong>on</strong>g>of</str<strong>on</strong>g> Agricultural Drought<br />
• The change in Rainfall and its characteristics<br />
indicated above clearly shows the rainfall spatial<br />
and temporal variability, and the change in the<br />
number <str<strong>on</strong>g>of</str<strong>on</strong>g> rainy days and length <str<strong>on</strong>g>of</str<strong>on</strong>g> dry and rainy<br />
seas<strong>on</strong>s. This has affected the livelihood <str<strong>on</strong>g>of</str<strong>on</strong>g> people<br />
and reduced the natural rangeland producti<strong>on</strong>.<br />
• Areas previously cultivated with wheat and barley<br />
used as fodder diminished leading to further<br />
unemployment and increasing the costs <str<strong>on</strong>g>of</str<strong>on</strong>g> raising<br />
livestock
<str<strong>on</strong>g>Impact</str<strong>on</strong>g> <str<strong>on</strong>g>of</str<strong>on</strong>g> the successive drought<br />
• Deteriorati<strong>on</strong> and retrogressi<strong>on</strong> <str<strong>on</strong>g>of</str<strong>on</strong>g><br />
rangeland productivity<br />
2009<br />
2008<br />
Year<br />
2007<br />
2006<br />
2005<br />
2004<br />
2001-2003<br />
1990-2000<br />
7<br />
6<br />
5<br />
4<br />
3<br />
2<br />
1<br />
0<br />
Range land<br />
sufficiency<br />
(m<strong>on</strong>th)
Range Land Deteriorati<strong>on</strong><br />
• The range land deteriorati<strong>on</strong> enhanced<br />
the unpalatable shrubs dominati<strong>on</strong><br />
• Lack <str<strong>on</strong>g>of</str<strong>on</strong>g> field crops seeds<br />
• Extincti<strong>on</strong> <str<strong>on</strong>g>of</str<strong>on</strong>g> some grass species<br />
• Overgrazing<br />
• More purchase <str<strong>on</strong>g>of</str<strong>on</strong>g> animal feed
<str<strong>on</strong>g>Impact</str<strong>on</strong>g> <strong>on</strong> livestock- main source <str<strong>on</strong>g>of</str<strong>on</strong>g><br />
income<br />
• Increased livestock mortality rate with 10% at<br />
least<br />
• Decrease the quantities <str<strong>on</strong>g>of</str<strong>on</strong>g> the produced milk<br />
with 48%<br />
• Delaying the breeding seas<strong>on</strong> for <strong>on</strong>e m<strong>on</strong>th at<br />
least<br />
• Increase the demand <str<strong>on</strong>g>of</str<strong>on</strong>g> the water c<strong>on</strong>sumpti<strong>on</strong><br />
since there's the lack <str<strong>on</strong>g>of</str<strong>on</strong>g> the grasses and relying<br />
in the grains feedings<br />
• Reducti<strong>on</strong> in the flock sizes – livestock sold to<br />
afford buying water tankers
Socio-ec<strong>on</strong>omic impacts<br />
• Outbreak <str<strong>on</strong>g>of</str<strong>on</strong>g> certain diseases- 32% live in c<strong>on</strong>crete<br />
houses <strong>on</strong>ly, rest in tents or metal ro<str<strong>on</strong>g>of</str<strong>on</strong>g> shelters.<br />
• Less water collected and Increased water costs<br />
• Internal Migrati<strong>on</strong> reaches 40% in some<br />
communities<br />
• Social instability<br />
• Reducti<strong>on</strong> in percentage <str<strong>on</strong>g>of</str<strong>on</strong>g> populati<strong>on</strong> relying <strong>on</strong><br />
raising livestock<br />
• <str<strong>on</strong>g>Change</str<strong>on</strong>g> in pr<str<strong>on</strong>g>of</str<strong>on</strong>g>essi<strong>on</strong>-shift from farming<br />
• Less expenditure <strong>on</strong> basics affecting household<br />
nutriti<strong>on</strong>al levels.
Policy Recommendati<strong>on</strong>s<br />
• It is important to re-assess the potential water resources<br />
(ground and surface) and c<strong>on</strong>sider the new change in the<br />
precipitati<strong>on</strong> and temperature.<br />
• Adopt more appropriate plans to eliminate internal<br />
migrati<strong>on</strong> from the vulnerable areas, invest in<br />
infrastructure, health and educati<strong>on</strong> services as well as<br />
WATSAN services.<br />
• Develop an alternative plan for both irrigated agriculture<br />
as well as dry land farming. More drought resisting<br />
varieties, less water requiring crops, etc.<br />
• Develop plans to regenerate the grazing areas and to<br />
maintain the current pattern <str<strong>on</strong>g>of</str<strong>on</strong>g> land use in those areas.<br />
• Develop appropriate means to increase the water<br />
availability and accessibility to the vulnerable areas, mainly<br />
storage <str<strong>on</strong>g>of</str<strong>on</strong>g> surface water.