

THE FIAT GROUP IN - Fiat SpA
THE FIAT GROUP IN - Fiat SpA
THE FIAT GROUP IN - Fiat SpA

You also want an ePaper? Increase the reach of your titles
YUMPU automatically turns print PDFs into web optimized ePapers that Google loves.
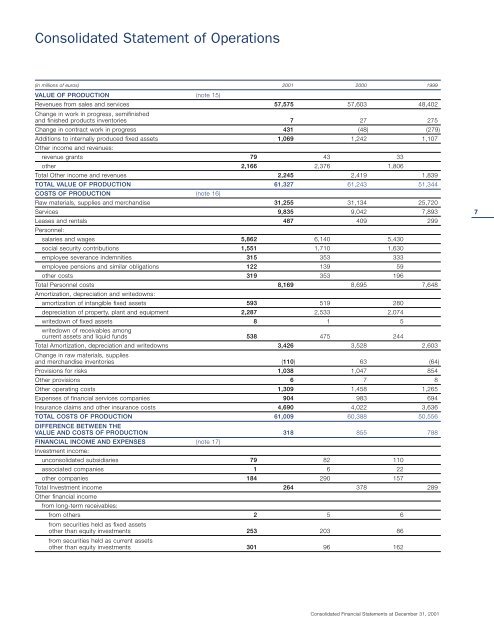
Consolidated Statement of Operations<br />
(in millions of euros) 2001 2000 1999<br />
VALUE OF PRODUCTION (note 15)<br />
Revenues from sales and services<br />
Change in work in progress, semifinished<br />
57,575 57,603 48,402<br />
and finished products inventories 7 27 275<br />
Change in contract work in progress 431 (48) (279)<br />
Additions to internally produced fixed assets 1,069 1,242 1,107<br />
Other income and revenues:<br />
revenue grants 79 43 33<br />
other 2,166 2,376 1,806<br />
Total Other income and revenues 2,245 2,419 1,839<br />
TOTAL VALUE OF PRODUCTION 61,327 61,243 51,344<br />
COSTS OF PRODUCTION (note 16)<br />
Raw materials, supplies and merchandise 31,255 31,134 25,720<br />
Services 9,835 9,042 7,893<br />
Leases and rentals 487 409 299<br />
Personnel:<br />
salaries and wages 5,862 6,140 5,430<br />
social security contributions 1,551 1,710 1,630<br />
employee severance indemnities 315 353 333<br />
employee pensions and similar obligations 122 139 59<br />
other costs 319 353 196<br />
Total Personnel costs 8,169 8,695 7,648<br />
Amortization, depreciation and writedowns:<br />
amortization of intangible fixed assets 593 519 280<br />
depreciation of property, plant and equipment 2,287 2,533 2,074<br />
writedown of fixed assets 8 1 5<br />
writedown of receivables among<br />
current assets and liquid funds 538 475 244<br />
Total Amortization, depreciation and writedowns<br />
Change in raw materials, supplies<br />
3,426 3,528 2,603<br />
and merchandise inventories (110) 63 (64)<br />
Provisions for risks 1,038 1,047 854<br />
Other provisions 6 7 8<br />
Other operating costs 1,309 1,458 1,265<br />
Expenses of financial services companies 904 983 694<br />
Insurance claims and other insurance costs 4,690 4,022 3,636<br />
TOTAL COSTS OF PRODUCTION<br />
DIFFERENCE BETWEEN <strong>THE</strong><br />
61,009 60,388 50,556<br />
VALUE AND COSTS OF PRODUCTION 318 855 788<br />
F<strong>IN</strong>ANCIAL <strong>IN</strong>COME AND EXPENSES (note 17)<br />
Investment income:<br />
unconsolidated subsidiaries 79 82 110<br />
associated companies 1 6 22<br />
other companies 184 290 157<br />
Total Investment income 264 378 289<br />
Other financial income<br />
from long-term receivables:<br />
from others<br />
from securities held as fixed assets<br />
2 5 6<br />
other than equity investments<br />
from securities held as current assets<br />
253 203 86<br />
other than equity investments 301 96 162<br />
Consolidated Financial Statements at December 31, 2001<br />
7<br />
7


