

THE FIAT GROUP IN - Fiat SpA
THE FIAT GROUP IN - Fiat SpA
THE FIAT GROUP IN - Fiat SpA

You also want an ePaper? Increase the reach of your titles
YUMPU automatically turns print PDFs into web optimized ePapers that Google loves.
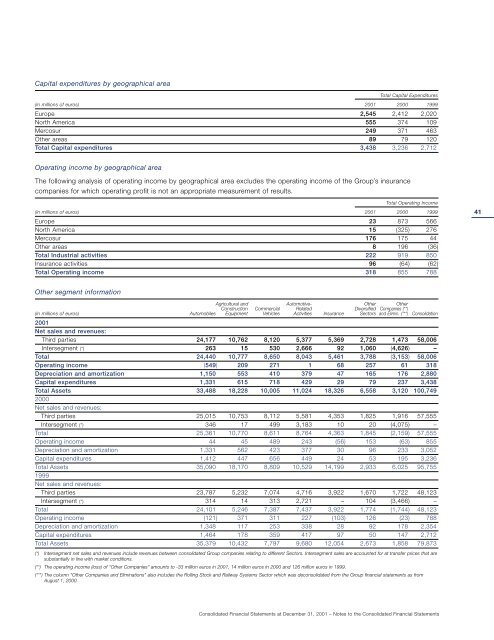
Capital expenditures by geographical area<br />
Total Capital Expenditures<br />
(in millions of euros) 2001 2000 1999<br />
Europe 2,545 2,412 2,020<br />
North America 555 374 109<br />
Mercosur 249 371 463<br />
Other areas 89 79 120<br />
Total Capital expenditures 3,438 3,236 2,712<br />
Operating income by geographical area<br />
The following analysis of operating income by geographical area excludes the operating income of the Group’s insurance<br />
companies for which operating profit is not an appropriate measurement of results.<br />
Total Operating Income<br />
(in millions of euros) 2001 2000 1999<br />
Europe 23 873 566<br />
North America 15 (325) 276<br />
Mercosur 176 175 44<br />
Other areas 8 196 (36)<br />
Total Industrial activities 222 919 850<br />
Insurance activities 96 (64) (62)<br />
Total Operating income 318 855 788<br />
Other segment information<br />
Agricultural and Automotive- Other Other<br />
Construction Commercial Related Diversified Companies (**)<br />
(in millions of euros) Automobiles Equipment Vehicles Activities Insurance Sectors and Elimin. (***) Consolidation<br />
2001<br />
Net sales and revenues:<br />
Third parties 24,177 10,762 8,120 5,377 5,369 2,728 1,473 58,006<br />
Intersegment (*) 263 15 530 2,666 92 1,060 (4,626) –<br />
Total 24,440 10,777 8,650 8,043 5,461 3,788 (3,153) 58,006<br />
Operating income (549) 209 271 1 68 257 61 318<br />
Depreciation and amortization 1,150 553 410 379 47 165 176 2,880<br />
Capital expenditures 1,331 615 718 429 29 79 237 3,438<br />
Total Assets 33,488 18,228 10,005 11,024 18,326 6,558 3,120 100,749<br />
2000<br />
Net sales and revenues:<br />
Third parties 25,015 10,753 8,112 5,581 4,353 1,825 1,916 57,555<br />
Intersegment (*) 346 17 499 3,183 10 20 (4,075) –<br />
Total 25,361 10,770 8,611 8,764 4,363 1,845 (2,159) 57,555<br />
Operating income 44 45 489 243 (56) 153 (63) 855<br />
Depreciation and amortization 1,331 562 423 377 30 96 233 3,052<br />
Capital expenditures 1,412 447 656 449 24 53 195 3,236<br />
Total Assets 35,090 18,170 8,809 10,529 14,199 2,933 6,025 95,755<br />
1999<br />
Net sales and revenues:<br />
Third parties 23,787 5,232 7,074 4,716 3,922 1,670 1,722 48,123<br />
Intersegment (*) 314 14 313 2,721 – 104 (3,466) –<br />
Total 24,101 5,246 7,387 7,437 3,922 1,774 (1,744) 48,123<br />
Operating income (121) 371 311 227 (103) 126 (23) 788<br />
Depreciation and amortization 1,348 117 253 338 28 92 178 2,354<br />
Capital expenditures 1,464 178 359 417 97 50 147 2,712<br />
Total Assets 35,379 10,432 7,797 9,680 12,054 2,673 1,858 79,873<br />
(*) Intersegment net sales and revenues include revenues between consolidated Group companies relating to different Sectors. Intersegment sales are accounted for at transfer prices that are<br />
substantially in line with market conditions.<br />
(**) The operating income (loss) of “Other Companies” amounts to -33 million euros in 2001, 14 million euros in 2000 and 126 million euros in 1999.<br />
(***) The column “Other Companies and Eliminations” also includes the Rolling Stock and Railway Systems Sector which was deconsolidated from the Group financial statements as from<br />
August 1, 2000.<br />
Consolidated Financial Statements at December 31, 2001 – Notes to the Consolidated Financial Statements 41<br />
41


