Meeting: third quarter 2012 results - Fiat SpA
Meeting: third quarter 2012 results - Fiat SpA
Meeting: third quarter 2012 results - Fiat SpA
Create successful ePaper yourself
Turn your PDF publications into a flip-book with our unique Google optimized e-Paper software.
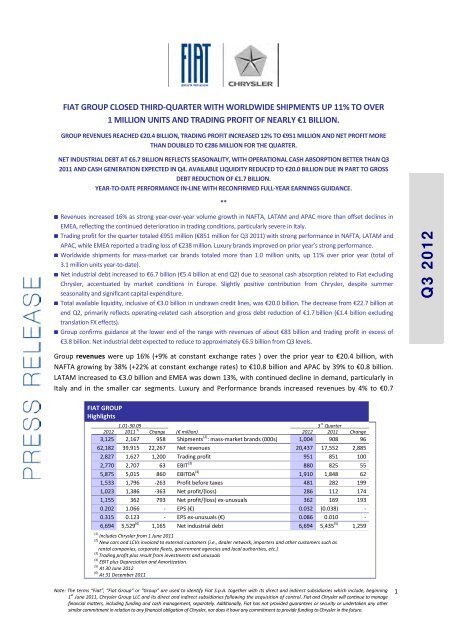
FIAT GROUP CLOSED THIRD-QUARTER WITH WORLDWIDE SHIPMENTS UP 11% TO OVER<br />
1 MILLION UNITS AND TRADING PROFIT OF NEARLY €1 BILLION.<br />
GROUP REVENUES REACHED €20.4 BILLION, TRADING PROFIT INCREASED 12% TO €951 MILLION AND NET PROFIT MORE<br />
THAN DOUBLED TO €286 MILLION FOR THE QUARTER.<br />
NET INDUSTRIAL DEBT AT €6.7 BILLION REFLECTS SEASONALITY, WITH OPERATIONAL CASH ABSORPTION BETTER THAN Q3<br />
2011 AND CASH GENERATION EXPECTED IN Q4. AVAILABLE LIQUIDITY REDUCED TO €20.0 BILLION DUE IN PART TO GROSS<br />
DEBT REDUCTION OF €1.7 BILLION.<br />
YEAR-TO-DATE PERFORMANCE IN-LINE WITH RECONFIRMED FULL-YEAR EARNINGS GUIDANCE.<br />
**<br />
Revenues increased 16% as strong year-over-year volume growth in NAFTA, LATAM and APAC more than offset declines in<br />
EMEA, reflecting the continued deterioration in trading conditions, particularly severe in Italy.<br />
Trading profit for the <strong>quarter</strong> totaled €951 million (€851 million for Q3 2011) with strong performance in NAFTA, LATAM and<br />
APAC, while EMEA reported a trading loss of €238 million. Luxury brands improved on prior year’s strong performance.<br />
Worldwide shipments for mass-market car brands totaled more than 1.0 million units, up 11% over prior year (total of<br />
3.1 million units year-to-date).<br />
Net industrial debt increased to €6.7 billion (€5.4 billion at end Q2) due to seasonal cash absorption related to <strong>Fiat</strong> excluding<br />
Chrysler, accentuated by market conditions in Europe. Slightly positive contribution from Chrysler, despite summer<br />
seasonality and significant capital expenditure.<br />
Total available liquidity, inclusive of €3.0 billion in undrawn credit lines, was €20.0 billion. The decrease from €22.7 billion at<br />
end Q2, primarily reflects operating-related cash absorption and gross debt reduction of €1.7 billion (€1.4 billion excluding<br />
translation FX effects).<br />
Group confirms guidance at the lower end of the range with revenues of about €83 billion and trading profit in excess of<br />
€3.8 billion. Net industrial debt expected to reduce to approximately €6.5 billion from Q3 levels.<br />
Group revenues were up 16% (+9% at constant exchange rates ) over the prior year to €20.4 billion, with<br />
NAFTA growing by 38% (+22% at constant exchange rates) to €10.8 billion and APAC by 39% to €0.8 billion.<br />
LATAM increased to €3.0 billion and EMEA was down 13%, with continued decline in demand, particularly in<br />
Italy and in the smaller car segments. Luxury and Performance brands increased revenues by 4% to €0.7<br />
FIAT GROUP<br />
Highlights<br />
1.01-30.09 3 rd Quarter<br />
<strong>2012</strong> 2011 (1) Change (€ million) <strong>2012</strong> 2011 Change<br />
3,125 2,167 958 Shipments (2) : mass-market brands (000s) 1,004 908 96<br />
62,182 39,915 22,267 Net revenues 20,437 17,552 2,885<br />
2,827 1,627 1,200 Trading profit 951 851 100<br />
2,770 2,707 63 EBIT (3) 880 825 55<br />
5,875 5,015 860 EBITDA (4) 1,910 1,848 62<br />
1,533 1,796 -263 Profit before taxes 481 282 199<br />
1,023 1,386 -363 Net profit/(loss) 286 112 174<br />
1,155 362 793 Net profit/(loss) ex-unusuals 362 169 193<br />
0.202 1.066 - EPS (€) 0.032 (0.038) -<br />
0.315 0.123 - EPS ex-unusuals (€) 0.086 0.010 -<br />
6,694 5,529 (6) 1,165 Net industrial debt 6,694 5,435 (5) 1,259<br />
(1) Includes Chrysler from 1 June 2011<br />
(2) New cars and LCVs invoiced to external customers (i.e., dealer network, importers and other customers such as<br />
rental companies, corporate fleets, government agencies and local authorities, etc.)<br />
(3) Trading profit plus result from investments and unusuals<br />
(4)<br />
EBIT plus Depreciation and Amortization.<br />
(5)<br />
At 30 June <strong>2012</strong><br />
(6)<br />
At 31 December 2011<br />
Note: The terms “<strong>Fiat</strong>”, “<strong>Fiat</strong> Group” or “Group” are used to identify <strong>Fiat</strong> S.p.A. together with its direct and indirect subsidiaries which include, beginning<br />
1 st June 2011, Chrysler Group LLC and its direct and indirect subsidiaries following the acquisition of control. <strong>Fiat</strong> and Chrysler will continue to manage<br />
financial matters, including funding and cash management, separately. Additionally, <strong>Fiat</strong> has not provided guarantees or security or undertaken any other<br />
similar commitment in relation to any financial obligation of Chrysler, nor does it have any commitment to provide funding to Chrysler in the future.<br />
1<br />
Q3 <strong>2012</strong>
illion, mainly driven by growth in North America. Components reported revenues of approximately €2.0<br />
billion, substantially in line with Q3 2011.<br />
Trading profit totaled €951 million for the <strong>quarter</strong>. The NAFTA region reported a trading profit of<br />
€660 million, an increase of 67% driven by strong volume growth. For LATAM, trading profit totaled<br />
€341 million, down €56 million over the prior year with better volume and mix more than offset by cost<br />
inflation and negative currency translation impacts of €14 million. APAC doubled to €73 million driven by<br />
improved volumes and mix. The negative trading conditions in EMEA resulted in a trading loss of €238 million<br />
(€116 million loss in Q3 2011), with cost containment actions partially mitigating the impact of reduced<br />
volumes and negative pricing pressure. Luxury and Performance brands and Components contributed<br />
€89 million and €39 million, respectively. Trading profit for <strong>Fiat</strong> excluding Chrysler was reduced to<br />
€105 million from €295 million in Q3 2011, principally due to the worsened trading conditions in Europe.<br />
EBIT was €880 million. For mass-market brands, EBIT by region was as follows: NAFTA increased by 65% to<br />
€664 million; LATAM was €310 million (with unusual charges of €31 million in Q3 <strong>2012</strong>), down from €397 million in<br />
Q3 2011; APAC more than tripled to €74 million. EMEA reported a €219 million loss (€136 million loss in Q3 2011);<br />
excluding unusuals, the loss was €195 million in Q3 <strong>2012</strong>, compared to a loss of €76 million in Q3 2011.<br />
Net financial expense totaled €399 million, compared to €543 million in 2011, which included a €138 million<br />
loss from the mark-to-market value of the <strong>Fiat</strong> stock option-related equity swaps (€1 million gain in Q3 <strong>2012</strong>).<br />
Net of this item, net financial expense was substantially in line with the prior year.<br />
Profit before taxes was €481 million, an increase of €199 million over Q3 2011, reflecting a €55 million<br />
improvement in EBIT and €144 million reduction in net financial expense.<br />
Income taxes totaled €195 million (€170 million in Q3 2011) and related primarily to the taxable income of<br />
companies operating outside Europe and employment-related taxes in Italy.<br />
Net profit was €286 million for the <strong>quarter</strong>, more than doubling the €112 million for Q3 2011. Profit<br />
attributable to owners of the parent amounted to €39 million (loss of €46 million in Q3 2011). Excluding<br />
unusuals, net profit for the <strong>quarter</strong> was €362 million (€169 million in Q3 2011).<br />
Net industrial debt for the Group at 30 September <strong>2012</strong> was €6.7 billion, an increase of €1.3 billion for the<br />
<strong>quarter</strong>, with €1.4 billion negative cash flow for <strong>Fiat</strong> excluding Chrysler, in line with last year and taking its net<br />
industrial debt to €5.5 billion as of <strong>quarter</strong>-end, and €0.1 billion positive cash flow for Chrysler reducing its<br />
net industrial debt to €1.2 billion.<br />
Total available liquidity, inclusive of €3.0 billion in undrawn committed credit lines (unchanged over June<br />
end), was €20.0 billion (€22.7 billion at June end), of which €9.8 billion related to <strong>Fiat</strong> excluding Chrysler<br />
(€12.1 billion as of June end) and €10.2 billion to Chrysler (€10.6 billion as of June end). Cash utilization for<br />
<strong>Fiat</strong> excluding Chrysler reflected primarily the operating-related cash absorption and €1.3 billion gross debt<br />
reduction. Cash reduction of €0.4 billion at Chrysler was due primarily to the annual payment of accrued<br />
interest on the VEBA Trust Note and currency translation effects, net of the positive contribution from the<br />
operations.<br />
Nine months to September<br />
Group revenues were €62.2 billion for the nine months to September. Excluding Chrysler, revenues totaled<br />
€26.4 billion, a 6% decrease over the same period in 2011, mainly reflecting volume declines in Europe.<br />
Luxury and Performance brands increased revenues by 8% to €2.1 billion. Components were down 1% to<br />
€6.0 billion.<br />
2<br />
Q3 <strong>2012</strong>
Trading profit was €2,827 million. Excluding Chrysler, trading profit was €243 million compared to<br />
€921 million in the same period of 2011. For Luxury and Performance brands, trading profit increased 10% to<br />
€264 million, while Components reported a 25% decrease to €122 million.<br />
EBIT was €2,770 million. Excluding Chrysler, EBIT was €175 million (compared to €2,215 for 2011); net of<br />
unusuals, EBIT totaled €319 million.<br />
Net financial expense totaled €1,237 million. Excluding Chrysler, net financial expense was €612 million,<br />
compared to €632 million for the same period in 2011. Net of the impact of the mark-to-market of the <strong>Fiat</strong><br />
stock option-related equity swaps (a €30 million gain for the nine months to September <strong>2012</strong> and a<br />
€115 million loss for the same period in 2011), net financial expense increased by €125 million mainly<br />
reflecting higher debt levels.<br />
Profit before taxes was €1,533 million. Excluding Chrysler, there was a €437 million loss compared to a<br />
€1,583 million profit in 2011. Net of unusuals, the loss was €293 million in <strong>2012</strong>, compared to a profit of<br />
€362 million for the same period in 2011; the €655 million difference over the nine months to September<br />
2011 mainly reflects the €678 million decrease in trading profit.<br />
Income taxes totaled €510 million. Excluding Chrysler, income taxes were €363 million and related primarily<br />
to the taxable income of companies operating outside Europe and employment-related taxes in Italy.<br />
Net profit was €1,023 million for the nine months to September. Profit attributable to the owners of the<br />
parent totaled €246 million. Excluding Chrysler, there was an €800 million loss, compared to a €1,207 million<br />
profit for 2011; excluding unusuals, the loss was €656 million, compared to a €37 million loss for the nine<br />
months to September 2011.<br />
Net industrial debt at 30 September <strong>2012</strong> was €6.7 billion, compared to €5.5 billion at year-end 2011.<br />
Chrysler improved net industrial debt by €1.8 billion, partially offsetting absorption of €3.0 billion for the rest<br />
of the Group. Capital expenditure totaled €5.3 billion (of which €2.1 billion for <strong>Fiat</strong> excluding Chrysler),<br />
progressing in line with full-year expectation.<br />
3<br />
Q3 <strong>2012</strong>
FIAT GROUP<br />
Income Statement (3 rd Quarter)<br />
(€ million)<br />
Net revenues<br />
Trading profit<br />
EBIT (1)<br />
EBITDA (2)<br />
Profit/(loss) before taxes<br />
Q3 <strong>2012</strong> Q3 2011<br />
<strong>Fiat</strong><br />
as<br />
reported<br />
(A)<br />
<strong>Fiat</strong><br />
ex<br />
Chrysler<br />
<strong>Fiat</strong><br />
as<br />
reported<br />
(B)<br />
<strong>Fiat</strong><br />
ex<br />
Chrysler<br />
Change<br />
(A vs B)<br />
20,437 8,490 17,552 8,813 16%<br />
951 105 851 295 100<br />
880 61 825 260 55<br />
1,910 596 1,848 823 62<br />
481 (129) 282 (74) 199<br />
Profit/(loss) 286 (281) 112 (210) 174<br />
Profit/(loss) ex-unusuals<br />
362 (231) 169 (150) 193<br />
(1)<br />
Trading profit plus result from investments and unusuals<br />
(2)<br />
EBIT plus Depreciation and Amortization<br />
FIAT GROUP<br />
Income Statement (Sept. YTD)<br />
(€ million)<br />
Net revenues<br />
Trading profit<br />
EBIT (1)<br />
<strong>Fiat</strong><br />
as<br />
reported Chrysler<br />
Sept. YTD <strong>2012</strong> Sept. YTD 2011<br />
<strong>Fiat</strong><br />
ex<br />
Chrysler<br />
(A)<br />
<strong>Fiat</strong> (*)<br />
as<br />
reported<br />
<strong>Fiat</strong><br />
ex<br />
Chrysler<br />
(B)<br />
Change<br />
(A vs B)<br />
62,182 37,969 26,415 39,915 28,013 -6%<br />
2,827 2,584 243 1,627 921 -678<br />
2,770 2,595 175 2,707 2,215 -2,040<br />
EBITDA (2)<br />
5,875 4,113 1,762 5,015 3,887 -2,125<br />
Profit/(loss) before taxes<br />
1,533 1,970 (437) 1,796 1,583 -2,020<br />
Profit/(loss) 1,023 1,823 (800) 1,386 1,207 -2,007<br />
Profit/(loss) ex-unusuals<br />
(*)<br />
Includes Chrysler from 1 June 2011<br />
(1)<br />
Trading profit plus result from investments and unusuals<br />
(2)<br />
EBIT plus Depreciation and Amortization<br />
1,155 1,811 (656) 362 (37) -619<br />
FIAT GROUP<br />
Net Debt and Available Liquidity<br />
(€ million)<br />
<strong>Fiat</strong> as<br />
reported Chrysler<br />
30.09.<strong>2012</strong> 30.06.<strong>2012</strong> 31.12.2011<br />
<strong>Fiat</strong><br />
ex-<br />
Chrysler<br />
<strong>Fiat</strong> as<br />
reported Chrysler<br />
<strong>Fiat</strong><br />
ex-<br />
Chrysler<br />
<strong>Fiat</strong> as<br />
reported Chrysler<br />
<strong>Fiat</strong><br />
ex-<br />
Chrysler<br />
Cash Maturities (Principal) (26,008) (10,344) (15,664) (27,099) (10,535) (16,564) (25,331) (10,301) (15,030)<br />
Bank Debt (7,727) (2,773) (4,954) (8,062) (2,832) (5,230) (7,587) (2,757) (4,830)<br />
Capital Market (1) (11,912) (2,475) (9,437) (12,654) (2,542) (10,112) (11,409) (2,473) (8,936)<br />
Other Debt (2) (6,369) (5,096) (1,273) (6,383) (5,161) (1,222) (6,335) (5,071) (1,264)<br />
Asset-backed financing (3) (280) - (280) (465) - (465) (710) (31) (679)<br />
Accruals and other adjustments (4) (471) (154) (317) (941) (413) (528) (710) (195) (515)<br />
Gross Debt (26,759) (10,498) (16,261) (28,505) (10,948) (17,557) (26,751) (10,527) (16,224)<br />
Cash & Marketable Securities 17,060 9,240 7,820 19,765 9,591 10,174 17,725 7,420 10,305<br />
Derivatives Assets/(Liabilities) 210 15 195 165 6 159 128 27 101<br />
Net Debt (9,489) (1,243) (8,246) (8,575) (1,351) (7,224) (8,898) (3,080) (5,818)<br />
Industrial Activities (6,694) (1,243) (5,451) (5,435) (1,351) (4,084) (5,529) (3,080) (2,449)<br />
Financial Services (2,795) - (2,795) (3,140) - (3,140) (3,369) - (3,369)<br />
Undrawn committed credit lines 2,955 1,005 1,950 2,983 1,033 1,950 2,955 1,005 1,950<br />
Total available liquidity 20,015 10,245 9,770 22,748 10,624 12,124 20,680 8,425 12,255<br />
(1) Includes bonds and other securities issued in the financial markets.<br />
(2) Includes VEBA Trust Note, HCT Notes, IFRIC 4 and other non-bank financing.<br />
(3) Advances on sale of receivable and securitization on book.<br />
(4) 30 September <strong>2012</strong> Includes: adjustments for hedge accounting on financial payables for -€112 million (-€127 million as of 30 June <strong>2012</strong>, -€166 million as of 31 December<br />
2011), current financial receivables from jointly controlled financial service companies of €59 million (€39 million as of 30 June <strong>2012</strong>, €21 million as of 31 December 2011) and<br />
(accrued)/unearned net financial charges for an amount of -€418 million (-€853 million as of 30 June <strong>2012</strong>, -€565 million as of 31 December 2011).<br />
4<br />
Q3 <strong>2012</strong>
Results by segment<br />
Third <strong>quarter</strong><br />
FIAT GROUP<br />
Revenues and EBIT by segment – 3 rd Quarter<br />
Revenues EBIT (1)<br />
<strong>2012</strong> 2011 Change (€ million) <strong>2012</strong> 2011 Change<br />
10,759 7,772 2,987 NAFTA (mass-market brands) 664 403 261<br />
2,955 2,853 102 LATAM (mass-market brands) 310 397 -87<br />
830 599 231 APAC (mass-market brands) 74 20 54<br />
3,820 4,383 -563 EMEA (mass-market brands) (219) (136) -83<br />
667 640 27 Luxury and Performance Brands (Ferrari, Maserati) 89 87 2<br />
1,951 1,959 -8 Components (Magneti Marelli, Teksid, Comau) 38 58 -20<br />
232 261 -29 Other (61) (8) -53<br />
(777) (915) 138 Eliminations and adj. (15) 4 -19<br />
20,437 17,552 2,885 Total 880 825 55<br />
(1) Trading profit plus result from investments and unusuals.<br />
Nine months to September<br />
FIAT GROUP<br />
Revenues and EBIT by segment – YTD (01.01 to 30.09) as reported<br />
Revenues EBIT (1)<br />
<strong>2012</strong> 2011 (*) Change (€ million) <strong>2012</strong> 2011 (*) Change<br />
32,113 10,668 21,445 NAFTA (mass-market brands) 2,089 511 1,578<br />
8,166 7,813 353 LATAM (mass-market brands) 783 1,001 -218<br />
2,307 933 1,374 APAC (mass-market brands) 219 18 201<br />
13,248 14,549 -1,301 EMEA (mass-market brands) (573) (652) 79<br />
2,105 1,948 157 Luxury and Performance Brands (Ferrari, Maserati) 264 239 25<br />
5,988 6,060 -72 Components (Magneti Marelli, Teksid, Comau) 121 (152) 273<br />
712 785 -73 Other (109) (56) -53<br />
(2,457) (2,841) 384 Eliminations and adj. (24) 1,798 (2) -1,822<br />
62,182 39,915 22,267 Total 2,770 2,707 63<br />
(*) Includes Chrysler from 1 June 2011<br />
(1) Trading profit plus result from investments and unusuals.<br />
(2) Includes €2,017 million unusual income from measurement of the stake in Chrysler upon acquisition date, net of the related<br />
revaluation of Chrysler’s inventories of €220 million which was recognized in the income statement in June.<br />
FIAT GROUP<br />
Revenues and EBIT by segment –YTD <strong>2012</strong> vs. YTD 2011 pro-forma<br />
<strong>2012</strong><br />
Revenues EBIT (2)<br />
2011<br />
pro-forma (1) Change (€ million)<br />
<strong>2012</strong><br />
2011<br />
pro-forma (1) Change<br />
32,113 24,638 7,475 NAFTA (mass-market brands) 2,089 1,194 895<br />
8,166 8,319 -153 LATAM (mass-market brands) 783 1,055 -272<br />
2,307 1,506 801 APAC (mass-market brands) 219 74 145<br />
13,248 15,036 -1,788 EMEA (mass-market brands) (573) (608) 35<br />
2,105 1,948 157 Luxury and Performance Brands (Ferrari, Maserati) 264 239 25<br />
5,988 6,060 -72 Components (Magneti Marelli, Teksid, Comau) 121 (152) 273<br />
712 785 -73 Other (109) (56) -53<br />
(2,457) (2,987) 530 Eliminations and adj. (24) 1,799 (3) -1,823<br />
62,182 55,305 6,877 Total 2,770 3,545 -775<br />
(1)<br />
Pro-forma calculated by including Chrysler <strong>results</strong> as if consolidated from 1 January 2011.<br />
(2)<br />
Trading profit plus result from investments and unusuals.<br />
(3)<br />
Includes €2,017 million unusual income from measurement of the stake in Chrysler upon acquisition date, net of the related<br />
revaluation of Chrysler’s inventories of €220 million which was recognized in the income statement in June.<br />
5<br />
Q3 <strong>2012</strong>
MASS-MARKET BRANDS<br />
NAFTA<br />
Third Quarter<br />
NAFTA<br />
3 rd Quarter<br />
(€ million) <strong>2012</strong> 2011 Change<br />
Net revenues 10,759 7,772 2,987<br />
Trading profit 660 395 265<br />
EBIT (1) 664 403 261<br />
Shipments (000s) 504 409 95<br />
(1) Trading profit plus result from investments and unusuals.<br />
Vehicle shipments in NAFTA totaled 504,000 units for<br />
Q3 <strong>2012</strong>, representing a 23% increase over Q3 2011. In<br />
the U.S., vehicle shipments were 426,000 (up 29% over<br />
Q3 2011), in Canada shipments were 52,000 vehicles,<br />
down 10% partly due to lower Ram 1500 shipments<br />
due to product changeover. Vehicle shipments for<br />
Mexico were 23,000 (up 28%).<br />
Vehicle sales 1 in the NAFTA region totaled 504,000 for<br />
the <strong>quarter</strong>, an increase of 12% over Q3 2011. In the U.S., vehicle sales growth continued with a 13% increase<br />
to 417,000 units, closing the <strong>quarter</strong> with 30 consecutive months of year-over-year sales gains. In Canada,<br />
sales increased 5% to 64,000 vehicles, and in Mexico, sales were up 17% to 23,000 vehicles.<br />
The U.S. vehicle market during Q3 <strong>2012</strong> was up 14% to 3.7 million vehicles. Group share was fairly consistent<br />
with the prior year at 11.3%. Jeep vehicle sales totaled 124,000 for the <strong>quarter</strong>, up 8% year-over-year, with<br />
the Patriot (+21%) and the Grand Cherokee (+18%) leading the increase. Dodge, the Group’s number one<br />
selling brand in the U.S., posted vehicle sales of 131,000 for Q3 <strong>2012</strong>, up 13% from the prior year mainly<br />
driven by the Journey (+55%), the Avenger (+50%), the Grand Caravan (+36%) and the new Dodge Dart, still in<br />
the ramp-up phase (9,000 vehicles sold). The Ram truck brand posted a sales increase of 11% to 76,000<br />
vehicles and the Ram pickup truck, Chrysler Group’s volume leader, had its best September sales<br />
performance since 2007. Chrysler brand sales totaled 74,000 vehicles for Q3 <strong>2012</strong>, an increase of 20% over<br />
the prior year with strong performance from the Chrysler 300 (+32%) and 200 (+20%).<br />
The Canadian vehicle market grew 6% year-over-year to 450,000 vehicles for the <strong>quarter</strong>. Total market share<br />
was 14.3% in the <strong>quarter</strong> (14.5% in Q3 2011). Key performers included the Chrysler 300 (+80%) and 200<br />
(+71%), Jeep Wrangler (+18%) and Dodge Journey (+17%).<br />
<strong>Fiat</strong> 500 sales in the U.S. and Canada totaled 14,000 vehicles for the <strong>quarter</strong>, compared to 11,000 vehicles in<br />
Q3 2011, with the monthly sales rate being constantly over 4,000 units since March <strong>2012</strong>.<br />
The NAFTA region reported revenues of €10.8 billion, up 38% (+22% at constant exchange rates) over the<br />
prior year primarily due to higher volumes.<br />
Trading profit for Q3 <strong>2012</strong> was €660 million, up 67% over the prior year (+47% at constant exchange rates),<br />
with volume increases and positive net pricing partially offset by higher industrial costs, impacted by<br />
manufacturing capacity increases and higher advertising. EBIT was €664 million, reflecting the strong trading<br />
profit performance for the period.<br />
The Dodge Dart was named a “<strong>2012</strong> Top Safety Pick” by the Insurance Institute for Highway Safety. The 2013<br />
Dart, along with the newly launched 2013 Ram 1500, were named to Total Car Score’s list of “Top 10 New<br />
Cars for 2013” and the Washington Post’s list of “Most Important New Cars for 2013.” The <strong>2012</strong> <strong>Fiat</strong> 500 was<br />
named one of the “10 Best Back-to-School Cars” by Kelley Blue Book’s kbb.com, and was also awarded<br />
1 Sales” represent sales to end customers as reported by the Chrysler dealer network.<br />
6<br />
Q3 <strong>2012</strong>
Strategic Vision’s “Total Quality Index Award” in the Small Car segment. Road & Travel Magazine honored the<br />
<strong>2012</strong> Dodge Journey as a “Top 10 Pick” in its <strong>2012</strong> SUV Buyer’s Guide. The Texas Auto Writers Association<br />
awarded the 2013 Ram 1500 the “Truck of Texas” and the Jeep Grand Cherokee the “SUV of Texas” awards<br />
during this year’s Texas Truck Rodeo; overall, the Ram Truck and Jeep brands won eight of the 19 awards at<br />
the event.<br />
Nine months to September<br />
NAFTA<br />
YTD (01.01 to 30.09)<br />
(€ million) <strong>2012</strong> 2011 Change<br />
1%). Vehicle shipments for Mexico were 68,000 (up 15%).<br />
2011<br />
pro-forma (1) Change<br />
Net revenues 32,113 10,668 21,445 24,638 7,475<br />
Trading profit 2,047 505 1,542 1,190 857<br />
EBIT (2) 2,089 511 1,578 1,194 895<br />
Shipments (000s) 1,572 567 1,005 1,317 255<br />
(1) Pro-forma calculated by including Chrysler <strong>results</strong> as if consolidated from 1 January 2011.<br />
(2) Trading profit plus result from investments and unusuals.<br />
Vehicle shipments in NAFTA<br />
totaled 1,572,000 units for the<br />
nine months to September,<br />
representing a 19% increase over<br />
the same period of 2011, on a<br />
pro-forma basis. In the U.S.,<br />
vehicle shipments were 1,290,000<br />
(up 23% over 2011), shipments in<br />
Canada were 201,000 vehicles (up<br />
Vehicle sales in the NAFTA region totaled 1,511,000 for the period, an increase of 21% over the nine months<br />
to September 2011 (on a pro-forma basis). In the U.S., vehicle sales increased 24% to 1,251,000. In Canada,<br />
sales increased 6% to 195,000 vehicles, and sales in Mexico were up 11% to 65,000 vehicles.<br />
For the nine months to September <strong>2012</strong>, the U.S. vehicle market was up 15% to 11.1 million vehicles. Overall<br />
market share was 11.2%, compared to 10.4% for the nine months to September 2011. Jeep vehicle sales<br />
totaled 365,000 for the period, up 20% year-over-year. Dodge posted vehicle sales of 392,000 during the nine<br />
months to September <strong>2012</strong>, an increase of 14%. The Ram brand posted a sales increase of 15% to 219,000<br />
vehicles. Chrysler brand sales totaled 242,000 vehicles the nine months to September <strong>2012</strong>, up 53% over the<br />
same period a year ago.<br />
The Canadian vehicle market grew 7% year-over-year to 1,330,000 vehicles. Total market share was 14.6%,<br />
fairly consistent with the nine months to September 2011.<br />
<strong>Fiat</strong> 500 sales in the U.S. and Canada totaled 40,000 cars for the nine months to September <strong>2012</strong>, compared<br />
to 18,000 vehicles for the same period of 2011, already meeting the full-year volume expectation.<br />
The NAFTA region reported revenues of €32 billion for the nine months to September <strong>2012</strong>, up 30% (+19% at<br />
constant exchange rates) over the prior year on a pro-forma basis, primarily due to higher volumes.<br />
Trading profit for the nine months to September <strong>2012</strong> was €2,047 million, up 72% over the prior year, on a<br />
pro-forma basis (+56% at constant exchange rates). EBIT was €2,089 million, reflecting the strong trading<br />
profit performance for the period.<br />
7<br />
Q3 <strong>2012</strong>
LATAM<br />
Third Quarter<br />
LATAM<br />
3 rd Quarter<br />
(€ million) <strong>2012</strong> 2011 Change<br />
Net revenues 2,955 2,853 102<br />
Trading profit 341 397 -56<br />
EBIT (1) 310 397 -87<br />
Shipments (000s) 271 237 34<br />
(1) Trading profit plus result from investments and unusuals.<br />
cars only, the year-over-year increase was 25%.<br />
In Q3 <strong>2012</strong>, shipments in the LATAM region totaled<br />
271,000 units, up 14% over the prior year, with the<br />
Brazilian market reacting positively to government<br />
measures introduced in May, including a temporary<br />
reduction in vehicle sales tax that the government has<br />
confirmed will remain in place until year-end.<br />
In Brazil, the passenger car and LCV market was up<br />
16% over Q3 2011 to 1,034,000 units. For passenger<br />
The Group confirmed its leadership of the Brazilian market, outpacing a strong market with overall share up<br />
2.3 p.p. to 24.3% and demonstrating its ability to react promptly to increased market demand. The Group’s<br />
best-selling products continued to perform well, led by the continued success of the new Uno and Palio. <strong>Fiat</strong><br />
retained its leadership in the A and B segments with a combined share of 31.2%.<br />
The Group shipped a total of 243,000 passenger cars and LCVs in Brazil, representing a 23% year-over-year<br />
increase. Strong sales performance for Jeep and RAM brands resulted in year-over-year increases of 91% and<br />
of 25%, respectively.<br />
In Argentina, the market was down 9% over the prior year to a total of 207,000 units for the <strong>quarter</strong>. Group<br />
sales decreased 33% to 19,000 units, with market share at 9.3% (-3.3 p.p.). Shipments were down 37% to<br />
approximately 18,000 units. Both sales and shipments were affected during the <strong>quarter</strong> by the reduced<br />
product availability associated with customs delays for imported vehicles.<br />
In other LATAM markets, shipments totaled approximately 11,000 units (-8% versus Q3 2011).<br />
Revenues for the region totaled €2,955 million, representing a 4% increase over Q3 2011 (+10% at constant<br />
exchange rates) driven by higher volumes.<br />
Trading profit was €341 million, compared to €397 million for Q3 2011. Better volumes and mix together<br />
with manufacturing efficiencies were more than offset by an inflationary cost increase, higher costs related to<br />
new vehicle launches and currency translation impacts. EBIT totaled €310 million, including €31 million in<br />
unusual charges, compared to €397 million for Q3 2011.<br />
In July, the <strong>Fiat</strong> brand launched the new Punto in Brazil and Dodge launched the all-new 2013 Dodge Dart in<br />
Puerto Rico. In August, <strong>Fiat</strong> launched a sun-roof option for the new Palio and Grand Siena, making it the first<br />
automaker in Brazil to offer a factory-installed sun-roof in the B-sedan segment.<br />
The Brazilian government recently launched the “Inovar Auto Program” to foster long-term development of<br />
the domestic car industry through subsidized incentive schemes tied to energy efficiency, investment in R&D<br />
and engineering, as well as domestic production. The Group is well positioned to participate in and fully<br />
benefit from this program, which will run from 2013 to 2017.<br />
8<br />
Q3 <strong>2012</strong>
Nine months to September<br />
LATAM<br />
YTD (01.01 to 30.09)<br />
(€ million) <strong>2012</strong> 2011 Change<br />
2011<br />
pro-forma (1) Change<br />
Net revenues 8,166 7,813 353 8,319 -153<br />
Trading profit 814 1,026 -212 1,080 -266<br />
EBIT (2) 783 1,001 -218 1,055 -272<br />
Shipments (000s) 712 675 37 694 18<br />
(1) Pro-forma calculated by including Chrysler <strong>results</strong> as if consolidated from 1 January 2011.<br />
(2) Trading profit plus result from investments and unusuals.<br />
For the nine months to<br />
September <strong>2012</strong>, shipments in<br />
the LATAM region totaled<br />
712,000 units, a 3% increase over<br />
the prior year (on a pro-forma<br />
basis).<br />
In Brazil, the passenger car and<br />
LCV market registered a 5% year-<br />
over-year increase to 2,667,000 units. The Group confirmed its leadership of the Brazilian market, with<br />
overall share up 0.8 p.p. to 23.1%. A total of 614,000 passenger cars and LCVs were shipped during the<br />
period, representing a 5% increase over the prior year (on a pro-forma basis).<br />
In Argentina, where the market was in line with the same period in 2011 at 648,000 units, Group sales<br />
totaled approximately 71,000 units with share at 10.9% (-0.7 p.p.). Shipments decreased by 16% (on a proforma<br />
basis) to 63,000 vehicles.<br />
In other LATAM countries, shipments totaled approximately 35,000 units (-5% over 2011).<br />
Revenues for the region totaled €8.2 billion, 2% lower than the same period a year ago (on a pro-forma<br />
basis). At constant exchange rates, revenues were up 2%.<br />
Trading profit was €814 million for the period, compared to €1,080 million for 2011 (on a pro-forma basis).<br />
EBIT totaled €783 million, including €31 million in unusual charges. For 2011, EBIT was €1,055 million (on a<br />
pro-forma basis), including €25 million in unusual charges.<br />
9<br />
Q3 <strong>2012</strong>
APAC<br />
Third Quarter<br />
APAC<br />
3 rd Quarter<br />
(€ million) <strong>2012</strong> 2011 Change<br />
Net revenues 830 599 231<br />
Trading profit 73 37 36<br />
EBIT (1) 74 20 54<br />
Shipments (000s) 26 23 3<br />
(1) Trading profit plus result from investments and unusuals.<br />
Vehicle shipments in the region (excluding JVs) totaled<br />
approximately 26,000 units for Q3 <strong>2012</strong>, up 13% from<br />
a year ago.<br />
Demand increased in most of the Group’s key markets<br />
(i.e., India, China, Japan, Australia), but contracted<br />
slightly in South Korea.<br />
Group retail sales, including JVs, totaled 28,000 units<br />
for the <strong>quarter</strong>, an 11% increase over Q3 2011 (compared to a 10% increase for the market overall), driven by<br />
strong performance in China (+18%), Australia (+44%), Japan (+20%) and South Korea (+21%). The Jeep brand<br />
accounted for 69% of APAC sales, almost doubling in volumes over Q3 2011 with a particularly strong<br />
performance in China (+114%).<br />
Revenues in the APAC region totaled €830 million, up 39% over Q3 2011 (+24% at constant exchange rates),<br />
primarily driven by the performance of the Jeep and Chrysler brands.<br />
Trading profit was €73 million, double the prior year, benefiting primarily from volume growth and a<br />
favorable exchange rate impact. EBIT, which also reflects the contribution from joint ventures, totaled €74<br />
million, compared to €20 million in Q3 2011.<br />
Nine months to September<br />
APAC<br />
YTD (01.01 to 30.09)<br />
(€ million) <strong>2012</strong> 2011 Change<br />
2011<br />
pro-forma (1) Change<br />
Net revenues 2,307 933 1,374 1,506 801<br />
Trading profit 214 46 168 102 112<br />
EBIT (2) 219 18 201 74 145<br />
Shipments (000s) 77 34 43 55 22<br />
(1) Pro-forma calculated by including Chrysler <strong>results</strong> as if consolidated from 1 January 2011.<br />
(2) Trading profit plus result from investments and unusuals.<br />
Vehicle shipments in the region<br />
(excluding JVs) totaled<br />
approximately 77,000 units for<br />
the nine months, up 40% over a<br />
year ago (on a pro-forma basis).<br />
Group retail sales, including JVs,<br />
totaled 80,500 units for the<br />
period, up 20% over the prior<br />
year and outperforming the industry (+14%), driven by strong performance in China (+23%), Australia (+49%),<br />
Japan (+34%) and South Korea (+29%).<br />
Revenues in the APAC region totaled €2,307 million, up 53% over same period last year (€1,506 million on a<br />
pro-forma basis).<br />
Trading profit was €214 million, more than double the €102 million for the same period in 2011 (on a proforma<br />
basis). EBIT for the nine months was more than triple the prior year at €219 million.<br />
10<br />
Q3 <strong>2012</strong>
EMEA<br />
Third Quarter<br />
EMEA<br />
3 rd Quarter<br />
(€ million) <strong>2012</strong> 2011 Change<br />
Net revenues 3,820 4,383 -563<br />
Trading profit/(loss) (238) (116) -122<br />
EBIT (1) (219) (136) -83<br />
Shipments (000s) 203 239 -36<br />
(1) Trading profit plus result from investments and unusuals.<br />
Passenger car and LCV shipments in the EMEA region<br />
totaled 203,000 units for the <strong>quarter</strong>, a decrease of<br />
around 15% over Q3 2011. A total of 159,000<br />
passenger cars were shipped (-17%), while LCV<br />
shipments totaled 44,000 (-9%). For passenger cars,<br />
volume decreases were primarily in Italy (-17,300 units<br />
or -20%), followed by Germany (-4,900 units or<br />
-26%) and France (-4,600 units or -32%). For the other<br />
major markets, shipments were slightly down in Spain and up in the UK (+1,800 units or 12%). For LCVs, the<br />
reduction was principally attributable to the contraction in demand in Italy.<br />
In Europe (EU27+EFTA), demand for passenger cars was down 9% overall to 2.8 million vehicles, with declines<br />
in nearly all major markets. Germany, Europe’s largest market, recorded its first decrease this year with<br />
demand down 7.0% for the <strong>quarter</strong>. In Italy, demand fell 23%, marking the worst <strong>third</strong> <strong>quarter</strong> performance<br />
since 1976. Demand was also down in France (-12%) and Spain (-18%). The UK was the only major market to<br />
run counter to the trend, registering an 8% year-over-year increase for the <strong>quarter</strong>.<br />
Group brands recorded a 5.9% combined share of the European market, representing a 0.6 percentage point<br />
decline over Q3 2011. The decrease was almost entirely attributable to the unfavorable market mix, with<br />
Italy’s weighting in the European total reducing from 11.4% in Q3 2011 to 9.7%. In Italy, where trading<br />
conditions remained extremely challenging, the Group increased market share 0.2 p.p. to 30.1%. That gain<br />
reflected positive performance in the A and C segments and strengthening of the Group’s leadership in<br />
alternative fuel vehicles (CNG and LPG).<br />
By major market, share was higher in Spain (+0.2 p.p.) and the UK (+0.3 p.p.) and down in France (-0.7 p.p.)<br />
and Germany (-0.3 p.p.).<br />
The European light commercial vehicle market (EU27+EFTA) registered a 10% contraction over Q3 2011 to<br />
361,200 units. Overall performance for the LCV segment was also heavily affected by the drop in demand in<br />
Italy (-37%).<br />
<strong>Fiat</strong> Professional closed the <strong>quarter</strong> with a 10.9% share 2 of the European LCV market, a decline of<br />
approximately one percentage point over Q3 2011 that was mostly attributable to the unfavorable market<br />
mix. Excluding Italy, market share was unchanged at 8.9%. In Italy, market share was 40.9%, compared to<br />
42.4% in Q3 2011, which benefited significantly from fleet renewal activity. The <strong>Fiat</strong> Ducato continued its<br />
performance as one of the best selling commercial vehicles in its category.<br />
EMEA closed the <strong>third</strong> <strong>quarter</strong> with revenues of €3,820 million, down 13% over the same period in 2011,<br />
mainly reflecting volume declines.<br />
There was a trading loss of €238 million for the <strong>quarter</strong> (€116 million loss for Q3 2011), with negative volume<br />
and price effects only partially offset by industrial efficiencies, World Class Manufacturing synergies and<br />
benefits from cost containment actions. There was an EBIT loss of €219 million, including €24 million in<br />
unusual charges, compared to a loss of €136 million for Q3 2011, which included €60 million in unusual<br />
2 Due to unavailability of official data for the LCV market since Jan 2011, figures reported beyond that date are an extrapolation. Therefore,<br />
marginal discrepancies versus actual data may exist.<br />
11<br />
Q3 <strong>2012</strong>
charges consisting principally of restructuring provisions. The result from investments contributed a positive<br />
€43 million (€40 million in Q3 2011).<br />
The Group was present at the Paris Motor Show with a variety of new versions, including three all-new<br />
variants of the Panda: the highly versatile 4x4 and Trekking, in addition to the gasoline/CNG Natural Power.<br />
Also in September, new versions of the 500L to be released in the coming months, with additional engine and<br />
transmission options, were presented to the automotive press.<br />
Nine months to September<br />
EMEA<br />
YTD (01.01 to 30.09)<br />
(€ million) <strong>2012</strong> 2011 Change<br />
2011<br />
pro-forma (1) Change<br />
Net revenues 13,248 14,549 -1,301 15,036 -1,788<br />
Trading profit/(loss) (583) (332) -251 (287) -296<br />
EBIT (2) (573) (652) 79 (608) 35<br />
Shipments (000s) 764 891 -127 905 -141<br />
(1) Pro-forma calculated by including Chrysler <strong>results</strong> as if consolidated from 1 January 2011.<br />
(2) Trading profit plus result from investments and unusuals.<br />
For the nine months, passenger<br />
car and LCV shipments in the<br />
EMEA region totaled 764,000<br />
units, a decrease of<br />
approximately 141,000 units<br />
(-16%) over the same period in<br />
2011 (on a pro-forma basis).<br />
Passenger car shipments totaled<br />
617,000 units (-15%), with<br />
decreases in all major European markets except the UK (+5%). LCV shipments decreased 17% to 147,000<br />
units. In both segments, the reduction was primarily attributable to declines in demand in Italy and France.<br />
For the nine months to September, the European passenger car market was down 7% overall to 9.7 million<br />
vehicles, with the most significant declines in Italy (-20%), France (-14%) and Spain (-11%).<br />
Group brands recorded a 6.4% combined share of the European market, representing a 0.7 percentage point<br />
year-over-year decline primarily attributable to the unfavorable market mix. In Italy, market share was in line<br />
with the nine months to September 2011 at 29.7%.<br />
The European light commercial vehicle market registered a 10% decline for the nine months to September,<br />
with overall performance heavily influenced by sharp declines in Italy (-35%) and Spain (-26%).<br />
<strong>Fiat</strong> Professional closed the period with an overall European market share of 11.9%. The 1.2 percentage point<br />
decline reflected the unfavorable market mix and non-recurring fleet renewals in the prior year.<br />
EMEA closed the nine months to September with revenues of €13,248 million, down 12% over the same<br />
period in 2011 (on a pro-forma basis), mainly reflecting volume declines.<br />
There was a trading loss of €583 million for the nine months to September (€287 million loss for the<br />
corresponding period of 2011, on a pro-forma basis). EBIT also reflected a loss of €573 million with unusual<br />
charges of €114 million (€608 million loss for the nine months to September 2011, on a pro-forma basis,<br />
including unusual charges of €433 million). The result from investments contributed a positive €124 million<br />
(positive €112 million in 2011).<br />
12<br />
Q3 <strong>2012</strong>
LUXURY AND PERFORMANCE BRANDS<br />
LUXURY AND PERFORMANCE BRANDS<br />
Ferrari, Maserati – 3 rd Quarter<br />
(€ million)<br />
Ferrari<br />
Q3<br />
<strong>2012</strong><br />
Q3<br />
2011 Change<br />
Net revenues 556 525 31<br />
Trading profit 81 77 4<br />
EBIT (1) 81 77 4<br />
Maserati<br />
Net revenues 148 142 6<br />
Trading profit 8 8 -<br />
EBIT (1) 8 8 -<br />
LUXURY AND PERFORMANCE BRANDS<br />
Net revenues (*) 667 640 27<br />
Trading profit (*) 89 87 2<br />
EBIT (1) 89 87 2<br />
(1) Trading profit/(loss) plus result from investments and unusuals.<br />
(*) Net of eliminations.<br />
LUXURY AND PERFORMANCE BRANDS<br />
Ferrari, Maserati –YTD (01.01 to 30.09)<br />
(€ million)<br />
Ferrari<br />
YTD<br />
<strong>2012</strong><br />
YTD<br />
2011 Change<br />
Net revenues 1,764 1,605 159<br />
Trading profit 233 212 21<br />
EBIT (1) 233 212 21<br />
Maserati<br />
Net revenues 472 445 27<br />
Trading profit 31 26 5<br />
EBIT (1) 31 26 5<br />
LUXURY AND PERFORMANCE BRANDS<br />
Net revenues (*) 2,105 1,948 157<br />
Trading profit (*) 264 239 25<br />
EBIT (1) 264 239 25<br />
(1) Trading profit/(loss) plus result from investments and unusuals.<br />
(*) Net of eliminations.<br />
Ferrari<br />
For Q3 <strong>2012</strong>, Ferrari shipped a total of 1,603 street cars, a 2%<br />
increase over the prior year driven primarily by sales of the<br />
458 Spider and FF. Volumes did not yet benefit from the<br />
contribution of the F12 Berlinetta.<br />
North America remained Ferrari’s no. 1 market with 551 street<br />
cars shipped during the <strong>quarter</strong> (+18% over Q3 2011),<br />
accounting for 34% of the global total. In Asia Pacific,<br />
shipments were higher in Japan, but substantially stable yearover-year<br />
in China, Hong Kong, Taiwan and Australia. In EMEA,<br />
higher volumes in the UK were offset by declines in other<br />
markets in the region.<br />
Ferrari reported <strong>third</strong> <strong>quarter</strong> revenues of €556 million, a 6%<br />
increase over the same period in 2011 attributable to higher<br />
volumes, a more favorable sales mix and strong <strong>results</strong> from<br />
the personalization program.<br />
Trading profit and EBIT totaled €81 million, compared to<br />
€77 million for Q3 2011. The improvement was primarily<br />
attributable to increased contributions from the<br />
personalization program and licensing activities.<br />
At the Paris Motor Show in September, Ferrari presented its<br />
entire line-up of current models together with an all-new<br />
carbon fiber body shell, a technology transfer from Formula<br />
One, developed for the upcoming limited edition model. The<br />
F12 Berlinetta, presented to the international press in July and<br />
August, also received critical acclaim for its dynamic<br />
performance and features.<br />
For the nine months to September, Ferrari shipped a total of<br />
5,267 street cars, a 6% increase over the corresponding period in 2011. The growth was primarily driven by<br />
12-cylinder models (+22% year-over-year). North America maintained its position as Ferrari’s primary market<br />
with 1,512 street cars shipped year-to-date, accounting for 29% of total shipments (+15% vs. 2011). Volumes<br />
were also higher in China, Hong Kong and Taiwan where a total of 566 vehicles were shipped (+7% vs. 2011),<br />
accounting for 11% of the global total.<br />
Ferrari closed the nine months with revenues of €1,764 million, up 10% over the same period in 2011.<br />
Trading profit and EBIT totaled €233 million for the period, an increase of €21 million over the €212 million<br />
for the same period in 2011, primarily reflecting higher volumes, a more favorable product mix and the<br />
positive contribution from licensing activities.<br />
13<br />
Q3 <strong>2012</strong>
Maserati<br />
Maserati shipped a total of 1,432 cars during the <strong>third</strong> <strong>quarter</strong>, a slight decrease (-2%) over the same period<br />
in 2011, with lower registrations in Europe and China largely compensated for by increases in the U.S. (+12%)<br />
and Middle East (+24%).<br />
Revenues totaled €148 million for the <strong>third</strong> <strong>quarter</strong>, an approximate 4% increase over the same period in<br />
2011. Net of currency effects, revenues were down approximately 2% primarily due to the decrease in<br />
volumes.<br />
Maserati closed the <strong>quarter</strong> with trading profit and EBIT of €8 million (trading margin at 5.4%), in line with Q3<br />
2011.<br />
At the Paris Motor Show in September, Maserati presented the GranCabrio MC, the latest addition to its<br />
range of luxury convertibles which also includes the GranCabrio and GranCabrio Sport.<br />
For the nine months to September, the brand shipped a total of 4,754 vehicles, a 2% increase over the prior<br />
year with growth in the U.S. (+18%), the Middle East (+57%) and China (+3%) more than offsetting a 37%<br />
decline in Europe.<br />
Maserati reported revenues of €472 million for the period, up approximately 6% over the nine months to<br />
September 2011.<br />
Trading profit and EBIT totaled €31 million (trading margin at 6.6%), representing an increase over the<br />
€26 million profit recorded for the nine months to September 2011.<br />
14<br />
Q3 <strong>2012</strong>
COMPONENTS AND PRODUCTION SYSTEMS<br />
COMPONENTS AND PRODUCTION SYSTEMS<br />
Magneti Marelli, Teksid, Comau – 3 rd Quarter<br />
(€ million)<br />
Magneti Marelli<br />
Q3<br />
<strong>2012</strong><br />
Q3<br />
2011 Change<br />
Net revenues 1,426 1,374 52<br />
Trading profit 29 43 -14<br />
EBIT (1) 26 42 -16<br />
Teksid<br />
Net revenues 183 229 -46<br />
Trading profit 1 12 -11<br />
EBIT (1) 2 12 -10<br />
Comau<br />
Net revenues 358 371 -13<br />
Trading profit 9 4 5<br />
EBIT (1) 9 4 5<br />
COMPONENTS AND PRODUCTION SYSTEMS<br />
Net revenues (*) 1,951 1,959 -8<br />
Trading profit 39 59 -20<br />
Unusual (charges)/gain - - -<br />
EBIT (1) 38 58 -20 -<br />
(1) Trading profit/(loss) plus result from investments and unusuals.<br />
(*) Net of eliminations.<br />
COMPONENTS AND PRODUCTION SYSTEMS<br />
Magneti Marelli, Teksid, Comau – YTD (01.01 to 30.09)<br />
(€ million)<br />
Magneti Marelli<br />
YTD<br />
<strong>2012</strong><br />
YTD<br />
2011 Change<br />
Net revenues 4,344 4,400 -56<br />
Trading profit 95 127 -32<br />
EBIT (1) 92 (41) 133<br />
Teksid<br />
Net revenues 610 705 -95<br />
Trading profit 7 26 -19<br />
EBIT (1) 10 10 -<br />
Comau<br />
Net revenues 1,080 1,004 76<br />
Trading profit 20 8 12<br />
EBIT (1) 19 (121) 140<br />
COMPONENTS AND PRODUCTION SYSTEMS<br />
Net revenues (*) 5,988 6,060 -72<br />
Trading profit 122 162 -40<br />
Magneti Marelli<br />
Third <strong>quarter</strong> revenues were up 4% over the prior year to<br />
€1,426 million. In Europe, positive trading conditions in<br />
Germany compensated for difficulties elsewhere. Outside<br />
Europe, conditions in NAFTA, China and Brazil were all<br />
favorable.<br />
The majority of business lines recorded revenue<br />
decreases for the <strong>quarter</strong>, with the exception of Lighting<br />
(revenues up 18%) – which benefited from strong demand<br />
from German customers and new technological content<br />
for products launched during the second half of 2011 –<br />
and Electronic Systems (+35%), where the increase in<br />
sales of telematic and body products to external<br />
customers compensated for a contraction in captive<br />
volumes in Europe.<br />
Trading profit came in at €29 million, compared to<br />
€43 million for Q3 2011. The decline was principally<br />
attributable to lower volumes in Europe and costs<br />
associated with production start-ups in the NAFTA region,<br />
both of which were only partially offset by cost<br />
containment measures and efficiency gains achieved<br />
during the period.<br />
EBIT was €26 million for the <strong>quarter</strong>, compared to<br />
€42 million for the same period in 2011. The difference<br />
was principally attributable to the decrease in trading<br />
profit.<br />
For the nine months to September, Magneti Marelli<br />
reported revenues of €4,344 million, down 1% over the<br />
same period in 2011. Revenues were higher for the<br />
Lighting (+14%) and Electronic Systems (+18%) business<br />
lines, but lower for other major business lines as a result<br />
of weaker demand in Europe (principally Italy and Poland)<br />
and Brazil.<br />
Unusual (charges)/gain (3) (301) 298 Magneti Marelli closed the nine months to September<br />
EBIT with a trading profit of €95 million, compared to<br />
€127 million for the same period in 2011. The negative<br />
impact of lower demand levels in Europe was partially<br />
offset by cost containment measures and efficiency gains achieved during the period.<br />
(1) -<br />
121 (152) 273<br />
(1)<br />
Trading profit (loss) plus result from investments and unusuals.<br />
(*)<br />
Net of eliminations.<br />
EBIT totaled €92 million for the period, compared to a negative €41 million for 2011, which included<br />
€153 million in unusual charges. Excluding unusual charges, EBIT for the nine months to September 2011 was<br />
€112 million.<br />
15<br />
Q3 <strong>2012</strong>
Teksid<br />
Teksid posted revenues of €183 million for the <strong>third</strong> <strong>quarter</strong>, down 20% over the same period in 2011. Lower<br />
volumes for the Cast Iron business unit (-20%) were partially offset by a 10% increase for the Aluminum<br />
business unit.<br />
Trading profit totaled €1 million, compared to €12 million for the same <strong>quarter</strong> in 2011. EBIT was €2 million<br />
compared to €12 million for Q3 2011.<br />
For the nine months to September, Teksid recorded revenues of €610 million, a 13% year-over-year decrease<br />
attributable to lower volumes for both the Cast Iron (-15%) and Aluminum (-7%) business units.<br />
Trading profit came in at €7 million, compared to €26 million for the same period in 2011.<br />
EBIT totaled €10 million, in line with the nine months to September 2011, which included €18 million in<br />
unusual charges.<br />
Comau<br />
For Q3 <strong>2012</strong>, Comau recorded revenues of €358 million, a 4% decrease over the prior year principally<br />
attributable to the Robotics operations. Order intake for the period totaled €374 million, representing a 46%<br />
increase over Q3 2011.<br />
Trading profit was €9 million for the <strong>quarter</strong>, up from €4 million for Q3 2011 primarily due to improved<br />
performance for the Body Welding operations.<br />
EBIT was €9 million, compared to €4 million for the same period in 2011.<br />
For the nine months to September, revenues came in at €1,080 million, an 8% year-over-year increase.<br />
Order intake for the period totaled €1,309 million, representing a 7% increase over the same period in 2011.<br />
At 30 September <strong>2012</strong>, the order backlog totaled €1,013 million, a 21% increase over year-end 2011,<br />
primarily attributable to the Body Welding activities.<br />
Comau closed the nine months to September with trading profit of €20 million, compared to €8 million for<br />
the corresponding period in 2011. EBIT was €19 million compared to a loss of €121 million for the nine<br />
months to September 2011, which included unusual charges of €129 million related to goodwill write-down.<br />
16<br />
Q3 <strong>2012</strong>
Significant events<br />
On July 3rd, <strong>Fiat</strong> notified VEBA of its intention to exercise the option to purchase a portion of VEBA’s<br />
ownership interest in Chrysler. That tranche represents approximately 3.3% of Chrysler’s outstanding<br />
equity. On September 26th, <strong>Fiat</strong> announced that <strong>Fiat</strong> North America (a wholly-owned subsidiary) was<br />
seeking a declaratory judgment from the Delaware Court of Chancery confirming the price to be paid for<br />
the stake, since the parties had not reached agreement on the purchase price. Upon completion of the<br />
purchase, <strong>Fiat</strong> will hold 61.8% of the outstanding equity in Chrysler.<br />
On July 16 th , <strong>Fiat</strong> issued a €600 million bond (fixed coupon 7.75% due October 2016). The notes – issued by<br />
<strong>Fiat</strong> Finance and Trade Ltd. S.A., a wholly-owned Group subsidiary, and guaranteed by <strong>Fiat</strong> S.p.A. under the<br />
GMTN Program – have been rated Ba3 by Moody’s, BB- by Standard & Poor’s and BB by Fitch.<br />
On July 25 th , the <strong>Fiat</strong> plant in Pomigliano D’Arco was awarded the prestigious “Automotive Lean Production<br />
<strong>2012</strong>” award in the OEM category, based on the evaluation of a committee of experts selected by the<br />
German magazine Automobil Produktion and a leading consultancy firm.<br />
On July 26 th , <strong>Fiat</strong> Group Automobiles S.p.A. (FGA) and PSA Peugeot Citroën signed an agreement for the<br />
transfer of FGA’s shareholding in the SevelNord joint venture to PSA Peugeot Citroën on or before<br />
December 31st, <strong>2012</strong>. SevelNord will continue to produce LCVs for the two groups until Euro 6 emissions<br />
standards come into effect at the end of 2016. The agreement does not impact on other co-operations<br />
between FGA and PSA Peugeot Citroën, including the Sevel joint-venture located in Val di Sangro (Italy),<br />
which will continue as per current contracts.<br />
On September 13 th , for the fourth consecutive year, <strong>Fiat</strong> S.p.A. was included in the Dow Jones Sustainability<br />
Indexes (DJSI) World and Europe, receiving a score of 91/100 compared to an overall average of 74/100 for<br />
companies in the Automobiles sector evaluated by SAM, the specialists in sustainability investing.<br />
Membership in the prestigious DJSI World and DJSI Europe equity indexes is limited to companies judged<br />
best-in-class in terms of their economic, as well as environmental and social performance.<br />
On September 19 th , Fitch Ratings confirmed its rating on <strong>Fiat</strong> S.p.A.’s long-term debt at “BB” and short-term<br />
at “B”. On October 10th, Moody’s Investors Service lowered the Corporate Family Rating of <strong>Fiat</strong> S.p.A. from<br />
“Ba2” to “Ba3” and consequently, according to their methodology, the rating on the notes issued by <strong>Fiat</strong><br />
Finance & Trade Ltd. S.A. and <strong>Fiat</strong> Finance North America, Inc. from “Ba3” to “B1”. The outlook is negative<br />
for both agencies.<br />
*****<br />
Pursuant to Articles 70 (8) and 71 (1-bis) of the Consob Issuer Regulations, the Board of Directors approved<br />
the opt-out from the obligation to publish an information document for significant transactions (e.g.,<br />
significant mergers, spin-offs, share capital increases by means of in-kind contributions of assets,<br />
acquisitions and disposals).<br />
17<br />
Q3 <strong>2012</strong>
<strong>2012</strong> Outlook<br />
Having reviewed economic and trading conditions in the Group’s four operating regions, <strong>Fiat</strong> confirms the<br />
expectations of performance in North America, Latin America and Asia-Pacific.<br />
Events of the past 12 months have reinforced our negative view of the development of the European<br />
markets. We see continuing weak trading conditions for the remainder of <strong>2012</strong> extending well into 2013 and<br />
at least part of 2014.<br />
As a result, the Group has refined earnings guidance for <strong>2012</strong> at the lower end of its original target range with<br />
net industrial debt expected to improve from Q3 level to approximately €6.5 billion:<br />
Revenues of about €83 billion;<br />
Trading profit in excess of €3.8 billion;<br />
Net profit in excess of €1.2 billion;<br />
Net industrial debt of approximately €6.5 billion.<br />
John Elkann Sergio Marchionne<br />
Chairman Chief Executive Officer<br />
*********<br />
The manager responsible for preparing the Company's financial reports, Richard Palmer, declares, pursuant to Article 154-bis (2) of<br />
Legislative Decree 58/98, that the accounting information contained in this press release corresponds to the <strong>results</strong> documented in the<br />
books, accounting and other records of the company.<br />
This press release, and in particular the section entitled “<strong>2012</strong> Outlook”, contains forward-looking statements. These statements are based on the Group’s<br />
current expectations and projections about future events and, by their nature, are subject to inherent risks and uncertainties. They relate to events and<br />
depend on circumstances that may or may not occur or exist in the future and, as such, undue reliance should not be placed on them. Actual <strong>results</strong> may<br />
differ materially from those expressed in such statements as a result of a variety of factors, including: volatility and deterioration of capital and financial<br />
markets, including further worsening of the Eurozone sovereign debt crisis, changes in commodity prices, changes in general economic conditions, economic<br />
growth and other changes in business conditions, weather, floods, earthquakes or other natural disasters, changes in government regulation (in each case,<br />
in Italy or abroad), production difficulties, including capacity and supply constraints and many other risks and uncertainties, most of which are outside of the<br />
Group’s control.<br />
The Board of Directors met today at the head<strong>quarter</strong>s of <strong>Fiat</strong> S.p.A in Turin, Italy.<br />
Turin, 30 October <strong>2012</strong><br />
On October 30, at 4 p.m. CET (3 p.m. GMT, 11 a.m. New York time), management will hold a conference call to review the <strong>2012</strong> <strong>third</strong> <strong>quarter</strong> <strong>results</strong> and<br />
present their views on the European market and the broad implications on its development plans for the future to financial analysts and institutional<br />
investors. The call can be followed live and a recording will be available later on the Group’s website: www.fiatspa.com. The supporting document will be<br />
made available on the website prior to the call.<br />
18<br />
Q3 <strong>2012</strong>
Consolidated Income Statement (*)<br />
Unaudited<br />
(€ million)<br />
3 rd Quarter<br />
<strong>2012</strong><br />
3 rd Quarter<br />
2011<br />
01/01-30/09<br />
<strong>2012</strong><br />
01/01-30/09<br />
2011 (**)<br />
Net revenues 20,437 17,552 62,182 39,915<br />
Cost of sales 17,314 14,806 52,949 33,866<br />
Selling, general and administrative costs 1,645 1,483 4,961 3,373<br />
Research and development costs 467 416 1,375 1,026<br />
Other income (expenses) (60) 4 (70) (23)<br />
TRADING PROFIT/(LOSS) 951 851 2,827 1,627<br />
Result from investments: 5 31 75 79<br />
Share of the profit/(loss) of investees accounted<br />
for using the equity method 5 31 62 93<br />
Other income (expenses) from investments - - 13 (14)<br />
Gains (losses) on the disposal of investments - - (91) 7<br />
Restructuring costs (4) 61 (39) 103<br />
Other unusual income (expenses) (80) 4 (80) 1,097<br />
EARNINGS BEFORE INTEREST AND TAXES (EBIT) 880 825 2,770 2,707<br />
Financial income (expenses) (399) (543) (1,237) (911)<br />
PROFIT/(LOSS) BEFORE TAXES 481 282 1,533 1,796<br />
Income taxes 195 170 510 410<br />
PROFIT/(LOSS) FROM CONTINUING OPERATIONS 286 112 1,023 1,386<br />
Post-tax profit/(loss) from Discontinued Operations - - - -<br />
PROFIT/(LOSS) FOR THE PERIOD 286 112 1,023 1,386<br />
PROFIT/(LOSS) FOR THE PERIOD ATTRIBUTABLE TO:<br />
Owners of the parent 39 (46) 246 1,291<br />
Non-controlling interests 247 158 777 95<br />
(*) Beginning <strong>2012</strong> the Group started assessing performance on the basis of Earnings before Interest and Taxes (EBIT) and has decided to report it<br />
as a separate line item in the income statement in place of Operating profit.<br />
(**) Amounts reported for the nine months to September 2011 include the consolidation of Chrysler from 1 June 2011.<br />
Translation of financial statements denominated in a currency other than the Euros<br />
The principal exchange rates used to translate into Euros the financial statements prepared in currencies other than<br />
Euros were as follows:<br />
01/01-30/09 <strong>2012</strong> At 31 December 2011 01/01-30/09 2011<br />
Average At 30 September Average At 30 September<br />
US Dollar 1.281 1.293 1.294 1.406 1.350<br />
Pound Sterling 0.812 0.798 0.835 0.871 0.867<br />
Swiss Franc 1.204 1.210 1.216 1.234 1.217<br />
Polish Zloty 4.209 4.104 4.458 4.021 4.405<br />
Brazilian Real 2.455 2.623 2.416 2.294 2.507<br />
Argentine Peso 5.713 6.061 5.561 5.744 5.677<br />
Serbian Dinar 112.846 114.599 104.858 101.916 100.989<br />
19
Consolidated statement of financial position<br />
Unaudited<br />
(€ million) At 30 September <strong>2012</strong> At 31 December 2011<br />
ASSETS<br />
Intangible assets 19,123 18,200<br />
Property, plant and equipment 21,772 20,785<br />
Investments and other financial assets: 2,286 2,660<br />
Investments accounted for using the equity method 1,504 1,579<br />
Other investments and financial assets 782 1,081<br />
Leased assets 3 45<br />
Defined benefit plan assets 106 97<br />
Deferred tax assets 1,671 1,690<br />
Total Non-current assets 44,961 43,477<br />
Inventories 10,009 9,123<br />
Trade receivables 3,009 2,625<br />
Receivables from financing activities 3,469 3,968<br />
Current tax receivables 382 369<br />
Other current assets 2,231 2,088<br />
Current financial assets: 713 789<br />
Current investments 31 33<br />
Current securities 209 199<br />
Other financial assets 473 557<br />
Cash and cash equivalents 16,851 17,526<br />
Total Current assets 36,664 36,488<br />
Assets held for sale 60 66<br />
TOTAL ASSETS 81,685 80,031<br />
Total assets adjusted for asset-backed financing transactions 81,405 79,321<br />
EQUITY AND LIABILITIES<br />
Equity: 12,963 12,260<br />
Equity attributable to owners of the parent 9,069 8,727<br />
Non-controlling interest 3,894 3,533<br />
Provisions: 15,432 15,624<br />
Employee benefits 6,746 7,026<br />
Other provisions 8,686 8,598<br />
Debt: 26,818 26,772<br />
Asset-backed financing 280 710<br />
Other debt 26,538 26,062<br />
Other financial liabilities 263 429<br />
Trade payables 16,879 16,418<br />
Current tax payables 395 230<br />
Deferred tax liabilities 775 760<br />
Other current liabilities 8,160 7,538<br />
Liabilities held for sale - -<br />
TOTAL EQUITY AND LIABILITIES 81,685 80,031<br />
Total equity and liabilities adjusted for asset-backed financing transactions 81,405 79,321<br />
20
Consolidated Statement of Cash Flows<br />
Unaudited<br />
(€ million)<br />
01/01-30/09<br />
<strong>2012</strong><br />
01/01-30/09<br />
2011 (*)<br />
A) CASH AND CASH EQUIVALENTS AT BEGINNING OF PERIOD 17,526 11,967<br />
B) CASH FLOWS FROM (USED IN) OPERATING ACTIVITIES DURING THE PERIOD:<br />
Profit/(loss) for the period 1,023 1,386<br />
Amortisation and depreciation 3,105 2,308<br />
(Gains) losses from disposal of non-current assets 108 (3)<br />
Other non-cash items (a) (32) (1,140)<br />
Dividends received 69 81<br />
Change in provisions (222) 68<br />
Change in deferred income taxes (11) (21)<br />
Change in items due to buy-back commitments (b) 16 34<br />
Change in operating lease items (8) (28)<br />
Change in working capital 116 (303)<br />
TOTAL 4,164 2,382<br />
C) CASH FLOWS FROM (USED IN) INVESTMENT ACTIVITIES:<br />
Investments in:<br />
Property, plant and equipment and intangible assets (5,278) (3,070)<br />
Investments in subsidiaries and other equity investments (14) (121)<br />
Cash and cash equivalents from consolidation of Chrysler, net of consideration paid for<br />
the additional 16% ownership interest - 5,624<br />
Proceeds from the sale of non-current assets 103 314<br />
Net change in receivables from financing activities 309 (879)<br />
Change in other current securities (14) (16)<br />
Other changes (7) (54)<br />
TOTAL (4,901) 1,798<br />
D) CASH FLOWS FROM (USED IN) FINANCING ACTIVITIES:<br />
Issuance of bonds 1,803 2,500<br />
Repayment of bonds (1,250) (1,325)<br />
Issuance of medium-term borrowings 1,062 1,697<br />
Repayment of medium-term borrowings (1,060) (3,576)<br />
Changes in net financial receivables from <strong>Fiat</strong> Industrial group - 2,761<br />
Net change in other financial payables and other financial assets/liabilities (300) 55<br />
Capital increase 20 7<br />
Dividends paid (58) (175)<br />
(Purchase)/sale of ownership interests in subsidiaries - (438)<br />
TOTAL 217 1,506<br />
Translation exchange differences (155) 201<br />
E) TOTAL CHANGE IN CASH AND CASH EQUIVALENTS (675) 5,887<br />
F) CASH AND CASH EQUIVALENTS 16,851 17,854<br />
of which: cash and cash equivalents included in Assets held for sale and Discontinued<br />
Operations - 1<br />
G) CASH AND CASH EQUIVALENTS AT END OF PERIOD (20) 16,851 17,853<br />
(*) Cash flows for the first-half 2011 include the consolidation of Chrysler from 1 June 2011.<br />
(a) For the nine months to September 2011, the item includes reversal of the €2,017 million net gain recognized in relation to the Chrysler transaction<br />
and reversal of unusual non-cash expense items. For the nine months to September <strong>2012</strong>, the item includes reversal of a €30 million gain<br />
(€115 million loss for the nine months to September 2011) in the fair value of equity swaps on a basket of <strong>Fiat</strong> S.p.A. and <strong>Fiat</strong> Industrial S.p.A.<br />
ordinary shares.<br />
(b) Cash from vehicles sold under buy-back commitments for the periods reported above, net of amounts already recognized through profit and loss,<br />
is included in a separate line item under operating activities, which also includes change in working capital.<br />
21


