socio-economic index for areas (seifa) - City of Greater Geelong
socio-economic index for areas (seifa) - City of Greater Geelong
socio-economic index for areas (seifa) - City of Greater Geelong

You also want an ePaper? Increase the reach of your titles
YUMPU automatically turns print PDFs into web optimized ePapers that Google loves.
Socio-<strong>economic</strong> Index<br />
<strong>for</strong> Areas (SEIFA)<br />
in this section<br />
> Socio-Economic Index <strong>for</strong> Areas (SEIFA)<br />
- Barwon Region 2006<br />
> <strong>City</strong> <strong>of</strong> <strong>Greater</strong> <strong>Geelong</strong> - Index <strong>of</strong> Relative<br />
Disadvantage Map<br />
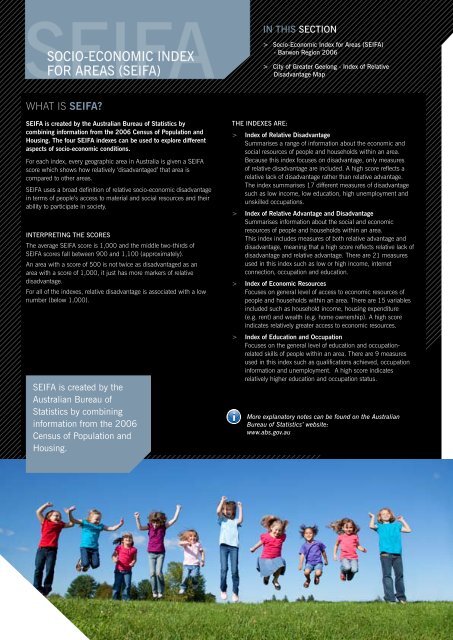
What is SEIFA?<br />
SEIFA is created by the Australian Bureau <strong>of</strong> Statistics by<br />
combining in<strong>for</strong>mation from the 2006 Census <strong>of</strong> Population and<br />
Housing. The four SEIFA <strong>index</strong>es can be used to explore different<br />
aspects <strong>of</strong> <strong>socio</strong>-<strong>economic</strong> conditions.<br />
For each <strong>index</strong>, every geographic area in Australia is given a SEIFA<br />
score which shows how relatively ‘disadvantaged’ that area is<br />
compared to other <strong>areas</strong>.<br />
SEIFA uses a broad definition <strong>of</strong> relative <strong>socio</strong>-<strong>economic</strong> disadvantage<br />
in terms <strong>of</strong> people’s access to material and social resources and their<br />
ability to participate in society.<br />
Interpreting the Scores<br />
The average SEIFA score is 1,000 and the middle two-thirds <strong>of</strong><br />
SEIFA scores fall between 900 and 1,100 (approximately).<br />
An area with a score <strong>of</strong> 500 is not twice as disadvantaged as an<br />
area with a score <strong>of</strong> 1,000, it just has more markers <strong>of</strong> relative<br />
disadvantage.<br />
For all <strong>of</strong> the <strong>index</strong>es, relative disadvantage is associated with a low<br />
number (below 1,000).<br />
SEIFA is created by the<br />
Australian Bureau <strong>of</strong><br />
Statistics by combining<br />
in<strong>for</strong>mation from the 2006<br />
Census <strong>of</strong> Population and<br />
Housing.<br />
The <strong>index</strong>es are:<br />
> Index <strong>of</strong> Relative Disadvantage<br />
Summarises a range <strong>of</strong> in<strong>for</strong>mation about the <strong>economic</strong> and<br />
social resources <strong>of</strong> people and households within an area.<br />
Because this <strong>index</strong> focuses on disadvantage, only measures<br />
<strong>of</strong> relative disadvantage are included. A high score reflects a<br />
relative lack <strong>of</strong> disadvantage rather than relative advantage.<br />
The <strong>index</strong> summarises 17 different measures <strong>of</strong> disadvantage<br />
such as low income, low education, high unemployment and<br />
unskilled occupations.<br />
> Index <strong>of</strong> Relative Advantage and Disadvantage<br />
Summarises in<strong>for</strong>mation about the social and <strong>economic</strong><br />
resources <strong>of</strong> people and households within an area.<br />
This <strong>index</strong> includes measures <strong>of</strong> both relative advantage and<br />
disadvantage, meaning that a high score reflects relative lack <strong>of</strong><br />
disadvantage and relative advantage. There are 21 measures<br />
used in this <strong>index</strong> such as low or high income, internet<br />
connection, occupation and education.<br />
> Index <strong>of</strong> Economic Resources<br />
Focuses on general level <strong>of</strong> access to <strong>economic</strong> resources <strong>of</strong><br />
people and households within an area. There are 15 variables<br />
included such as household income, housing expenditure<br />
(e.g. rent) and wealth (e.g. home ownership). A high score<br />
indicates relatively greater access to <strong>economic</strong> resources.<br />
> Index <strong>of</strong> Education and Occupation<br />
Focuses on the general level <strong>of</strong> education and occupationrelated<br />
skills <strong>of</strong> people within an area. There are 9 measures<br />
used in this <strong>index</strong> such as qualifications achieved, occupation<br />
in<strong>for</strong>mation and unemployment. A high score indicates<br />
relatively higher education and occupation status.<br />
More explanatory notes can be found on the Australian<br />
Bureau <strong>of</strong> Statistics’ website:<br />
www.abs.gov.au
<strong>seifa</strong><br />
Socio-Economic Index <strong>for</strong> Areas (SEIFA) - Barwon Region 2006<br />
SUBURBS & TOWNSHIPS<br />
Population<br />
2006<br />
Disadvantage<br />
Index<br />
Advantage &<br />
Disadvantage Index<br />
Economic<br />
Resources Index<br />
Education &<br />
Occupation Index<br />
CITY OF GREATER GEELONG<br />
Urban <strong>Geelong</strong><br />
Bell Park 4,654 913 903 937 891<br />
Bell Post Hill 4,921 967 937 980 915<br />
Belmont 13,657 992 972 950 990<br />
Breakwater 1,052 904 884 890 876<br />
Corio 14,929 875 861 885 841<br />
Drumcondra 598 1,085 1,094 1,074 1,079<br />
East <strong>Geelong</strong> 3,835 1,012 1,008 969 1,038<br />
Fyans<strong>for</strong>d 171 1,042 1,013 1,019 1,049<br />
<strong>Geelong</strong> <strong>City</strong> 4,358 1,025 1,039 984 1,071<br />
<strong>Geelong</strong> West 6,311 994 999 941 1,041<br />
Grovedale 13,182 1,016 986 997 962<br />
Hamlyn Heights 5,842 996 970 972 959<br />
Herne Hill 3,270 949 927 903 939<br />
Highton 14,487 1,076 1,066 1,050 1,063<br />
Lara 12,847 1,039 1,009 1,032 966<br />
Leopold 8,743 1,054 1,013 1,041 963<br />
Lovely Banks 1,545 1,026 981 1,043 914<br />
Manifold Heights 2,549 1,019 1,005 972 1,039<br />
Marshall 1,402 973 926 963 924<br />
Moolap 1,243 1,028 987 1,017 940<br />
Mount Duneed 984 1,092 1,076 1,093 1,074<br />
Newcomb 4,511 918 894 909 891<br />
Newtown 9,591 1,058 1,063 1,017 1,093<br />
Norlane 7,943 771 788 796 807<br />
North <strong>Geelong</strong> 2,673 928 933 913 956<br />
North Shore 319 938 919 924 914<br />
Rippleside 353 1,090 1,071 1,032 1,085<br />
South <strong>Geelong</strong> 857 1,022 1,018 959 1,040<br />
St Albans Park 4,693 990 949 1,000 894<br />
Thomson 1,607 839 844 821 881<br />
Wandana Heights 1,828 1,113 1,115 1,105 1,090<br />
Waurn Ponds 3,367 1,091 1,072 1,080 1,037<br />
Whittington 4,056 823 825 834 831<br />
Rural <strong>Geelong</strong><br />
Anakie 675 1,050 1,011 1,060 988<br />
Balliang 233 1,036 993 1,037 1,015<br />
Barwon Heads 2,994 1,064 1,050 1,023 1,080<br />
Bates<strong>for</strong>d 885 1,091 1,079 1,111 1,028<br />
Breamlea 244 1,055 1,053 1,017 1,096<br />
Clifton Springs 7,054 1,018 982 1,005 956<br />
Connewarre 78 1,143 1,170 1,184 1,105<br />
Curlewis 399 1,104 1,080 1,101 1,075<br />
Drysdale 3,741 1,027 991 1,013 972<br />
Indented Head 590 976 957 967 967<br />
Little River 875 1,043 1,015 1,069 968<br />
Marcus Hill 277 1,070 1,034 1,083 1,044<br />
Ocean Grove 11,278 1,051 1,032 1,020 1,029<br />
Portarlington 3,020 970 939 966 943<br />
St Leonards 1,627 943 914 952 923<br />
Wallington 1,355 1,089 1,074 1,103 1,051<br />
Source: Australian Bureau <strong>of</strong> Statistics, Socio-<strong>economic</strong> Index <strong>for</strong> Areas (SEIFA) 2006 (catalogue no. 2033.90.55.001). – Data not available<br />
*Totals based on suburbs and townships are not possible as in some cases they cross municipal boundaries. Indexes are not available <strong>for</strong> <strong>areas</strong> larger than postal <strong>areas</strong>.
<strong>seifa</strong><br />
Socio-Economic Index <strong>for</strong> Areas (SEIFA) - Barwon Region 2006 (continued)<br />
SUBURBS & TOWNSHIPS<br />
Population<br />
2006<br />
Disadvantage<br />
Index<br />
Advantage &<br />
Disadvantage Index<br />
Source: Australian Bureau <strong>of</strong> Statistics, Socio-<strong>economic</strong> Index <strong>for</strong> Areas (SEIFA) 2006 (catalogue no. 2033.90.55.001). – Data not available<br />
*Totals based on suburbs and townships are not possible as in some cases they cross municipal boundaries.<br />
Indexes are not available <strong>for</strong> <strong>areas</strong> larger than postal <strong>areas</strong>.<br />
Economic<br />
Resources Index<br />
Education &<br />
Occupation Index<br />
SURF COAST SHIRE<br />
Aireys Inlet 753 1,066 1,046 1,027 1,098<br />
Anglesea 2,296 1,043 1,022 1,003 1,042<br />
Bellbrae 1,391 1,110 1,095 1,108 1,111<br />
Deans Marsh 631 1,031 986 1,026 1,055<br />
Fairhaven 294 1,079 1,048 1,035 1,101<br />
Freshwater Creek 557 1,074 1,052 1,083 1,064<br />
Gherang 592 1,082 1,026 1,074 1,031<br />
Gnarwarre 834 1,092 1,063 1,103 1,045<br />
Jan Juc 3,153 1,094 1,083 1,052 1,108<br />
Lorne 970 1,045 1,025 1,033 1,045<br />
Moggs Creek 100 1,104 1,097 1,031 1,162<br />
Moriac 594 1,095 1,049 1,092 1,014<br />
Torquay 6,706 1,072 1,063 1,049 1,051<br />
Winchelsea 1,915 955 922 957 928<br />
Winchelsea South 295 1,100 1,038 1,092 1,075<br />
BOROUGH OF QUEENSCLIFFE<br />
Point Lonsdale 2,482 1,061 1,046 1,015 1,094<br />
Queenscliff 1,413 1,050 1,039 1,024 1,078<br />
GOLDEN PLAINS SHIRE<br />
Bannockburn 2,484 1,048 1,006 1,062 950<br />
Berringa 258 972 923 974 948<br />
Cambrian Hill 465 1,014 957 997 951<br />
Dereel 670 984 944 994 972<br />
Enfield 361 984 926 974 891<br />
Haddon 1,112 1,021 974 1,039 937<br />
Inverleigh 1,252 1,040 986 1,033 981<br />
Lethbridge 894 1,020 981 1,037 935<br />
Linton 1,119 957 924 952 940<br />
Meredith 675 1,012 967 1,016 992<br />
Napoleans 498 1,051 1,005 1,041 1,034<br />
Rokewood 244 984 929 986 1,017<br />
Ross Creek 566 1,052 979 1,049 936<br />
Scarsdale 1,423 973 929 973 919<br />
Smythes Creek 1,391 1,049 997 1,060 962<br />
Smythesdale 531 966 920 979 898<br />
Stonehaven 267 1,074 1,038 1,076 1,060<br />
Sutherlands Creek 243 1,070 1,037 1,080 1,070<br />
Teesdale 1,459 1,041 988 1,056 942<br />
Wallinduc 164 1,061 1,005 1,091 1,080
<strong>seifa</strong><br />
Socio-Economic Index <strong>for</strong> Areas (SEIFA) - Barwon Region 2006 (continued)<br />
SUBURBS & TOWNSHIPS<br />
COLAC OTWAY SHIRE<br />
Population<br />
2006<br />
Disadvantage<br />
Index<br />
Advantage &<br />
Disadvantage Index<br />
Economic<br />
Resources Index<br />
Education &<br />
Occupation Index<br />
Apollo Bay 1,781 1,002 967 985 989<br />
Barongarook 576 805 893 1,039 961<br />
Barongarook West 457 1,032 983 1,035 993<br />
Barwon Downs 168 993 937 1,011 1,034<br />
Beeac 203 941 912 967 893<br />
Birregurra 683 994 955 988 990<br />
Bungador 189 992 963 1,007 1,047<br />
Carlisle River 366 973 946 997 984<br />
Colac 8,797 930 898 925 897<br />
Colac West 443 993 946 1,002 959<br />
Cororooke - - - - -<br />
Cressy 123 818 810 880 826<br />
Dreeite 215 982 926 1,028 977<br />
Elliminyt 2,062 1,025 980 1,037 944<br />
Forrest 170 956 931 942 946<br />
Gellibrand 145 1,021 982 1,014 1,031<br />
Irrewarra 844 1,023 965 1,042 1,005<br />
Irrewillipe 420 1,026 961 1,055 1,007<br />
Kawarren 235 987 942 980 1,004<br />
Larpent 216 1,027 972 1,077 980<br />
Lavers Hill 208 1,044 992 1,042 1,051<br />
Marengo 211 1,018 1,002 1,020 1,014<br />
Nalangil 453 1,003 943 1,015 961<br />
Ombersley 91 1,036 974 1,024 1,080<br />
Skenes Creek 122 1,007 966 950 1,048<br />
Warrion 522 945 911 981 965<br />
Wye River 144 1,039 1,000 1,025 1,020<br />
Yeodene 453 1,055 1,013 1,051 1,064<br />
Source: Australian Bureau <strong>of</strong> Statistics, Socio-<strong>economic</strong> Index <strong>for</strong> Areas (SEIFA) 2006 (catalogue no. 2033.90.55.001). – Data not available<br />
*Totals based on suburbs and townships are not possible as in some cases they cross municipal boundaries. Indexes are not available <strong>for</strong> <strong>areas</strong> larger than postal <strong>areas</strong>.
<strong>seifa</strong><br />
Socio-Economic Index <strong>for</strong> Areas (SEIFA) - Barwon Region 2006 (continued)<br />
STASTISTICAL LOCAL AREAS<br />
Population<br />
2006<br />
Disadvantage<br />
Index<br />
Advantage &<br />
Disadvantage Index<br />
Economic<br />
Resources Index<br />
Education &<br />
Occupation Index<br />
CITY OF GREATER GEELONG<br />
<strong>Greater</strong> <strong>Geelong</strong> Part A<br />
Bellarine Inner 23,246 972 942 969 911<br />
Corio Inner 54,939 929 913 935 894<br />
<strong>Geelong</strong> 11,372 982 984 944 1,012<br />
<strong>Geelong</strong> West 13,664 993 990 944 1,022<br />
Newtown 9,591 1,058 1,063 1,017 1,093<br />
South Barwon Inner 48,211 1,035 1,016 1,009 1,011<br />
<strong>Greater</strong> <strong>Geelong</strong> Pt B 33,535 1,032 1,007 1,013 1,001<br />
<strong>Greater</strong> <strong>Geelong</strong> Pt C 2,951 1,042 1,010 1,060 984<br />
Total <strong>City</strong> <strong>of</strong> <strong>Greater</strong> <strong>Geelong</strong> 197,509 993 976 977 970<br />
SURF COAST SHIRE<br />
Surf Coast - East 13,202 1,083 1,070 1,062 1,067<br />
Surf Coast - West 8,575 1,037 1,008 1,019 1,034<br />
Total Surf Coast Shire 21,777 1,065 1,046 1,045 1,054<br />
BOROUGH OF QUEENSCLIFFE 3,017 1,049 1,040 1,012 1,093<br />
GOLDEN PLAINS SHIRE<br />
Golden Plains - North West 7,444 1,011 961 1,014 947<br />
Golden Plains - South East 9,008 1,038 994 1,048 971<br />
Total Golden Plains Shire 16,452 1,025 979 1,033 960<br />
COLAC OTWAY SHIRE<br />
Colac Otway - Colac 10,859 948 913 946 906<br />
Colac Otway - North 6,056 982 947 1,019 987<br />
Colac Otway - South 3,382 1,002 967 991 998<br />
Total Colac Otway Shire 20,297 967 932 975 945<br />
LOCAL GOVERNMENT AREAS<br />
<strong>City</strong> <strong>of</strong> <strong>Greater</strong> <strong>Geelong</strong> 197,509 993 976 977 970<br />
Surf Coast Shire 21,777 1,065 1,046 1,045 1,054<br />
Borough <strong>of</strong> Queenscliffe 3,017 1,049 1,040 1,012 1,093<br />
Golden Plains Shire 16,452 1,025 979 1,033 960<br />
Colac Otway Shire 20,297 967 932 975 945<br />
<strong>City</strong> <strong>of</strong> Melbourne (VIC) 71,380 1049 1120 962 1190<br />
<strong>City</strong> <strong>of</strong> Hume (VIC) 147,781 958 965 999 924<br />
<strong>City</strong> <strong>of</strong> Ballarat (VIC) 85,195 983 965 958 975<br />
<strong>City</strong> <strong>of</strong> Wollongong (NSW) 184,213 991 984 979 981<br />
<strong>City</strong> <strong>of</strong> Newcastle (NSW) 141,753 983 989 961 997<br />
Source: Australian Bureau <strong>of</strong> Statistics, Socio-<strong>economic</strong> Index <strong>for</strong> Areas (SEIFA) 2006 (catalogue no. 2033.90.55.001). – Data not available<br />
*Totals based on suburbs and townships are not possible as in some cases they cross municipal boundaries.<br />
Indexes are not available <strong>for</strong> <strong>areas</strong> larger than postal <strong>areas</strong>.
<strong>seifa</strong><br />
<strong>socio</strong>-<strong>economic</strong> <strong>index</strong> <strong>for</strong> <strong>areas</strong> (<strong>seifa</strong>) 2006<br />
city <strong>of</strong> greater geelong<br />
INDEX OF RELATIVE DISADVANTAGE<br />
MOORABOOL<br />
SHIRE<br />
Staughton<br />
Vale<br />
Balliiang<br />
Disadvantage Index<br />
Little River<br />
Relatively greater<br />
disadvantage<br />
No data available<br />
700 -799<br />
800 - 899<br />
900 - 999<br />
1,000 - 1,099<br />
1,100 +<br />
mean line<br />
Anakie<br />
Lara<br />
Point<br />
Wilson<br />
Lovely Banks<br />
GOLDEN<br />
Moorabool<br />
Avalon<br />
PLAINS<br />
Corio<br />
SHIRE<br />
Ceres<br />
Bates<strong>for</strong>d<br />
Fyans<strong>for</strong>d<br />
Waurn<br />
Ponds<br />
Mount<br />
Duneed<br />
Bell Post<br />
Hill<br />
Bell<br />
Park<br />
Hamlyn<br />
Heights<br />
<strong>Geelong</strong><br />
West<br />
Belmont<br />
North<br />
<strong>Geelong</strong><br />
North<br />
Shore<br />
CORIO<br />
BAY<br />
Newtown<br />
East<br />
<strong>Geelong</strong><br />
Highton<br />
Sth<br />
Newcomb<br />
<strong>Geelong</strong><br />
Grovedale<br />
Norlane<br />
GEELONG<br />
Marshall<br />
Whittington<br />
St Albans<br />
Park<br />
Moolap<br />
Leopold<br />
Curlewis<br />
Wallington<br />
Clifton<br />
Springs<br />
Marcus<br />
Hill<br />
Drysdale<br />
Bellarine<br />
Mannerim<br />
Portarlington<br />
Swan Bay<br />
St Leonards<br />
Indented<br />
Head<br />
SURF COAST SHIRE<br />
Connewarre<br />
Barwon<br />
Heads<br />
Ocean Grove<br />
Point<br />
Lonsdale<br />
BOROUGH OF<br />
QUEENSCLIFF<br />
Breamlea<br />
Source: Australian Bureau <strong>of</strong> Statistics.