A Socioeconomic Survey of New England Lobster Fishermen
A Socioeconomic Survey of New England Lobster Fishermen
A Socioeconomic Survey of New England Lobster Fishermen

You also want an ePaper? Increase the reach of your titles
YUMPU automatically turns print PDFs into web optimized ePapers that Google loves.
Taking the Pulse <strong>of</strong> the <strong>Lobster</strong> Industry:<br />
A <strong>Socioeconomic</strong> <strong>Survey</strong> <strong>of</strong><br />
<strong>New</strong> <strong>England</strong> <strong>Lobster</strong> <strong>Fishermen</strong>
ACKNOWLEDGEMENTS<br />
This project was the result <strong>of</strong> many individuals who shared their ideas, provided sound advice, and guided<br />
the efforts <strong>of</strong> Gulf <strong>of</strong> Maine Research Institute. We would particularly like to acknowledge Jason Maurice <strong>of</strong><br />
Market Decisions, LLC who remained flexible to our needs and extremely engaged in the project from inception<br />
to final product. An exceptional member <strong>of</strong> the Steering Committee for this project was Eric Thunberg <strong>of</strong><br />
the Northeast Fisheries Science Center, NOAA Fisheries. Eric conducted much <strong>of</strong> the analysis and generated<br />
many <strong>of</strong> the tables that are presented in this report. We greatly appreciated his patience, his support, and the<br />
time that he was able to give to this project. Kristen (Togue) Brawn provided research support for this project<br />
along the way and her contribution was much appreciated.<br />
Our deepest gratitude is toward the lobster fishing community <strong>of</strong> <strong>New</strong> <strong>England</strong>. Members <strong>of</strong> the Steering<br />
Committee who represented the interests <strong>of</strong> the lobster community were thoughtful and supportive in their<br />
engagement with this project. Indeed, without the openness <strong>of</strong> the lobster fishing community to share their<br />
information, this project would not have been possible. Thank you!<br />
Funding for this project was provided by the National Marine Fisheries Service (NOAA Fisheries<br />
Service), Northeast Cooperative Research Partners Program (NCRPP). Initiated in 1999, the<br />
goals <strong>of</strong> this program are to enhance the data upon which fishery management decisions are made<br />
as well as to improve communication and collaboration among commercial fishery participants,<br />
scientists, and fishery managers. NOAA Fisheries Service works in close collaboration with the<br />
<strong>New</strong> <strong>England</strong> Fishery Management Council’s Research Steering Committee to set research priorities<br />
to meet management information needs.<br />
For further information on the Cooperative Research Partners Program please contact:<br />
National Marine Fisheries Service (NOAA Fisheries Service)<br />
Northeast Cooperative Research Partners Program<br />
(978) 281-9276 – Northeast Fisheries Science Center, Cooperative Research Office, Gloucester<br />
(401) 782-3323 – Northeast Fisheries Science Center, Cooperative Research Office, Narragansett Laboratory<br />
www.nero.noaa.gov/StateFedOff/coopresearch/<br />
2<br />
Editors: Laura Taylor Singer and Daniel S. Holland, Design by Petri Tuohimaa<br />
Copyright © 2008 Gulf <strong>of</strong> Maine Research Institute - www.gmri.org
Table <strong>of</strong> Contents<br />
About This Report ............................................................................................................................................... 5<br />
Why We Conducted This <strong>Survey</strong> ....................................................................................................................... 7<br />
What Information was Collected ........................................................................................................................ 9<br />
How the <strong>Survey</strong> was Conducted ......................................................................................................................... 13<br />
What We Learned - Key Findings <strong>of</strong> the <strong>Survey</strong> ................................................................................................ 15<br />
The “Average” Active <strong>Lobster</strong>man in <strong>New</strong> <strong>England</strong> ............................................................................. 15<br />
Traps to Pounds to Dollars: What was the Scale <strong>of</strong> 2005 <strong>Lobster</strong> Operations in <strong>New</strong> <strong>England</strong>?.. 17<br />
The “Average” <strong>Lobster</strong> Business for Active <strong>Lobster</strong>men in <strong>New</strong> <strong>England</strong> ............................................ 23<br />
How are <strong>Lobster</strong> Businesses Financed? ........................................................................................... 25<br />
How Vulnerable are <strong>Lobster</strong> Fishing Families to a Potential Drop in Landings?................................. 27<br />
Are there other fishing opportunities? ............................................................................................ 30<br />
What other job skills and/or training do <strong>New</strong> <strong>England</strong> lobstermen have? ................................... 30<br />
Do <strong>New</strong> <strong>England</strong> lobstermen have plans for retirement? .............................................................. 31<br />
Do lobstermen and their families have health coverage? ............................................................... 32<br />
Traditional Fishing Families: Are younger generations preparing to enter the lobster fishery? .. 32<br />
Summary and Conclusions ................................................................................................................................. 33<br />
Appendix .............................................................................................................................................................. 35<br />
Inactive <strong>Lobster</strong>men ................................................................................................................................ 35<br />
References ................................................................................................................................................ 35<br />
3
About This Report<br />
In the summer <strong>of</strong> 2005, the Gulf <strong>of</strong> Maine Research<br />
Institute (GMRI) initiated a project to collect baseline<br />
socioeconomic data on the <strong>New</strong> <strong>England</strong> lobster<br />
industry through a telephone survey. GMRI<br />
contracted Market Decisions, LLC, a market research<br />
firm based in Portland, Maine, to administer<br />
the survey. A Project Steering Committee was convened<br />
to help develop the survey and ensure collection<br />
<strong>of</strong> the most accurate and meaningful data.<br />
The Project Steering Committee consisted <strong>of</strong> federal<br />
and state (ME, MA, NH, RI) managers, as well as<br />
members <strong>of</strong> the Maine <strong>Lobster</strong>men’s Association,<br />
Massachusetts <strong>Lobster</strong>men’s Association, Atlantic<br />
Offshore <strong>Lobster</strong>men’s Association, and the South<br />
Shore <strong>Lobster</strong>men’s Association. The Project Steering<br />
Committee helped publicize the project with<br />
their constituents, and also assisted with overall<br />
outreach and interpretation <strong>of</strong> the final results.<br />
Project Steering Committee<br />
• Eric Thunberg, National Marine Fisheries Service,<br />
Northeast Fisheries Science Center<br />
• Bonnie Spinazzola, Atlantic Offshore <strong>Lobster</strong>men’s<br />
Association<br />
• Patrice McCarron, Maine <strong>Lobster</strong>men’s Association<br />
• Terry Stockwell and Sarah Cotnoir, Maine Department<br />
<strong>of</strong> Marine Resources<br />
• Dan McKiernan, Massachusetts Division <strong>of</strong> Marine<br />
Fisheries<br />
• Patricia Pinto Da Silva, National Marine Fisheries Service,<br />
Northeast Fisheries Science Center<br />
• Cheri Patterson, <strong>New</strong> Hampshire Fish and Game<br />
• Thomas Angell, Rhode Island Division <strong>of</strong> Fish and<br />
Wildlife<br />
• David Casoni and Bill Adler, Massachusetts <strong>Lobster</strong>men’s<br />
Association<br />
• Clare Grindal, Downeast <strong>Lobster</strong>men’s Association<br />
• Fred Dauphinee, South Shore Lobtermen’s Association<br />
This summary document provides an overview <strong>of</strong><br />
the survey results for the <strong>New</strong> <strong>England</strong> <strong>Lobster</strong> <strong>Socioeconomic</strong><br />
<strong>Survey</strong>. Although this survey sought baseline<br />
data in a broad range <strong>of</strong> areas, two areas were <strong>of</strong><br />
particular interest to the Steering Committee: vulnerability<br />
and effort. Throughout this report, information<br />
concerning these two areas will be highlighted.<br />
It should be noted that all data presented here<br />
are in aggregate form. Those interested in learning<br />
more about the results <strong>of</strong> the survey are encouraged<br />
to review the entire report produced by Market Decisions,<br />
LLC, available through the Gulf <strong>of</strong> Maine<br />
Research Institute. However, all individual responses<br />
to the survey are confidential. No one outside <strong>of</strong><br />
the market research firm who conducted the phone<br />
interviews has access to individual responses.<br />
The original survey targeted responses from 12 areas<br />
(described on page 13). To facilitate use <strong>of</strong> these<br />
survey results in management, most data in this report<br />
is presented by <strong>Lobster</strong> Conservation Management<br />
Area (LCMA). LCMA 1 is divided into ME<br />
and NH/MA. In some instances, Maine information<br />
is broken down further into three areas: Downeast<br />
5
About This Report<br />
6<br />
(zones ABC), Midcoast (zones DE), and Southern<br />
Coast (zones FG). Due to the differences inherent<br />
in lobstering in LCMA 3 which is further <strong>of</strong>fshore,<br />
responses for LCMA 3 will be given separately in<br />
several instances.<br />
This report focuses on responses <strong>of</strong> active lobstermen<br />
(For the purpose <strong>of</strong> this report, active lobstermen<br />
are defined as those landing greater than 1000<br />
pounds). General characteristics <strong>of</strong> all respondents<br />
who landed less than 1000 pounds <strong>of</strong> lobster in<br />
2005 can be found in the Appendix.<br />
The <strong>New</strong> <strong>England</strong> <strong>Lobster</strong> <strong>Socioeconomic</strong> <strong>Survey</strong> addresses<br />
the need for comprehensive socioeconomic<br />
data in the <strong>New</strong> <strong>England</strong> lobster industry. A great<br />
deal <strong>of</strong> valuable information was collected through<br />
this survey. It is hoped that fishermen, managers,<br />
and others will use this information to anticipate<br />
the socioeconomic impacts <strong>of</strong> changes in lobster<br />
policy and to facilitate sound management throughout<br />
the <strong>New</strong> <strong>England</strong> lobster fishery. This survey<br />
provides baseline information on the lobster fishery,<br />
but future surveys will be useful to gauge the<br />
changes in the industry over time.
Why We Conducted This <strong>Survey</strong><br />
American lobster is the most valuable fishery in<br />
the northeastern United States. Northern <strong>New</strong><br />
<strong>England</strong>’s lobster landings have continued to grow<br />
over the past fifteen years, with nearly every year<br />
surpassing the last. In 2006, reported lobster landings<br />
for Maine, <strong>New</strong> Hampshire and Massachusetts<br />
were over 86 million pounds with a landed value<br />
<strong>of</strong> $363 million. As each year goes by, scientists,<br />
regulators and fishermen become more concerned<br />
that record setting lobster landings may not continue.<br />
Landings in Southern <strong>New</strong> <strong>England</strong> peaked<br />
several years ago and have declined substantially<br />
since. Rhode Island landings peaked at 7.4 million<br />
pounds in 1991 and had<br />
fallen to less than 3.8 million<br />
pounds by 2006 while landings<br />
in Connecticut fell from<br />
a peak <strong>of</strong> 3.5 million pounds<br />
in 1997 to 792 thousand<br />
pounds in 2006.<br />
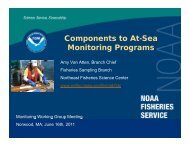
<strong>Lobster</strong> landings have risen<br />
and fallen over the course <strong>of</strong><br />
the fishery’s history, and current<br />
conditions represent an<br />
atypical apex in the landings<br />
trend (Figure 1). Despite<br />
current record lobster landings,<br />
some scientists have<br />
predicted the potential for<br />
a down-turn in landings on<br />
numerous occasions.<br />
Pounds (millions)<br />
The 2005 peer-reviewed stock assessment report<br />
for American lobster indicates the health <strong>of</strong> the resource<br />
is variable. Throughout most <strong>of</strong> the Gulf <strong>of</strong><br />
Maine (GOM) and Georges Bank (GBK), the stock<br />
abundance is stable and recent mortality rates are<br />
sustainable. However, the report cautions for both<br />
GOM and GBK stocks “effort indicators are negative.”<br />
The report goes on to suggest: “This high effort<br />
is concurrent with high stock abundance, and<br />
is not likely to be supportable if abundance returns<br />
to median levels.” (http://www.nefsc.noaa.gov/sos/<br />
spsyn/iv/lobster/)<br />
Year<br />
Figure 1: Landings data for ME, NH, MA, CT and RI from 1950-2006<br />
(http://www.st.nmfs.noaa.gov/st1/commercial/landings/annual_landings.html)<br />
7
8<br />
Why We Conducted This <strong>Survey</strong><br />
In Southern <strong>New</strong> <strong>England</strong> (SNE) the lobster resource<br />
is estimated to be at low abundance and low<br />
recruitment. The depleted stock abundance, low<br />
recruitment, and high fishing mortality rates over<br />
the past few years have led to consideration <strong>of</strong> additional<br />
harvest restrictions in this area. Decreased<br />
recruitment and abundance has also been estimated<br />
in Massachusetts Bay and Stellwagen Bank.<br />
While lobster landings have been increasing in<br />
Northern <strong>New</strong> <strong>England</strong>, other Gulf <strong>of</strong> Maine fisheries<br />
have been declining. The relative health <strong>of</strong> the<br />
lobster resource has allowed the industry to absorb<br />
an influx <strong>of</strong> harvesters displaced from other fisheries<br />
experiencing declining stocks. Meanwhile,<br />
access to other fisheries in the region has become<br />
tightly controlled. It is believed that many fishermen<br />
who previously targeted lobsters only parttime,<br />
or not at all are now exclusively dependent<br />
on the lobster resource. Many rural coastal towns<br />
now depend almost entirely on lobstering to support<br />
the local economy.<br />
“The fundamental issue that confronts<br />
both managers and lobstermen is this: given<br />
that the high recruitment and population<br />
levels are probably due to environmental<br />
conditions (such as higher water temperatures,<br />
decreased predation, or some other factors<br />
which we do not understand or control), is<br />
current abundance creating a false sense <strong>of</strong><br />
security and leading us to believe that we can<br />
continue to fish at high exploitation rates?”<br />
(from Amendment 3 <strong>of</strong> the Atlantic States<br />
Marine Fisheries Management Plan for<br />
American <strong>Lobster</strong>)<br />
Clearly, coastal communities face a huge risk. Any<br />
number <strong>of</strong> factors could reduce lobster landings—<br />
disease, overfishing, an oil spill or other man-made<br />
disaster, or environmental factors such as warming<br />
water temperatures. It is likely that the lobster<br />
resource will decline at some point in the future.<br />
If this happens, lobster fishermen could be out <strong>of</strong><br />
work with few options for transitioning to other<br />
fisheries. Because most lobster fishermen are selfemployed,<br />
the Department <strong>of</strong> Labor can provide<br />
almost no information about their employment,<br />
income levels, family status and so forth. This creates<br />
a dangerous situation for coastal communities:<br />
the current high stock abundance supports thousands<br />
<strong>of</strong> fishing jobs throughout <strong>New</strong> <strong>England</strong>, yet<br />
we have little information to quantify their dependence<br />
on the lobster resource.<br />
The lack <strong>of</strong> socioeconomic data for the <strong>New</strong> <strong>England</strong><br />
lobster industry makes it very difficult to prepare<br />
effectively for inevitable changes within the<br />
industry. The <strong>New</strong> <strong>England</strong> <strong>Lobster</strong> <strong>Socioeconomic</strong><br />
<strong>Survey</strong> was initiated to address this lack <strong>of</strong> information<br />
about the <strong>New</strong> <strong>England</strong> lobster fishing industry<br />
and collect baseline socioeconomic data on<br />
the <strong>New</strong> <strong>England</strong> lobster industry. We hope the information<br />
collected will provide managers and the<br />
industry with baseline data on which to evaluate<br />
future policy and programs for the <strong>New</strong> <strong>England</strong><br />
lobster fishery.
What Information was Collected<br />
The study area for the survey encompassed the Atlantic<br />
States Marine Fisheries Commission’s <strong>Lobster</strong><br />
Conservation Management Areas 1 and 2, and that<br />
part <strong>of</strong> Area 3 fished by lobstermen from Maine,<br />
<strong>New</strong> Hampshire, Massachusetts and Rhode Island.<br />
The phone survey was administered in 2006 to a<br />
random sample <strong>of</strong> commercial lobster license holders<br />
within those states. Questions covered baseline<br />
information for the 2005 calendar year and included<br />
demographics, involvement in the lobster industry,<br />
business operations, and financial information.<br />
The Project Steering Committee was particularly<br />
interested in obtaining information on the financial<br />
vulnerability <strong>of</strong> lobstermen and their families<br />
and the amount <strong>of</strong> effort currently employed in the<br />
lobster industry.<br />
Information Collected from Active* <strong>Lobster</strong>men<br />
included:<br />
Demographic Characteristics<br />
• gender<br />
• age<br />
• marital status<br />
• education/training<br />
• number in household<br />
• children’s education/training<br />
Involvement in the <strong>Lobster</strong> Industry<br />
• years involved in lobstering<br />
• years holding a lobster license<br />
• years planning to lobster<br />
Vessel Characteristics<br />
• length<br />
• horsepower<br />
• crew size<br />
• distance moored from home<br />
2005 <strong>Lobster</strong>ing by Quarter<br />
• number <strong>of</strong> traps<br />
• number <strong>of</strong> trap hauls per trip<br />
• number <strong>of</strong> trips per week<br />
• number <strong>of</strong> pounds per trip<br />
<strong>Lobster</strong> Effort (*note: this term was not specifically<br />
defined for respondents)<br />
• increased or decreased since 2004<br />
• reasons for increase or decrease<br />
• expectations for increase or decrease in future<br />
and reasons<br />
Other Fishing Activities<br />
• percent who hold other fishing licenses or permits<br />
• type <strong>of</strong> license or permits<br />
• percent earning income from other fisheries<br />
<strong>Lobster</strong> Business<br />
• gross revenue for lobster business 2005<br />
• amount paid to sternmen in 2005<br />
• % <strong>of</strong> revenue in 2005 that went towards fuel and oil<br />
• % <strong>of</strong> revenue in 2005 that went towards bait<br />
• % <strong>of</strong> revenue in 2005 that went to vessel insurance<br />
• % <strong>of</strong> revenue that is pr<strong>of</strong>it after all expenses are paid<br />
9
What Information was Collected<br />
10<br />
Investments and Financing <strong>of</strong> <strong>Lobster</strong> Business<br />
• investments in lobster business (gear, boat, etc.)<br />
• other investments<br />
• amount and purpose <strong>of</strong> business loans<br />
• source <strong>of</strong> financing<br />
• plans for future investment in business<br />
Household Income<br />
• household income<br />
• source <strong>of</strong> income (lobstering, other fishing, other)<br />
• other household members who contribute to income<br />
• source <strong>of</strong> other household members’ income<br />
Health Insurance Coverage<br />
• insured or uninsured<br />
• level <strong>of</strong> insurance<br />
• source <strong>of</strong> insurance<br />
Retirement<br />
• plans to retire<br />
• type <strong>of</strong> retirement assets (IRA, 401k, savings)<br />
Comments about the <strong>Lobster</strong> Industry<br />
• major changes seen in the lobster industry in the<br />
last 5-10 years<br />
• major changes foreseen in the next 5-10<br />
* For this survey active lobstermen are defined as<br />
those who landed 1000 pounds <strong>of</strong> lobster or more<br />
during 2005. A separate, shorter survey was done<br />
for those respondents who said they landed less<br />
than 1000 pounds in 2005.<br />
<strong>Lobster</strong> Management and Data Collection<br />
in Brief<br />
The <strong>New</strong> <strong>England</strong> <strong>Lobster</strong> Fishery is prosecuted<br />
in both state and federal waters. Each state manages<br />
the lobster fishery that occurs within its own<br />
waters (0-3 miles <strong>of</strong>fshore). Federal waters (3-200<br />
miles) are subject to federal management authority.<br />
Since 1997, the Atlantic States Marine Fisheries<br />
Commission (ASMFC) has managed the federal<br />
lobster fishery under its Interstate Fishery Management<br />
Plan for American <strong>Lobster</strong> (ISFMP). Management<br />
is conducted in seven separate <strong>Lobster</strong><br />
Conservation Management Areas (LCMAs) four <strong>of</strong><br />
which occur in <strong>New</strong> <strong>England</strong> (Figure 2).<br />
Each LCMA has a <strong>Lobster</strong> Conservation Management<br />
Team (LCMT), consisting <strong>of</strong> area fishermen.<br />
Teams are encouraged to develop management<br />
recommendations that address the specific needs<br />
<strong>of</strong> their LCMA. The ASMFC <strong>Lobster</strong> Management<br />
Board considers these recommendations when<br />
pursuing the goals <strong>of</strong> the Interstate Fishery Management<br />
Plan. The ASMFC also helps states coordinate<br />
management plans to ensure comprehensive,<br />
compatible, and effective management <strong>of</strong> the US<br />
lobster resource.<br />
Regulations differ somewhat across LCMAs and<br />
states, but the basic system <strong>of</strong> management is similar.<br />
All areas and states have limited access licenses<br />
(though they are not transferable in Maine while
What Information was Collected<br />
they are in other states). All states have minimum<br />
size limits and prohibitions on landing female egg<br />
bearing lobsters. Maine also has a maximum size.<br />
Maine has codified a practice known as V-notching<br />
whereby egg bearing females have a notch cut in<br />
their tail when they are released. The notch may<br />
last several years and a lobsterman that captures a<br />
notched lobster even when not bearing eggs must<br />
release the lobster. Other states are now implementing<br />
this rule. This combination <strong>of</strong> effort controls<br />
and technical regulations has, to date,<br />
been successful at protecting a brood stock <strong>of</strong><br />
lobster that has continued to provide recruits<br />
to the fishery.<br />
the health and stability <strong>of</strong> the lobster resource with<br />
little socioeconomic information collected. Each<br />
state collects these data through separate programs,<br />
which are not always compatible. The ASMFC<br />
is currently working to establish comprehensive<br />
standardized data collection throughout the lobster<br />
fishery to allow data to be compared more easily<br />
throughout the region.<br />
Over three-quarters <strong>of</strong> <strong>New</strong> <strong>England</strong>’s lobster is<br />
landed in Maine (79.8% in 2005 according to<br />
NMFS landings data). The Maine Department<br />
<strong>of</strong> Marine Resources (DMR) divides the lobster<br />
fishery into seven management zones. Within<br />
each zone, a zone council works with the Maine<br />
<strong>Lobster</strong> Advisory Council and the Commissioner<br />
<strong>of</strong> Marine Resources to enact management<br />
tailored to local conditions. Zones run from east<br />
(Zone A) to west (Zone G).<br />
Collection <strong>of</strong> accurate and complete data is<br />
an important component <strong>of</strong> the management<br />
structure. In the lobster fishery, fisheries-dependent<br />
data is collected through catch and<br />
landings reports, port sampling, and sea sampling.<br />
The majority <strong>of</strong> data collected concerns<br />
Figure 2. ASMFC <strong>Lobster</strong> Conservation Management Areas<br />
11
How the <strong>Survey</strong> was Conducted<br />
The <strong>New</strong> <strong>England</strong> <strong>Lobster</strong> <strong>Socioeconomic</strong> <strong>Survey</strong> was<br />
based on telephone interviews conducted from<br />
March 13th, 2006 to August 29th, 2006, with 1,158<br />
randomly selected lobstermen in <strong>New</strong> <strong>England</strong>. In<br />
2005, there were 9701 commercially licensed lobstermen<br />
within the study area. The sampling approach<br />
relied on a stratified sampling design that<br />
examined twelve fishing areas in Maine, <strong>New</strong><br />
Hampshire, Massachusetts, and Rhode Island, including<br />
both state and federal waters. The table on<br />
the right displays the breakdown <strong>of</strong> the 12 areas,<br />
including the federal management area, the state<br />
area as appropriate, and the total number <strong>of</strong> interviews<br />
conducted among lobstermen in that area.<br />
In addition to stratifying by geographic area, the<br />
sample was also stratified by activity level. Activity<br />
was defined by asking whether the respondent had<br />
landed 1000 pounds <strong>of</strong> lobster or more in 2005.<br />
Further, because this research was mainly concerned<br />
with lobstermen who make a living from<br />
catching and selling lobster, respondents who were<br />
considered as not actively lobstering (landed less<br />
than 1000 lbs. <strong>of</strong> lobster in 2005) were asked a limited<br />
set <strong>of</strong> questions. The results in this summary<br />
document are focused on active commercial lobster<br />
fishermen.<br />
The random sample <strong>of</strong> telephone numbers called<br />
was based on the most recent list <strong>of</strong> lobster license<br />
holders within each state. When a working number<br />
was called, the person listed as the lobster license<br />
holder was identified and interviewed. On average,<br />
it took six calls to make contact. The response<br />
rate was 40%, defined as the ratio <strong>of</strong> the number<br />
<strong>of</strong> completed interviews divided by the number <strong>of</strong><br />
eligible units in the sample. The cooperation rate<br />
was 80%, which indicates 80% <strong>of</strong> those lobstermen<br />
reached by phone actually completed the survey.<br />
Strata LCMA Zone Sample size<br />
Maine<br />
1 <strong>Lobster</strong> Management Area 1 Zone A 136<br />
2 <strong>Lobster</strong> Management Area 1 Zone B 73<br />
3 <strong>Lobster</strong> Management Area 1 Zone C 120<br />
4 <strong>Lobster</strong> Management Area 1 Zone D 144<br />
5 <strong>Lobster</strong> Management Area 1 Zone E 75<br />
6 <strong>Lobster</strong> Management Area 1 Zone F 120<br />
7 <strong>Lobster</strong> Management Area 1 Zone G 60<br />
<strong>New</strong> Hampshire<br />
8 <strong>Lobster</strong> Management Area 1 59<br />
Massachusetts<br />
9 <strong>Lobster</strong> Management Area 1 131<br />
10 <strong>Lobster</strong> Management Area 2 65<br />
Rhode Island<br />
11 <strong>Lobster</strong> Management Area 2 140<br />
12 <strong>Lobster</strong> Management Area 3 33<br />
Table 1: Number <strong>of</strong> interviews by sample strata,<br />
state, and LCMA.<br />
13
How the <strong>Survey</strong> was Conducted<br />
A note on confidence intervals:<br />
14<br />
In this survey, responses <strong>of</strong> a sample population reveal characteristics <strong>of</strong> a population as a whole.<br />
As in all surveys, the larger the sample population, the more likely it is that their responses accurately<br />
reflect characteristics <strong>of</strong> the larger group. The likelihood that survey results represent<br />
the larger population is expressed in confidence intervals, which in this report are represented<br />
by a +/- figure following numerical results, or by vertical bars extending above or below columns<br />
on charts. The confidence intervals used here are 95%, meaning there is a 95% chance that<br />
characteristics <strong>of</strong> the subject population fall within the range expressed. For instance: “49 %<br />
(+/- 4.3%) <strong>of</strong> Maine <strong>Lobster</strong>men have outstanding business loans.” This means that 49% <strong>of</strong> the<br />
Maine lobstermen surveyed have an outstanding loan on their business. Based on the number<br />
<strong>of</strong> Maine lobstermen surveyed, compared to the number <strong>of</strong> Maine lobstermen overall, there is<br />
a 95% probability that the actual percentage <strong>of</strong> all Maine lobstermen with outstanding business<br />
loans falls between 44.7% and 52.3%.
What We Learned - Key Findings <strong>of</strong> the <strong>Survey</strong><br />
The “Average” Active <strong>Lobster</strong>man in <strong>New</strong> <strong>England</strong><br />
<strong>Lobster</strong>men in <strong>New</strong> <strong>England</strong> are an average <strong>of</strong> 50<br />
years old. Approximately three-quarters are married,<br />
although fewer than one in three has children<br />
living at home. Eighty percent have at least a high<br />
school diploma or G.E.D., 12% have a Bachelor’s<br />
degree, and 2% hold a graduate degree.<br />
Maine lobstermen appear less likely to have graduated<br />
high school than those in other areas. In LCMA<br />
1 ME, 19% (+/- 3%) <strong>of</strong> lobstermen did not graduate<br />
high school. In LCMA 1 NH/MA, that number is<br />
12% (+/- 7%), in LCMA 2 it is 9% (+/- 6%), and in<br />
LCMA 3 it is 36% (+/- 20% note that the large confidence<br />
interval is due to a small sample size).<br />
60 %<br />
50 %<br />
40 %<br />
30 %<br />
20 %<br />
10 %<br />
0 %<br />
LCMA 1<br />
ME<br />
LCMA<br />
NH/MA<br />
LCMA 2 LCMA 3<br />
Figure 3: Did not Finish High School, by LCMA.<br />
15
What We Learned - Key Findings <strong>of</strong> the <strong>Survey</strong><br />
The “Average” Active <strong>Lobster</strong>man in <strong>New</strong> <strong>England</strong><br />
How do lobstermen compare to the<br />
general population?<br />
According to 2005 US Census data, the percent<br />
<strong>of</strong> people in the study area 25 years and<br />
over who have not completed high school<br />
(including equivalency) ranges from a low <strong>of</strong><br />
10% in <strong>New</strong> Hampshire to a high <strong>of</strong> 17% in<br />
Rhode Island (Maine, 11%, Massachusetts<br />
12 %, +/- for all states 1% or less). Because<br />
the geographic breakdowns, age ranges,<br />
and confidence intervals are not the same,<br />
(US Census uses a 90% confidence interval),<br />
it is difficult to compare the two sources.<br />
However it is interesting to note that it appears<br />
Maine lobstermen are less likely than<br />
their local counterparts to have graduated<br />
from high school, but Rhode Island lobstermen<br />
are more likely to have done so.<br />
On average, lobstermen have held a lobster permit<br />
for 28 years. Maine lobstermen have held their licenses<br />
for slightly longer than those in other areas<br />
(although only the difference between LCMA 1 ME<br />
and LCMA 1 NH/MA is statistically significant).<br />
Most lobstermen were involved in the industry for<br />
2-4 years before getting their own license.<br />
Approximately 60% <strong>of</strong> respondents in LCMA 1 and<br />
2 said they planned to lobster as long as they could<br />
or as long as needed. <strong>Lobster</strong>men in LCMA 3 generally<br />
planned to retire somewhere between 1 and<br />
20 years in the future.<br />
16<br />
LCMA 1 ME LCMA 1 NH/MA LCMA 2 LCMA 3<br />
mean +/- mean +/- mean +/- mean +/-<br />
Years in <strong>Lobster</strong>ing 31 1 29 3 27 3 29 5<br />
Years with a License 29 1 24 3 25 3 25 5<br />
Table 2: Number <strong>of</strong> years in the lobster industry and number <strong>of</strong> years with a lobster license<br />
by LCMA.
What We Learned - Key Findings <strong>of</strong> the <strong>Survey</strong><br />
The “Average” Active <strong>Lobster</strong>man in <strong>New</strong> <strong>England</strong><br />
Less effort was used by lobstermen who were active<br />
in the first half <strong>of</strong> the year. On average, lobstermen<br />
had a maximum <strong>of</strong> 450 traps in the water during<br />
the 1st quarter and 480 traps in the water during<br />
the 2nd quarter. There were an average <strong>of</strong> two trips<br />
per week when they hauled traps and three trips<br />
per week in the 1st and 2nd quarters, respectively.<br />
During those trips, lobstermen hauled about 250<br />
traps and 216 traps for each quarter.<br />
As the table below shows, the relatively higher effort<br />
levels <strong>of</strong> active fishermen in the 3rd and 4th<br />
quarters are most reflective <strong>of</strong> what occurs throughout<br />
LCMA 1 and LCMA 2. The maximum traps<br />
used on average in LCMA 3 are more consistent<br />
throughout the year, though few trips per week occur<br />
in Quarter 1.<br />
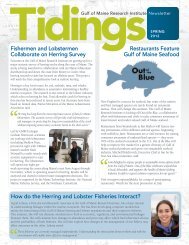
The table on the next page provides data on lobster<br />
fishing effort and landings by LCMA by quarter.<br />
Average landings per fishermen by quarter are also<br />
higher in the 3rd and 4th quarters. In fact, the higher<br />
level <strong>of</strong> landings in these quarters is more pronounced<br />
than are the effort levels. The higher average<br />
landings in the 3rd and 4th quarters apply to<br />
LCMA 3 as well as the other areas. We note that the<br />
Table 4 shows average landings for active fishermen<br />
during those periods. Because more lobstermen are<br />
active in the last two quarters, overall landings are<br />
heavily concentrated in the 3rd and 4th quarters.<br />
Pounds (millions)<br />
40<br />
35<br />
30<br />
25<br />
20<br />
15<br />
10<br />
5<br />
18<br />
1 2 3 4<br />
Quarter<br />
Figure 4: <strong>Lobster</strong> landings measured in pounds for<br />
<strong>New</strong> <strong>England</strong> in 2005 by quarter. Source:<br />
(http://www.st.nmfs.noaa.gov/st1/commercial/<br />
landings/annual_landings.html)
What We Learned - Key Findings <strong>of</strong> the <strong>Survey</strong><br />
The “Average” Active <strong>Lobster</strong>man in <strong>New</strong> <strong>England</strong><br />
LCMA 1 ME LCMA 1 NH/MA LCMA 2 LCMA 3<br />
Mean +/- Mean +/- Mean +/- Mean +/-<br />
Quarter 1<br />
Maximum Traps 439 33 470 92 367 78 1041 294<br />
Average Trips per Week 1.7 0.1 2.1 0.3 1.8 0.3 2.0 0.6<br />
Average Traps Hauled per Week 232 15 247 60 196 36 939 345<br />
Total Landed Pounds 2,980 575 3,076 2,445 1,848 836 5,618 2,937<br />
Quarter 2 0<br />
Maximum Traps 485 23 436 52 401 62 1031 215<br />
Average Trips per Week 3.4 0.1 3.4 0.3 2.8 0.3 2.5 0.9<br />
Average Traps Hauled per Week 211 8 214 32 175 23 855 269<br />
Total Landed Pounds 4,013 462 2,667 725 2,205 481 12,066 4,928<br />
Quarter 3<br />
Maximum Traps 564 20 490 49 458 61 1055 191<br />
Average Trips per Week 4.5 0.1 4.2 0.3 3.9 0.4 3.2 0.9<br />
Average Traps Hauled per Week 222 8 230 25 193 24 853 272<br />
Total Landed Pounds 11,914 3,924 5,710 1,568 5,348 1,297 25,970 9,597<br />
Quarter 4<br />
Maximum Traps 555 21 501 52 448 67 1035 223<br />
Average Trips per Week 3.9 0.1 3.8 0.3 2.7 0.3 2.4 0.8<br />
Average Traps Hauled per Week 222 7 233 28 186 27 849 279<br />
Total Landed Pounds 11,920 3,037 7,257 2,590 3,222 1,058 29,497 11,719<br />
Table 4: <strong>Lobster</strong> fishing effort (measured by maximum number <strong>of</strong> traps, average trips per week, average traps<br />
hauled per trip, and total pound landed) by LCMA for each quarter <strong>of</strong> 2005.<br />
19
What We Learned - Key Findings <strong>of</strong> the <strong>Survey</strong><br />
The “Average” Active <strong>Lobster</strong>man in <strong>New</strong> <strong>England</strong><br />
% <strong>of</strong> Active <strong>Lobster</strong>men<br />
80 %<br />
70 %<br />
60 %<br />
50 %<br />
40 %<br />
30 %<br />
20 %<br />
LCMA1 ME<br />
LCMA1 NH/MA<br />
LCMA 2<br />
LCMA 3<br />
10 %<br />
0 %<br />
1,000-<br />
10,000<br />
10,000-<br />
20,000<br />
20,000-<br />
30,000<br />
30,000-<br />
40,000<br />
40,000-<br />
50,000<br />
50,000-<br />
60,000<br />
60,000-<br />
70,000<br />
70,000-<br />
80,000<br />
80,000-<br />
90,000<br />
Range <strong>of</strong> Catches (lbs)<br />
Figure 5: Distribution <strong>of</strong> average annual landings <strong>of</strong> active lobstermen for 2005 by LCMA.<br />
90,000-<br />
100,000<br />
>100,000<br />
20<br />
The variation in landings by individuals within and<br />
between areas is striking. The chart above shows the<br />
range <strong>of</strong> average annual landings across management<br />
areas based on the survey data. While roughly 20% <strong>of</strong><br />
lobstermen in LCMA 1 NH/MA and LCMA 2 reported<br />
landing more than 20,000 pounds annually, in Maine<br />
44% reported doing so in 2005. Maine lobstermen are<br />
also far more likely to land more than 40,000 pounds:<br />
around 17% <strong>of</strong> Maine lobstermen land more than<br />
40,000 pounds <strong>of</strong> lobster annually, compared to 5% <strong>of</strong><br />
the lobstermen in LCMA 1 NH/MA, and a negligible<br />
percentage in LCMA 2. In LCMA 3, 64% <strong>of</strong> lobstermen<br />
landed more than 40,000 pounds <strong>of</strong> lobster and 18%<br />
landed more than 100,000 pounds <strong>of</strong> lobster in 2005.
What We Learned - Key Findings <strong>of</strong> the <strong>Survey</strong><br />
The “Average” <strong>Lobster</strong> Business for Active <strong>Lobster</strong>men in <strong>New</strong> <strong>England</strong><br />
The average vessel size for active lobstermen was<br />
32 feet. There were no statistically significant<br />
differences in vessel length or engine horsepower<br />
amongst LCMA 1 ME, LCMA 1 NH/MA and<br />
LCMA 2. Not surprisingly, LCMA 3 vessels are<br />
significantly larger, and have greater horsepower<br />
engines than those in any other area.<br />
70<br />
60<br />
50<br />
40<br />
30<br />
20<br />
10<br />
0<br />
LCMA 1<br />
ME<br />
LCMA 1<br />
NH/MA<br />
LCMA 2 LCMA 3<br />
Figure 6: Average vessel length in feet for active<br />
lobstermen by LCMA.<br />
600<br />
500<br />
400<br />
300<br />
200<br />
100<br />
0<br />
LCMA 1<br />
ME<br />
LCMA 1<br />
NH/MA<br />
LCMA 2 LCMA 3<br />
Figure 7: Average vessel horsepower for active<br />
lobstermen by LCMA.<br />
23
What We Learned - Key Findings <strong>of</strong> the <strong>Survey</strong><br />
The “Average” <strong>Lobster</strong> Business for Active <strong>Lobster</strong>men in <strong>New</strong> <strong>England</strong><br />
Although there are some lobster license holders<br />
that are making substantial revenues from lobstering,<br />
the net revenues <strong>of</strong> lobstermen after accounting<br />
for operating expenses are not high on average,<br />
even for lobstermen that fished during more than<br />
two quarters in 2005. An exception is LCMA 3. As<br />
we note below, many households depend on other<br />
income to supplement income from lobstering.<br />
Note that the net return reflects only variable expenses<br />
and does not account for capital costs such<br />
as boat payments. Recent increases in fuel prices<br />
have almost certainly further reduced net returns<br />
since 2005.<br />
Fish More<br />
than two<br />
Quarters<br />
per Year<br />
Net Return Sternman<br />
After Payment %<br />
Expenses <strong>of</strong> Gross<br />
Fuel & Bait<br />
and P&I<br />
Insurance %<br />
<strong>of</strong> Gross<br />
Gross<br />
Region<br />
Sterman Revenue<br />
NO $47,854 $15,397 NA 28 %<br />
YES<br />
LCMA 1<br />
YES $106,317 $35,247 20 % 25 %<br />
Maine<br />
NO $27,778 $8,957 NA 29 %<br />
NO<br />
YES $54,683 $18,812 16 % 30 %<br />
NO $49,368 $15,523 NA 27 %<br />
YES<br />
LCMA 1<br />
YES $119,609 $35,570 26 % 33 %<br />
NH/MA<br />
NO $22,788 $3,409 NA 29 %<br />
NO<br />
YES $54,660 $16,021 15 % 32 %<br />
LCMA 2<br />
YES<br />
NO $44,524 $14,074 NA 28 %<br />
YES $112,206 $35,979 17 % 24 %<br />
NO<br />
NO $38,562 $11,485 NA 25 %<br />
YES $21,627 $7,556 NA 17 %<br />
LCMA 3 YES YES $423,905 $89,357 32 % 28 %<br />
24<br />
Table 6: <strong>Lobster</strong> business revenue characteristics for 2005 by LCMA, activity level, and use <strong>of</strong> a sternman.
What We Learned - Key Findings <strong>of</strong> the <strong>Survey</strong><br />
The “Average” <strong>Lobster</strong> Business for Active <strong>Lobster</strong>men in <strong>New</strong> <strong>England</strong><br />
How are <strong>Lobster</strong> Businesses Financed?<br />
Almost four in five active lobstermen surveyed<br />
made an investment in their business during the<br />
2005 calendar year. Common investments included<br />
new traps (65%), other new gear (24%), and ropes<br />
and buoys (22%). Of those that made investments,<br />
roughly one fifth to one half (by area) did so to<br />
comply with state or federal regulations.<br />
80 %<br />
70 %<br />
60 %<br />
50 %<br />
40 %<br />
30 %<br />
20 %<br />
10 %<br />
0 %<br />
LCMA 1 ME LCMA 1<br />
NH/MA<br />
LCMA 2 LCMA 3<br />
Figure 8: Percent <strong>of</strong> active lobstermen who made lobster<br />
business investments in 2005 due to fisheries regulations.<br />
About a third <strong>of</strong> active lobstermen think they will invest<br />
more in their lobster business during the 2006<br />
calendar year. When asked what they will invest in,<br />
50% indicate new traps, 19% a new boat, and 17%<br />
say they will need a new engine for their boat.<br />
In terms <strong>of</strong> financing these investments, just under<br />
half <strong>of</strong> all lobstermen have outstanding business<br />
loans. While 49 % (+/- 4%) <strong>of</strong> lobstermen in<br />
LCMA 1 ME and 58% (+/- 21%) in LCMA 3 have<br />
outstanding business loans, only 26% <strong>of</strong> those in<br />
LCMA 1 NH/MA, and 15% (+/- 8%) <strong>of</strong> LCMA 2<br />
lobstermen have outstanding business loans.<br />
90 %<br />
80 %<br />
70 %<br />
60 %<br />
50 %<br />
40 %<br />
30 %<br />
20 %<br />
10 %<br />
0 %<br />
LCMA 1<br />
ME<br />
LCMA 1<br />
NH/MA<br />
LCMA 2 LCMA 3<br />
Figure 9: Percent <strong>of</strong> active lobstermen who have<br />
outstanding business loans by LCMA.<br />
The size <strong>of</strong> the business loans varies significantly<br />
by geographic region. As might be expected, the<br />
larger loans are for LCMA 3 lobstermen with an average<br />
<strong>of</strong> $149,334. However, the small sample size<br />
makes it difficult to consider this a reliable estimate<br />
as the confidence limits give a range <strong>of</strong> +/- $90,092.<br />
<strong>Lobster</strong>men in Maine, on average, have significantly<br />
larger loans than those lobstermen who<br />
fish in LCMA 2, with an average loan <strong>of</strong> $56,279<br />
(+/- $7,860) in LCMA 1 ME and an average loan <strong>of</strong><br />
$20,015 (+/- $14,017) in LCMA 2.<br />
$250,000<br />
$200,000<br />
$150,000<br />
$100,000<br />
$50,000<br />
$0 LCMA 1 ME LCMA 1<br />
NH/MA<br />
LCMA 2 LCMA 3<br />
Figure 10: Average dollar amount owed on lobster<br />
business loans in 2005 by LCMA.<br />
25
What We Learned - Key Findings <strong>of</strong> the <strong>Survey</strong><br />
The “Average” <strong>Lobster</strong> Business for Active <strong>Lobster</strong>men in <strong>New</strong> <strong>England</strong><br />
LCMA 1 ME LCMA 1 NH/MA LCMA 2<br />
LCMA 3<br />
Mean +/- Mean +/- Mean +/- Mean +/-<br />
Average Amount Owed on Business Loans ($) 56,279 7,860 37,278 19,945 20,015 14,017 149,334 90,092<br />
<strong>New</strong> Boat 67.6% 5.8% 35.9% 15.5% 30 % 2 % 90 % 19 %<br />
<strong>New</strong>/Rebuilt Engine 13.7% 4.4% 28.5% 19.0% 14 % 19 % 10 % 19 %<br />
Gear/Equipment 21.6% 5.1% 28.1% 15.4% 19 % 22 %<br />
Truck/Vehicle 11.7% 3.6% 17.0% 13.7% 49 % 30 %<br />
Boat Repair/Overhaul 5.7% 3.0% 12.2% 10.9% 20 % 22 %<br />
Table 8: Average dollar amount owed on lobster business loans in 2005 and purpose <strong>of</strong> loans (as a percent <strong>of</strong> total)<br />
by LCMA.<br />
26<br />
Loans are more likely to be for new boats in LCMA 3 and<br />
LCMA 1, and for a truck or other vehicle in LCMA 2.<br />
Over half <strong>of</strong> active lobstermen use personal or<br />
family savings as a method to finance their lobster<br />
business, and about 1 in 5 use personal or family<br />
credit cards. Despite such a large proportion that<br />
uses personal means to finance their business, almost<br />
three-quarters <strong>of</strong> active lobstermen feel there<br />
are adequate sources <strong>of</strong> financing for their lobster<br />
business.<br />
Nine percent <strong>of</strong> active lobstermen have invested<br />
pr<strong>of</strong>its from lobstering in another business during<br />
the past year. Among those who indicate they have<br />
invested pr<strong>of</strong>its from their lobstering business in<br />
another business in the past year, 39% invested in<br />
another fishing related business, and 17% invested<br />
in real estate or other property.<br />
Cash Business Income Other<br />
Business Line <strong>of</strong> Credit Business Credit Card Personal<br />
Home Equity Loan Personal Savings<br />
Credit Card<br />
100 %<br />
90 %<br />
80 %<br />
70 %<br />
60 %<br />
50 %<br />
40 %<br />
30 %<br />
20 %<br />
10 %<br />
0 %<br />
Maine Area 1<br />
NH/MA<br />
LCMA 2 LCMA 3<br />
Figure 11: Sources <strong>of</strong> financing for lobster business<br />
loans as a proportion <strong>of</strong> total financing by LCMA.
What We Learned - Key Findings <strong>of</strong> the <strong>Survey</strong><br />
How Vulnerable are <strong>Lobster</strong> Fishing Families to a Potential Drop in Landings?<br />
The average annual household income in <strong>New</strong> <strong>England</strong><br />
for lobster fishing families surveyed ranged<br />
from a high <strong>of</strong> $87,960 (+/- $41,805) in LCMA 3<br />
to a low <strong>of</strong> $57,385 (+/- $7,252) in LCMA 1 NH/<br />
MA. As a means <strong>of</strong> comparison, the U.S. Census<br />
reported that the median household income for the<br />
United States was $44,389 in 2004 (DeNavas-Walt,<br />
et al., 2005). At the state level, the U.S. Census<br />
Bureau reported income based on a 3-year average<br />
median household income for 2002-2004. Maine<br />
had the lowest 3-year average median income with<br />
$39,395, while <strong>New</strong> Hampshire had the highest<br />
3-year average median income at $57,352. Massachusetts<br />
and Rhode Island had a 3-year average<br />
median household income <strong>of</strong> $52,354 and $46,199,<br />
respectively. Although it is difficult to compare the<br />
average annual household income figures from the<br />
survey to the 3-year average median income (average<br />
income tends to be higher than median income<br />
because income distributions are skewed), it appears<br />
as though the household income <strong>of</strong> the lobster<br />
industry is at or above the median incomes for<br />
<strong>New</strong> <strong>England</strong> and the United States.<br />
$140,000<br />
$120,000<br />
$100,000<br />
$80,000<br />
$60,000<br />
$40,000<br />
$20,000<br />
$0<br />
$71,013<br />
$57,385<br />
LCMA 1 ME LCMA 1<br />
NH/MA<br />
$76,908<br />
$87,960<br />
LCMA 2 LCMA 3<br />
Figure 12: Average annual household income for<br />
active lobstermen in 2005 by LCMA.<br />
27
What We Learned - Key Findings <strong>of</strong> the <strong>Survey</strong><br />
How Vulnerable are <strong>Lobster</strong> Fishing Families to a Potential Drop in Landings?<br />
28<br />
Downeast Maine: <strong>Lobster</strong>ing on the Edge?<br />
Although Maine lobstermen have an average<br />
household income <strong>of</strong> just over $70,000,<br />
this varies by zone. Household income decreases<br />
as one moves Downeast.<br />
Downeast lobstermen appear most dependent<br />
on the lobster resource, and yet have<br />
the fewest alternate employment options<br />
should the resource decline. According to<br />
the U.S. Census Bureau, the median 2004<br />
household income in Maine in was $41,287.<br />
In Washington County, the 2004 median<br />
household income was $29,087. However<br />
the average Maine lobsterman’s household<br />
earned $66,902 (+/-$3,962), and the average<br />
lobsterman’s household in Zones ABC<br />
earned $58,680. Should the lobster resource<br />
decline, it is highly unlikely that lobstermen in<br />
Maine, and Downeast in particular, could find<br />
employment providing a similar income.<br />
Washington County, Maine, the most eastern<br />
portion <strong>of</strong> the United States, is isolated from<br />
the rest <strong>of</strong> <strong>New</strong> <strong>England</strong> and this isolation<br />
has lead to its dependence on the marine<br />
environment. It is also the poorest county in<br />
<strong>New</strong> <strong>England</strong> and the second poorest in the<br />
United States (Hall-Arber, et al.) In a comprehensive<br />
report that compiled information<br />
on <strong>New</strong> <strong>England</strong>’s fishing communities and<br />
ranked their dependency on fishing, the<br />
authors determined that Downeast communities<br />
remain the most fishery-dependent<br />
communities <strong>of</strong> all the regions they<br />
surveyed in <strong>New</strong> <strong>England</strong> (see http://seagrant.mit.edu/cmss/marfin/downeast.html<br />
for greater detail). Alternative occupations<br />
were also considered in relation to fishing<br />
dependency. If fishing were to cease in<br />
Downeast Maine, there would be, on average,<br />
two and one half fishermen available<br />
to work in any single comparable occupation<br />
and the labor market would quickly be<br />
saturated.<br />
$90,<br />
000<br />
$80,<br />
000<br />
$70,<br />
000<br />
$60,<br />
000<br />
$50,<br />
000<br />
$40,<br />
000<br />
$30,<br />
000<br />
$20,<br />
000<br />
$10,<br />
000<br />
$0<br />
$58,<br />
680<br />
$72, 829 $76,<br />
125<br />
Zones ABC Zones DE Zones FG<br />
Figure 13: Average annual household income for<br />
Maine lobstermen in 2005 by areas.
What We Learned - Key Findings <strong>of</strong> the <strong>Survey</strong><br />
How Vulnerable are <strong>Lobster</strong> Fishing Families to a Potential Drop in Landings?<br />
Active lobstermen were the sole wage earner in a little<br />
less than half <strong>of</strong> all households surveyed. Among<br />
those households with other members who contribute<br />
to the yearly household income, nearly all are the<br />
spouses <strong>of</strong> active lobstermen. In addition to being<br />
most dependent on lobster for household income,<br />
those fishing in LCMA 1 also derive a lower percent<br />
<strong>of</strong> overall income from another household member.<br />
Although 28% <strong>of</strong> household income in LCMA<br />
3 comes from another member <strong>of</strong> the household, in<br />
LCMA 1 ME only 16% <strong>of</strong> household income comes<br />
from another household member.<br />
<strong>Lobster</strong> provides an average <strong>of</strong> 68% (+/- 3%) <strong>of</strong><br />
household income in LCMA 1 ME, higher than in<br />
any other area.<br />
80 %<br />
70 %<br />
60 %<br />
50 %<br />
40 %<br />
30 %<br />
20 %<br />
10 %<br />
0 %<br />
68 %<br />
47 %<br />
LCMA 1 ME LCMA 1 NH/<br />
MA<br />
54 %<br />
25 %<br />
LCMA 2 LCMA 3<br />
Figure 14: Percent <strong>of</strong> household income earned<br />
from lobster fishing in 2005 by LCMA.<br />
29
What We Learned - Key Findings <strong>of</strong> the <strong>Survey</strong><br />
How Vulnerable are <strong>Lobster</strong> Fishing Families to a Potential Drop in Landings?<br />
30<br />
Are there other fishing opportunities?<br />
Across <strong>New</strong> <strong>England</strong>, about four in ten lobstermen<br />
<strong>of</strong> those surveyed hold other fishing permits. The<br />
most common permits are those for scallop dredging,<br />
shrimping, and “commercial fishing”. <strong>Lobster</strong>men<br />
in LCMA 1 (both ME and NH/MA) are less<br />
likely than those in LCMA 2 and LCMA 3 to hold<br />
other fishing permits.<br />
Although more than a third <strong>of</strong> all lobstermen in<br />
the study area hold other fishing permits, less than<br />
a fifth <strong>of</strong> all lobstermen earned income from these<br />
permits in 2005. Again, lobstermen in LCMA 1 appear<br />
less likely to have earned income from other<br />
fisheries than those in LCMA 2 or LCMA 3. However,<br />
overlapping confidence intervals render comparisons<br />
between areas statistically insignificant.<br />
What other job skills and/or training<br />
do <strong>New</strong> <strong>England</strong> lobstermen have?<br />
Roughly two-thirds <strong>of</strong> lobstermen possess skills or<br />
training in fields other than lobstering. Of those with<br />
skills or training in other fields, 40% have skills as carpenters,<br />
tradesmen, or mechanics, while another 25%<br />
have skills in other types <strong>of</strong> commercial fishing, boat<br />
building, and maintenance.<br />
A little over one-third <strong>of</strong> active lobstermen report they<br />
hold a degree or certification for a specific job, with<br />
over half <strong>of</strong> those saying that the degree or certification<br />
90 %<br />
80 %<br />
70 %<br />
70 %<br />
60 %<br />
60 %<br />
50 %<br />
40 %<br />
39 %<br />
31 %<br />
30 %<br />
20 %<br />
10 %<br />
0 %<br />
LCMA 1 ME LCMA 1 LCMA 2 LCMA 3<br />
NH/MA<br />
Figure 15: Percent <strong>of</strong> active lobstermen with other<br />
fishing permits in 2005 by LCMA.<br />
40 %<br />
35 %<br />
30 %<br />
25 %<br />
20 %<br />
15 %<br />
10 %<br />
5 %<br />
0 %<br />
15 % 14 %<br />
LCMA 1 ME LCMA 1<br />
NH/MA<br />
25 %<br />
20 %<br />
LCMA 2 LCMA 3<br />
Figure 16: Percent <strong>of</strong> active lobster fishermen who<br />
earned income in 2005 from other fisheries.<br />
60 %<br />
50 %<br />
40 %<br />
30 %<br />
20 %<br />
10 %<br />
35 %<br />
55 %<br />
41 %<br />
29 %<br />
0 %<br />
LCMA 1 ME LCMA 1 LCMA 2 LCMA 3<br />
NH/MA<br />
Figure 17: Percent <strong>of</strong> active lobstermen with some<br />
training in another field.
What We Learned - Key Findings <strong>of</strong> the <strong>Survey</strong><br />
How Vulnerable are <strong>Lobster</strong> Fishing Families to a Potential Drop in Landings?<br />
is a technical or vocational degree. Slightly more than<br />
10 percent <strong>of</strong> those with degrees or certifications have a<br />
Bachelor’s degree or a Captain’s License/Marine Specific<br />
Degree. Only nine percent <strong>of</strong> active lobstermen who<br />
have a degree or certification report that they received<br />
federal assistance to obtain this training.<br />
One in ten active lobstermen reports having received<br />
training on how to run a business. Among those active<br />
lobstermen who have not already received business<br />
training, almost half <strong>of</strong> lobstermen surveyed say<br />
they would not take advantage <strong>of</strong> business training if it<br />
were made available.<br />
Do <strong>New</strong> <strong>England</strong> lobstermen have plans<br />
for retirement?<br />
Maine lobstermen who fish in LCMA 1 are less likely<br />
than any other group to have retirement benefits:<br />
70% <strong>of</strong> respondents in LCMA 3 said they or someone<br />
in their household has retirement benefits, compared<br />
with 51% <strong>of</strong> Maine lobstermen in LCMA 1.<br />
100 %<br />
90 %<br />
80 %<br />
70 %<br />
60 %<br />
50 %<br />
40 %<br />
30 %<br />
20 %<br />
10 %<br />
0 %<br />
LCMA 1 ME LCMA 1 LCMA 2 LCMA 3<br />
NH/MA<br />
Figure 18: Percent <strong>of</strong> active lobstermen with<br />
retirement plans by LCMA.<br />
<strong>Lobster</strong>men Compared with Other Self-Employed Americans<br />
In 2006, the National Association for the Self Employed conducted a survey <strong>of</strong> 3031 self-employed<br />
individuals that showed 66% were saving for retirement. This suggests that Maine lobstermen lag<br />
behind other self-employed individuals in terms <strong>of</strong> retirement planning. At 58%, LCMA 1 lobstermen<br />
in <strong>New</strong> Hampshire and Massachusetts are also behind, although lobstermen in LCMA 2 (66%) and<br />
LCMA 3 (70%) are on par with the national average.<br />
More lobstermen in LCMA 1 than anywhere else plan to “never retire”. Although only 4% <strong>of</strong> lobstermen<br />
in LCMA 3 and 1% LCMA 2 plan not to retire, in LCMA 1, 9% <strong>of</strong> Maine lobstermen and 14% <strong>of</strong><br />
MA and NH lobstermen plan to continue working indefinitely.<br />
31
What We Learned - Key Findings <strong>of</strong> the <strong>Survey</strong><br />
How Vulnerable are <strong>Lobster</strong> Fishing Families to a Potential Drop in Landings?<br />
32<br />
Do lobstermen and their families have<br />
health coverage?<br />
Among active lobstermen, almost a quarter have no<br />
insurance for anyone in their household. By contrast,<br />
84.3 percent <strong>of</strong> the US population had health insurance<br />
coverage in 2004, with 15.7% <strong>of</strong> the population<br />
without health insurance. And in <strong>New</strong> <strong>England</strong>, the<br />
percentage <strong>of</strong> people without health insurance using<br />
a 3-year average for 2002-2004 was approximately<br />
10.6 percent, well below the rate for the lobstermen<br />
surveyed (DeNavas-Walt, et al., 2005).<br />
Among those lobstermen surveyed that reported they<br />
had health insurance, about a third get their health<br />
insurance through the spouse’s place <strong>of</strong> employment;<br />
25% indicate their health care coverage is through a<br />
state or federal program, like Medicare or Medicaid,<br />
and another quarter indicate that health insurance<br />
costs are paid out <strong>of</strong> pocket.<br />
Among active lobstermen who have health insurance<br />
coverage for someone in the household, eighty-five<br />
percent report this insurance is full coverage while<br />
about 15% say the insurance is catastrophic only.<br />
Respondents were asked to describe their health insurance<br />
coverage, and were classified as “insured”<br />
(full coverage), “underinsured” (catastrophic coverage<br />
only) or “uninsured” (no coverage). Approximately<br />
25% (+/- 3.8%) <strong>of</strong> lobstermen from Maine in<br />
LCMA 1 are underinsured while only 6.9% (5.6%) <strong>of</strong><br />
<strong>New</strong> Hampshire and Massachusetts residents fishing<br />
in LCMA 1 reported that they were underinsured.<br />
Traditional Fishing Families: Are younger<br />
generations preparing to enter the<br />
lobster fishery?<br />
All lobstermen with children were asked about their<br />
plans for their childrens’ future. Thirty percent <strong>of</strong> respondents<br />
had no plans because their children were<br />
grown and “on their own”. Twenty percent said they<br />
are saving for their child’s planned college education,<br />
but <strong>of</strong>fered no specific details on their type <strong>of</strong> savings<br />
plan. More than 10% <strong>of</strong> respondents said they had no<br />
plans for their childrens’ education or training.<br />
Of those lobstermen with children, roughly half said<br />
their children were either currently involved in or intend<br />
to make a career in the lobster industry. Mainers<br />
were significantly more likely to have children who<br />
are involved in or intend to enter the lobster fishery.<br />
70 %<br />
60 %<br />
50 %<br />
40 %<br />
30 %<br />
20 %<br />
10 %<br />
0 %<br />
LCMA 1 ME LCMA 1<br />
NH/MA<br />
LCMA 2 LCMA 3<br />
Figure 19: Percent <strong>of</strong> lobstermen with children who<br />
are in the lobster fishery or plan to enter the<br />
lobster fishery by LCMA.
Summary and Conclusions<br />
It is difficult to make generalizations about the <strong>New</strong><br />
<strong>England</strong> <strong>Lobster</strong> Fishery. Characteristics <strong>of</strong> the population<br />
vary according to geographic area, whether<br />
lobstermen fish seasonally or year-round, and a<br />
number <strong>of</strong> other distinctions. The upsurge in landings<br />
that occurred in the 1990’s may have increased<br />
participation in the lobster fishery. However, the average<br />
age <strong>of</strong> <strong>New</strong> <strong>England</strong> lobstermen (roughly 50<br />
years old) suggests that most lobstermen have arrived<br />
at their current position after a long history in<br />
the lobster fishery (an average <strong>of</strong> 30 years).<br />
Despite the increase in effort in Maine in recent<br />
years, substantial latent effort still exists throughout<br />
<strong>New</strong> <strong>England</strong>. Increases in effort could put<br />
more pressure on the resource and potentially reduce<br />
pr<strong>of</strong>itability for existing full-time fishermen.<br />
Attempts to reduce effort by reducing trap limits<br />
would impact only the most active fishermen and<br />
could, by increasing catch per trap, create incentives<br />
for activation <strong>of</strong> latent capacity.<br />
Although there are some lobster license holders<br />
that are making substantial revenues from lobstering,<br />
the net incomes <strong>of</strong> lobstermen after accounting<br />
for operating expenses are not high, on average,<br />
even for lobstermen that fished during more<br />
than two quarters in 2005. Recent increases in fuel<br />
cost will have further eroded pr<strong>of</strong>itability.<br />
However, they are on par with other self-employed<br />
individuals when comparing retirement planning.<br />
One area <strong>of</strong> concern is that over half <strong>of</strong> active lobstermen<br />
use personal or family savings as a method<br />
to finance their lobster business, and about 1 in 5<br />
use personal or family credit cards.<br />
While the active lobsterman who participated in<br />
this survey had an average household income that<br />
was above the 3-year median for most <strong>of</strong> the country,<br />
that income was based primarily on lobster<br />
landings. The families <strong>of</strong> <strong>New</strong> <strong>England</strong> lobstermen,<br />
particularly those in northern <strong>New</strong> <strong>England</strong>, are<br />
dependent on the continued health <strong>of</strong> the lobster<br />
fishery to sustain the majority <strong>of</strong> their household<br />
income. This is especially true in Downeast Maine<br />
where there are fewer options for comparably pr<strong>of</strong>itable<br />
occupations. These findings are unlikely to<br />
surprise those familiar with the <strong>New</strong> <strong>England</strong> lobster<br />
fishery. The data on the socioeconomic health<br />
<strong>of</strong> the lobster fishery presented by this report provides<br />
a critical baseline against which we can check<br />
the pulse <strong>of</strong> the lobster industry over time.<br />
<strong>Lobster</strong>men lag behind others in the region in<br />
terms <strong>of</strong> percentage <strong>of</strong> health insurance coverage.<br />
33
Appendix<br />
Inactive <strong>Lobster</strong>men<br />
Demographic Characteristics<br />
The average age <strong>of</strong> the inactive lobstermen surveyed is 53.<br />
About 85% live in households with 1 or more other people,<br />
with about a third <strong>of</strong> those living in households with children<br />
under the age <strong>of</strong> 18. Among inactive lobstermen, eight in ten<br />
have at least a high school diploma or G.E.D., 14% have a<br />
Bachelor’s degree, and 8% hold a graduate degree.<br />
<strong>Lobster</strong>ing in 2000-2004<br />
Only about two in ten inactive lobstermen in 2005 landed<br />
more than 1000 pounds <strong>of</strong> lobster in any year from 2000 to<br />
2004. The main reasons they did not actively use their lobster<br />
permit in 2000 through 2004 were that they were lobstering<br />
part-time only, had another job or occupation, were not<br />
lobstering due to health reasons, or were fishing for personal<br />
use or recreation only.<br />
Involvement in the <strong>Lobster</strong> Industry<br />
On average, most inactive lobstermen were involved in the<br />
lobster industry an average <strong>of</strong> 26 years and had held a commercial<br />
lobster license or permit for 22 years.<br />
Among inactive lobstermen, over half plan to increase their<br />
lobstering activity in the future; furthermore, almost half <strong>of</strong><br />
those who plan to increase their lobstering in the future expect<br />
it to become the primary source <strong>of</strong> income.<br />
Among inactive lobstermen, one quarter indicate that their<br />
children are involved in or intend to lobster as a career.<br />
Other Fishing Activities<br />
Four in ten inactive lobstermen hold other state fishing licenses<br />
or permits. The most common permits among inactive<br />
lobstermen include state licenses or permits for Striped Bass,<br />
Multi-species permits, and Commercial Fishing. Among inactive<br />
lobstermen who hold federal fishing permits, 20% hold<br />
a federal permit for American <strong>Lobster</strong>, 18% have a federal<br />
Northeast Multi-species permit, and 16% hold a federal permit<br />
for Monkfish.<br />
About 1 in 5 inactive lobstermen earned income from other<br />
fishing activities. Among those who earned income from other<br />
fishing, 20% earned income from Striped Bass, while 13%<br />
earned income from Commercial Fishing, and 10% from Sea<br />
Bass.<br />
Household Income<br />
Among inactive lobstermen, the average household income<br />
reported is $56,495. Among those who earned income from<br />
other fishing activities, 39% <strong>of</strong> household income, on average,<br />
came from these other fishing activities in 2005.<br />
References<br />
DeNavas-Walt, Carmen, Bernadette D. Proctor, and Cheryl<br />
Hill Lee, U.S. Census Bureau, Current Population Reports,<br />
P60-229, Income, Poverty, and Health Insurance Coverage<br />
in the United States: 2004, U.S. Government Printing Office,<br />
Washington, DC, 2005<br />
Hall-Arber, Madeleine, Chris Dyer, John Poggie, James Mc-<br />
Nally, and Renee Gagne, <strong>New</strong> <strong>England</strong>’s Fishing Communities,<br />
data? Found at http://seagrant.mit.edu/cmss/marfin<br />
35