stratigraphy and oil shale potential - Geology Ontario
stratigraphy and oil shale potential - Geology Ontario
stratigraphy and oil shale potential - Geology Ontario

Create successful ePaper yourself
Turn your PDF publications into a flip-book with our unique Google optimized e-Paper software.
THESE TERMS GOVERN YOUR USE OF THIS DOCUMENT<br />
Your use of this <strong>Ontario</strong> Geological Survey document (the “Content”) is governed by the<br />
terms set out on this page (“Terms of Use”). By downloading this Content, you (the<br />
“User”) have accepted, <strong>and</strong> have agreed to be bound by, the Terms of Use.<br />
Content: This Content is offered by the Province of <strong>Ontario</strong>’s Ministry of Northern Development <strong>and</strong><br />
Mines (MNDM) as a public service, on an “as-is” basis. Recommendations <strong>and</strong> statements of opinion<br />
expressed in the Content are those of the author or authors <strong>and</strong> are not to be construed as statement of<br />
government policy. You are solely responsible for your use of the Content. You should not rely on the<br />
Content for legal advice nor as authoritative in your particular circumstances. Users should verify the<br />
accuracy <strong>and</strong> applicability of any Content before acting on it. MNDM does not guarantee, or make any<br />
warranty express or implied, that the Content is current, accurate, complete or reliable. MNDM is not<br />
responsible for any damage however caused, which results, directly or indirectly, from your use of the<br />
Content. MNDM assumes no legal liability or responsibility for the Content whatsoever.<br />
Links to Other Web Sites: This Content may contain links, to Web sites that are not operated by MNDM.<br />
Linked Web sites may not be available in French. MNDM neither endorses nor assumes any<br />
responsibility for the safety, accuracy or availability of linked Web sites or the information contained on<br />
them. The linked Web sites, their operation <strong>and</strong> content are the responsibility of the person or entity for<br />
which they were created or maintained (the “Owner”). Both your use of a linked Web site, <strong>and</strong> your right<br />
to use or reproduce information or materials from a linked Web site, are subject to the terms of use<br />
governing that particular Web site. Any comments or inquiries regarding a linked Web site must be<br />
directed to its Owner.<br />
Copyright: Canadian <strong>and</strong> international intellectual property laws protect the Content. Unless otherwise<br />
indicated, copyright is held by the Queen’s Printer for <strong>Ontario</strong>.<br />
It is recommended that reference to the Content be made in the following form: ,<br />
. ; <strong>Ontario</strong> Geological Survey, , p.<br />
Use <strong>and</strong> Reproduction of Content: The Content may be used <strong>and</strong> reproduced only in accordance with<br />
applicable intellectual property laws. Non-commercial use of unsubstantial excerpts of the Content is<br />
permitted provided that appropriate credit is given <strong>and</strong> Crown copyright is acknowledged. Any substantial<br />
reproduction of the Content or any commercial use of all or part of the Content is prohibited without the<br />
prior written permission of MNDM. Substantial reproduction includes the reproduction of any illustration or<br />
figure, such as, but not limited to graphs, charts <strong>and</strong> maps. Commercial use includes commercial<br />
distribution of the Content, the reproduction of multiple copies of the Content for any purpose whether or<br />
not commercial, use of the Content in commercial publications, <strong>and</strong> the creation of value-added products<br />
using the Content.<br />
Contact:<br />
FOR FURTHER<br />
INFORMATION ON<br />
The Reproduction of<br />
Content<br />
The Purchase of<br />
MNDM Publications<br />
PLEASE CONTACT: BY TELEPHONE: BY E-MAIL:<br />
MNDM Publication<br />
Services<br />
MNDM Publication<br />
Sales<br />
Local: (705) 670-5691<br />
Toll Free: 1-888-415-9845, ext.<br />
5691 (inside Canada,<br />
United States)<br />
Local: (705) 670-5691<br />
Toll Free: 1-888-415-9845, ext.<br />
5691 (inside Canada,<br />
United States)<br />
Crown Copyright Queen’s Printer Local: (416) 326-2678<br />
Toll Free: 1-800-668-9938<br />
(inside Canada,<br />
United States)<br />
Pubsales@ndm.gov.on.ca<br />
Pubsales@ndm.gov.on.ca<br />
Copyright@gov.on.ca
LES CONDITIONS CI-DESSOUS RÉGISSENT L'UTILISATION DU PRÉSENT DOCUMENT.<br />
Votre utilisation de ce document de la Commission géologique de l'<strong>Ontario</strong> (le « contenu »)<br />
est régie par les conditions décrites sur cette page (« conditions d'utilisation »). En<br />
téléchargeant ce contenu, vous (l'« utilisateur ») signifiez que vous avez accepté d'être lié<br />
par les présentes conditions d'utilisation.<br />
Contenu : Ce contenu est offert en l'état comme service public par le ministère du Développement du Nord<br />
et des Mines (MDNM) de la province de l'<strong>Ontario</strong>. Les recomm<strong>and</strong>ations et les opinions exprimées dans le<br />
contenu sont celles de l'auteur ou des auteurs et ne doivent pas être interprétées comme des énoncés<br />
officiels de politique gouvernementale. Vous êtes entièrement responsable de l'utilisation que vous en faites.<br />
Le contenu ne constitue pas une source fiable de conseils juridiques et ne peut en aucun cas faire autorité<br />
dans votre situation particulière. Les utilisateurs sont tenus de vérifier l'exactitude et l'applicabilité de tout<br />
contenu avant de l'utiliser. Le MDNM n'offre aucune garantie expresse ou implicite relativement à la mise à<br />
jour, à l'exactitude, à l'intégralité ou à la fiabilité du contenu. Le MDNM ne peut être tenu responsable de tout<br />
dommage, quelle qu'en soit la cause, résultant directement ou indirectement de l'utilisation du contenu. Le<br />
MDNM n'assume aucune responsabilité légale de quelque nature que ce soit en ce qui a trait au contenu.<br />
Liens vers d'autres sites Web : Ce contenu peut comporter des liens vers des sites Web qui ne sont pas<br />
exploités par le MDNM. Certains de ces sites pourraient ne pas être offerts en français. Le MDNM se<br />
dégage de toute responsabilité quant à la sûreté, à l'exactitude ou à la disponibilité des sites Web ainsi reliés<br />
ou à l'information qu'ils contiennent. La responsabilité des sites Web ainsi reliés, de leur exploitation et de<br />
leur contenu incombe à la personne ou à l'entité pour lesquelles ils ont été créés ou sont entretenus (le<br />
« propriétaire »). Votre utilisation de ces sites Web ainsi que votre droit d'utiliser ou de reproduire leur<br />
contenu sont assujettis aux conditions d'utilisation propres à chacun de ces sites. Tout commentaire ou toute<br />
question concernant l'un de ces sites doivent être adressés au propriétaire du site.<br />
Droits d'auteur : Le contenu est protégé par les lois canadiennes et internationales sur la propriété<br />
intellectuelle. Sauf indication contraire, les droits d'auteurs appartiennent à l'Imprimeur de la Reine pour<br />
l'<strong>Ontario</strong>.<br />
Nous recomm<strong>and</strong>ons de faire paraître ainsi toute référence au contenu : nom de famille de l'auteur, initiales,<br />
année de publication, titre du document, Commission géologique de l'<strong>Ontario</strong>, série et numéro de<br />
publication, nombre de pages.<br />
Utilisation et reproduction du contenu : Le contenu ne peut être utilisé et reproduit qu'en conformité avec<br />
les lois sur la propriété intellectuelle applicables. L'utilisation de courts extraits du contenu à des fins non<br />
commerciales est autorisé, à condition de faire une mention de source appropriée reconnaissant les droits<br />
d'auteurs de la Couronne. Toute reproduction importante du contenu ou toute utilisation, en tout ou en partie,<br />
du contenu à des fins commerciales est interdite sans l'autorisation écrite préalable du MDNM. Une<br />
reproduction jugée importante comprend la reproduction de toute illustration ou figure comme les<br />
graphiques, les diagrammes, les cartes, etc. L'utilisation commerciale comprend la distribution du contenu à<br />
des fins commerciales, la reproduction de copies multiples du contenu à des fins commerciales ou non,<br />
l'utilisation du contenu dans des publications commerciales et la création de produits à valeur ajoutée à l'aide<br />
du contenu.<br />
Renseignements :<br />
POUR PLUS DE<br />
RENSEIGNEMENTS SUR<br />
la reproduction du<br />
contenu<br />
l'achat des<br />
publications du MDNM<br />
les droits d'auteurs de<br />
la Couronne<br />
VEUILLEZ VOUS<br />
ADRESSER À :<br />
Services de<br />
publication du MDNM<br />
Vente de publications<br />
du MDNM<br />
Imprimeur de la<br />
Reine<br />
PAR TÉLÉPHONE : PAR COURRIEL :<br />
Local : (705) 670-5691<br />
Numéro sans frais : 1 888 415-9845,<br />
poste 5691 (au Canada et aux<br />
États-Unis)<br />
Local : (705) 670-5691<br />
Numéro sans frais : 1 888 415-9845,<br />
poste 5691 (au Canada et aux<br />
États-Unis)<br />
Local : 416 326-2678<br />
Numéro sans frais : 1 800 668-9938<br />
(au Canada et aux<br />
États-Unis)<br />
Pubsales@ndm.gov.on.ca<br />
Pubsales@ndm.gov.on.ca<br />
Copyright@gov.on.ca
<strong>Ontario</strong><br />
Ministry of Mines <strong>and</strong><br />
Northern Development Minerals<br />
<strong>and</strong> Mines Division<br />
ONTARIO GEOLOGICAL SURVEY<br />
Open File Report 5716<br />
Stratigraphy <strong>and</strong> Oil Shale Resource Potential<br />
of the Middle Devonian Marcellus Formation,<br />
Southwestern <strong>Ontario</strong><br />
by<br />
M.D. Johnson, P.G. Telford, G. Macauley <strong>and</strong> J.F. Barker<br />
1989<br />
Parts of this publication may be quoted if credit is<br />
given. It is recommended that reference to this<br />
publication be made in the following form:<br />
Johnson, M.D., Telford, P.G., Macauley, G. <strong>and</strong> Barker, J.F.<br />
1989. Stratigraphy <strong>and</strong> <strong>oil</strong> <strong>shale</strong> resource <strong>potential</strong> of<br />
the Middle Devonian Marcellus Formation, southwestern<br />
<strong>Ontario</strong>; <strong>Ontario</strong> Geological Survey, Open File Report 5716,<br />
149p.<br />
HERP (Hydrocarbon Energy Resources Program)<br />
This program, carried out during 1981-1986, was funded by the<br />
<strong>Ontario</strong> Ministry of Treasury <strong>and</strong> Economics under the Board of<br />
Industrial Leadership <strong>and</strong> Development (BILD) program.<br />
Queen's Printer for <strong>Ontario</strong> 1989<br />
Printed in <strong>Ontario</strong>, Canada
<strong>Ontario</strong> Geological Survey<br />
OPEN FILE REPORT<br />
Open File Reports are made available to the public subject to the following<br />
conditions:<br />
This report is unedited. Discrepancies may occur for which the <strong>Ontario</strong> Geological<br />
Survey does not assume liability. Recommendations <strong>and</strong> statements of opinions expressed<br />
are those of the author or authors <strong>and</strong> are not to be construed as statements of govern<br />
ment policy.<br />
This Open File Report is available for viewing at the following locations:<br />
(1) Mines Library<br />
Ministry of Northern Development <strong>and</strong> Mines<br />
8th floor, 77 Grenville Street<br />
Toronto, <strong>Ontario</strong> M7A 1W4<br />
(2) The office of the Regional or Resident Geologist in whose district the area<br />
covered by this report is located.<br />
Copies of this report may be obtained at the user's expense from a commercial<br />
printing house. For the address <strong>and</strong> instructions to order, contact the appropriate<br />
Regional or Resident Geologist's offices) or the Mines Library. Microfiche copies<br />
(42x reduction) of this report are available for S2.00 each plus provincial sales tax at the<br />
Mines Library or the Public Information Centre, Ministry of Natural Resources, W-1640,<br />
99 Wellesley Street West, Toronto.<br />
H<strong>and</strong>written notes <strong>and</strong> sketches may be made from this report. Check with the<br />
Mines Library or Regional/Resident Geologist's office whether there is a copy of this<br />
report that may be borrowed. A copy of this report is available for Inter-Library Loan.<br />
This report is available for viewing at the following Regional or Resident Geologists'<br />
offices:<br />
Minerals Specialist - Box 3000, Hwy. 28, Bancroft KOL ICO<br />
Southeastern - B.S. 43, Old Troy Rd, Tweed KOK 3JO<br />
Southwestern - Box 5463, 659 Exeter Rd, London N6A 4L6<br />
Sudbury - Bag 3000, 6th Floor, 200 Brady St, Sudbury P3A 5W2<br />
The right to reproduce this report is reserved by the <strong>Ontario</strong> Ministry of Northern<br />
Development <strong>and</strong> Mines. Permission for other reproductions must be obtained in writing<br />
from the Director, <strong>Ontario</strong> Geological Survey.<br />
V.G. Milne, Director<br />
<strong>Ontario</strong> Geological Survey<br />
111
FOREWORD<br />
The Hydrocarbon Energy Resources Program consisted of<br />
four main components. The <strong>Ontario</strong> Geological Survey (of the<br />
Ministry of Northern Development <strong>and</strong> Mines) carried out<br />
inventories <strong>and</strong> assessments of the peat, lignite <strong>and</strong> <strong>oil</strong><br />
<strong>shale</strong>s resources of the Province. At the same time the<br />
Petroleum Resources Section (of the Ministry of Natural<br />
Resources) in Southwestern Region reviewed conventional <strong>oil</strong><br />
<strong>and</strong> gas resources.<br />
This report is one of the four final reports considering<br />
the <strong>oil</strong> <strong>shale</strong> resources of the Province. Although largely<br />
researched <strong>and</strong> compiled by O.G.S. staff, the report also<br />
includes significant contributions from a diverse group of<br />
private consultants <strong>and</strong> university researchers.<br />
The report describes the <strong>oil</strong> <strong>shale</strong> resource <strong>potential</strong> of<br />
the Middle Devonian Marcellus Formation - a largely black<br />
<strong>shale</strong> unit which underlies part of southwestern <strong>Ontario</strong> <strong>and</strong><br />
north central Lake Erie. Important new data on the<br />
<strong>stratigraphy</strong> <strong>and</strong> regional correlation of the formation are<br />
also discussed.<br />
V.G. Milne, Director<br />
<strong>Ontario</strong> Geological Survey<br />
v
CONTENTS<br />
Page<br />
1. INTRODUCTION l<br />
1.1 Program Review l<br />
1.2 Oil Shale Concepts <strong>and</strong> Definitions 2<br />
1.3 Oil Shale Assessment Project 5<br />
1.4 Project Participants <strong>and</strong> Acknowledgments 9<br />
2. PALEOZOIC GEOLOGY OF SOUTHERN ONTARIO 12<br />
2.1 Structural <strong>and</strong> Paleogeographic Setting 12<br />
2.2 Stratigraphy of Southwestern <strong>Ontario</strong> 22<br />
2.3 Eastern Gas Shales 44<br />
3. STRATIGRAPHY OF THE MARCELLUS FORMATION 53<br />
3.1 Introduction 53<br />
3.2 Historical Review 57<br />
3.3 Distribution 59<br />
3.4 Thickness 69<br />
3.5 Lithology 71<br />
3.6 Stratigraphic Relationships 78<br />
3.7 Depositional Relationships 86<br />
4. GEOCHEMISTRY 90<br />
4.1 Inorganic 90<br />
4.2 Organic 94<br />
5. RESOURCE EVALUATION 100<br />
5.1 L<strong>and</strong> Accessible Resource Estimate 101<br />
5.2 Total Canadian Formation Evaluation 106<br />
5.3 Development Considerations 107<br />
6. REFERENCES 109<br />
APPENDIX I - Organic Geochemical Techniques 121<br />
APPENDIX 2 138<br />
APPENDIX 3 146<br />
Vll
LIST OF FIGURES<br />
Page<br />
Fig. l Paleozoic geology of southern <strong>Ontario</strong> . . . . . . . . . 10<br />
Fig. 2 Major structural <strong>and</strong> paleogeographic<br />
elements of southern <strong>Ontario</strong> ................. 15<br />
Fig. 3 Devonian succession of southwestern <strong>Ontario</strong> ... 18<br />
Fig. 4 Major fracture systems in the Paleozoic rocks<br />
of southwestern <strong>Ontario</strong> . . . . . . . . . ......... . . . . . 20<br />
Fig. 5 Location of deep drillholes of the Oil Shale<br />
Assessment Project ......... . . ............... . . 23<br />
Fig. 6 Distribution of Devonian black <strong>shale</strong>s in<br />
eastern North America ......................... 46<br />
Fig. 7 Diagrammatic representation of stratigraphic<br />
relationships of the Devonian black <strong>shale</strong>s of<br />
eastern North America .. . . . . . . .......... . . . . . . . 51<br />
Fig. 8 Location of OGS drillholes M5 to M9 <strong>and</strong> 82-3,<br />
Port Stanley area .. . . . . . . ...... . . ..... ..... . . . 54<br />
Fig. 9 Comparison of geophysical logs for OGS drill<br />
holes M6 <strong>and</strong> 82-2, Chatham .................. . . 61<br />
Fig. 10 Evolution of gamma ray log responses between<br />
adjacent drillholes in Lake Erie .............. 65<br />
Fig. li Comparison of gamma ray log responses in wells<br />
from the eastern <strong>and</strong> western subsurface areas .. 67<br />
Fig. 12 Cross Section of OGS cored holes through the<br />
Marcellus Formation ...... ..................... 74<br />
Fig. 13 Distribution of the Middle Devonian black<br />
organic <strong>shale</strong> facies in the Appalachian Basin .. 84<br />
Fig. 14 Rock-Eval pyrolysis cycle <strong>and</strong> typical detector<br />
response ....................................... 136<br />
MAPS<br />
Isopach of the Marcellus Formation ...,...... .. .... .. . . back<br />
pocket<br />
IX
LIST OF TABLES<br />
Page<br />
Table l Paleozoic <strong>oil</strong> <strong>shale</strong>s of <strong>Ontario</strong><br />
investigated by the <strong>Ontario</strong> Geological<br />
Survey . . . . . . . . . . . . . . . . . . . . . . . . . . . . .......... 7<br />
Table 2 Paleozoic stratigraphic nomenclature of<br />
southern <strong>Ontario</strong> currently in use by the<br />
<strong>Ontario</strong> Geological Survey. Note <strong>potential</strong><br />
<strong>oil</strong> <strong>shale</strong> intervals . . . . . . . . . . . . . . . . . . . ...... 25<br />
Table 3 Middle Ordovician carbonate units inter<br />
sected in deep drillholes of the Oil Shale<br />
Assessment Project . . . . . . . . . . . . . . . . . . . . . ..... 29<br />
Table 4 Summary of results for OGS drillholes M5 to<br />
M9 <strong>and</strong> 82-3, Port Stanley area . . . . . . . . . . . . . . 55<br />
Table 5 Organic geochemical data for the Marcellus<br />
Formation <strong>and</strong> adjacent units . .. . . . . ... . . . ... 62<br />
Table 6 Thickness <strong>and</strong> average total organic carbon<br />
values for Marcellus units in OGS drill<br />
cores . . . . . . . . . . . . . . . . . . . . . . . . . . . . . . . . . . ..... 66<br />
Table 7 Lithostratigraphic correlation of the<br />
Marcellus Formation . . . . . . . . . . . . . . . . . . . . . . . . . 80<br />
Table 8 Major elements in the Bell, Marcellus <strong>and</strong><br />
Dundee Formations . . . . . . . . . . . . . . . . . . . . . . . . . . . 91<br />
Table 9 Major <strong>and</strong> trace element values of the<br />
Marcellus Formation . . . . . . . . . . . . . . . . . . . . . . . . . 93<br />
Table 10 Total organic carbon (TOG) determinations<br />
for well cutting samples of the Marcellus<br />
Formation ................................... 95<br />
Table 11 Regression equation parameters <strong>and</strong> predicted<br />
Fischer Assay yields for hypothetical<br />
samples with 10% T.O.C. ..................... 98<br />
Table 12 Marcellus Formation, Fischer Assay <strong>and</strong><br />
Rock-Eval Analyses . ... . ............ ..... . . . . 102<br />
Table 13 Comparison of TOC results from organic<br />
geochemistry (University of Waterloo) with<br />
other laboratories .......................... 127<br />
Table 14 Replicate Analyses from a Collingwood sample<br />
- Bitumen Pyrolysate . . . . .. .. .. .... ... ... . . . . 134<br />
XI
ABSTRACT<br />
There are several <strong>shale</strong> formations in southern <strong>Ontario</strong> which<br />
are capable of yielding hydrocarbons when heated. Of these<br />
units the Middle Devonian Marcellus Formation is probably<br />
the least well known. This study looks at both the<br />
<strong>stratigraphy</strong> <strong>and</strong> resource <strong>potential</strong> of this formation. The<br />
work is based on a combination of drilling <strong>and</strong> organic<br />
chemical investigations made of the unit. Extensive use was<br />
made of down-hole geophysics which provided good corellation<br />
between drill holes <strong>and</strong> aided in the identification of<br />
organic rich zones. Results of this study although not<br />
conclusive due to the small data set used suggest the<br />
following points: the Marcellus Formation is deeply buried<br />
below a combination of rock <strong>and</strong> glacial material, requiring<br />
the use of subsurface mining technology for extraction; the<br />
organic rich zones in the unit, although they cover an area<br />
of several hundred square kilometers are thin (one or two<br />
meters) making economic resource extraction unlikley based<br />
on present day <strong>oil</strong> prices. Results from the organic chemical<br />
analyses suggest the unit is of moderate hydrocarbon yield<br />
relative to the other <strong>oil</strong> <strong>shale</strong>s present in <strong>Ontario</strong>.<br />
Xlll
ONTARIO GEOLOGICAL SURVEY<br />
Open File Report<br />
Stratigraphy <strong>and</strong> Oil Shale Resource<br />
Potential of the Middle Devonian Marcellus Formation<br />
Southwestern <strong>Ontario</strong><br />
by<br />
M.D. Johnson-<br />
P.G. Telford<br />
George Macauley<br />
J.F. Barker<br />
Supervisor, Acting) Paleozoic/Mesozoic <strong>Geology</strong> Subsection<br />
Engineering <strong>and</strong> Terrain <strong>Geology</strong> Section<br />
<strong>Ontario</strong> Geological Survey<br />
2 Manager, Mineral Development Section<br />
Mineral Development <strong>and</strong> L<strong>and</strong>s Branch<br />
(formerly Supervisor, Paleozoic/Mesozoic <strong>Geology</strong> Section)<br />
Janshar Mineral Explorations Ltd.<br />
8-5400 Dalhouse Drive NW<br />
Calgary, Alberta T3A 2B4<br />
4 Dept. of Earth Sciences<br />
University of Waterloo<br />
Waterloo, <strong>Ontario</strong> N2L 3G1<br />
Manuscript approved for publication by V.G. Milne, Director,<br />
<strong>Ontario</strong> Geological Survey, January 17, 1989.<br />
This report is published with the permission of V.G. Milne,<br />
Director, <strong>Ontario</strong> Geological Survey, Toronto.<br />
xv
l. INTRODUCTION<br />
l.l Program Review<br />
Evaluation of the hydrocarbon resource <strong>potential</strong> of <strong>oil</strong><br />
<strong>shale</strong>s in <strong>Ontario</strong> was an activity of the Hydrocarbon Energy<br />
Resources Program (HERP). This program was initiated in 1981,<br />
with funding supplied by the <strong>Ontario</strong> Ministry of Treasury <strong>and</strong><br />
Economics for a five year term ending March 31st 1986.<br />
Development of HERP was in response to an <strong>Ontario</strong><br />
government decision, made in the Fall of 1979, that the<br />
province should endeavour to raise its energy self-sufficiency<br />
from the then current level of 23%. A target of 37.5% energy<br />
self-sufficiency by 1995 was established. As part of the 1979<br />
decision, the <strong>Ontario</strong> Geological Survey was given the m<strong>and</strong>ate<br />
to carry out an inventory of the province's hydrocarbon energy<br />
resources <strong>and</strong> to determine the contribution that they could<br />
make to greater energy self-sufficiency.<br />
HERP consisted of four major components corresponding to<br />
the four types of hydrocarbon deposits known to be present in<br />
the province. The <strong>Ontario</strong> Geological Survey has been<br />
responsible for conducting inventories <strong>and</strong> evaluations of<br />
peat, lignite, <strong>and</strong> <strong>oil</strong> <strong>shale</strong> resources. The Petroleum<br />
Resources Section (<strong>Ontario</strong> Ministry of Natural Resources) in<br />
London was assigned to review the province's reserves <strong>and</strong>
<strong>potential</strong> resources of conventional <strong>oil</strong> <strong>and</strong> natural gas.<br />
These wide-ranging, multi-facetted activities were carried out<br />
through a combination of provincial government surveys,<br />
university-based research projects, <strong>and</strong> studies contracted to<br />
private geological <strong>and</strong> engineering consulting firms. In<br />
addition, close liaison was maintained with relevant<br />
departments of the federal government, <strong>and</strong> other provincial<br />
governments, to facilitate vital information exchange <strong>and</strong> co<br />
operative ventures. Overall management <strong>and</strong> co-ordination of<br />
the program <strong>and</strong> dissemination of results were the<br />
responsibility of the <strong>Ontario</strong> Geological Survey.<br />
This report is one of four final reports dealing with the<br />
component of HERP that has become known as the Oil Shale<br />
Assessment Project. The principal objective of this project<br />
was to determine the hydrocarbon resource <strong>potential</strong> of the <strong>oil</strong><br />
<strong>shale</strong>s in <strong>Ontario</strong>. This was the most comprehensive study of<br />
specific <strong>oil</strong> <strong>shale</strong> resources conducted to date in Canada.<br />
1.2 Oil Shale Concepts <strong>and</strong> Definitions<br />
An "<strong>oil</strong> <strong>shale</strong>" is not necessarily a <strong>shale</strong> <strong>and</strong> it does not<br />
contain <strong>oil</strong> in the same sense as conventional <strong>oil</strong> deposits.<br />
Because usage of the term arose long before there was<br />
underst<strong>and</strong>ing of the geological nature of the deposits in<br />
question, or of the character of the organic components in the<br />
rocks, "<strong>oil</strong> <strong>shale</strong>" has been one of the most loosely defined<br />
geological terms (Macauley, 1984). Clarification of this
situation is provided by Macauley (1984) <strong>and</strong> Macauley et al.<br />
(1985). Their definition of <strong>oil</strong> <strong>shale</strong>, which has been used in<br />
the <strong>Ontario</strong> Geological Survey investigations, is as follows:<br />
Oil <strong>shale</strong> is a fine grained, sedimentary rock,<br />
containing indigenous organic matter that is<br />
mainly insoluble in ordinary petroleum solvents,<br />
<strong>and</strong> from which significant amounts of <strong>shale</strong> <strong>oil</strong><br />
can be extracted by pyrolysis (i.e. heating in a<br />
retort).<br />
Several of the terms in this definition require further<br />
explanation.<br />
For example, the phrase "significant amounts" is<br />
somewhat open-ended but justification of its use is described<br />
by Macauley et al. (1985, p.2) as follows.<br />
"The temperature of pyrolysis [of <strong>oil</strong> <strong>shale</strong>s] seldom<br />
exceeds 500 O to 600 OC as, above these temperatures, additional<br />
yield of <strong>shale</strong> <strong>oil</strong> is low, <strong>and</strong> breakdown occurs for some of<br />
the inorganic rock constituents, especially dolomite.<br />
energy necessary to raise the rock temperature to 500 C is<br />
approximately 150 calories/gram of rock.<br />
The<br />
The heat value of<br />
the indigenous organic material is generally 10,000<br />
calories/gram; therefore 2.5% by weight is the minimum organic<br />
content at which the amount of energy recovered as <strong>shale</strong> <strong>oil</strong><br />
could theoretically balance the input energy.<br />
This value,<br />
then, becomes the minimum organic content needed to define an<br />
<strong>oil</strong> <strong>shale</strong>, but does not allow for other energy-equivalent<br />
input (mining, transportation, etc.).<br />
U.S. literature often
quotes 10 US gallons/ton (42 litres/ tonne) as a minimum <strong>shale</strong><br />
<strong>oil</strong> yield for economic consideration, but this is an arbitrary<br />
value. n<br />
The indigenous organic matter of <strong>oil</strong> <strong>shale</strong> is mainly<br />
kerogen. This is a solid organic material, insoluble in<br />
normal organic solvents, which on heating <strong>and</strong> decomposition<br />
produces <strong>shale</strong> <strong>oil</strong>. The nature of kerogen, as determined by<br />
geochemical analysis <strong>and</strong> petrological examination, is commonly<br />
used as the basis for <strong>oil</strong> <strong>shale</strong> classification schemes (e.g.<br />
Macauley et a^. 1985).<br />
Tissot <strong>and</strong> Welte (1978) divided kerogen into three types<br />
based on atomic hydrogen/carbon ratios. Type I (H/C ^.4) is<br />
derived from algae <strong>and</strong> is commonly a non-marine deposit; Type<br />
II (H/C "Ci.4-1.2) is derived from phytoplankton <strong>and</strong> is marine;<br />
Type III (H/C ^.0) is derived from higher l<strong>and</strong> plants. Types<br />
I <strong>and</strong> II can produce <strong>oil</strong> <strong>shale</strong> while Type III produces coal.<br />
Despite these apparently simple subdivisions, kerogens can<br />
display considerable variation from deposit to deposit <strong>and</strong><br />
even between different stratigraphic levels <strong>and</strong> geographic<br />
zones in a single deposit.<br />
Shale <strong>oil</strong> is the product of pyrolysis of <strong>oil</strong> <strong>shale</strong> <strong>and</strong><br />
should not be confused with crude <strong>oil</strong> (petroleum) obtained<br />
from conventional sources. The character of <strong>shale</strong> <strong>oil</strong> depends<br />
on the type <strong>and</strong> composition of the kerogen from which it is<br />
derived but it will always be an undersaturated (i.e.<br />
hydrogen-depleted) hydrocarbon. Therefore, <strong>shale</strong> <strong>oil</strong> will
always require further refining (i.e. hydrogenation) to<br />
produce a petroleum equivalent to that from conventional <strong>oil</strong><br />
reservoirs (Macauley, 1984).<br />
There is some confusion in the literature with regard to<br />
descriptive terms commonly applied to <strong>shale</strong>s <strong>and</strong> other rocks<br />
with an organic constituent. The terms bituminous,<br />
petroliferous, kerogenous, <strong>and</strong> carbonaceous are often used<br />
incorrectly. The following guidelines should be noted.<br />
.Petroliferous rocks are those containing a liquid<br />
petroleum phase<br />
.Bituminous rocks contain soluble solid hydrocarbon.<br />
.Kerogenous rocks contain insoluble organic material<br />
(i.e. kerogen).<br />
.Carbonaceous rocks contain organic carbon <strong>and</strong> minimal<br />
hydrogen content denoting the presence of higher plant<br />
remains.<br />
1.3 Oil Shale Assessment Project<br />
According to the definitions described above, four<br />
Paleozoic stratigraphic units in <strong>Ontario</strong> may be classified as<br />
<strong>oil</strong> <strong>shale</strong>s <strong>and</strong> have been investigated as part of the Oil Shale<br />
Assessment Project (Table 1). The initial phase of the<br />
project (1981-82) included an intensive study of the Upper<br />
Ordovician rock unit commonly termed the Collingwood <strong>shale</strong> but<br />
now formally defined as the Collingwood Member of the Lindsay<br />
Formation (Russell <strong>and</strong> Telford 1983). In 1982, this work was
joined by similar investigations of the Devonian Marcellus <strong>and</strong><br />
Kettle Point Formations of southwestern <strong>Ontario</strong>. Then, in<br />
1984, the project was exp<strong>and</strong>ed to involve detailed<br />
stratigraphic study <strong>and</strong> assessment of the Upper Devonian Long<br />
Rapids Formation in the Moose River Basin (James Bay Lowl<strong>and</strong>).<br />
The data gathering activities for the three southern<br />
<strong>Ontario</strong> <strong>oil</strong> <strong>shale</strong>s followed a similar pattern but geographical<br />
<strong>and</strong> logistical constraints necessitated a somewhat different<br />
approach to evaluation of the Long Rapids Formation (Russell<br />
<strong>and</strong> Telford, 1984b). Data for the southern <strong>Ontario</strong> units were<br />
obtained mainly through outcrop examination, considerable<br />
diamond drilling, <strong>and</strong> organic geochemical analysis of selected<br />
samples. In addition, specialized sedimentological <strong>and</strong><br />
paleontological studies of key stratigraphic intervals were<br />
undertaken (e.g. Harris, 1985; Tuffnell <strong>and</strong> Ludvigsen, 1984)<br />
<strong>and</strong> the inorganic geochemistry <strong>and</strong> physical properties of<br />
particular units were also considered (e.g. Delitala, 1984;<br />
Dusseault <strong>and</strong> Loftsson 1985).<br />
Outcrops of the southern <strong>Ontario</strong> <strong>oil</strong> <strong>shale</strong>s are very<br />
meagre; the Marcellus Formation is completely buried by<br />
Pleistocene glacial <strong>and</strong> lacustrine sediments. Also, where<br />
present, outcrops of the Collingwood Member <strong>and</strong> Kettle Point<br />
Formation are of only limited stratigraphic extent. Complete<br />
sections through these units are nowhere exposed <strong>and</strong> upper <strong>and</strong><br />
lower contacts rarely appear in outcrop. Therefore,
FORMATION AGE LOCATION<br />
Collingwood Member Upper Ordovician Southcentral <strong>Ontario</strong>,<br />
(Lindsay Formation)<br />
Manitoulin Isl<strong>and</strong> <strong>and</strong><br />
St.<br />
Joseph Isl<strong>and</strong>s.<br />
Marcellus<br />
Kettle Point<br />
Long Rapids<br />
Middle Devonian<br />
Upper Devonian<br />
Upper Devonian<br />
Southwestern <strong>Ontario</strong><br />
Southwestern <strong>Ontario</strong><br />
James Bay Lowl<strong>and</strong><br />
TABLE 1. Paleozoic Oil Shales of <strong>Ontario</strong> investigated by the<br />
<strong>Ontario</strong> Geological Survey.
considerable efforts were made to obtain subsurface data to<br />
supplement the generally inadequate surface information.<br />
Over 60 shallow drillholes (aimed at specific<br />
stratigraphic intervals) <strong>and</strong> 12 deep drillholes (extending<br />
from surface to the Precambrian basement) have been completed<br />
in southern <strong>Ontario</strong> <strong>and</strong> on Manitoulin, Cockburn, <strong>and</strong> St.<br />
Joseph Isl<strong>and</strong>s in northern Lake Huron. All holes were fully<br />
cored <strong>and</strong> geophysically logged. Over 9,000 metres of core has<br />
been generated. Most of the drilling <strong>and</strong> geophysical data has<br />
already been released in a series of <strong>Ontario</strong> Geological Survey<br />
Open File Reports (Johnson, 1983, 1985; Johnson et al. 1983a,<br />
1983b, 1985).<br />
Approximately 2,000 core samples were selected from the<br />
<strong>oil</strong> <strong>shale</strong> intervals for hydrocarbon analysis. They were<br />
analyzed for total organic carbon (TOG) by rapid pyrolysis<br />
methods developed at the University of Waterloo under the<br />
direction of Dr. J.F. Barker (see Appendix 1). A number of<br />
the samples were also subjected to Fischer Assays, the<br />
traditional method of <strong>oil</strong> yield determination for <strong>oil</strong> <strong>shale</strong>s,<br />
to establish correlation between this <strong>and</strong> the rapid pyrolysis<br />
method (Stromquist et al. 1984).<br />
Samples from the Collingwood Member <strong>and</strong> Kettle Point<br />
Formation were supplied to the Institute of Sedimentary <strong>and</strong><br />
Petroleum <strong>Geology</strong> (ISPG) in Calgary for appraisal by the Rock-<br />
Eval pyrolysis method (Snowdon, 1984). Several samples of the<br />
Collingwood Member were given to CANMET (Ottawa) for testing
in the hydrogen retorting system under development by the New<br />
Brunswick Research <strong>and</strong> Productivity Council. Several samples<br />
from the Kettle Point Formation were also analyzed by the<br />
Institute of Gas Technology (IGT) in Chicago using their<br />
patented Hytort method.<br />
The prodigious body of data generated by the outcrop<br />
examinations, drilling, <strong>and</strong> laboratory activities, together<br />
with the results of the sedimentological, paleontological,<br />
petrological <strong>and</strong> other studies are being assembled <strong>and</strong><br />
synthesized in a series of assessment reports on the four rock<br />
units (Table 1) under investigation.<br />
This report describes the <strong>stratigraphy</strong>, distribution, <strong>and</strong><br />
hydrocarbon resource <strong>potential</strong> of the Marcellus Formation.<br />
1.4 Project Participants <strong>and</strong> Acknowledgments<br />
In addition to the two main OGS researchers involved in<br />
this project (M.D. Johnson <strong>and</strong> P.G. Telford), significant<br />
contributions were also made by the following people. Dr. J.F.<br />
Barker (University of Waterloo) carried out organic<br />
geochemical analyses <strong>and</strong> prepared Appendix I. George Macauley<br />
(Calgary) assisted in preparation of the resource evaluation<br />
(section 5). Additional Rock-Eval analytical data was<br />
provided by Lloyd Snowdon (at the Institute of Sedimentary <strong>and</strong><br />
Petroleum <strong>Geology</strong>- Calgary).<br />
Basis for much of the work has been the drill holes<br />
through the Marcellus Formation. The shallow hole coring
10<br />
wpff *'.'.'-'. tfgf*<br />
. .U. . . . o^.<br />
(Q<br />
-P<br />
C<br />
O<br />
Q)<br />
^<br />
4J<br />
3<br />
O<br />
CO<br />
O*<br />
O<br />
iH<br />
O<br />
0)<br />
o<br />
o<br />
•H<br />
oN<br />
o<br />
0)<br />
•H<br />
(d<br />
t^<br />
•H<br />
Pu
11<br />
program was undertaken during 1982 by Site Investigation<br />
Services Ltd. (Peterborough) who completed the holes only with<br />
great difficulty (due to boulder beds <strong>and</strong> s<strong>and</strong> lenses in the<br />
overburden). The Port Stanley OGS-82-3 deep core, was drilled<br />
by Canadian Mine Services Ltd (Bramalea). Geophysical logging<br />
of the holes was by British Plaster Board (B.P.B.) Ltd.<br />
(Calgary) <strong>and</strong> Schlumberger Ltd. (contracted from its Chatham<br />
office).<br />
Assisting in the early interpretation of the Marcellus<br />
was K. Lee Bradshaw, <strong>and</strong> the integrated drillhole logs <strong>and</strong> map<br />
were produced subsequently by George Flach <strong>and</strong> Karen Yonge<br />
(all from the O.G.S.).<br />
Data for the inorganic geochemistry section was<br />
provided by G. Brown (unpublished B.Se. thesis from the<br />
University of Western <strong>Ontario</strong>).<br />
Preliminary drafts of this manuscript were reviewed by<br />
Rainer Wolf <strong>and</strong> O.K. Armstrong (both OGS).
12<br />
2. PALEOZOIC GEOLOGY OF SOUTHERN ONTARIO<br />
2.l Structural <strong>and</strong> Paleogeographic Setting<br />
Paleozoic strata form the bedrock of two discrete parts<br />
of southern <strong>Ontario</strong>, each of which has its own distinctive<br />
structural style <strong>and</strong> differing paleogeographic histories. In<br />
southeastern <strong>Ontario</strong>, east of the Frontenac Axis, Lower to<br />
Middle Ordovician s<strong>and</strong>stones, <strong>shale</strong>s, <strong>and</strong> carbonate rocks<br />
underlie the physiographic region known as the Ottawa-St.<br />
Lawrence Lowl<strong>and</strong> (Fig. 1). West of the Frontenac Axis <strong>and</strong><br />
south of the Precambrian Shield, in southcentral <strong>and</strong><br />
southwestern <strong>Ontario</strong>, Upper Cambrian to Upper Devonian strata<br />
2<br />
underlie an area of approximately 70,000 km forming part of<br />
the Great Lakes-St. Lawrence Lowl<strong>and</strong>. Manitoulin, Cockburn,<br />
<strong>and</strong> St. Joseph Isl<strong>and</strong>s in northern Lake Huron, which are<br />
underlain by Ordovician <strong>and</strong> Silurian strata, are also included<br />
in this geological-physiographic unit (Fig. 1).<br />
Ottawa-St. Lawrence Lowl<strong>and</strong>. The Ordovician sediments of<br />
the Ottawa-St. Lawrence Lowl<strong>and</strong> were deposited in a relatively<br />
narrow embayment extending northwestward from the northern<br />
Appalachian Basin. Unlike the strongly folded, lithologically<br />
diverse strata of the Appalachian Basin which were formed in a<br />
tectonically active continental margin environment, the strata<br />
in the Ottawa-St. Lawrence Lowl<strong>and</strong> are generally flat-lying<br />
<strong>and</strong> of comparatively uniform composition. They were formed in
13<br />
a stable shallow shelf environment mainly unaffected by<br />
Paleozoic orogenic episodes. However, during the Late<br />
Mesozoic, tectonic activity associated with the opening of the<br />
Atlantic Ocean produced block faulting along a structure<br />
termed the Ottawa-Bonnechere Graben. The trend of this<br />
feature essentially paralleled the original depositional<br />
embayment although the block faulting of the Ordovician strata<br />
was most severe in the northern part of the Ottawa-St.<br />
Lawrence Lowl<strong>and</strong>, along the present valley of the Ottawa<br />
River.<br />
Recent mapping by the <strong>Ontario</strong> Geological Survey in this<br />
area has provided a clear picture of the stratigraphic<br />
sequence <strong>and</strong> structural patterns (Williams <strong>and</strong> Wolf, 1982;<br />
Williams <strong>and</strong> Rae, 1983). A thickness of up to 1130 m of<br />
Ordovician strata is present. Steeply dipping normal faults<br />
<strong>and</strong> fault zones are common <strong>and</strong> some have up to 900 m of<br />
vertical displacement. Bedding is normally close to<br />
horizontal <strong>and</strong> steep dips only occur in close proximity to<br />
faults <strong>and</strong> within fault zones.<br />
Limited attention was given to the <strong>oil</strong> <strong>shale</strong> resource<br />
<strong>potential</strong> of this region. The Eastview Member (Lindsay<br />
Formation) <strong>and</strong> Billings Formation are Upper Ordovician black<br />
<strong>shale</strong>s which outcrop <strong>and</strong> subcrop beneath surficial deposits in<br />
several small areas east of Ottawa (Williams et al. 1984).<br />
Initially the Eastview Member was of particular interest to<br />
the Oil Shale Assessment Project as the unit is correlative<br />
with <strong>and</strong> lithologically similar to the Collingwood Member
14<br />
(Lindsay Formation) of southwestern <strong>Ontario</strong> (Russell <strong>and</strong><br />
Telford, 1983) which is a confirmed <strong>oil</strong> <strong>shale</strong> of significant<br />
resource <strong>potential</strong> (Macauley 1984). However, preliminary<br />
organic geochemical analyses of core samples from the Eastview<br />
<strong>and</strong> Billings were discouraging. The apparently rich organic<br />
content of the <strong>shale</strong>s was over-mature <strong>and</strong> <strong>potential</strong> <strong>oil</strong> yields<br />
correspondingly low (Johnson 1982) . This was probably the<br />
result of the intense Late Mesozoic tectonism in the region.<br />
Great Lakes-St. Lawrence Lowl<strong>and</strong>. The Upper Cambrian to<br />
Upper Devonian stratigraphic succession of southcentral <strong>and</strong><br />
southwestern <strong>Ontario</strong> contains a variety of platform deposits<br />
formed in a shallow epi-continental sea. Superficially the<br />
geology appears to be simple - apparently flat-lying<br />
carbonate, clastic <strong>and</strong> evaporitic units displaying little<br />
evidence of severe structural disturbances. However,<br />
deposition of these units took place in <strong>and</strong> around three major<br />
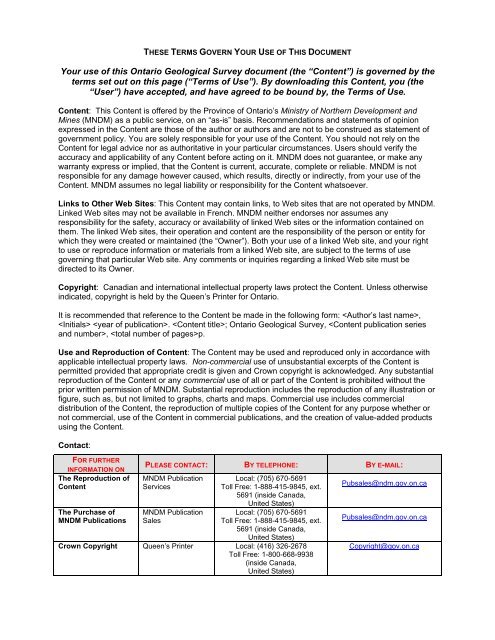
paleogeographic elements (Fig. 2):<br />
(a) Appalachian Basin, an elongate sedimentary basin<br />
extending into the Niagara Peninsula <strong>and</strong> beneath<br />
Lake Erie.<br />
(b) Algonquin Arch, a broad basement ridge forming the<br />
spine of the southwestern <strong>Ontario</strong> peninsula.<br />
(c) Michigan Basin, a roughly circular sedimentary basin<br />
whose eastern rim approximates the axis of the<br />
Algonquin Arch.
15<br />
MICHIGAN BASIN<br />
TORONTO<br />
m<br />
LAKE ONTARIO<br />
Fig. 2. Major structural <strong>and</strong> paleogeographic<br />
elements in southern <strong>Ontario</strong>.
16<br />
The Algonquin Arch trends in a southwest direction<br />
beneath southern <strong>Ontario</strong>, forming a broad positive lineament<br />
from which the overlying Paleozoic strata dip westward into<br />
the Michigan Basin or southward into that part of the<br />
Appalachian Basin which is commonly termed the Allegheny<br />
Trough (e.g. Winder <strong>and</strong> Sanford 1972). Within the central<br />
Michigan Basin the Paleozoic strata reach a maximum thickness<br />
of about 4,300 m. Within the Allegheny Trough, in<br />
Pennsylvania <strong>and</strong> West Virginia, the Paleozoic sequence is up<br />
to 6,700 m in thickness. In contrast, the maximum thickness<br />
of Paleozoic strata in southwestern <strong>Ontario</strong> (at the southern<br />
end of Lake Huron) is about 1,525 m (Winder <strong>and</strong> Sanford 1972).<br />
The Findlay Arch (Fig. 2) trends obliquely to the<br />
Algonquin Arch, extending through western Ohio, southeastern<br />
Indiana, <strong>and</strong> beneath the extreme western part of southern<br />
<strong>Ontario</strong>. The two arches are separated by the Chatham Sag<br />
(Fig. 2), which is a locally developed broad depression within<br />
which the Paleozoic strata are generally horizontal. Away fr<br />
om the Chatham Sag <strong>and</strong> the crests of the two arches, Paleozoic<br />
strata have a consistent regional dip of 5.5 to 8.5 m per km<br />
into the Michigan Basin or Allegheny Trough (Winder <strong>and</strong><br />
Sanford 1972).<br />
Upper Cambrian <strong>and</strong> Lower Ordovician strata of the initial<br />
Paleozoic marine transgression in the southern <strong>Ontario</strong> region<br />
are truncated against the southeastern flank of the Algonquin<br />
Arch. This, together with the onlap <strong>and</strong> overlap of subsequent
17<br />
Middle Ordovician carbonates over the arch, confirms that it<br />
was a positive topographic feature in early Paleozoic time.<br />
The arch apparently maintained its positive nature, to varying<br />
degrees, throughout much of Paleozoic time <strong>and</strong> had<br />
considerable influence, in particular, on deposition of the<br />
Devonian units of southwestern <strong>Ontario</strong>. Consequently, the<br />
Paleozoic sequence is complicated by major facies changes as<br />
strata typical of the Appalachian Basin (or Allegheny Trough)<br />
interfinger with strata typical of the Michigan Basin in<br />
complex onlap-offlap patterns over the Algonquin Arch <strong>and</strong><br />
through the Chatham Sag. Figure l illustrates the Paleozoic<br />
geology of southern <strong>Ontario</strong> with its apparently simple<br />
arrangement of northwest to southeast <strong>and</strong> east striking<br />
stratigraphic units. Figure 3 demonstrates the more complex<br />
facies variations actually occurring within <strong>and</strong> between the<br />
Devonian units of the succession.<br />
Recently, a more complicated picture of the structural<br />
geology of the Paleozoic strata of southwestern <strong>Ontario</strong> has<br />
emerged. This region has long been considered to be<br />
tectonically inactive <strong>and</strong> to have undergone very little<br />
structural disturbance during its geological history. Thus,<br />
very little attention has been given to the occurrence or<br />
significance of faults <strong>and</strong> fracture systems within the<br />
Paleozoic strata.<br />
However, using modern L<strong>and</strong>sat imagery, data on major <strong>and</strong><br />
minor earthquake distribution, <strong>and</strong> conventional subsurface
18<br />
WINDSOR SARNIA-<br />
GOOtRICH<br />
ALGONQUtM ARCH NIAGARA<br />
CASTERN UKC ERIC<br />
MICHIGAN fASIN AiUGHCNY tASlN<br />
Fig. 3. Devonian succession of southwestern <strong>Ontario</strong> (after<br />
Uyeno et al. 1982).
19<br />
information (which is abundant for many areas in southwestern<br />
<strong>Ontario</strong>), combined with current theories of plate tectonics,<br />
Sanford et al. (1985) have developed an important new<br />
interpretation for the structural geology of the Paleozoic<br />
sequence in the region. They suggest that broad segments of<br />
the craton, underlying such areas as the Michigan Basin, were<br />
in intermittent motion through most of the Paleozoic <strong>and</strong> that<br />
some segments (e.g. Algonquin Arch region) are still mildly<br />
tectonic. They further suggest that basement arch movements<br />
<strong>and</strong> basin development in southwestern <strong>Ontario</strong> <strong>and</strong> adjacent<br />
areas may have been related to crustal plate motions <strong>and</strong><br />
associated orogenic activity centred at or beyond the actual<br />
margins of the craton.<br />
Re-examination of surface <strong>and</strong> subsurface stratigraphic<br />
data from southwestern <strong>Ontario</strong> in the light of these<br />
interpretations has led to a new detailed picture of probable<br />
faults <strong>and</strong> fracture systems within the Paleozoic succession<br />
(Sanford et al. 1985, Fig. 12) . Southwestern <strong>Ontario</strong> is<br />
considered to occupy parts of two fault-blocks, the Bruce <strong>and</strong><br />
Niagara megablocks (Fig. 4). The boundary between the blocks<br />
is approximately coincident with the Algonquin Arch. The<br />
Bruce Megablock was interpreted by Sanford et al. (1985, p.<br />
59) to have been less active <strong>and</strong> was described as having a<br />
relatively simple system of east-west trending fractures<br />
within the Paleozoic strata. The more active Niagara Megablock<br />
was described as having a correspondingly more complex system<br />
of three fracture sets.
20<br />
BRUCE MEGABLOCK<br />
/<br />
LAKE HURON<br />
LAKE ONTARIO<br />
Fig. 4. Major fracture system in the Paleozoic rocks of<br />
southwestern <strong>Ontario</strong> (after Sanford et al. 1985).
21<br />
Although additional study <strong>and</strong> testing of these models are<br />
needed they present numerous implications with respect to the<br />
occurrence of hydrocarbon resources in southwestern <strong>Ontario</strong>.<br />
They also have significance to stratigraphic problems <strong>and</strong><br />
anomalies previously thought to be the result of only<br />
depositional or facies variations caused by the alignment of<br />
the major paleogeographic elements of the region.<br />
2.2 Stratigraphy of Southwestern <strong>Ontario</strong><br />
Not surprisingly, the relatively complex paleo-geographic<br />
situation <strong>and</strong> patterns of major <strong>and</strong> minor structural elements<br />
have led to a variety of stratigraphic terminology among the<br />
neighbouring jurisdictions of <strong>Ontario</strong>, New York, Ohio, <strong>and</strong><br />
Michigan. The problem is most acute in southwestern <strong>Ontario</strong><br />
which is geologically <strong>and</strong> geographically central, lying partly<br />
along the boundary between the Michigan <strong>and</strong> Appalachian<br />
Basins. In addition the poor exposure of all Paleozoic units<br />
in southwestern <strong>Ontario</strong> compared with the reasonably good<br />
exposure of Middle Ordovician strata in southcentral <strong>Ontario</strong><br />
bordering the Precambrian Shield, <strong>and</strong> of Silurian strata of<br />
the Niagara Escarpment (Fig. 1), has provoked the<br />
establishment of two local stratigraphic schemes based on<br />
subsurface <strong>and</strong> surface data respectively.
22<br />
The large volume of drilling carried out as part of the<br />
Oil Shale Assessment Project, <strong>and</strong> other O.G.S. projects in<br />
southern <strong>Ontario</strong>, has included the acquisition of twelve<br />
complete cores <strong>and</strong> downhole geophysical logs through the<br />
Paleozoic sequence (Fig. 5). This has provided an important<br />
supplement to the O.G.S. program of modern surface geological<br />
mapping of southern <strong>Ontario</strong> begun in the early 1970's. Thus,<br />
as reported by Telford et al. (1984), the O.G.S. is now<br />
attempting to rationalize the conflicting surface <strong>and</strong><br />
subsurface terminology in <strong>Ontario</strong> as a contribution to<br />
st<strong>and</strong>ardizing the Paleozoic stratigraphic nomenclature of the<br />
Great Lakes region. The work is far from complete. However,<br />
the stratigraphic terminology used below <strong>and</strong> elsewhere in this<br />
report reflects the most current usage by O.G.S. (Table 2).<br />
Upper Cambrian/Lower Ordovician. The timing <strong>and</strong><br />
character of the earliest Paleozoic marine transgression into<br />
the southern <strong>Ontario</strong> region are not well understood. Except<br />
for sporadic outcrops of clastic rocks on the eastern <strong>and</strong><br />
western flanks of the Frontenac Arch (Fig. 1), Upper Cambrian<br />
or Lower Ordovician strata are restricted to the subsurface.<br />
In southwestern <strong>Ontario</strong>, these basal units pinch out on the<br />
flanks of the Algonquin Arch <strong>and</strong> are overlapped unconformably<br />
by Middle Ordovician carbonate units (see below).<br />
From their zero edge on the southeastern side of the<br />
Algonquin Arch, the Cambro-Ordovician units increase in<br />
thickness to about 155 m beneath the <strong>Ontario</strong> portion of Lake
23<br />
OGS-83-6<br />
ST. JOSEPH ISLAND OGS-83-5<br />
LITTLE CURRENT<br />
GEORGIAN BAY<br />
OGS-83-1 MILTON® /LAK E ONTARIO<br />
OGS-83-4 CLARKSON^*<br />
SARNIA<br />
OGS-82-1 LAMBTON oos-82-3 PORT STANLEY<br />
LAKE ERIE<br />
•JHOLE LOCATION<br />
Fig. 5. Location of deep drillholes of the Oil Shale<br />
Assessment Project.
24<br />
Erie <strong>and</strong> reach a maximum thickness of about 2,200 m in the<br />
central Appalachian Basin. On the northwestern side of the<br />
Arch, in <strong>Ontario</strong>, they have a thickness of about 77 m <strong>and</strong><br />
reach a maximum thickness of 620 m in the southcentral<br />
Michigan Basin (Sanford <strong>and</strong> Quillian, 1959; Winder <strong>and</strong><br />
Sanford, 1972). On both sides of the Arch a similar sequence<br />
of lithologies occurs - basal conglomerates <strong>and</strong> s<strong>and</strong>stones<br />
grading upward to interbedded s<strong>and</strong>stones <strong>and</strong> grey shaly<br />
dolostones in turn overlain by brown dolostone. Recent<br />
drilling by the O.G.S. on Cockburn Isl<strong>and</strong>, on the extreme<br />
northern rim of the Michigan Basin, encountered a similar<br />
lithological pattern (Wolf, 1986). Appalachian Basin <strong>and</strong><br />
Michigan Basin stratigraphic terminology has been applied to<br />
the sequence on the southeastern <strong>and</strong> northwestern sides<br />
respectively, of the Algonquin Arch (Table 2).<br />
There is little doubt that these basal units are markedly<br />
diachronous but, because of a lack of paleontological<br />
evidence, their age in southern <strong>Ontario</strong> is uncertain. On the<br />
basis of subsurface continuity with rocks of known Cambrian<br />
age in Wisconsin <strong>and</strong> New York State, Winder <strong>and</strong> Sanford (1972)<br />
favoured an Upper Cambrian age. Because of the marked<br />
diachroneity <strong>and</strong> the Middle Ordovician age of overlying<br />
strata, other workers have proposed a Lower Ordovician age.<br />
Recently there has been increased interest in the basal<br />
Cambro-Ordovician s<strong>and</strong>stones for their <strong>potential</strong> <strong>oil</strong> <strong>and</strong> gas
Table 2. Paleozoic stratigraphic nomenclature currently in<br />
use by the O.G.S.<br />
25
26<br />
resources. Previous hydrocarbon discoveries were reviewed by<br />
Winder <strong>and</strong> Sanford (1972). An O.G.S. deep drillhole near Port<br />
Stanley (Fig. 5), completed in 1983 as part of the Oil Shale<br />
Assessment Project (OGS 82-3; Johnson et al., 1985),<br />
penetrated 36.8 m of Cambro-Ordovician strata within which was<br />
encountered a good show of <strong>oil</strong> in the depth interval 1125 to<br />
1135 m. This stimulated considerable interest from the<br />
petroleum exploration community.<br />
Middle Ordovician. Following an Early Ordovician<br />
erosional interval, the Middle Ordovician marine transgression<br />
of southwestern <strong>Ontario</strong> was very extensive <strong>and</strong> the entire<br />
region was blanketed by a comparatively thick succession of<br />
shallow water, shelf carbonate deposits. The facies<br />
variations inherent in such a depositional system have<br />
produced a complex <strong>stratigraphy</strong> with lithological changes<br />
occurring both along strike <strong>and</strong> down-dip into the Appalachian<br />
<strong>and</strong> Michigan Basins. However, the Middle Ordovician units are<br />
exposed only along a narrow zone, bordering the Precambrian<br />
shield, extending from eastern Lake <strong>Ontario</strong> to Georgian Bay<br />
<strong>and</strong> thence along the northern edges of the isl<strong>and</strong>s in northern<br />
Lake Huron. Therefore, only the shallower water, basin margin<br />
carbonate deposits can be examined in outcrop. The deeper<br />
water facies, <strong>and</strong> those closer to sources of terrigenous<br />
sediments from the eastern side of the Appalachian Basin can<br />
be examined only with subsurface data. Consequently, at least<br />
three stratigraphic nomenclature systems (covering the
27<br />
southcentral <strong>Ontario</strong> outcrop belt, northern Lake Huron outcrop<br />
belt, <strong>and</strong> southwestern <strong>Ontario</strong> subsurface, respectively) may<br />
be necessary to adequately describe the Middle Ordovician<br />
carbonate sequence.<br />
A preliminary version of this practice was attempted in<br />
describing the Middle Ordovician portions of the deep<br />
drillcores obtained during the Oil Shale Assessment Project.<br />
Terminology proposed by Liberty (1969) was used for drillholes<br />
at Wiarton (OGS 82-4; Johnson et al. 1985), Corbetton (Johnson<br />
et al. 1983), <strong>and</strong> in the Toronto region (OGS 83-1 to 3;<br />
Johnson 1983) which lie within or close to the southcentral<br />
<strong>Ontario</strong> outcrop belt. Subsurface terminology proposed by<br />
Sanford (1961) <strong>and</strong> Beards (1967) was used for drillholes near<br />
Sarnia (OGS 82-1), Chatham (OGS 82-2), <strong>and</strong> Port Stanley (OGS<br />
82-3) (Johnson et al. 1985). Middle Ordovician carbonates were<br />
left undifferentiated in the lithological logs for drillholes<br />
on Manitoulin <strong>and</strong> St. Joseph Isl<strong>and</strong>s (OGS 83-5 <strong>and</strong> 6<br />
respectively; Johnson et al. 1985) <strong>and</strong> on Cockburn Isl<strong>and</strong> (OGS<br />
85-7; Wolf 1986). Table 3 summarizes the stratigraphic<br />
thickness <strong>and</strong> terminology of Middle Ordovician carbonate units<br />
penetrated in these drillholes. The thickest section<br />
encountered (289.58 m in OGS 82-1 near Sarnia) is close to the<br />
maximum thickness of 304 m reported by Winder <strong>and</strong> Sanford<br />
(1972) .
28<br />
The Middle Ordovician units include a full spectrum of<br />
shallow water carbonate lithologies representing supratidal,<br />
intertidal, <strong>and</strong> shallow subtidal environments. The Shadow<br />
Lake Formation or equivalent (Table 3) is a distinctly<br />
diachronous basal clastic unit of <strong>shale</strong>s, siltstones <strong>and</strong><br />
argillaceous dolostone. It is succeeded gradationally by a<br />
sequence of fine-grained to lithographic limestones <strong>and</strong> minor<br />
dolostones (e.g. Gull River Formation). The middle part of<br />
the Middle Ordovician succession is generally dominated by<br />
bioclastic limestone or calcarenite, commonly interbedded with<br />
calcareous <strong>shale</strong>s. The upper part of the succession is mainly<br />
fine grained argillaceous limestone. All units except the<br />
clastic Shadow Lake Formation are richly fossiliferous,<br />
allowing precise age determinations.<br />
The Gull River, Bobcaygeon, <strong>and</strong> Verulam Formations (or<br />
their equivalents - see Table 3) span most of the Blackriveran<br />
<strong>and</strong> Trentonian Stages of the Middle Ordovician (Barnes et al.<br />
1981). The uppermost carbonate unit in the succession<br />
(Lindsay Formation or equivalent - Table 3) actually straddles<br />
the Middle-Upper Ordovician boundary, ranging in age from<br />
upper Trentonian to Maysvillian (Barnes et al. 1981).<br />
The Collingwood Member of the Lindsay Formation (Russell<br />
<strong>and</strong> Telford 1983) is one of the three southern <strong>Ontario</strong> <strong>oil</strong><br />
<strong>shale</strong>s investigated in the Oil Shale Assessment Project (Table<br />
1). It is composed of interbedded organic-rich limestone
29<br />
c<br />
0<br />
Vi<br />
3<br />
X<br />
9<br />
S<br />
G<br />
Vi<br />
9<br />
4J<br />
O<br />
z<br />
o<br />
rt<br />
Vi<br />
A<br />
4J<br />
C0<br />
rt<br />
AVi<br />
4J<br />
C<br />
41<br />
U<br />
O<br />
•rt<br />
Vi<br />
A<br />
4}<br />
C<br />
O<br />
14}<br />
iJS<br />
8<br />
ea<br />
ea<br />
tO<br />
1 JS<br />
n a<br />
00 41<br />
i a<br />
en o<br />
Q<br />
t<br />
4J<br />
ea<br />
jj cCO<br />
rt Vi<br />
n3<br />
aa 1 4)<br />
ea rt<br />
8 Srt<br />
J<br />
ng,<br />
nrt<br />
00 Vi<br />
l 4)<br />
en x<br />
O "Hi<br />
a.<br />
d C<br />
l O<br />
n a<br />
CO X<br />
1 Vi<br />
en A<br />
83<br />
rt<br />
1<br />
n c<br />
oo O<br />
1 ^j<br />
en rt<br />
8 rt<br />
X<br />
•V C<br />
1 0<br />
d 41<br />
00 Vi<br />
1 A<br />
enrt<br />
X s<br />
O<br />
c<br />
0<br />
•M<br />
rt 4J<br />
1 9<br />
g a Vi<br />
S<br />
x<br />
9<br />
n rt<br />
i e<br />
d A<br />
00 -U<br />
i ea<br />
en<br />
13 4j<br />
0<br />
A*<br />
i 0<br />
d A<br />
GO C<br />
1 *J<br />
en A<br />
86<br />
dg<br />
00 4J<br />
83<br />
4)<br />
rt<br />
O<br />
rt rt<br />
rt C<br />
O<br />
Xrt<br />
A •W<br />
a -<br />
•O 00<br />
C rt<br />
rt rt<br />
A r*<br />
ea -<br />
•a en<br />
C 0<br />
•rt rt<br />
tsrt<br />
A tO<br />
a -<br />
•O n<br />
C -9<br />
rt<br />
ij<br />
IS VO<br />
A V<br />
•0 rt<br />
C r-<br />
is to<br />
A 9<br />
M -<br />
•O to<br />
C n<br />
rt ^<br />
J<br />
*^**0<br />
A P*<br />
HI '<br />
•O d<br />
c en<br />
•HI d<br />
^j<br />
Jsvo<br />
A r*<br />
a -<br />
•O rt<br />
c aa<br />
M *<br />
QIO<br />
Vi 0<br />
o o<br />
f) *0<br />
O GO<br />
O<br />
o* *o<br />
Vi *<br />
O en<br />
A en<br />
0.<br />
DI 10<br />
So<br />
40<br />
S"<br />
4*<br />
ti U<br />
A<br />
e .<br />
8"<br />
S S"<br />
Vi ><br />
aa<br />
0<br />
o*<br />
en<br />
rt<br />
rt<br />
n *<br />
rt<br />
rt<br />
3<br />
*<br />
00<br />
*H}<br />
*o<br />
*<br />
o<br />
••p<br />
n<br />
3a<br />
n<br />
o<br />
rt<br />
o<br />
r*<br />
r*<br />
d<br />
n<br />
^<br />
en<br />
^<br />
en **<br />
o<br />
rt<br />
o<br />
en<br />
CO<br />
d<br />
n<br />
en<br />
rt<br />
to'<br />
en<br />
0<br />
rt<br />
Vi ><br />
Srt<br />
3'<br />
5<br />
•o<br />
9<br />
A<br />
rt<br />
4J<br />
C41<br />
O to<br />
Vi o en<br />
4) -<br />
•M en GO<br />
•M tO d<br />
•rt rt n<br />
3<br />
•0<br />
9<br />
4t<br />
A<br />
*J rt oo<br />
Cn 4) .<br />
n<br />
Vi rt oo<br />
9 rt O<br />
VM<br />
"M rt d<br />
1 3<br />
0 VO 0<br />
A V 00<br />
rt - -<br />
p rt P-<br />
U CO -W<br />
41 rt<br />
><br />
0 rt A to en<br />
o<br />
rt * -<br />
3O Vi v n<br />
4) n *r<br />
B -* A vo en<br />
oo<br />
rt * *<br />
3 n en<br />
Vi O T<br />
4) rt rt<br />
^<br />
0O 00<br />
A p* en<br />
rt * '<br />
2 P- d<br />
d GO<br />
9 n n<br />
^<br />
0 * P-<br />
A on •w<br />
rt * -<br />
3 * O<br />
Vi en n<br />
4) •v rt<br />
COO<br />
v) o en<br />
rt .<br />
rt rt n<br />
41 A 0 n<br />
a b, on en<br />
CO<br />
S<br />
c a GO o<br />
rt d rt<br />
rt .<br />
A -* 00<br />
4J b. n p*<br />
.C en en<br />
ea<br />
C rt oo<br />
6 rt rt vo . en<br />
41 A en d<br />
A h. 0 rt<br />
0) rt rt<br />
tJ tJ<br />
A A<br />
C C '<br />
O 0 0 0<br />
0 . 0<br />
Vi ^ Vi ^<br />
41 41 9 9<br />
art X rt<br />
a ai q o<br />
(<br />
T3<br />
rt<br />
4) 0 n<br />
•rt en p-<br />
tM . .<br />
X n d<br />
Vi n en<br />
rt en en<br />
M<br />
•o<br />
rt<br />
41 0 d<br />
-H rt en<br />
X 00 GO<br />
Vi p* d<br />
•H (ft O<br />
AC rt<br />
•a<br />
rt 00 0<br />
"w on en<br />
X d 00<br />
Vi rt rt<br />
rt rt rt<br />
x<br />
t ti<br />
5 5<br />
c c *<br />
0-00<br />
U 0 O<br />
Vi - Vi ^<br />
0) > 9 9<br />
a a) 3 rt<br />
art q ai<br />
3 41 J<br />
c<br />
o<br />
41<br />
CTO rt<br />
X GO n<br />
A '<br />
UP- 00<br />
J3 * en<br />
0 rt rt<br />
CO<br />
C<br />
o 4)<br />
O^en n<br />
X O ^f<br />
A * *<br />
On o<br />
JQ n *<br />
S* *<br />
c<br />
o<br />
4)<br />
Otcn ao<br />
' X oo en<br />
A -<br />
U en rt<br />
J3 v en<br />
O rt rt<br />
ea<br />
c<br />
o<br />
41<br />
CTOB *<br />
xen d<br />
A -<br />
U d to<br />
jQ ao en<br />
On n<br />
aa<br />
C<br />
OP- d<br />
9-9 P-<br />
xcn vo<br />
An vo<br />
U rt rt<br />
Sea<br />
x C n rt<br />
OP- rt<br />
U -<br />
Od 00<br />
U en d<br />
0 en O<br />
U rt<br />
X Cd en<br />
O en o<br />
O 00 O<br />
Ad vo<br />
O o o<br />
U rt rt<br />
X O rt<br />
C tO GO<br />
- *<br />
o en en<br />
O co en<br />
.O rt rt<br />
O rt 0<br />
rt<br />
•U 4J<br />
0 0<br />
A A<br />
*J tt<br />
C - C -<br />
Vi 5* Vi J*<br />
9999<br />
Q.rt 3 rt<br />
Vi<br />
41<br />
rt rt<br />
*<br />
rt CO<br />
rt en<br />
3 rt<br />
O<br />
Vi<br />
41<br />
rt n<br />
PS *<br />
rt O<br />
rt ^<br />
O "<br />
Vi<br />
4)<br />
rt CO<br />
K en<br />
rt rt<br />
rt en<br />
3 rt<br />
U<br />
VI<br />
41<br />
•HI ^<br />
OSd<br />
rt to<br />
rt en<br />
3 n<br />
U<br />
Vi<br />
41<br />
> 01<br />
•rt p-<br />
OS -<br />
tO<br />
rt VO<br />
rt rt<br />
(3<br />
Vi<br />
41<br />
rtrt<br />
OS rt<br />
rt CO 00<br />
rt d ' ten<br />
a o O<br />
O rt rt<br />
Vi<br />
o<br />
rtcn<br />
oso<br />
rt O<br />
rt VO<br />
30<br />
O rt<br />
Vi<br />
41<br />
^*<br />
as -<br />
at<br />
rt en<br />
rt rt<br />
3 H<br />
(9<br />
41<br />
U<br />
A<br />
|.<br />
Vi ^ hi ^<br />
a*<br />
en<br />
rt *<br />
d<br />
^<br />
^*<br />
n<br />
p-<br />
•*<br />
p-<br />
rt *<br />
0<br />
n<br />
to<br />
to<br />
to<br />
*<br />
VO<br />
rt<br />
4f<br />
d<br />
P-<br />
fx<br />
en<br />
rt<br />
0<br />
00<br />
n<br />
to<br />
on<br />
to<br />
rt<br />
rt<br />
*<br />
m<br />
d<br />
to<br />
n<br />
rt<br />
U<br />
A<br />
*J<br />
C -<br />
0 0<br />
3*<br />
•O 9<br />
9 X<br />
4i A<br />
A rt<br />
•rt GO<br />
4* 3 n<br />
C O<br />
q) -O aa<br />
Vi A O<br />
4) JS d<br />
•u ea<br />
•rt<br />
C<br />
. 3<br />
S<br />
en<br />
9 rt<br />
•ox -<br />
A A P-<br />
J3 rt d<br />
ea d<br />
^ ^<br />
O 9 *<br />
•o x -<br />
A (0 n<br />
.C J P-<br />
en •w<br />
O 4) rt<br />
•ox -<br />
A A O<br />
JG J n<br />
en to<br />
3 vo<br />
O 41 tO<br />
•ox .<br />
A A rt<br />
03 J rt<br />
ea -9<br />
d<br />
3 P-<br />
O 4) -<br />
•0 X P-<br />
A A en<br />
r: J in<br />
U)<br />
o<br />
3 oo<br />
O 9 -<br />
•a x aa<br />
A A O\<br />
J3 JO<br />
ea rt<br />
n<br />
tO<br />
S 4) '<br />
•O X en<br />
A A to<br />
ea rt<br />
rt<br />
3 d<br />
O 41 -<br />
•a x vo<br />
A A n<br />
J3 J n<br />
CO rt<br />
U<br />
A<br />
C - C -<br />
O 0 0 0<br />
u U<br />
Vi ^<br />
41 4)<br />
art<br />
a 4)<br />
o<br />
n<br />
n<br />
rt<br />
d<br />
rt<br />
VO<br />
n<br />
d<br />
GO<br />
P-<br />
*<br />
^<br />
CO<br />
•*<br />
rt<br />
V<br />
p.<br />
n<br />
vo<br />
d<br />
p- *<br />
d<br />
^<br />
en<br />
p-<br />
d<br />
o<br />
tO<br />
p-<br />
p-<br />
o<br />
rt<br />
rt<br />
O<br />
0<br />
rt<br />
p-<br />
rt<br />
rt<br />
n<br />
rt<br />
vo<br />
n<br />
rt<br />
4i<br />
U<br />
A<br />
Vi ^<br />
4) 41<br />
3 rt<br />
S'<br />
^^<br />
rt<br />
00<br />
en<br />
rt<br />
C<br />
O<br />
vi<br />
C<br />
^<br />
8<br />
Vi<br />
Jl<br />
eu<br />
3<br />
g<br />
^4<br />
z<br />
b]<br />
ea<br />
ea<br />
u<br />
en<br />
(n<br />
•*{<br />
en u^j<br />
i*^<br />
x<br />
en<br />
kj<br />
M<br />
O<br />
b]<br />
X<br />
b.<br />
O<br />
en<br />
a o<br />
3<br />
.j<br />
IH<br />
K Q<br />
0.<br />
u<br />
Q<br />
Z<br />
M<br />
Q<br />
b]<br />
CH<br />
U<br />
en<br />
b)<br />
E-<br />
z<br />
IH<br />
g-<br />
r-l<br />
Z<br />
3<br />
fa]<br />
^J<br />
lCO<br />
u<br />
rt<br />
u<br />
rt<br />
1os<br />
o<br />
rt<br />
o<br />
a<br />
M<br />
x<br />
n<br />
TABLE
30<br />
<strong>and</strong> highly calcareous <strong>shale</strong> forming the upper part of the<br />
Lindsay Formation <strong>and</strong> thus representing the final phase of the<br />
Middle (to Upper) Ordovician carbonate depositional sequence<br />
in southern <strong>Ontario</strong>. The Collingwood Member as defined by<br />
Russell <strong>and</strong> Telford (1983) is not equivalent to the<br />
Collingwood Formation of Sanford (1961) identified in the<br />
subsurface of southwestern <strong>Ontario</strong> (see Table 2). The latter<br />
should probably be termed the Blue Mountain Formation. The<br />
Collingwood Member is essentially a facies within the upper<br />
part of the Lindsay Formation <strong>and</strong> is largely restricted in<br />
distribution to a zone north of a line running approximately<br />
east-west through Toronto (Russell <strong>and</strong> Telford 1983, Fig. 6).<br />
Upper Ordovician. A major change in sedimentation<br />
patterns took place during the Late Ordovician. The Taconic<br />
Orogeny of eastern North America, coupled with a eustatic sea<br />
level drop caused by a continental glaciation on the north<br />
African craton (Dennison 1976), had a profound effect on the<br />
character <strong>and</strong> distribution of sediments in the Appalachian <strong>and</strong><br />
Michigan Basins. Erosion of the newly created highl<strong>and</strong>s<br />
encroaching into the eastern side of the Appalachian Basin<br />
shed large volumes of terrigenous material into the now<br />
shallower epicontinental seas. This is clearly illustrated in<br />
southern <strong>Ontario</strong> where the Middle (to Upper) Ordovician<br />
carbonate sequence is followed by a thick succession of <strong>shale</strong>s<br />
<strong>and</strong> related terrigenous clastic units.
31<br />
The Lindsay Formation is overlain disconformably by bluegrey<br />
<strong>and</strong> brown, predominantly noncalcareous <strong>shale</strong>s of the Blue<br />
Mountain Formation. Thicknesses of 40-60 m for the Blue<br />
Mountain Formation were recorded during the deep drilling<br />
program of the Oil Shale Assessment Project in southwestern<br />
<strong>Ontario</strong> (Johnson et al. 1985). The overlying Georgian Bay<br />
Formation is a thick sequence of grey-green <strong>shale</strong>s,<br />
siltstones, <strong>and</strong> minor limestones. The abundance of carbonate<br />
horizons increases to the north (i.e. away from the<br />
southeastern source of terrigenous sediments) <strong>and</strong>, on<br />
Manitoulin Isl<strong>and</strong>, the upper or Kagawong Member of the<br />
formation is dominantly bioclastic <strong>and</strong> argillaceous limestones<br />
<strong>and</strong> dolostone (Johnson <strong>and</strong> Telford 1985). The unit is over<br />
250 m thick in the Toronto region (Johnson 1983) but thins to<br />
less than 100 m in southwestern <strong>Ontario</strong> <strong>and</strong> northern Lake<br />
Huron (Johnson et al. 1985).<br />
The uppermost Ordovician unit in southern <strong>Ontario</strong> is the<br />
Queenston Formation, a thick sequence of red <strong>and</strong> maroon<br />
siltstones <strong>and</strong> <strong>shale</strong>s that was deposited as the distal fine<br />
grained element of a major deltaic complex extending from the<br />
eastern margin of the Appalachian Basin. The unit reaches a<br />
maximum thickness in <strong>Ontario</strong> (under eastern Lake Erie) of 341<br />
m (Winder <strong>and</strong> Sanford 1972). Northeastwards, the red clastic<br />
unit thins <strong>and</strong> grades laterally into the grey <strong>shale</strong>s <strong>and</strong><br />
carbonates of the upper Georgian Bay Formation.
32<br />
The Blue Mountain-Georgian Bay-Queenston sequence is<br />
upper Maysvillian to Richmondian in age (Barnes et al. 1981).<br />
Strata representing the youngest Ordovician Gamachian Stage<br />
are not present in southwestern <strong>Ontario</strong> or adjacent areas,<br />
thus showing that the Late Ordovician global sea level drop<br />
was sufficient to produce a significant hiatus in the region<br />
before marine transgression again took place in the Early<br />
Silurian.<br />
Lower-Middle Silurian. The Silurian strata of south<br />
western <strong>Ontario</strong> constitute the most intensely studied <strong>and</strong> best<br />
understood sequence in the region. This is due in part to the<br />
excellent exposures of Lower <strong>and</strong> Middle Silurian rocks in the<br />
Niagara Escarpment (Fig. 1) <strong>and</strong> to the considerable interest<br />
in exploration <strong>and</strong> development of <strong>oil</strong> <strong>and</strong> gas resources from<br />
several of the stratigraphic units.<br />
The Niagara Escarpment is a prominent cuesta which<br />
separates lowl<strong>and</strong>s underlain by Ordovician strata to the east<br />
from upl<strong>and</strong>s of Silurian, <strong>and</strong> eventually Devonian, rocks in<br />
the west. It first appears as a distinct geological <strong>and</strong><br />
topographical feature near Rochester, New York State.<br />
Paralleling the south shore of Lake <strong>Ontario</strong>, the Escarpment<br />
enters <strong>Ontario</strong> at Queenston Heights <strong>and</strong> extends westward to<br />
Hamilton. It swings to the north, extending to the Blue<br />
Mountain area near Collingwood on southern Georgian Bay, <strong>and</strong><br />
then continues in a very serrated fashion northwestwards to<br />
Wiarton. North of Wiarton it forms the spectacular eastern
33<br />
shore of the Bruce Peninsula as far as Tobermory where it dips<br />
beneath the waters of Lake Huron. Reappearing on the north<br />
side of Manitoulin Isl<strong>and</strong>, the Escarpment continues<br />
northwestward as a more subdued topographic feature <strong>and</strong><br />
eventually passes into the northern peninsula of the State of<br />
Michigan.<br />
The Escarpment extends from the Appalachian Basin, over<br />
the Algonquin Arch, <strong>and</strong> into the Michigan Basin, thus exposing<br />
the variety of lower <strong>and</strong> Middle Silurian lithologies <strong>and</strong><br />
complex facies associations which characterize these<br />
geological provinces. During the Silurian the Michigan Basin<br />
was mainly a carbonate <strong>and</strong> evaporite basin whereas sediments<br />
in the adjacent Appalachian Basin were largely elastics with<br />
less abundant carbonates.<br />
Bolton (1957) provided the first fully comprehensive<br />
account of the <strong>stratigraphy</strong> of the Niagara Escarpment in<br />
southern <strong>Ontario</strong>. Martini (1971) examined the Lower Silurian<br />
part of the sequence in the Niagara Peninsula <strong>and</strong> western New<br />
York State, showing that this dominantly clastic sequence was<br />
formed in deltaic <strong>and</strong> prodeltaic environments. Lower <strong>and</strong><br />
Middle Silurian strata in the subsurface of southwestern<br />
<strong>Ontario</strong> were described by Sanford (1969a), who interpreted the<br />
complex carbonate shelf, bank, <strong>and</strong> reefal lithofacies. A more<br />
recent summary of the Niagara Escarpment sequence in southern<br />
<strong>Ontario</strong> was provided by Telford (1978) <strong>and</strong> new maps of the
34<br />
Silurian geology on Manitoulin Isl<strong>and</strong> have been released by<br />
the <strong>Ontario</strong> Geological Survey (e.g. Johnson <strong>and</strong> Telford 1985).<br />
Because of the diverse facies associations, total<br />
thicknesses of the Lower-Middle Silurian strata in south<br />
western <strong>Ontario</strong> are variable, ranging from almost 300 m<br />
beneath eastern Lake Erie <strong>and</strong> northern Lake Huron to less than<br />
100 m in the Sarnia area (e.g. OGS drillhole 82-1 -Johnson et<br />
al. 1985) <strong>and</strong> the Niagara Peninsula. The thickest sequences<br />
occur in former shelf areas around the rim of the Michigan<br />
Basin where there was major carbonate bank <strong>and</strong> reefal<br />
development (Sanford 1969a). The classic section in Niagara<br />
Gorge extending from the basal Silurian Whirlpool Formation to<br />
the Middle Silurian Lockport Formation is about 85 m in<br />
thickness (Telford 1978).<br />
More than 90% of the gas production <strong>and</strong> about half of the<br />
<strong>oil</strong> production to date in <strong>Ontario</strong> has come from Silurian<br />
rocks. Most of the <strong>oil</strong> has been extracted from Middle<br />
Silurian reefal carbonates of the Guelph Formation <strong>and</strong> closely<br />
overlying carbonates of the Upper Silurian Salina Formation<br />
(Rybansky <strong>and</strong> Trevail, 1983). Powell et al. (1984) suggest<br />
that the principal source of these hydrocarbons was the Middle<br />
Silurian Eramosa Member of the Amabel Formation (Table 2).<br />
The dark laminated dolostones of the Eramosa Member were<br />
formed in restricted inter-reefal zones <strong>and</strong>, with organic<br />
carbon contents ranging to about 3% (Powell et al. 1984), the<br />
unit could be classed as a <strong>potential</strong> "<strong>oil</strong> <strong>shale</strong>". It was not
35<br />
investigated in the Oil Shale Assessment Project due to its<br />
relatively low organic content.<br />
Upper Silurian. The Late Silurian was, again, a time of<br />
contraction of the epicontinental seas in eastern North<br />
America, <strong>and</strong> evaporitic conditions were strongly developed in<br />
the Michigan Basin <strong>and</strong> adjacent areas. In southwestern<br />
<strong>Ontario</strong> the Upper Silurian Salina Formation consists of salt<br />
(halite), gypsum, <strong>and</strong> anhydrite units alternating with<br />
dolostone, limestone, <strong>and</strong> <strong>shale</strong>. Near the southern end of<br />
Lake Huron, salt beds in the Salina Formation have a composite<br />
thickness of over 200 m (Winder <strong>and</strong> Sanford, 1972). The<br />
current subsurface distribution of the salt beds is considered<br />
to be much reduced from their original depositional extent<br />
(Sanford 1969a). This is the result of gradual dissolution of<br />
the salt which began in the Late Silurian along the margins of<br />
the Michigan Basin <strong>and</strong> continued basinward through successive<br />
periods of geological time. Sanford et al. (1985) have<br />
demonstrated a close relationship between the salt dissolution<br />
patterns <strong>and</strong> major fracture systems in southwestern <strong>Ontario</strong>.<br />
The Salina Formation is conformably overlain by dolostone<br />
of the Bass Isl<strong>and</strong>s Formation (called Bertie Formation on the<br />
Niagara Peninsula). This is the youngest Silurian unit in<br />
southern <strong>Ontario</strong> <strong>and</strong> its top is an erosional surface<br />
signifying a major hiatus <strong>and</strong> period of subaerial exposure.<br />
S<strong>and</strong> grains <strong>and</strong> other sediments from overlying Devonian<br />
formations are often present in cracks <strong>and</strong> joints for
36<br />
several metres into the upper part of this unit (Telford <strong>and</strong><br />
Johnson 1984).<br />
The maximum combined thickness of the Salina <strong>and</strong> Bass<br />
Isl<strong>and</strong>s Formations is 518 m near southern Lake Huron but the<br />
sequence thins to only 105 m over the Algonquin Arch (Winder<br />
<strong>and</strong> Sanford, 1972). In OGS drillhole 82-1 near Sarnia (Fig,<br />
5), the Salina Formation was 330 m thick <strong>and</strong> the Bass Isl<strong>and</strong>s<br />
Formation was 24 m thick (Johnson et al. 1985).<br />
Age determinations <strong>and</strong> regional correlations of the<br />
Lower-Middle Silurian <strong>and</strong> especially the Upper Silurian<br />
formations are not as precise as the underlying Ordovician <strong>and</strong><br />
overlying Devonian units. For example, correlation of the<br />
mainly unfossiliferous Salina <strong>and</strong> Bass Isl<strong>and</strong>s Formations is<br />
based only on the stratigraphic positions of these units. See<br />
Telford (1978) <strong>and</strong> Winder et al. (1975) for further review of<br />
this situation.<br />
Lower Devonian. In southwestern <strong>Ontario</strong>, the Lower<br />
Devonian was mainly a time of emergence <strong>and</strong> erosion. The<br />
oldest Devonian strata of the region are quartzitic s<strong>and</strong>stones<br />
of the Oriskany Formation which occur as erosional remnants in<br />
depressions on the irregular Upper Silurian surface. The<br />
formation has been positively identified at only one locality<br />
in <strong>Ontario</strong>, outcropping in an approximately 600 hectare area,<br />
10 km east of Hagersville (Fig. 1; Winder <strong>and</strong> Sanford, 1972;<br />
Uyeno et al., 1982; Telford <strong>and</strong> Johnson, 1984). Sanford<br />
(1968) suggested that the formation may be present elsewhere<br />
in the subsurface of southwestern <strong>Ontario</strong>. S<strong>and</strong>stones of the
37<br />
Oriskany have a wide distribution in the Appalachian Basin <strong>and</strong><br />
the <strong>Ontario</strong> occurrences are probably close to the northern<br />
depositional edge of the unit.<br />
The Oriskany Formation was deposited during the middle<br />
Early Devonian (Pragian) <strong>and</strong> was, in turn, subjected to<br />
erosion before deposition of the overlying Bois Blanc<br />
Formation during the late Early Devonian. The Bois Blanc<br />
Formation is an eastward thinning carbonate wedge, up to 50 m<br />
thick in southwestern <strong>Ontario</strong>, <strong>and</strong> only 3-15 m thick on the<br />
Niagara Peninsula (Uyeno et al. 1982). It is essentially a<br />
Michigan Basin rock unit which spilled over the Algonquin Arch<br />
<strong>and</strong> overlapped <strong>and</strong> intertongued with clastic <strong>and</strong> carbonate<br />
units of the Appalachian Basin. The Bois Blanc consists of<br />
argillaceous fossiliferous" limestone, dolomitic limestone,<br />
abundant chert, <strong>and</strong> a glauconitic s<strong>and</strong>y facies sporadically<br />
developed in its basal part.<br />
Lower-Middle Devonian carbonates. Overlying the Bois<br />
Blanc Formation is a variable sequence of limestones <strong>and</strong><br />
dolostones of upper Lower to lower Middle Devonian age. On<br />
the Niagara Peninsula, the Bois Blanc is overlain with<br />
possible disconformity by coral-rich biostromal limestones of<br />
the Edgediff Member of the Onondaga Formation (Telford <strong>and</strong><br />
Tarrant, 1975b). In western New York State the Onondaga<br />
Formation has been divided into four limestone members (in<br />
ascending order: Edgediff, Clarence, Moorehouse, <strong>and</strong> Seneca -<br />
see Oliver 1976) <strong>and</strong> the lower three can be traced into the<br />
Niagara Peninsula of <strong>Ontario</strong>, as far west as Port Dover
38<br />
(Telford <strong>and</strong> Tarrant 1975a, b; Telford <strong>and</strong> Hamblin 1980).<br />
Farther west, the Appalachian Basin Onondaga limestones grade<br />
laterally into limestones <strong>and</strong> dolostones of the Michigan Basin<br />
Detroit River Group.<br />
The lower unit of the Detroit River Group is the<br />
Amherstburg Formation which consists of bituminous, chertrich,<br />
bioclastic limestone. Its lateral relationships with<br />
the Onondaga Formation are not clear because of a lack of<br />
outcrops <strong>and</strong> subsurface data in key areas. Its contact<br />
relationships with the underlying Bois Blanc Formation are<br />
poorly understood because the lithological similarities<br />
between the units preclude accurate discrimination in<br />
subsurface records (Beards 1967). Around the southern part of<br />
the Michigan Basin, in <strong>Ontario</strong> (Windsor-Essex area) <strong>and</strong><br />
Michigan, the carbonates of the lower Amherstburg intertongue<br />
with str<strong>and</strong>-line <strong>and</strong> aeolian quartzitic s<strong>and</strong>stones of the<br />
Sylvania Member. To the north, in Bruce <strong>and</strong> Huron Counties,<br />
the Amherstburg contains extensive reefal deposits (Sanford,<br />
1968). Termed the Formosa Reef Limestone, these reefs <strong>and</strong><br />
bioherms were part of a large platform reef development which<br />
characterized the south-eastern rim of the Michigan Basin<br />
during the time of Amherstburg deposition. Toward the centre<br />
of the Michigan Basin the Amherstburg is largely a dolomitic<br />
unit.<br />
Conformably overlying the Amherstburg Formation is the<br />
Lucas Formation, a complex unit with a variety of lithologies.<br />
In the central Michigan Basin it is basically an evaporite,
39<br />
made up of salt <strong>and</strong> anhydrite interbedded with anhydritic<br />
dolostones <strong>and</strong> limestones (Sanford, 1968). Around the margins<br />
of the basin, such as the Algonquin Arch region of<br />
southwestern <strong>Ontario</strong>, the formation consists of shallow shelf<br />
carbonate deposits of dolostones <strong>and</strong> high purity limestones.<br />
The latter are quarried extensively in the Woodstock-Ingersoll<br />
<strong>and</strong> Amherstburg areas for use in the cement, steel <strong>and</strong><br />
chemical industries. The high purity limestone facies is<br />
often termed the Anderdon Member (Uyeno et al. 1982). Near<br />
Ingersoll the upper part of the Anderdon Member is<br />
characterized by a distinctive s<strong>and</strong>y limestone facies.<br />
The Lucas Formation pinches out rapidly to the east <strong>and</strong>,<br />
in the Simcoe area, the Dundee Formation directly overlies the<br />
older Amherstburg or Onondaga Formations (Telford <strong>and</strong> Hamblin<br />
1980). In <strong>Ontario</strong>, near the southern end of Lake Huron,<br />
thicknesses of 62 m <strong>and</strong> 93 m respectively have been recorded<br />
for the Amherstburg <strong>and</strong> Lucas Formations (Winder <strong>and</strong> Sanford<br />
1972). In OGS drillhole 82-1 near Sarnia (Fig. 5), the total<br />
thickness of the Detroit River Group was 120.65 m (Johnson et<br />
al., 1985).<br />
Overlying the units of the Detroit River Group with<br />
probable slight disconformity are richly fossiliferous<br />
micritic limestones of the Dundee Formation. This unit forms<br />
the bedrock of a broad belt extending across southwestern<br />
<strong>Ontario</strong> from central Lake Erie to Lake Huron; it also
40<br />
underlies part of the Windsor-Essex area <strong>and</strong> Pelee Isl<strong>and</strong> in<br />
Lake Erie (Fig. 1). The Dundee is correlative, in part, with<br />
the Delaware Formation of Ohio <strong>and</strong> the upper part of the<br />
Onondaga Formation in New York (Uyeno et al. 1982). The Tioga<br />
Ash Bed, which separates the Moorehouse <strong>and</strong> Seneca Members of<br />
the Onondaga Formation in New York <strong>and</strong> is a widely used marker<br />
horizon in the Appalachian Basin, may be present in the lower<br />
part of the Dundee Formation but positive confirmation is<br />
still required (Sanford 1968; Uyeno et al. 1982, p.16).<br />
The Dundee Formation has a maximum thickness of 120 m in<br />
the Saginaw Bay area of Michigan (Sanford 1968) but is<br />
considerably thinner in southwestern <strong>Ontario</strong>. Thicknesses of<br />
35-45 m were recorded during the deep drilling phase of the<br />
Oil Shale Assessment Project (Johnson et al. 1985).<br />
Formations of the Detroit River Group are considered to<br />
be of uppermost Lower Devonian (Emsian) age while the<br />
overlying Dundee Formation is of lower Middle Devonian<br />
(Eifelian) age. The Dundee Formation has yielded the richest<br />
<strong>and</strong> most diverse conodont fauna of any Devonian unit in<br />
southwestern <strong>Ontario</strong> (Uyeno et a^. 1982). Preservation of the<br />
conodonts is extremely good <strong>and</strong> collections from the Dundee<br />
have been used in a number of important taxomonic <strong>and</strong><br />
paleoecological studies (e.g. Ferrigno, 1971; Klapper <strong>and</strong><br />
Philip, 1971).<br />
The first recorded occurrences of <strong>oil</strong> in southern<br />
<strong>Ontario</strong>, in the early 1800's, were seeps from shallow
41<br />
reservoirs of Devonian age. The first <strong>oil</strong> well in North<br />
America was dug <strong>and</strong> drilled in 1858 at Oil Springs in<br />
southwestern <strong>Ontario</strong>, discovering crude <strong>oil</strong> in the Dundee<br />
Formation. Since then, almost 4C^ of <strong>Ontario</strong>'s <strong>oil</strong> production<br />
has come from dolomitized zones within the Dundee or<br />
underlying Lucas Formation (Rybansky <strong>and</strong> Trevail 1983). The<br />
shallow <strong>oil</strong> pools of the Dundee continue to attract<br />
considerable interest from the local petroleum exploration<br />
industry.<br />
Middle Devonian <strong>shale</strong>s. The late Middle Devonian Acadian<br />
Orogeny in eastern North America produced significant changes<br />
to the sedimentation patterns of the Appalachian <strong>and</strong> Michigan<br />
Basins. Deposition of fine marine elastics derived from<br />
eastern l<strong>and</strong> areas succeeded the widespread early Middle<br />
Devonian carbonate deposition. In southwestern <strong>Ontario</strong>, the<br />
limestones of the Dundee Formation are overlain by either<br />
black <strong>shale</strong>s of the Appalachian Basin Marcellus Formation or<br />
grey <strong>shale</strong>s of the Michigan Basin Bell Formation.<br />
The principal subject of this report, the Marcellus<br />
Formation is a <strong>potential</strong> <strong>oil</strong> <strong>shale</strong> which forms the bedrock of<br />
a restricted area along the north shore of Lake Erie near Port<br />
Stanley (Fig. 1; see Chapt. 3 for stratigraphic details).<br />
The Bell Formation is the lowermost unit of the Hamilton<br />
Group in southwestern <strong>Ontario</strong>. Overlying units in ascending<br />
order, are the Rockport Quarry (limestone), Arkona (<strong>shale</strong>),<br />
Hungry Hollow (limestone), Widder (<strong>shale</strong>, siltstone,
42<br />
limestone), <strong>and</strong> Ipperwash (limestone) Formations. The<br />
Hamilton Group of <strong>Ontario</strong> correlates with the middle part of<br />
the Hamilton Group in New York State <strong>and</strong> with the Traverse<br />
Group of Michigan. The <strong>Ontario</strong> rock units actually lie in a<br />
transition zone between the largely clastic units of the New<br />
York (Appalachian Basin) sequence <strong>and</strong> the largely carbonate<br />
sequence in the Michigan Basin.<br />
Maximum total thickness of the Hamilton Group in <strong>Ontario</strong><br />
is about 93 m (Winder <strong>and</strong> Sanford, 1972). The following<br />
formation thicknesses were measured in OGS drillhole 82-1<br />
(Johnson et al. 1985).<br />
Ipperwash Formation - 1.99 m<br />
Widder Formation - 21.44 m<br />
Hungry Hollow Formation - 2.00 m<br />
Arkona Formation - 32.10 m<br />
Rockport Quarry Formation - 5.76 m<br />
Bell Formation - 14.57 m<br />
Total - 77.86 m<br />
The Ipperwash Formation is actually quite variable in<br />
thickness (0-13 m) because of irregular erosion of these<br />
limestones during the hiatus which preceded deposition of the<br />
overlying Kettle Point Formation (see below). The Rockport<br />
Quarry Formation is much thicker in Michigan (averaging about<br />
20 m) <strong>and</strong> the <strong>Ontario</strong> occurrences are close to the eastern
43<br />
depositional edge of the unit. The richly fossiliferous<br />
Hungry Hollow Formation is noteworthy in that it maintains its<br />
low thickness over a large area <strong>and</strong> can be traced accurately<br />
in the subsurface using geophysical logs from <strong>oil</strong> <strong>and</strong> gas<br />
exploration wells (Beards, 1967; Telford 1976).<br />
The Hamilton Group in southwestern <strong>Ontario</strong> is considered<br />
to be of lower Givetian age (Uyeno et al. 1982). However,<br />
paleontological data are poor for the lower units (lower<br />
Arkona down to Bell), which occur only in the subsurface, <strong>and</strong><br />
they may range as old as upper Eifelian.<br />
Upper Devonian. The change from carbonate-dominated to<br />
clastic-dominated deposition, which began during the Middle<br />
Devonian, culminated in the Upper Devonian with deposition of<br />
noncalcareous black <strong>shale</strong>s throughout the sedimentary basins<br />
of eastern North America. In southwestern <strong>Ontario</strong> this<br />
depositional episode is represented by the Kettle Point<br />
Formation, a <strong>potential</strong> <strong>oil</strong> <strong>shale</strong> <strong>and</strong> one of the principal<br />
targets of the Oil Shale Assessment Project. The Kettle Point<br />
<strong>and</strong> its equivalents in the Michigan, Appalachian, Illinois,<br />
<strong>and</strong> Moose River Basins are known collectively as the Eastern<br />
Gas Shales <strong>and</strong> are reviewed in more detail in Chapter 2.3.<br />
The older Marcellus Formation <strong>and</strong> correlative black <strong>shale</strong>s<br />
also are referred to as part of the Eastern Gas Shales<br />
sequence <strong>and</strong> are discussed in Chapter. 2.3.<br />
Conodont studies suggest that the Kettle Point Formation,<br />
where it is fully preserved, may span almost the entire Upper
44<br />
Devonian, ranging from early Frasnian to late Famennian age<br />
(Uyeno et al. 1982).<br />
The youngest Devonian, indeed the youngest Paleozoic<br />
units in southwestern <strong>Ontario</strong>, are the formations of the Port<br />
Lambton Group. In ascending order, they consist of the<br />
Bedford (grey <strong>shale</strong>s), Berea (s<strong>and</strong>stone), <strong>and</strong> Sunbury (black<br />
<strong>shale</strong>) Formations which have a combined maximum thickness in<br />
<strong>Ontario</strong> of about 62 m (Winder <strong>and</strong> Sanford 1972). They occur<br />
in the subsurface of a small area south of Sarnia bordering<br />
the St. Clair River (Fig. 1). In OGS drillhole 82-1 (Johnson<br />
et al. 1985), 33.4 m of dark grey <strong>shale</strong> referable to the<br />
Bedford Formation was present, overlying the Kettle Point<br />
Formation with probable disconformity. The age of the Port<br />
Lambton Group has been uncertain with some workers assigning<br />
it to the Upper Devonian <strong>and</strong> others suggesting Lower<br />
Mississippian. An uppermost Devonian age is now generally<br />
accepted (Uyeno et al. 1982).<br />
2.3 Eastern Gas Shales<br />
Middle Devonian to Lower Mississippian black <strong>shale</strong>s of<br />
eastern North America directly underlie or occur in the<br />
subsurface of a large area extending from Alabama <strong>and</strong> Oklahoma<br />
in the south to <strong>Ontario</strong> <strong>and</strong> Michigan in the north <strong>and</strong> as far<br />
west as Iowa (Fig. 6). The Upper Devonian Long Rapids<br />
Formation of the Moose River Basin in northeastern <strong>Ontario</strong>,<br />
now isolated from the Paleozoic sedimentary basins in the
45<br />
south, probably represents the most northerly extent of the<br />
black <strong>shale</strong> deposition.<br />
In response to the energy shortages of the early 1970's,<br />
the United States Department of Energy organized the Eastern<br />
Gas Shales Project. Its principal objective was to study the<br />
largely Devonian black <strong>shale</strong>s of eastern North America<br />
particularly in reference to natural gas production. However<br />
this also led to evaluation of the <strong>shale</strong> <strong>oil</strong> <strong>potential</strong> of the<br />
units. Thus, over the past decade a prodigious body of new<br />
data has been generated which relates directly <strong>and</strong> indirectly<br />
to the O.G.S. evaluation of the <strong>oil</strong> <strong>shale</strong>s in <strong>Ontario</strong>. For a<br />
review of the U.S. program <strong>and</strong> its results see Janka <strong>and</strong><br />
Dennison (1980), Matthews (1983), Roen (1984).<br />
The bulk of the U.S. studies have been focussed on the<br />
black <strong>shale</strong> sequences of the Appalachian Basin although<br />
considerable information has also been gathered <strong>and</strong><br />
synthesized concerning the correlative sequences in the<br />
Illinois <strong>and</strong> Michigan Basins. An important result of the<br />
various programs has been the development of detailed<br />
stratigraphic frameworks for all of the areas of interest <strong>and</strong><br />
the capability for precise biostratigraphic correlation of the<br />
black <strong>shale</strong> sequences within <strong>and</strong> between the basins. For<br />
example, the distinctive algal microfossil Foerstia has been<br />
recognized as a consistent stratigraphic time marker within<br />
Upper Devonian black <strong>shale</strong>s of the Appalachian, Illinois, <strong>and</strong><br />
Michigan Basins, including the Kettle Point Formation of<br />
southwestern <strong>Ontario</strong> (Matthews 1983; Russell 1985). The use
46<br />
Devonian black "h-1- in eastern North
47<br />
of downhole gamma-ray logs for fine subdivision of black <strong>shale</strong><br />
sequences <strong>and</strong> for accurate lithostratigraphic correlation of<br />
sequences in adjoining areas has been demonstrated by Ells<br />
(1978) <strong>and</strong> Russell (1985). As noted by Roen (1984), the<br />
biostratigraphic <strong>and</strong> lithostratigraphic markers that have been<br />
identified, <strong>and</strong> the regional stratigraphic frameworks that<br />
t<br />
have been developed, are allowing correlations with such<br />
precision that, for example, a 4-5 m <strong>shale</strong> sequence in<br />
Tennessee can be related to a 900 m <strong>shale</strong> sequence in New York<br />
State.<br />
Within the Appalachian Basin there were essentially two<br />
phases of Devonian black <strong>shale</strong> deposition. The earlier,<br />
somewhat stratigraphically <strong>and</strong> geographically restricted,<br />
Middle Devonian phase included strata to which the Marcellus<br />
Formation of southwestern <strong>Ontario</strong> is equivalent. The later,<br />
more extensive, Upper Devonian phase includes the sequences to<br />
which <strong>Ontario</strong>'s Kettle Point <strong>and</strong> Long Rapids Formations are<br />
correlative.<br />
The general depositional histories of the Middle <strong>and</strong><br />
Upper Devonian sequences followed a similar pattern. The<br />
<strong>shale</strong>s were formed in a broad shallow waterway known as the<br />
Chattanooga Sea which covered most of the eastern United<br />
States <strong>and</strong> extended into <strong>Ontario</strong> (Janka <strong>and</strong> Dennison, 1980).<br />
This marine basin or series of basins was probably open to the<br />
south (according to present day orientation of compass<br />
directions), bounded on the east by highl<strong>and</strong>s of the ancestral<br />
Appalachian Mountains, <strong>and</strong> confined in the north <strong>and</strong> west by
48<br />
Precambrian <strong>and</strong> Lower Paleozoic rocks of the stable<br />
continental craton.<br />
The global position of the North American continent<br />
during the Devonian was markedly different from its present<br />
day location. It was rotated perhaps as much as 9O 0 from its<br />
present-day orientation <strong>and</strong> the region of the Chattanooga Sea<br />
lay at about 10 0 south latitude . Because of the restricted<br />
nature of the sea, stagnant conditions probably prevailed at<br />
certain times in the warm shallow waters, <strong>and</strong>, combined with<br />
prolific growth of phytoplankton <strong>and</strong> other organisms, this<br />
resulted in deposition of organic-rich sediments.<br />
Greatest accumulation of the <strong>shale</strong>s took place in the<br />
eastern part of the Chattanooga Sea in what is now referred to<br />
as the Appalachian Basin. This was mainly due to the greater<br />
influx of terrigenous sediments into this region from the<br />
nearby eastern highl<strong>and</strong>s. Up to several thous<strong>and</strong> metres<br />
thickness of black <strong>shale</strong>s have been recorded in West Virginia<br />
(Janka <strong>and</strong> Dennison, 1980), in the east-central Appalachian<br />
Basin. In the neighbouring Illinois <strong>and</strong> Michigan Basins, to<br />
the west <strong>and</strong> northwest respectively, only 100-300 metres<br />
thickness of <strong>shale</strong>s were deposited. The depositional centres<br />
of these basins were separated from the larger Appalachian<br />
Basin by the Cincinatti, Findlay, <strong>and</strong> Algonquin Arches (Fig.<br />
6). Although these arches <strong>and</strong> other structural highs such as
49<br />
the Nashville Dome did not completely impede circulation of<br />
the marine waters <strong>and</strong> sediments among the basins, they did<br />
have a significant effect on regional depositional patterns.<br />
This is exemplified by the character <strong>and</strong> distribution of the<br />
Marcellus <strong>and</strong> Kettle Point Formations in southwestern <strong>Ontario</strong>.<br />
As discussed later in this report, the Marcellus<br />
Formation appears to wedge out against the southeastern flank<br />
of the Algonquin Arch, <strong>and</strong> equivalent Middle Devonian black<br />
<strong>shale</strong>s have not been recognized in the Michigan Basin. The<br />
Kettle Point Formation, with a maximum thickness of only about<br />
70 m, represents an area with a lower rate of sedimentation in<br />
comparison to adjoining basinal areas (Russell, 1985).<br />
The wide geographic extent <strong>and</strong> relatively broad<br />
stratigraphic range of the Devonian <strong>shale</strong>s of eastern North<br />
America have led to a plethora of formational names <strong>and</strong> other<br />
stratigraphic terms. This is inevitable as different workers<br />
operating from different conceptual bases or in geographically<br />
restricted areas have attempted to name <strong>and</strong> subdivide the<br />
<strong>shale</strong> sequences. Janka <strong>and</strong> Dennison (1980) produced a series<br />
of tables which usefully summarize the stratigraphic<br />
terminology for the eastern United States. More recently,<br />
Matthews (1983) discussed the correlation of major Upper<br />
Devonian black <strong>shale</strong> units between the Appalachian, Illinois,<br />
<strong>and</strong> Michigan Basins. As part of the O.G.S. Oil Shale
50<br />
Assessment Project, Russell (1985) reviewed current<br />
terminology with respect to the Kettle Point Formation of<br />
<strong>Ontario</strong>. Rickard (1984) provided new interpretations of the<br />
correlation of the Marcellus Formation in the Lake Erie<br />
region. Figure 7 illustrates diagrammatically the<br />
relationship of the Marcellus <strong>and</strong> Kettle Point Formations of<br />
<strong>Ontario</strong> with other Devonian black <strong>shale</strong> units of eastern North<br />
America. Correlation of <strong>Ontario</strong>'s Marcellus Formation with<br />
other Middle Devonian black <strong>shale</strong> sequences in the Appalachian<br />
Basin is discussed more fully in Chapter 3.6.<br />
As well as being evaluated as a source of natural gas by<br />
the Eastern Gas Shales Project, the Devonian black <strong>shale</strong>s of<br />
eastern North America have also been studied as <strong>potential</strong><br />
uranium areas (Swanson 1960) <strong>and</strong> as disposal media for nuclear<br />
waste (Lomenick 1983). As noted previously, the Eastern Gas<br />
Shale Project has also given impetus to the assessment of the<br />
<strong>shale</strong>s as a major <strong>oil</strong> <strong>shale</strong> resource. A survey by the<br />
Institute of Gas Technology, reported by Janka <strong>and</strong> Dennison<br />
(1980), estimated a surface-mineable <strong>oil</strong> <strong>shale</strong> resource in the<br />
eastern United States of 423 billion barrels of <strong>oil</strong>, based on<br />
processing the <strong>shale</strong>s using the patented IGT HYTORT system.<br />
Clearly, this is a theoretical resource value <strong>and</strong> many other<br />
technical <strong>and</strong> socio-economic factors must be taken into<br />
account.<br />
Oil yields by conventional retorting processes from the<br />
eastern <strong>shale</strong>s are much lower than those from the well-known<br />
Eocene-age Green River Formation of Colorado (Robl <strong>and</strong>
.51<br />
MICHIGAN OHIO<br />
TUB - ItffS LICK BED<br />
Fig. 7. Diagrammatic representation of stratigraphic<br />
relationships of Devonian black <strong>shale</strong>s of the<br />
Appalachian <strong>and</strong> Michigan Basins (after Matthews<br />
1983) .
52<br />
Koppenaal 1982). Also, although the total hydrocarbon<br />
resource of the eastern <strong>shale</strong>s is greater, <strong>and</strong> they are more<br />
widespread, their mineable high yield zones are usually<br />
thinner than the Colorado <strong>oil</strong> <strong>shale</strong>s. Exploration of the<br />
eastern <strong>oil</strong> <strong>shale</strong>s will therefore be dependent on the<br />
development of improved mining <strong>and</strong> processing technologies<br />
(see Chapter 5 for further discussion concerning exploitation<br />
of <strong>Ontario</strong>'s <strong>potential</strong> <strong>oil</strong> <strong>shale</strong>s). Nevertheless, the Devonian<br />
black <strong>shale</strong>s of eastern North America constitute an important<br />
hydrocarbon resource whose <strong>potential</strong> impact on future energy<br />
supply scenarios cannot be ignored.
53<br />
3. STRATIGRAPHY OF THE MARCELLUS FORMATION<br />
3.l Introduction<br />
The Middle Devonian Marcellus Formation is one of the<br />
most poorly defined stratigraphic units in <strong>Ontario</strong>. It is not<br />
exposed in the Province <strong>and</strong>, prior to this study, was known<br />
only from dark <strong>shale</strong> well cuttings obtained from petroleum<br />
exploration wells <strong>and</strong> from poorly defined geophysical<br />
signatures (Musial 1982).<br />
In an attempt to resolve the identity of this unit in<br />
conjunction with the aims of the Oil Shale Assessment Project,<br />
the <strong>Ontario</strong> Geological Survey undertook a detailed drilling<br />
programme of the unit during 1982-1983. Six fully cored <strong>and</strong><br />
geophysically logged boreholes were drilled at locations where<br />
<strong>shale</strong>s of the Marcellus Formation had been previously shown<br />
(Sanford 1969b) to form the bedrock surface (Fig. 8 <strong>and</strong> Table<br />
4). Five holes were shallow, being directed specifically at<br />
the Marcellus Formation (M-5 to M-9 - see Johnson 1985), <strong>and</strong><br />
one was extended from surface to the Precambrian to test for<br />
the presence of deeper <strong>oil</strong> <strong>shale</strong>s (i.e. Collingwood Member of<br />
the Lindsay Formation) <strong>and</strong> to provide data for regional<br />
correlations (OGS 82-3 Port Stanley - see Johnson et al.<br />
1985).<br />
Only four holes (M-5, M-6, M-8, <strong>and</strong> OGS 82-3) intersected<br />
strata tentatively identified as the Marcellus Formation. The<br />
uppermost bedrock in the remaining two shallow drillholes was
54<br />
DRILL HOLE LOCATION3<br />
1 M-0<br />
2 OQS 82-3<br />
3 M-8<br />
4 M-7<br />
6 M-6<br />
O M-6<br />
Fig. 8. Location of OGS drillholes, M-5 to M-9 <strong>and</strong> OGS 82-3,<br />
Port Stanley area.
55<br />
Hole<br />
Number<br />
Glacial Cover<br />
Thickness (m)<br />
Bell Fm.<br />
(m)<br />
Marcellus<br />
Fm. (m)<br />
Dundee Fm.<br />
(m)<br />
Depth to top<br />
of Marcellus<br />
(m)<br />
Drill Hole<br />
Total Depth .<br />
(m)<br />
M-5<br />
95.5<br />
12.1<br />
3.3<br />
6.4<br />
108.6<br />
117.7<br />
M-6<br />
88.0<br />
5.3<br />
3.2<br />
4.9<br />
93.3<br />
101.4<br />
M- 7<br />
48.8<br />
N/E .<br />
N/E<br />
14.3<br />
N/E<br />
63.1<br />
M-8<br />
84.2<br />
N/E<br />
3.4<br />
12.3<br />
84.2<br />
99.9<br />
M-9<br />
54.0<br />
N/E<br />
N/E<br />
5.1<br />
N/E<br />
59.1<br />
OGS-82-3<br />
79.8<br />
12.5<br />
5.4<br />
32.8<br />
92.3<br />
1165.5<br />
N/E:- Formation not encountered in this drill hole.<br />
TABLE 4. SUMMARY OF OGS DRILL HOLES FOR THE MARCELLUS FORMATION
56<br />
the Dundee Formation which stratigraphically underlies the<br />
Marcellus. In all drillholes the bedrock was buried by thick<br />
sequences (up to 100 m) of Pleistocene glacial <strong>and</strong><br />
glaciolacustrine sediments.<br />
The Marcellus Formation has been previously interpreted<br />
as an elliptical lens shaped body extending below Lake Erie<br />
(Musial 1984) <strong>and</strong> to a limited extent beneath l<strong>and</strong> around Port<br />
Stanley (Sanford 1969b). To minimize drilling costs <strong>and</strong> to<br />
maximize the data gathering <strong>potential</strong>, the OGS drillholes were<br />
arranged in an east-west pattern as close to the Lake Erie<br />
shoreline as possible (Fig. 8). The high cost of offshore<br />
drilling made this activity prohibitive, which unfortunately<br />
meant that the most reliable information (i.e. core samples)<br />
could only be obtained from the erosional or facies-edge of<br />
the unit (see Isopach map - back pocket).<br />
Immediately evident from the OGS cored holes was a strong<br />
relationship between the presence of organic rich- beds in the<br />
Marcellus <strong>and</strong> peaks in the natural gamma log (Johnson 1985).<br />
Thus, to augment information available from the OGS<br />
drillholes, Marcellus intervals were also interpreted, using<br />
natural gamma logs, from an additional one hundred <strong>and</strong> five<br />
<strong>oil</strong> <strong>and</strong> gas exploration wells drilled both in Lake Erie <strong>and</strong><br />
nearby onshore areas (Appendix 3). This information was made<br />
available by the Petroleum Resources Laboratory, Ministry of<br />
Natural Resources, London, <strong>Ontario</strong>. Well cuttings from these
57<br />
holes were also examined. The resource evaluation (Chapter 5)<br />
is based largely on this exploration data.<br />
3.2 Historical Review<br />
The term "Marcellus" was first introduced by Hall (1839)<br />
for a sequence of <strong>shale</strong>s <strong>and</strong> limestones containing a<br />
distinctive faunal assemblage which outcrop at Slate Hill,<br />
near the town of Marcellus, New York State. The Marcellus<br />
Formation was noted to overlie the Onondaga Limestone (Hall<br />
1839) <strong>and</strong> to be overlain in turn by <strong>shale</strong>s of the Hamilton<br />
Group (Vanuxem, 1840). Currently, the Marcellus Formation of<br />
New York State is considered to be a unit within the Hamilton<br />
Group <strong>and</strong> has, itself, been subdivided into the Union Springs,<br />
Cherry Valley, <strong>and</strong> Oatka Creek Members (Cooper 1930; Rickard<br />
1984) .<br />
Early Canadian workers failed to identify the Marcellus<br />
Formation in <strong>Ontario</strong>. It was not until Stauffer (1912) noted<br />
the presence of a dark <strong>shale</strong> overlying the Onondaga Limestone<br />
(now Dundee Formation), in petroleum exploration wells drilled<br />
in Norfolk <strong>and</strong> Elgin Counties, that the occurrence of the<br />
Marcellus Formation in southwestern <strong>Ontario</strong> was first<br />
suspected. Stauffer (1915) also was the first to report black<br />
<strong>shale</strong> fragments washed up on the Lake Erie shore near Port<br />
Stanley. The occurrence of outcrops of the Marcellus<br />
Formation below lake level was suggested.
58<br />
In his 1915 description of the Marcellus Formation,<br />
Stauffer included strata that subsequently have been assigned<br />
to the overlying Bell Formation. He also suggested that<br />
outcrops of apparent black <strong>shale</strong>s in the Selkirk-Cheapside<br />
area (part of the present Regional Municipality of Haldim<strong>and</strong>-<br />
Norfolk) were referable to the Marcellus Formation. These are<br />
now known to be weathered bituminous limestones of the Dundee<br />
Formation (Telford <strong>and</strong> Tarrant 1975a).<br />
More recent publications dealing with the Devonian strata<br />
of southwestern <strong>Ontario</strong> (e.g. Caley 1945; Sanford <strong>and</strong> Brady<br />
1955; Sanford 1968; Uyeno et al. 1982) usually contain only<br />
brief mention of the Marcellus Formation. Clearly, this<br />
reflects the fact that the Marcellus is not exposed in the<br />
province. The only in-depth study of the unit to date was by<br />
Musial (1984).<br />
Correlation of the Marcellus Formation as defined in New<br />
York State with the Marcellus Formation as commonly used in<br />
southwestern <strong>Ontario</strong> is a contentious issue. Recent<br />
publications by Rickard (e.g. 1984) suggest that the Marcellus<br />
Formation of New York State is correlative with the Bell,<br />
Rockport Quarry, <strong>and</strong> Arkona Formations of the Hamilton Group<br />
in southwestern <strong>Ontario</strong>. An implication of this<br />
interpretation is that the black <strong>shale</strong>s overlying the Dundee<br />
Formation in the Port Stanley area are merely a minor lower<br />
part of the Bell Formation. Also, in order for the<br />
correlation scheme to "fit", Rickard (1984) invoked a major<br />
disconformity between the Arkona Formation <strong>and</strong> overlying
59<br />
Hungry Hollow Formation. This interpretation is quite<br />
different from the Devonian stratigraphic scheme described by<br />
Uyeno et al. (1982) <strong>and</strong> it has been challenged by Sparling<br />
(1985).<br />
Resolution of these stratigraphic issues was beyond the<br />
scope of this <strong>oil</strong> <strong>shale</strong> resource evaluation of the Marcellus<br />
Formation. The nomenclatural system adopted for the present<br />
work is that of Uyeno et al. (1982). However, it is hoped<br />
that the fundamental data generated by the Oil Shale<br />
Assessment Project can be used in future studies to establish<br />
precise correlations between <strong>Ontario</strong>'s Devonian sequence <strong>and</strong><br />
those of neighbouring New York, Ohio <strong>and</strong> Michigan.<br />
3.3 Distribution<br />
Accurate delineation of the geographic limits of the<br />
Marcellus Formation in southwestern <strong>Ontario</strong> is difficult,<br />
especially because of the absence of outcrops <strong>and</strong> the paucity<br />
of reliable drillcore. As noted earlier, the most abundant<br />
data useful for distribution <strong>and</strong> thickness interpretations are<br />
the results of downhole geophysical logging in petroleum<br />
exploration wells.<br />
Peak or increased values which identify organic-rich beds<br />
of the Marcellus Formation are displayed in gamma ray,<br />
neutron, density <strong>and</strong>, to some extent, focussed electric logs.<br />
Only the gamma ray <strong>and</strong> neutron logs are commonly run in<br />
petroleum exploration wells drilled in Lake Erie <strong>and</strong> onshore
60<br />
areas of southwestern <strong>Ontario</strong>. Of these, the gamma ray log is<br />
the most common <strong>and</strong> it has been used in the distributional<br />
analysis of the Marcellus Formation.<br />
In Figure 9, a typical gamma ray log for the Marcellus<br />
Formation (from drillhole M-6, see Fig. 8) is compared with a<br />
log from a drillhole located well beyond the apparent subcrop<br />
limits of the Marcellus (OGS-82-2 Chatham, Johnson et al.<br />
1985). The M-6 log displays three peak responses (ranging up<br />
to 150 API units) which correspond with black organic-rich<br />
beds. The integrated drillhole log for M-6 in Appendix 2<br />
illustrates this lithological-geophysical relationship.<br />
In the M-6 hole two of the organic-rich beds lie within<br />
the Marcellus Formation <strong>and</strong> one seems to be part of the<br />
overlying Bell Formation. Other lithological parameters, as<br />
described in Chapter 3.5, have been used to discriminate<br />
Marcellus from Bell in southwestern <strong>Ontario</strong>. Total organic<br />
carbon values for the organic-rich beds are listed in Table 5<br />
<strong>and</strong> are also shown on the M-6 integrated drillhole log in<br />
Appendix 2. As illustrated in Fig. 9 <strong>and</strong> Appendix 2,<br />
limestone beds <strong>and</strong> non-organic <strong>shale</strong> beds in the Marcellus<br />
Formation give very similar log responses.<br />
Organic-rich <strong>shale</strong> beds typical of the Marcellus<br />
Formation were not observed in the Chatham (OGS 82-2)<br />
drillhole (Johnson et al. 1985). This is confirmed by the<br />
gamma ray log which does not contain the characteristic peaks<br />
as shown in the M-6 log. The slight peak at the base of the<br />
Bell Formation in the Chatham log may reflect bituminous
61<br />
400 FORMATION O,<br />
\<br />
OGS-82-2<br />
(CHATHAM)<br />
CAP!)<br />
FORMATION<br />
ARKONA<br />
overburden<br />
ROCKPORT<br />
^ QUARRY<br />
BELL<br />
BELL<br />
L MARCELLUS<br />
100<br />
DUNDEE<br />
^DUNDEE<br />
(m)<br />
(m)<br />
Fig. 9. Comparative gamma ray logs for OGS drill holes M6<br />
<strong>and</strong> 82-2 (drillholes with <strong>and</strong> without Marcellus<br />
Formation).
62<br />
TABLE 5. Organic Geochemical data for the Marcellus Formation <strong>and</strong><br />
adjacent units<br />
M- 5<br />
Bell<br />
Formation<br />
Marcellus<br />
Formation<br />
M-6<br />
Interval<br />
Undif ferentiated<br />
it<br />
H<br />
H<br />
H<br />
n<br />
M<br />
n<br />
Upper Organic<br />
Carbonate<br />
Carbonate<br />
Lower Organic<br />
Depth Analysis<br />
From (m) To #<br />
96.03<br />
99.95<br />
102.48<br />
103.78<br />
105.76<br />
106.14<br />
106.61<br />
107.27<br />
108.61<br />
109.26<br />
109.80<br />
111.00<br />
96.23<br />
100.14<br />
102.75<br />
104.38<br />
105.97<br />
106.51<br />
107.02<br />
107.67<br />
108.82<br />
109.80<br />
110.25<br />
111.19<br />
1053<br />
1054<br />
1291<br />
1292<br />
1055<br />
1293<br />
1294<br />
1295<br />
1056<br />
1296<br />
1297<br />
1057<br />
TOTAL ORGANIC<br />
CARBON<br />
%<br />
0.9<br />
4.4<br />
2.6<br />
2.3<br />
0.6<br />
0.5<br />
0.6<br />
0.5<br />
11.4<br />
1.2<br />
0.5<br />
4.3<br />
Bell<br />
Formation<br />
Marcellus<br />
Formation<br />
M- 8<br />
Undif ferentiated<br />
H<br />
H<br />
H<br />
II<br />
H<br />
II<br />
II<br />
Upper Organic<br />
Upper Shale<br />
Carbonate<br />
Lower Organic<br />
88.22<br />
88.58<br />
89.06<br />
90.17<br />
91.00<br />
91.49<br />
92.10<br />
93.28<br />
93.64<br />
94.12<br />
94.60<br />
96.01<br />
88.42<br />
88.95<br />
89.41<br />
90.53<br />
91.37<br />
91.73<br />
92.43<br />
93.62<br />
93.86<br />
94.17<br />
95.02<br />
96.20<br />
1059<br />
1298<br />
1299<br />
1300<br />
1301<br />
1060<br />
1302<br />
1303<br />
1061<br />
1304<br />
1305<br />
1062<br />
2.76<br />
2.3<br />
1.9<br />
0.8<br />
0.3<br />
0.5<br />
0.6<br />
0.5<br />
9.8<br />
0.8<br />
0.5<br />
4.3<br />
Marcellus<br />
Formation<br />
Upper Shale<br />
H n<br />
H If<br />
Carbonate<br />
H<br />
Lower Shale<br />
H H<br />
H H<br />
H tt<br />
Lower Organic<br />
n H<br />
it H<br />
H tt<br />
84.25<br />
84.51<br />
84.76<br />
85.00<br />
85.25<br />
85.50<br />
85.75<br />
86.00<br />
86.25<br />
86.50<br />
86.76<br />
86.96<br />
87.21<br />
84.47<br />
84.76<br />
85.00<br />
85.25<br />
85.50<br />
85.75<br />
86.00<br />
86.25<br />
86.50<br />
86.74<br />
86.96<br />
87.21<br />
87.50<br />
1064<br />
1526<br />
1527<br />
1528<br />
1529<br />
1530<br />
1531<br />
1532<br />
1533<br />
1534<br />
1065<br />
1535<br />
1536<br />
1.9<br />
1.4<br />
0.8<br />
0.2<br />
0.2<br />
0.2<br />
0.3<br />
0.4<br />
0.3<br />
2.4<br />
4.5<br />
2.8<br />
3.1<br />
Dundee<br />
Formation<br />
Undif ferentiated<br />
tt<br />
Organic Interbed<br />
Undif ferentiated<br />
87.50<br />
87.75<br />
87.89<br />
88.09<br />
87.75<br />
87.89<br />
88.09<br />
88.25<br />
1537<br />
1538<br />
1066<br />
1539<br />
1.3<br />
0.2<br />
5.3<br />
1.3
63<br />
TABLE 5. Organic Geochemical Data for the Marcellus Formation <strong>and</strong><br />
adjacent units (Cont'd)<br />
M-8<br />
Interval<br />
De] pth Analysis<br />
From (ir0 To #<br />
Total Organic<br />
Carbon<br />
%<br />
Dundee<br />
Formation<br />
Undif ferentiated<br />
M<br />
it<br />
H<br />
ti<br />
H<br />
M<br />
' II<br />
88.25<br />
88.50<br />
88.75<br />
89.00<br />
89.25<br />
89.50<br />
89.75<br />
89.75<br />
88.50 1540<br />
88.75 1541<br />
89.00 1542<br />
89.25 1543<br />
89.50 1544<br />
89.75 1545<br />
90.00 1546<br />
90.00 1546<br />
1.2<br />
0.7<br />
0.1<br />
0.1<br />
0.1<br />
0.3<br />
0.1<br />
0.1<br />
0. G. S. -82-3<br />
Bell<br />
Formation<br />
Marcellus<br />
Formation<br />
Dundee<br />
Formation<br />
Undif ferentiated<br />
H<br />
H<br />
Upper Organic<br />
ti ii<br />
Carbonate<br />
Lower Organic<br />
Undif ferentiated<br />
Organic Interbed<br />
Undif ferentiated<br />
79.7<br />
85.77<br />
90.21<br />
93.40<br />
93.57<br />
93.74<br />
94.00<br />
97.08<br />
98.04<br />
100.40<br />
0.57<br />
1.49<br />
0.16<br />
5.96<br />
3.86<br />
0.07<br />
7.38<br />
0.45<br />
3.79<br />
0.47
64<br />
hydrocarbons which tend to be concentrated at that geological<br />
contact.<br />
The gamma ray log response of the Marcellus Formation<br />
does show some variation. In some wells a single peak is<br />
evident; more commonly there are two peaks <strong>and</strong> rarely there<br />
are three. Figure 10 shows a typical transition of gamma ray<br />
log responses between three adjacent drillholes. Note how the<br />
two peaks which define the Marcellus in block #121(A) evolve<br />
into a single peak in block #124(D). Throughout this analysis<br />
the upper peak, as shown in Figure 10, is the most<br />
consistently developed. Where core samples were available for<br />
geochemical analysis, the beds which produced the upper peak<br />
also have higher total organic carbon (TOC) values (see<br />
Appendix 2) than beds represented by the lower peak.<br />
The only regional trend recognized in this distributional<br />
analysis of gamma ray logs was the tendency for the peak<br />
responses to have a blunt or squared-off appearance in logs<br />
from western wells <strong>and</strong> a more spiked appearance in logs from<br />
eastern wells (Fig. 11). This may be the result of more<br />
sharply contrasted lithological variations in the eastern<br />
subcrop area where carbonate <strong>and</strong> inorganic <strong>shale</strong> beds are<br />
thicker <strong>and</strong> more abundant.<br />
The geographic limit of the Marcellus Formation is<br />
defined by the zero contour on the isopach map (Back Pocket).<br />
On-shore it follows an irregular pattern, subparallel to the<br />
shore line, <strong>and</strong> extends between Ridgetown, St. Thomas <strong>and</strong> the<br />
base of Long Point. This boundary follows the pattern used by
65<br />
Block 121(A) lock 1 l 3(0) •leek 124(0)<br />
9<br />
s-i<br />
i<br />
s<br />
\<br />
S<br />
i<br />
l<br />
^x ^ "^<br />
^^<br />
(API) (API)<br />
4 C)0<br />
0<br />
s^<br />
4- f^<br />
.4<br />
•^<br />
"<br />
k-<br />
y^<br />
^.<br />
.-.<br />
300<br />
.4 00— ~——— -i<br />
600<br />
- -<br />
-<br />
,. T<br />
4<br />
*.<br />
'<br />
V<br />
l( \<br />
\<br />
\l<br />
f<br />
s<br />
1<br />
0**<br />
V,<br />
x^<br />
V<br />
.<br />
i<br />
V,<br />
•*,<br />
r?^<br />
^<br />
M**<br />
- ^<br />
410<br />
0<br />
'.f<br />
400<br />
800<br />
600<br />
0<br />
-<br />
it<br />
't<br />
s<br />
t<br />
,<br />
F<br />
r<br />
/ /<br />
i<br />
\<br />
\<br />
A r i i<br />
\^<br />
^<br />
s<br />
V<br />
^<br />
^1<br />
-I-.<br />
JL<br />
-;-<br />
:-;- -.- ^-.<br />
40<br />
-<br />
.-:<br />
400<br />
MARCELLUS<br />
600<br />
000<br />
Fig. 10. Evolution of gamma ray log between adjacent drill<br />
holes in Lake Erie; east to west section, note<br />
change from two Marcellus peaks into one.<br />
Hole Locations:<br />
-Block 121(A) = Lat. 42-29-48, Long. 80-45-38<br />
-Block 123(D) = Lat. 42-29-53, Long. 80-38-21<br />
-Block 124(D) - Lat. 42-29-54, Long. 80-33-20.
o 1<br />
Cg<br />
CO<br />
1<br />
w<br />
d<br />
* oV<br />
O<br />
4<br />
EH<br />
m ind)<br />
c g<br />
o<br />
-H<br />
X!<br />
EH<br />
H<br />
O\<br />
*<br />
Tj*<br />
in<br />
rH<br />
.<br />
H<br />
rtj<br />
x^<br />
25<br />
[-*<br />
vo *<br />
rH<br />
r<br />
ō<br />
4<br />
0<br />
CO<br />
VO<br />
*<br />
H<br />
i^j •\<br />
25<br />
in r*..<br />
o<br />
CO<br />
CO<br />
4<br />
f-<br />
in<br />
H *<br />
o<br />
U)<br />
0 O<br />
CO<br />
1<br />
s<br />
VO<br />
1<br />
S<br />
in<br />
i<br />
S<br />
O * d'd*<br />
O<br />
4<br />
EH<br />
W<br />
W<br />
d)<br />
c e<br />
o<br />
•H<br />
X!<br />
EH<br />
.<br />
0<br />
d<br />
EH<br />
W<br />
(0<br />
d)<br />
c e<br />
o<br />
•H<br />
X!<br />
EH<br />
4<br />
O * eN9<br />
O<br />
4<br />
EH<br />
en en d)<br />
c S<br />
o<br />
-H<br />
X!<br />
EH<br />
w<br />
EH<br />
H<br />
25 ID<br />
W<br />
R H-l<br />
|J<br />
Wo<br />
i<br />
.3;<br />
•*^^<br />
25<br />
V<br />
d)<br />
TJ<br />
O<br />
d)<br />
CỌ<br />
Crt<br />
O<br />
in<br />
4<br />
O<br />
•t<br />
4<br />
rH<br />
H<br />
H<br />
4<br />
O<br />
ST ^— i f<br />
o<br />
-H<br />
C<br />
(d<br />
tT1<br />
j.)<br />
O<br />
1 1<br />
d)<br />
a<br />
D<br />
ro<br />
.<br />
H<br />
TJ x-<br />
d) co<br />
O d<br />
d)<br />
CỌ<br />
0<br />
H<br />
^*<br />
o<br />
rt)<br />
x^<br />
^<br />
in<br />
4<br />
O<br />
m<br />
N.^<br />
d)<br />
iH<br />
(d<br />
X!<br />
w<br />
1 1<br />
d)<br />
S*<br />
eg<br />
4<br />
O<br />
r*-<br />
4<br />
O<br />
in .<br />
0<br />
H<br />
4<br />
H<br />
in<br />
CO *<br />
o<br />
H<br />
4<br />
H<br />
f}<br />
N— '<br />
d)<br />
V<br />
(d Co<br />
J.)<br />
(d<br />
u<br />
n<br />
4<br />
O<br />
VD<br />
H<br />
4<br />
rH<br />
rtj<br />
X.<br />
^*<br />
O<br />
^4<br />
x^<br />
2;<br />
in<br />
0<br />
H<br />
Q*<br />
^-*<br />
d)<br />
rH<br />
(d<br />
r^<br />
W<br />
^1<br />
d)<br />
J5<br />
S<br />
CM<br />
4<br />
CO<br />
CO<br />
VO<br />
o<br />
r) .<br />
^t<br />
in r*s<br />
4<br />
O<br />
CO<br />
*<br />
^*<br />
in<br />
oa<br />
4<br />
O<br />
S*<br />
^— *<br />
O<br />
•H<br />
C<br />
(d IT*<br />
j.i<br />
0<br />
j^ d)<br />
o<br />
w<br />
c o<br />
•H<br />
4}<br />
(d C<br />
•H<br />
g<br />
d)<br />
-P d)<br />
'u<br />
d)<br />
en (d<br />
d)<br />
(d<br />
C<br />
•H<br />
d)<br />
en<br />
3<br />
^J oc<br />
u<br />
•H<br />
. -P<br />
0) 'H<br />
TJ Q,<br />
g<br />
w 7}<br />
d) B*<br />
w s<br />
^i<br />
r"' /-*<br />
^ -H<br />
(d<br />
o *l~' w<br />
c -p<br />
tfl "^<br />
o c<br />
4-) 3<br />
Q<br />
*H *^!J<br />
c v<br />
•H 01<br />
(^ *d<br />
v^<br />
25<br />
• 4<br />
d)<br />
4J<br />
O<br />
25<br />
rH<br />
rH<br />
d)<br />
O<br />
(d<br />
h<br />
O<br />
0}<br />
d)<br />
3<br />
rH<br />
(d<br />
^.^<br />
o<br />
oEH<br />
C<br />
O<br />
X)<br />
^<br />
(d<br />
o<br />
o<br />
•H<br />
C<br />
(d<br />
?w<br />
gg<br />
•^ R<br />
td *^<br />
•P o --j<br />
4^ "t<br />
0)0<br />
(d *<br />
^H *"<br />
?!o<br />
o<br />
S c<br />
c (d *H<br />
m (A<br />
S-^<br />
C g<br />
^ 3<br />
O<br />
•H<br />
45 EH<br />
4<br />
VO<br />
W<br />
J<br />
CQ<br />
EH
67<br />
Consumer* PA 13054<br />
UkeEne 106-O<br />
API 200<br />
Contuner* 13491<br />
Uk* Eric 101H<br />
200<br />
200<br />
-200<br />
iMarceUus Formation<br />
300-<br />
-300<br />
Cm)<br />
(m)<br />
Fig. 11. Comparison of gamma ray log responses in wells from<br />
eastern <strong>and</strong> western subsurface areas.
68<br />
Sanford (1969b), but has been adjusted to allow for the<br />
results of the OGS drilling (e.g. Marcellus absent in holes M-<br />
7 <strong>and</strong> M-9). The gamma ray log for drillhole 109 (see Appendix<br />
3 for complete well identification), 5 km south of Port Dover,<br />
provides evidence that the Marcellus underlies much of Long<br />
Point. The presence of Marcellus under Long Point Bay is<br />
further supported by the logs from drill holes #110 <strong>and</strong> 111<br />
(see Appendix 3). This is a modification of the Sanford<br />
boundary in this area, which parallels <strong>and</strong> runs to the south<br />
of Long Point. The precise eastern limit of the Marcellus is<br />
not known as unfortunately, well control in the area is very<br />
poor. The absence of a typical Marcellus gamma ray peak in<br />
well #114 (see Appendix 3), located to the south of Long<br />
Point, suggests termination of the unit in this vicinity.<br />
Similarly, the western boundary is also poorly defined.<br />
The drillhole to the west of Ridgetown (#11) indicates 6.0<br />
metres of Marcellus close to the shore line, although<br />
Sanford 1 s (1969b) map shows Hamilton Group, or Dundee<br />
Formation <strong>and</strong> no Marcellus Formation in areas north <strong>and</strong> west<br />
of Ridgetown. South of Erie Beach are two wells (#109 <strong>and</strong><br />
#110) with no apparent Marcellus, suggesting that the unit<br />
terminates immediately east of them.<br />
As exploration drilling is prohibited on the United<br />
States side of Lake Erie, drilling information for the map<br />
stops very abruptly at the Canada-U.S. border.
69<br />
3.4 Thickness<br />
In addition to helping delineate the extent of the<br />
Marcellus Formation in southwestern <strong>Ontario</strong>, the gamma ray log<br />
analysis was also used to determine patterns of regional <strong>and</strong><br />
local thickness variations <strong>and</strong> to produce the accompanying<br />
isopach map (Back Pocket). One hundred <strong>and</strong> ten selected<br />
petroleum exploration wells were located on an approximate one<br />
per block spacing in order to develop the<br />
regional picture. A more concentrated group of wells also was<br />
examined in three blocks (220, 183, 157 - see isopach map,<br />
Back Pocket) to examine the <strong>potential</strong> for local thickness<br />
variations of the unit. The gamma ray logs from the petroleum<br />
exploration wells supplemented the limited data available by<br />
direct thickness measurements from the six OGS on-shore<br />
drillholes.<br />
On the gamma ray logs the base of the Marcellus Formation<br />
was placed at the base of the first (lowest) peak indicating a<br />
black organic <strong>shale</strong> bed. Normally this peak has a value of<br />
about 150 API units. Below this point the log response<br />
decreases markedly in intensity to about 50 API units,<br />
representing the limestones of the underlying Dundee<br />
Formation. The top of the Marcellus Formation was placed at<br />
the top of the second (or rarely third) peak apparently<br />
produced by a black organic <strong>shale</strong> bed. Reliable placement of<br />
the upper contact often proved to be difficult as the log<br />
l 2<br />
one "block" covers approximately 70 km "
70<br />
signature commonly displayed different shapes, even between<br />
adjacent wells (see Fig. 10). The variety of hole diameters,<br />
casing programs, grouting procedures, <strong>and</strong> logging equipment<br />
probably account for much of the log variation. Geological<br />
parameters are only a minor factor in this regard.<br />
Nevertheless, caution should be exercised in using the<br />
interpretation of the upper boundary of the Marcellus provided<br />
herein.<br />
As illustrated on the accompanying isopach map (Back<br />
Pocket), the Marcellus Formation in southwestern <strong>Ontario</strong> <strong>and</strong><br />
beneath north-central Lake Erie occurs as a series of elongate<br />
ridges which trend approximately parallel to the regional<br />
strike (east-northeast to west-southwest). Length of the<br />
subcrop pattern is about 175 km, with a width of about 40 km.<br />
Regional dip in the area is directly into the Appalachian<br />
Basin at approximately 3 m/km (Musial 1982).<br />
The northern subcrop edge of the unit is sub-parallel to<br />
the trend of the Algonquin Arch. Whether this reflects<br />
erosion of strata which formerly draped over the Arch, or<br />
stratigraphic pinch-out of the Marcellus against the Arch, is<br />
uncertain.<br />
Determining the style of eastern <strong>and</strong> western termination<br />
of the ridges of the Marcellus is hampered by a lack of<br />
suitable drillholes or gamma ray log records in these areas.<br />
Southward thickening of the Marcellus from its subcrop<br />
edge is variable. Between drillholes 9 <strong>and</strong> 10 (see isopach
71<br />
map) the unit thickens from O to 5 m over a distance of 4 km.<br />
However, between drillholes 109 <strong>and</strong> 110 near Long Point Bay<br />
(see isopach map), the unit thickens by only 1.5 m over a<br />
distance of 18 km.<br />
The thickest section of Marcellus Formation recorded in<br />
this study was 12 m (measured in Consumers Gas drillhole 13628<br />
Lake Erie 182-A-isopach map hole #73). The thinnest complete<br />
section of the unit was 0.5 m noted in Consumers Gas drillhole<br />
13337 Lake Erie 182-L-isopach map hole #83). Both of these<br />
holes lie in the central part of the offshore area that was<br />
examined. Surprisingly these holes are located only 3 km<br />
apart. The average thickness calculated from the drill holes<br />
used in this study was 5.1 m.<br />
3.5 Lithology<br />
The following detailed lithological description for the<br />
Marcellus Formation is based upon the examination of cores<br />
from the OGS drillholes (Fig. 8, Table 4). Review of the<br />
gamma-ray logs from these drillholes <strong>and</strong> petroleum exploration<br />
wells through the subcrop area of the Marcellus Formation<br />
suggest that these descriptions of the OGS cores reflect the<br />
apparent overall pattern of lithological units. Variations<br />
that do occur are mainly related to relative thickness<br />
differences of individual units (see previous section).
72<br />
In the OGS drillholes which intersect strata assignable<br />
to the Marcellus Formation, the same basic lithological<br />
elements were present in each hole. In descending order these<br />
are:<br />
Unit A - Upper organic <strong>shale</strong><br />
B - Upper <strong>shale</strong> (non-organic)<br />
C - Carbonate<br />
D - Lower <strong>shale</strong> (non-organic)<br />
E - Lower organic <strong>shale</strong>.<br />
This sequence of elements is clearly evident in drillholes M-<br />
5, M-6 <strong>and</strong> M-8, <strong>and</strong> to a lesser degree in OGS-82-3. In the<br />
latter, the upper organic <strong>shale</strong> (A) is not very dark <strong>and</strong> the<br />
lower organic <strong>shale</strong> (E) is very thin to the extent that it is<br />
not evident in the gamma-ray logs. Had direct core examination<br />
not been possible, recognition of Marcellus in this drillhole<br />
would have been uncertain.<br />
Dundee-Marcellus Contact<br />
Underlying the Marcellus Formation are limestones of the<br />
Dundee Formation. These are buff to grey-brown, fine to<br />
coarsely crystalline (in part granular) richly fossiliferous<br />
limestones. The fossil material present within this formation<br />
is largely broken brachiopod <strong>and</strong> crinoidal debris. Shaly<br />
partings are common. Also present are vugs, some of which<br />
exhibit <strong>oil</strong> staining.<br />
Within the uppermost metre of the Dundee, there is one<br />
<strong>and</strong> sometimes two distinct interbeds of organic <strong>shale</strong>,
73<br />
similar to the basal <strong>shale</strong>s of the Marcellus. The interbeds<br />
are l to 10 cm thick <strong>and</strong> usually occur 10 to 15 cm below the<br />
base of the Marcellus. The organic <strong>shale</strong> interbed (in the<br />
Dundee) encountered in drillhole OGS-82-3 had a TOG content of<br />
3.8%. Immediately beneath the interbeds are 0.5 cm thick<br />
horizons of concentrated bioclastic debris. These suggest<br />
that a minor break occurred in deposition between each cycle<br />
of carbonate <strong>and</strong> <strong>shale</strong>. The upper contacts of the organic<br />
<strong>shale</strong> interbeds are sharp.<br />
Unit E - Lower Organic Shale<br />
This is the lowest Marcellus Formation unit present <strong>and</strong><br />
is a brownish-black fissile <strong>shale</strong>. "Although it appears to be<br />
the darker coloured of the two organic <strong>shale</strong> units present (A,<br />
E), it has the lower average TOC content (4.14% compared with<br />
T.38%, see Table 5)". A brownish hue noted on some bedding<br />
planes in unit E results from concentrations of flattened<br />
amber coloured spore cases. Apart from this microfossil<br />
material, the unit is poorly fossiliferous.<br />
This interval has an average thickness of 0.45 m, varying<br />
between 0.15 m in OGS-82-3 <strong>and</strong> 0.68 m in M-8 (see Table 6).<br />
From the correlation of the OGS drillholes, (Fig. 12), this<br />
unit appears to thicken in the central part of the subcrop<br />
area underlying l<strong>and</strong>. The upper contact of unit (E) is<br />
gradational with the overlying Lower Shale (unit D).
74<br />
Q)<br />
J3<br />
-P<br />
.C<br />
.C<br />
-P<br />
W<br />
0)<br />
0)<br />
^<br />
O<br />
U<br />
W<br />
O<br />
O<br />
C<br />
o<br />
-H<br />
-p. .<br />
U C<br />
Q) O<br />
W -H<br />
-P<br />
W (O<br />
w e<br />
O J-i<br />
M o<br />
o fc<br />
sauian NI<br />
H rH<br />
0}<br />
* U<br />
SP r-l<br />
-H (Q<br />
C^ S
75<br />
Unit D - Lover Shale (non-organic)<br />
The Lower Shale is a blue-gray silty <strong>and</strong> partly<br />
calcareous <strong>shale</strong>. It is very fissile <strong>and</strong> can be rich in<br />
complete articulated shells <strong>and</strong> shell debris of various<br />
brachiopod taxa. This unit is differentiated from unit E<br />
(organic-rich <strong>shale</strong>) by the change in colour, increase in<br />
faunal content <strong>and</strong> increased fissility. Strata of unit D<br />
cannot be differentiated from the blue-grey <strong>shale</strong>s of the Bell<br />
Formation, overlying the Marcellus. This unit (D) has an<br />
average thickness in the OGS cores of 0.84 m (see Table 6,<br />
Fig. 12) with an average TOG content of only Q.3% (see Table 5<br />
for range of values).<br />
Strata of the Lower Shale are gradationally overlain by<br />
carbonate rocks of unit C.<br />
Unit C - Carbonate<br />
This unit is composed of buff to blue-grey very fine to<br />
medium grained impure limestone. These strata are richly<br />
fossiliferous in echinoderm <strong>and</strong> brachiopod debris. They are<br />
dense <strong>and</strong> free of vugs or visible pore spaces. No stylolites<br />
were detected in this unit, <strong>and</strong> the rock does not display<br />
fissility. The average TOC values for this unit was found to<br />
be Q.38% (see Table 5) with an average thickness in the OGS<br />
holes of 1.14 m. Significant changes in thickness are evident<br />
between adjacent holes for both this unit <strong>and</strong> the underlying
76<br />
unit (D), as evident in the drillhole cross-section (e.g.<br />
between OGS-82-3 <strong>and</strong> M-8, Fig. 12). Rocks of the unit (C)<br />
carbonate are gradationally overlain by <strong>shale</strong>s of unit (B).<br />
Unit B - Upper Shale (non-organic)<br />
The Upper Shale is a blue-grey, silty <strong>and</strong> partly<br />
calcareous <strong>shale</strong>. This unit is very similar to the lower<br />
<strong>shale</strong> unit (D), but tends to have a lower fossil content.<br />
Again, like unit (D), the fossil assemblage present is mostly<br />
articulated brachiopod shells <strong>and</strong> shell debris, <strong>and</strong> the unit<br />
is highly fissile. Mean thickness from the OGS drillholes for<br />
this unit is 0.86 m (see Table 6) with the cross-section (Fig.<br />
12) suggesting an overall westward thickening. The average<br />
TOG value for this interval is 1.17% (see Table 5), much<br />
higher than is present in unit (D), but again too low to be<br />
considered an <strong>oil</strong> <strong>shale</strong>. This unit is gradationally overlain<br />
(although this contact is sharper than the previously<br />
mentioned contacts) by the organic <strong>shale</strong>s of unit A.<br />
Unit A - Upper Organic Shale<br />
The Upper Organic Shale, is composed of brown-black or<br />
dark-grey to black, moderately fissile <strong>shale</strong>. This interval<br />
tends to be lighter coloured than the Lower Organic Shale<br />
(unit E), but has a much higher average TOG value of V.38%
77<br />
(see Table 5). The average thickness for this interval, in<br />
the OGS cored holes amounted to 0.68 metres, with the trends<br />
shown in the cross-section (Fig. 12) suggesting a westward<br />
thickening. Overall, when reviewing the geophysical gamma-ray<br />
logs for the non-OGS holes used, it appears the upper organic<br />
<strong>shale</strong> (A) is the most predominant, in terms of both magnitude<br />
<strong>and</strong> consistency. The upper contact of the Upper Organic Shale<br />
is used to denote the upper contact of the Marcellus<br />
Formation.<br />
Marcellus-Bell Contact<br />
Throughout most of its <strong>Ontario</strong> subcrop area, the<br />
Marcellus Formation is overlain by rocks of the Bell<br />
Formation; the basal unit of the Hamilton Group. Where not<br />
overlain by the Bell, the Marcellus directly underlies glacial<br />
cover. The Bell/Marcellus contact is present in OGS<br />
drillholes M-5, M-6 <strong>and</strong> OGS-82-3. The Bell Formation consists<br />
of blue-grey, silty, fossiliferous <strong>shale</strong>s, lithologically<br />
similar to the upper <strong>and</strong> lower <strong>shale</strong> units (B <strong>and</strong> D) present<br />
in the Marcellus. The contact between the upper organic <strong>shale</strong><br />
(A) (i.e. top of the Marcellus) <strong>and</strong> Bell Formation is sharp<br />
but is devoid of scour, rill <strong>and</strong> other features indicative of<br />
extended erosion.<br />
In each of the OGS cores which intersected Bell Formation<br />
strata (M-5, M-6, OGS-82-3), there are thin (up to 20 cm<br />
thick) organic rich beds in the lower part of the Bell<br />
Formation. These have sharp upper <strong>and</strong> lower contacts <strong>and</strong> are
lighter in colour than the upper organic <strong>shale</strong> (A) of the<br />
Marcellus, but they are a distinctly darker colour than the<br />
surrounding Bell strata. TOC analyses were made of the Bell<br />
organic interbed encountered in OGS-82-3 <strong>and</strong> it was found to<br />
have a TOC content of 4.4%. Many of the off-shore exploration<br />
wells used in this study display gamma-ray logs suggesting the<br />
presence of thin organic rich interbeds in the Bell Formation.<br />
This was supported by the presence of darker coloured chips in<br />
the appropriate cutting samples. Including these interbeds in<br />
the Marcellus Formation was discounted due to their thinness<br />
<strong>and</strong> discontinuous nature.<br />
3.6 Stratigraphic Relationships<br />
Knowledge of Middle Devonian black <strong>shale</strong>s of the eastern<br />
United States has been increased considerably through the<br />
activities of the Eastern Gas Shales Project (Roen 1984; see<br />
Chapter. 2.3). Black <strong>shale</strong> units equivalent to the Marcellus<br />
Formation of <strong>Ontario</strong> are present over a broad part of the<br />
Appalachian Basin extending from New York State through<br />
Pennsylvania, eastern Ohio, West Virginia <strong>and</strong> into Maryl<strong>and</strong>,<br />
Virginia <strong>and</strong> Kentucky (Fig. 6).<br />
The basic stratigraphic sequences of these black <strong>shale</strong>s<br />
<strong>and</strong> associated units in the immediately adjacent States of New<br />
York, Pennsylvania, <strong>and</strong> Ohio are very similar to the Marcellus
79<br />
sequence in <strong>Ontario</strong>. This suggests that a much higher degree<br />
of correlation is possible with these areas than has<br />
previously been achieved. To the south <strong>and</strong> southeast of these<br />
states, the Middle Devonian sequences contains a greater<br />
proportion of clastic units <strong>and</strong> the black organic <strong>shale</strong>s <strong>and</strong><br />
non-organic grey <strong>shale</strong>s are not as distinctly differentiated.<br />
The Marcellus Formation of <strong>Ontario</strong> apparently lies at the<br />
distal edge of the Appalachian Basin Middle Devonian black<br />
<strong>shale</strong> province.<br />
New York. As presently defined (Van Tyne <strong>and</strong> Peterson,<br />
1978; Rickard, 1975, 1984), the Marcellus Formation of New<br />
York directly overlies an eroded carbonate platform (Onondaga<br />
Formation; see Table 7) <strong>and</strong> is the basal unit of the Hamilton<br />
Group. The remaining overlying formations of the Hamilton<br />
Group (Skaneateles, Ludlowville, Moscow) are mainly blue-grey<br />
<strong>shale</strong>s with minor black organic <strong>shale</strong>s <strong>and</strong> carbonate horizons.<br />
The Middle Devonian sequence of western New York is capped by<br />
the Tully Limestone. An equivalent to this unit has not been<br />
recognized in <strong>Ontario</strong> (Uyeno et al. 1982).<br />
As noted previously, the Marcellus in New York is divided<br />
into three members - the Union Springs (black organic <strong>shale</strong>),<br />
Cherry Valley (limestone), <strong>and</strong> the thicker Oatka Creek (black<br />
organic <strong>shale</strong>). These three members are easily identified on<br />
downhole gamma ray logs (Rickard, 1984) <strong>and</strong> they present a<br />
geophysical signature very similar to that of the Marcellus<br />
Formation in <strong>Ontario</strong> . The Cherry Valley <strong>and</strong> Oatka Creek<br />
Members are present throughout the New York subcrop area but
80<br />
ONTARIO<br />
(UYENO et al<br />
1982)<br />
NO EQUIVALENT<br />
UNIT<br />
NEW YORK<br />
(RICKARD, 1984)<br />
TULLY<br />
L ST<br />
PENNSYL<br />
-VANIA<br />
(SCHWIETERING, '<br />
1977)<br />
TULLY<br />
LST<br />
OHIO<br />
(SCHWIETERING,<br />
1977)<br />
UPPER<br />
PART<br />
OLENTA<br />
-NGY<br />
WEST<br />
VIRGINIA<br />
(SCHWIETERING.<br />
NEAL^DOWSE.<br />
:| H .j<br />
J . ^ w UJ<br />
l 4 * ^ OC QC<br />
3 CO ^oc o cc<br />
*- J ij- ?<br />
VIRGINIA<br />
HASSON 8t<br />
OENNISON )<br />
1978)<br />
HARRELL<br />
SHALE<br />
HAMILTON<br />
Gp<br />
MARC ELL U S<br />
Fm<br />
a<br />
z<br />
0<br />
-J<br />
i<br />
z<br />
MOSCOW<br />
LUDLOWVILLE<br />
SKANEATELES<br />
OATKA<br />
CREEK<br />
CO mb<br />
-i<br />
-i CHERRY<br />
UJ VALLEY<br />
O mb<br />
CC<br />
2 UNION<br />
SPRINGS<br />
mb<br />
a<br />
O<br />
Z<br />
o<br />
H<br />
^<br />
2<br />
Z<br />
o oz<br />
H<br />
I<br />
S<br />
CO<br />
13<br />
-J<br />
-J<br />
UJ PURCELL<br />
O<br />
(T<br />
^<br />
•s.<br />
^*<br />
O<br />
Z<br />
z<br />
UJ<br />
-1<br />
o<br />
H<br />
QC<br />
0 oc<br />
a.<br />
E<br />
u.<br />
t-<br />
a.<br />
QC<br />
UJ<br />
^<br />
O<br />
-1<br />
O<br />
O<br />
(T<br />
m<br />
Z)<br />
—1<br />
a.<br />
a<br />
o<br />
z<br />
o<br />
h-<br />
-J<br />
i<br />
Z<br />
UJ<br />
0 N<br />
cc<br />
UJ<br />
a.<br />
o.<br />
D<br />
u<br />
O<br />
N<br />
QC<br />
Ul<br />
O -i<br />
UJ<br />
-j<br />
Z<br />
CO<br />
o<br />
GC<br />
O<br />
ṃj<br />
-i<br />
i<br />
UJ<br />
O<br />
ZUl<br />
j<br />
u.<br />
Z<br />
O<br />
a z<br />
z<br />
T<br />
2<br />
Ul<br />
(J<br />
Z Ul<br />
D<br />
-i<br />
Z<br />
~ PURCELL<br />
13 mb<br />
j<br />
u<br />
OC<br />
5<br />
DUNDEE<br />
Fm<br />
ONONDAGA ONONDAGA<br />
Fm<br />
Fm<br />
ONONDAGA<br />
Fm<br />
(DELAWARE)<br />
^ * UJ<br />
O ^ DC<br />
t LLl<br />
< . Oj<br />
Q E ' | 2 <<br />
0 "" ' 25<br />
0 v z<br />
NEEDMORE<br />
SHALE<br />
Table 7 - Lithostratigraphic Correlation of the Marcellus<br />
Formation.
81<br />
the Union Springs <strong>shale</strong> appears to pinch-out on the western<br />
side of the state (Rickard, 1984).<br />
The most obvious difference between the Marcellus in New<br />
York <strong>and</strong> <strong>Ontario</strong> is thickness. In Chemung <strong>and</strong> Chautauqua<br />
Counties of western New York the formation is up to 30 m thick<br />
as compared to the average of 5.1 m in <strong>Ontario</strong>.<br />
Pennsylvania. Strata named the Marcellus Formation<br />
underlie all of northeastern <strong>and</strong> western Pennsylvania (Fig.<br />
6). They are also included in the Hamilton Group <strong>and</strong> are<br />
overlain by the Mahantango Formation (Harper <strong>and</strong> Piostroski<br />
1978; Schwietering, 1977). A facies relationship is suggested<br />
between the two formations as the Marcellus thins to the<br />
northwest, out of the Appalachian Basin, while the Mahantango<br />
thickens in this direction (Harper <strong>and</strong> Poistroski 1978).<br />
However there is still a net reduction in total thickness of<br />
the Hamilton Group to the northwest.<br />
The stratigraphic sequence is very similar to that in New<br />
York <strong>and</strong> <strong>Ontario</strong> with Marcellus <strong>shale</strong>s overlying an eroded<br />
carbonate surface <strong>and</strong> being overlain in turn by a thick<br />
sequence of <strong>shale</strong>s <strong>and</strong> minor limestone intervals. A carbonate<br />
unit within the Marcellus of Pennsylvania is called the<br />
Purcell Limestone; it is correlative with the Cherry Valley<br />
Member of the Marcellus in New York <strong>and</strong> is probably equivalent<br />
to the carbonate interval (Unit C) of the Marcellus in<br />
<strong>Ontario</strong>.
82<br />
Harper <strong>and</strong> Piostroski (1978) reported thicknesses of up<br />
to 75 m for the Marcellus in western Pennsylvania. They<br />
indicated an average thickness of 20 m with the unit thinning<br />
to zero near Lake Erie. Their distribution map shows the<br />
Marcellus occurring as a series of elongate ridges parallel to<br />
regional strike of the beds. As described previously (Chapt.<br />
3.3), the Marcellus in <strong>Ontario</strong> exhibits a similar distribution<br />
pattern.<br />
Ohio. Strata equivalent to the Marcellus Formation are<br />
confined to the eastern side of Ohio by the Findlay <strong>and</strong><br />
Cincinatti Arches. These basement ridges extend north-south<br />
through western Ohio forming a barrier between the Appalachian<br />
Basin in the east <strong>and</strong> the Michigan <strong>and</strong> Illinois Basins to the<br />
west. This is similar to the role of the Algonquin Arch<br />
between the Michigan <strong>and</strong> Appalachian Basins. The presence in<br />
Ohio of a dark <strong>shale</strong> facies overlying Middle Devonian<br />
carbonates <strong>and</strong> being equivalent to the Marcellus in New York<br />
was first noted by Lafferty (1941) . However, knowledge of<br />
these <strong>shale</strong>s is not as advanced as in the neighbouring states.<br />
The dark <strong>shale</strong> facies is referred to the lower part of<br />
the Olentangy Shale (Table 7) <strong>and</strong> has been described as black<br />
organic rich <strong>shale</strong>s with interbedded limestone <strong>and</strong> organic<br />
poor <strong>shale</strong>s (Schwietering 1979). Correlation of the limestone<br />
intervals with the Cherry Valley <strong>and</strong> Purcell limestones has<br />
not been confirmed. Lafferty (1941) suggested a thickness of<br />
up to 60 m for the "lower part of the Olentangy" but<br />
stratigraphic sections in Grey et al. (1982) showed a more
83<br />
modest 12 m. The published thicknesses are probably a<br />
function of what was defined as black <strong>shale</strong>.<br />
West Virginia. In West Virginia, strata termed the<br />
"Lower zone of the Hamilton Group" have been correlated with<br />
the Marcellus in Pennsylvania <strong>and</strong> New York (Schwietering et<br />
al. 1978). Thicknesses exceed 75 m but the unit thins rapidly<br />
to the west. Over much of the state, these strata are<br />
divisible on the basis of downhole gamma-ray logs into three<br />
zones - upper <strong>and</strong> lower zones of high gamma-ray values<br />
separated by an interval of low gamma-ray readings. The<br />
middle interval probably correlates with the Cherry Valley <strong>and</strong><br />
Purcell Limestones <strong>and</strong> Unit C of the Marcellus in <strong>Ontario</strong>.<br />
In West Virginia, the "upper zone of the Hamilton Group",<br />
which has been correlated with the Mahantango Formation of<br />
Pennsylvania, contains <strong>shale</strong>s of much darker colour than in<br />
neighbouring areas.<br />
Virginia. Strata equivalent to the Marcellus Formation<br />
are referred, in Virginia, to the lower part of the Millboro<br />
Shale. They have also been termed the Marcellus Influence<br />
(Schwietering et al. 1978) in reference to the dark colour <strong>and</strong><br />
high gamma-ray values of the <strong>shale</strong>s. In eastern West Virginia<br />
<strong>and</strong> adjacent Virginia, strata of the Marcellus Influence<br />
overlie the Needmore Shale, a calcareous <strong>shale</strong> that is age<br />
equivalent to the Onondaga Formation of New York (Telford<br />
1979, p.203). Hasson <strong>and</strong> Dennison (1978) identified a<br />
carbonate unit which they termed the Purcell Member within the<br />
Marcellus Influence at the type section of the Millboro Shale.
84<br />
O<br />
Z<br />
E<br />
5<br />
H<br />
C/5<br />
UJ<br />
o<br />
•H<br />
c(O<br />
cc<br />
O<br />
LU<br />
Z<br />
o<br />
E<br />
Z<br />
O<br />
UJ<br />
UJ<br />
111<br />
Z<br />
UJ<br />
ffi<br />
III<br />
l l M l Nil<br />
l<br />
uu<br />
UJ<br />
(X)<br />
O<br />
UJ<br />
cc<br />
O<br />
O<br />
o<br />
UJ<br />
OD<br />
O<br />
O<br />
o<br />
w<br />
J2 C •H<br />
c w<br />
(O fd<br />
•H CQ<br />
c<br />
o c<br />
> (O<br />
(U -H<br />
Q<br />
o<br />
o)<br />
-O (O<br />
T3 -H a<br />
s *c<br />
d) a)<br />
*M C<br />
O -H<br />
-H -H<br />
-P O<br />
C3<br />
I<br />
O<br />
W 1<br />
Mllll II<br />
UJ<br />
ffi<br />
oZ'<br />
Q<br />
CO<br />
*<br />
i<br />
i<br />
tt<br />
-H<br />
^ d)<br />
-P iH<br />
W (C<br />
-HXJ<br />
Q ea<br />
CO<br />
H<br />
-H
85<br />
Here the Marcellus Influence was 120 m in thickness with the<br />
Purcell Member 15 m thick.<br />
Dennison <strong>and</strong> Naegele (1978) have also recognized strata<br />
equivalent to the Marcellus in nearby western Maryl<strong>and</strong>.<br />
Diachroneity of Marcellus. The Marcellus Formation (<strong>and</strong><br />
its equivalents) in the Appalachian Basin is diachronous, with<br />
the base of the unit becoming younger to the northwest. This<br />
is confirmed by the relative stratigraphic position of the<br />
base of the Marcellus to the Tioga Ash Bed.<br />
The Tioga Ash Bed (formerly termed Tioga Bentonite - see<br />
Roen <strong>and</strong> Hosterman 1982) is a volcanic ash layer which forms a<br />
consistent time marker horizon throughout the eastern <strong>and</strong><br />
northeastern parts of the Appalachian Basin. It has also been<br />
recognized in the Illinois <strong>and</strong> Michigan Basins (e.g. Droste<br />
<strong>and</strong> Vitaliano, 1973; Baltrusaitis 1974). The Tioga marks the<br />
top of the Middle Devonian Onesquethaw Stage (Dennison <strong>and</strong><br />
Textoris, 1977). There are actually several Tioga tuffaceous<br />
layers with a combined total thickness in Virginia of up to<br />
61 m (Dennison <strong>and</strong> Textoris, 1977). However, it is the Tioga<br />
middle coarse zone which has the widest distribution <strong>and</strong> is<br />
most commonly used as a time marker.<br />
In Virginia, West Virginia <strong>and</strong> southern Pennsylvania, the<br />
black <strong>shale</strong>s of the Marcellus Formation or its equivalent<br />
directly overlie the Tioga middle coarse zone. However,<br />
farther north in western New York, the Marcellus is separated<br />
from the Tioga by limestones of the Seneca Member of the<br />
Onondaga Formation. In Ohio, the Tioga is thought to lie
86<br />
within the Delaware Formation, stratigraphically below the<br />
Marcellus. Sanford (1968) tentatively recognized the Tioga<br />
within the Dundee Formation of the southwestern <strong>Ontario</strong>,<br />
significantly below the base of the Marcellus (Fig. 13).<br />
In Michigan, the Kawkawlin Bentonite of Baltrusaitis<br />
(1974) has been tentatively correlated with the Tioga <strong>and</strong> it<br />
lies stratigraphically lower, within the Lucas Formation of<br />
the Detroit River Group (Fig. 13).<br />
3.7 Depositional Relationships<br />
The depositional setting <strong>and</strong> regional sedimentation<br />
patterns of the Middle Devonian black <strong>shale</strong>s in the<br />
Appalachian Basin have been reviewed by numerous authors. For<br />
recent summaries see Janka <strong>and</strong> Dennison (1980) <strong>and</strong> Roen<br />
(1984). The following discussion pertains specifically to the<br />
Marcellus Formation as observed in southwestern <strong>Ontario</strong> <strong>and</strong><br />
immediately adjacent areas.<br />
The relatively sharp lower contact of the Marcellus<br />
Formation observed in the OGS drillholes suggests that<br />
deposition of the unit began on an eroded surface. A very<br />
similar relationship occurs at the Dundee Formation-Bell<br />
Formation contact as observed in drillhole OGS 82-2 Chatham<br />
(Johnson et al. 1985), where the Marcellus Formation is absent<br />
due to subsequent erosion or nondeposition.<br />
The sequence of lithologies <strong>and</strong> gradational boundaries<br />
between the lithological units within the Marcellus Formation
87<br />
suggests that the depositional environment alternated<br />
gradually between well oxygenated <strong>and</strong> poorly oxygenated<br />
conditions. The black organic <strong>shale</strong>s <strong>and</strong> the limestone units<br />
represent extreme conditions of weak <strong>and</strong> strong oxygenation<br />
respectively with the non-organic grey <strong>shale</strong>s indicating a<br />
transitional environment.<br />
By inference, <strong>oil</strong> <strong>shale</strong>s are formed in an oxygen<br />
deficient environment. This is required to inhibit the<br />
development of scavenging bacteria <strong>and</strong> other higher order<br />
biota which would otherwise devour <strong>and</strong> oxidize organic<br />
material that was being deposited. Deep water is not needed<br />
to produce the oxygen deficient conditions required for <strong>oil</strong><br />
<strong>shale</strong> deposition, as much as a lack of effective oxygen<br />
circulation. There is no lithologic evidence in the Marcellus<br />
strata to suggest deep water deposition.<br />
No megafossils were observed in the organic-rich <strong>shale</strong><br />
units of the Marcellus Formation. Insoluble residue analysis<br />
of these <strong>shale</strong>s produced a very sparse microfauna of<br />
ostracods, scolecodonts, conodonts, tentaculitids <strong>and</strong> small<br />
gastropods together with some spore cases. The non-organic<br />
<strong>shale</strong>s of the Marcellus Formation contain a more abundant <strong>and</strong><br />
diverse fauna, including abundant shell material. Underlying<br />
limestones of the Dundee Formation <strong>and</strong> overlying <strong>shale</strong>s of the<br />
Bell Formation contain very rich mega- <strong>and</strong> micro-faunas.<br />
The depositional history of the Marcellus Formation <strong>and</strong><br />
subadjacent <strong>and</strong> superadjacent formations in southwestern
88<br />
<strong>Ontario</strong> can be interpreted briefly as follows. Limestones of<br />
the Dundee Formation were deposited in well oxygenated<br />
conditions. The appearance of thin black <strong>shale</strong> interbeds in<br />
the upper part of the Dundee Formation indicates periods of<br />
oxygen-starved conditions also existed during deposition of<br />
that unit. Following deposition of the Dundee, there was a<br />
brief hiatus as suggested by the peneplaned surface <strong>and</strong> fossil<br />
debris sheets associated with the lower contact. Clastic<br />
deposition began during a major period of oxygen-starved<br />
conditions which resulted in deposition of the lower organic<br />
<strong>shale</strong> of the Marcellus Formation. The carbonate <strong>and</strong> nonorganic<br />
grey <strong>shale</strong>s of the middle part of the Marcellus<br />
Formation, with a fauna including filter-feeding organisms,<br />
indicate that better oxygenated conditions returned to the<br />
depositional area. Eventually the environment again became<br />
oxygen-starved <strong>and</strong> deposition of the upper organic <strong>shale</strong> took<br />
place. Finally, well oxygenated conditions again returned,<br />
reflected by the fossiliferous grey <strong>shale</strong>s of the Bell<br />
Formation.<br />
The depositional conditions interpreted for the Marcellus<br />
Formation in southwestern <strong>Ontario</strong> are probably closely<br />
analogous to the conditions which produced the Middle Devonian<br />
black <strong>shale</strong>s <strong>and</strong> associated units throughout the Appalachian<br />
Basin. As described in the previous section (Chapt. 3.6) the<br />
sequence of lithologies in the <strong>Ontario</strong> Marcellus (basically
89<br />
<strong>shale</strong>-carbonate-<strong>shale</strong>) is very similar to correlative<br />
sequences in western New York (Rickard, 1984), Pennsylvania<br />
(Schwietering, 1977), Virginia (Hasson <strong>and</strong> Dennison (1978),<br />
<strong>and</strong> elsewhere. The principal difference is the scale of the<br />
sequences which range from over 120 m thickness in Virginia to<br />
only about 5 m in <strong>Ontario</strong>. This is clearly related to the<br />
locations of the sequences within the sedimentary basin <strong>and</strong><br />
the effects of varying proximity to terrigenous source areas<br />
<strong>and</strong> varying tectonic <strong>and</strong> subsidence patterns on shelf <strong>and</strong><br />
basin areas.
90<br />
4. GEOCHEMISTRY<br />
4.l Inorganic<br />
Inorganic geochemical analyses were conducted by the OGS<br />
Geoscience Laboratories on twenty-eight samples from the Bell<br />
(12) , Marcellus (12), <strong>and</strong> Dundee (4) Formations. The major<br />
constituents were reported as oxides (Table 8).<br />
Analyses were carried out firstly by x-ray fluorescence<br />
(XRF), using both fused bead <strong>and</strong> pressed powder pellets. The<br />
initial analyses showed that samples with intermediate SiO2<br />
levels (20-35%) <strong>and</strong> CaO levels of 20 to 45% could not be<br />
totalled accurately to 100%. This resulted partly from a lack<br />
of suitable st<strong>and</strong>ards needed for the calibration of<br />
t<br />
instruments. The samples were subsequently analyzed using wet<br />
chemistry (i.e. gravimetrically). These tests indicated<br />
that the original levels for SiO2 were reasonably accurate,<br />
but that CaO was analyzing 7 to 8% lower by the XRF method.<br />
Thus the CaO values presented here were determined using wet<br />
chemistry, <strong>and</strong> the remaining values were determined by XRF.<br />
It is possible that the organics in the matrix of the sample<br />
were depressing the XRF derived CaO values (C. Riddle - OGS<br />
pers. comm.).<br />
The major constituent results are shown in Table 8, <strong>and</strong><br />
have been subdivided by formation <strong>and</strong> lithology. Average<br />
values are also calculated. It is clearly evident from
91<br />
I-t<br />
(O-<br />
O<br />
H<br />
M<br />
d<br />
o<br />
o<br />
z<br />
in<br />
O<br />
04<br />
CM<br />
O<br />
•H<br />
0 rM<br />
O<br />
CM<br />
to<br />
O<br />
a<br />
o<br />
o<br />
z<br />
rt<br />
o<br />
CM<br />
4)<br />
14<br />
rt<br />
O<br />
*<br />
CM<br />
O<br />
•H<br />
;H<br />
3*<br />
rH<br />
l<br />
J<br />
•H<br />
3<br />
-*H<br />
4J<br />
3<br />
H<br />
0<br />
CO Cft Cft Cft Cft Cft<br />
Cft Cft Cft Cft Cft Cft<br />
rt in CM O rH Cft<br />
00 rH *t in CM CO<br />
in rH eft in eft vo<br />
p- in in r* CM co<br />
O O O rH rH O<br />
CO<br />
in •f Cft VO rH VO<br />
CM CO CM O P* Cft<br />
^ ^ rt rt rt rt<br />
o o o o o o<br />
o o o o o o<br />
m o o rt *r ^<br />
o o o o o o<br />
0 0 0 0 0 O<br />
o rH CM vo co in<br />
o o o o o o<br />
in m rH rH VO rt<br />
00 O O Cft VO rH<br />
CM CM rt CM rt rt<br />
O O ^- O O O<br />
rt rH<br />
P* Cft •V rH rH O<br />
* VO O rH CM *<br />
rH rH rH rH<br />
rt CM Cft Cft VO 00<br />
O CM rH Cft CM P*<br />
CM CM CM rH CM rH<br />
Cft ff rt O ^ Cft<br />
Cft in co Cft CM CM<br />
VO •V VO Cft O O<br />
Cft O Cft Cft O P*<br />
O rH CO VO CM rH<br />
Shale 3-Poor -<br />
•H<br />
O<br />
J*<br />
H<br />
O<br />
3<br />
•H<br />
)<br />
* i * t * i i ' t<br />
Cft<br />
Cft<br />
o<br />
in<br />
vo<br />
Cft<br />
o<br />
^i<br />
•*r<br />
rt<br />
o<br />
0<br />
rt<br />
o<br />
o<br />
in<br />
o<br />
o<br />
00<br />
CM<br />
o<br />
^i<br />
o<br />
o<br />
H<br />
Cft<br />
O<br />
CM<br />
in<br />
in<br />
Cft<br />
CO<br />
vo<br />
4)<br />
Averac<br />
^-<br />
oo oo co P* p* co<br />
o eft eft eft eft eft Cft<br />
rH<br />
VO rH VO 00 •V VO CM<br />
vo n Cft vo o eo Cft<br />
VO CM Cft rH O in r-l<br />
n CM ** oo p* T in<br />
O 0 O O O O o<br />
•*t in co n rH p* in<br />
in M eo vo w co CO<br />
n in r* in \o •f in<br />
o o o o o o o<br />
o o o o o( o o<br />
O VO rH CM rH ••T VO<br />
O O O O O CM O<br />
o o o o o o 0<br />
o o o o o o o<br />
*<br />
CM n r- CM p* vo o<br />
^" in t eft vo Cft in<br />
CM rH o i-t CM n (N<br />
O O O O O O o<br />
Cft t n n vo r* in<br />
O 00 VO rH VO rt Cft<br />
n r* n n n n n<br />
O CO rH O VO Cft r*<br />
m * eft * M (N •v<br />
rH rH rH rH CM rH rH<br />
P* O O CM CM rH P~<br />
•* rt O CM Cft Cft Cft<br />
. . . . . .<br />
O n VO M (N rH rH<br />
00 IT) VO CO VO CO r*<br />
O p~ in Cft Cft rt vo<br />
VO VO O If) CO i-l 1-4<br />
0)<br />
0<br />
4)<br />
w<br />
Averac<br />
I<br />
•H<br />
J<br />
O Cft<br />
o oo<br />
O Cft<br />
rH<br />
Cft r-l<br />
o in<br />
M 00<br />
••r n<br />
O o<br />
vo<br />
in in<br />
vo in<br />
VO Cft<br />
o o<br />
o o<br />
rt oo<br />
o o<br />
0 0<br />
o o<br />
in n<br />
Cft O<br />
O n<br />
o o<br />
vo<br />
m (N<br />
vo oo<br />
M<br />
Cft •f<br />
rH r*<br />
CM rH<br />
0 O<br />
n Cft<br />
CO O<br />
r* vo<br />
O 00<br />
Shale :-Poor f<br />
i<br />
•H<br />
C<br />
Q<br />
O*<br />
M<br />
0<br />
i<br />
m•a<br />
rH S<br />
0)<br />
Os<br />
(0<br />
in<br />
Cft<br />
Cft<br />
o<br />
co<br />
0<br />
f<br />
o<br />
n<br />
o<br />
VO<br />
m<br />
o<br />
o<br />
VO<br />
O<br />
0<br />
o<br />
T<br />
o<br />
CM<br />
0<br />
5f<br />
r*<br />
r-l<br />
p*<br />
Cft<br />
i-t<br />
rH<br />
VO<br />
•"T<br />
r*<br />
Cft<br />
9<br />
Averac<br />
•fl-rHOOCftP^COCftCMrH<br />
COCftCftCftCftCftOOCftCft<br />
CftCftCftCftCftCftCftCftCft<br />
inovrHrtrHoovocoin<br />
in-q-mireoncftoooo<br />
rHrtOtnoort^cftrt<br />
'rcftrHCftp*p*ninp*<br />
•HOrHOOOrHrHi-l<br />
OOVOvOCM'0''"*VOrHOO<br />
CMOCftOtnCM^CMO<br />
cirtrtrt^vortrtrt<br />
ooooooooo<br />
ooooooooo<br />
^•rtfOrHVOinvOrH<br />
OrHrHOOOOOrH<br />
ooooooooo<br />
ooooooooo<br />
in<br />
Tj-inmco'vncMO *<br />
VO<br />
CftOOOCOP^inrH'WCM<br />
rHCMOrHrHrHrtCM -<br />
00000000<br />
P* O CM Cft (N in<br />
cftrHncoovotncMCM<br />
invOP*^VOP*rtrHrH<br />
rH r-t rH<br />
CftCftrM-vncftCftinoo<br />
•*chnincft**)Oo4r)<br />
fMtN(NNiHCMO!CH*M<br />
OincOOr*)OrH(MO<br />
oinr*eonor*m*M<br />
vor*p*r*'*r*voinvo<br />
Cftinin^coaooo^r4<br />
p*cor*vor-(r*oofMr-t<br />
Q)<br />
rH<br />
(0<br />
c.<br />
(0<br />
c.<br />
o<br />
•H<br />
tt<br />
•H<br />
c<br />
ia<br />
o*<br />
V4<br />
o<br />
r*<br />
Cft<br />
Cft<br />
rt<br />
VO<br />
p*<br />
rH<br />
rH<br />
co<br />
Cft<br />
n<br />
o<br />
o<br />
r*<br />
o<br />
0<br />
00<br />
0<br />
n<br />
•f<br />
0<br />
(N<br />
O<br />
O<br />
Cft<br />
rH<br />
n<br />
n<br />
Cft<br />
•*<br />
•*<br />
VO<br />
oo<br />
in<br />
at<br />
o*<br />
b<br />
w<br />
3<br />
rH<br />
CO<br />
Cft<br />
Cft<br />
r*<br />
00<br />
in<br />
o<br />
r)<br />
00<br />
vo o<br />
o<br />
0<br />
o<br />
o<br />
Cft<br />
o<br />
co<br />
rH<br />
o<br />
CM<br />
0<br />
in<br />
CM<br />
n<br />
CM<br />
Cft<br />
rH<br />
O<br />
I-t<br />
CM<br />
rH<br />
r*<br />
Cft<br />
rt<br />
41<br />
o<br />
4J<br />
g<br />
•H<br />
J<br />
oo oo rt o<br />
Cft Cft CO Cft<br />
Cft Cft Cft Cft<br />
CM rH P* O<br />
rH rH O O<br />
vo vo p* in<br />
rH O rH CM<br />
0000<br />
•* "* CO CM<br />
rH O Cft O<br />
rt rt rt rt<br />
O O O O<br />
0000<br />
P* rH VO rt<br />
O rH O rH<br />
O O O O<br />
rH rH rH CM<br />
O O O O<br />
rH rH rH CM<br />
O O O O<br />
CM * O Cft<br />
rH rH rH O<br />
O O O O<br />
in VO VO rH<br />
m ^ rH rH<br />
in in in in<br />
CM O Cft CM<br />
rt VO rt Cft<br />
0 0 rH O<br />
rt in rH CM<br />
rt CM rt rt<br />
0000<br />
Cft o * m<br />
O O rH rH<br />
en oo in vo<br />
VO CM 00 O<br />
H CM CM rt<br />
O<br />
O<br />
O<br />
4) s r B<br />
•H<br />
r4<br />
i<br />
01<br />
•o<br />
Q<br />
CM<br />
CM<br />
Cft<br />
Cft<br />
in<br />
r^<br />
o<br />
vo<br />
rH<br />
o<br />
in *r<br />
o<br />
rt<br />
o<br />
o<br />
Cft<br />
0<br />
o<br />
rH<br />
O<br />
rH<br />
0<br />
rH<br />
rH<br />
O<br />
CM<br />
rt<br />
in<br />
o<br />
co<br />
o<br />
rH<br />
rt<br />
o<br />
CM<br />
o<br />
in •t<br />
CM<br />
0)<br />
Averac<br />
><br />
4J<br />
(O<br />
4J<br />
C<br />
4)<br />
4)<br />
IH<br />
a<br />
4)<br />
(4<br />
sample:<br />
o<br />
r4<br />
4H<br />
•u<br />
rH<br />
-H<br />
a<br />
B<br />
O<br />
O<br />
z<br />
o<br />
M<br />
t*<br />
o<br />
fei<br />
w<br />
a -<br />
2 -~<br />
g"<br />
(0<br />
a a)<br />
2 T3<br />
3 -H<br />
x<br />
en o<br />
3 a<br />
U TJ<br />
w 3 **<br />
•o o<br />
c -o.<br />
fl J OJ<br />
na '-*<br />
8 ea<br />
(0<br />
H 0)<br />
d) X ij<br />
T3 H O<br />
3 0<br />
rH Z<br />
O M W<br />
•H CO O<br />
4J 2rH<br />
O W rH<br />
C Z 10<br />
O J C<br />
•a ea -^<br />
n os in<br />
rH O -P<br />
A (^ -H<br />
•P ^ C<br />
S Sa<br />
o<br />
* ' J3<br />
00 -P<br />
a^<br />
SH
92<br />
these few samples, that both organic <strong>and</strong> inorganic <strong>shale</strong>s of<br />
the Marcellus <strong>and</strong> Bell Formations are highly siliceous.<br />
The other constituents are typical in terms of<br />
abundances, with the limestone intervals appropriately higher<br />
in CaO <strong>and</strong> lower in SiO2. Due to the small data set, st<strong>and</strong>ard<br />
deviation calculations were not made, however it does appear<br />
that the range for the organic-rich beds is much narrower than<br />
is shown by the organic-poor intervals. This suggests, that<br />
the environment for organic-rich <strong>shale</strong> deposition was much<br />
more restrictive, in terms of the range of inorganic material<br />
both added to <strong>and</strong> generated by the system, than was the case<br />
for deposition of the non-organic <strong>shale</strong>s.<br />
Although no trace element analyses were conducted on<br />
samples of the Marcellus Formation for this study, Brown<br />
(1985) reported trace elements data for chip samples of the<br />
Marcellus (<strong>and</strong> enclosing strata?) from <strong>oil</strong> <strong>and</strong> gas exploration<br />
wells below Lake Erie <strong>and</strong> southern <strong>Ontario</strong>. A summary of<br />
Brown's major <strong>and</strong> trace element data, representing 22 samples<br />
from 10 wells, is presented in Table 9.<br />
Organic-rich <strong>shale</strong>s are typically enriched in a number of<br />
trace elements, including Cu, Pb, Zn, Ni, Co, Gr <strong>and</strong> V (Vine<br />
<strong>and</strong> Tourtelot 1970), however the Marcellus data (Table%2% 9)<br />
more closely approximates average (i.e. non-organic-rich)<br />
<strong>shale</strong> composition (eg. Turekian <strong>and</strong> Wedepohl 1961; Wedepohl<br />
1969). The non-enriched nature of the Marcellus trace
93<br />
Table 9 - Major <strong>and</strong> trace element data from chip samples of<br />
Marcellus (<strong>and</strong> enclosing?) strata (from Brown 1985)<br />
Major elements reported in oxide weight percent <strong>and</strong><br />
trace elements in 'ppm 1 , except where otherwise<br />
noted (N.D. not detected).<br />
Average Maximum Minimum<br />
Major Elements<br />
SiO2 39.17 52.71 24.23<br />
A1203 13.08 17.80 7.93<br />
Fe203 4.42 8.64 2.35<br />
MgO 1.99 2.28 1.42<br />
CaO 17.14 31.11 2.66<br />
Na2O 0.14 0.28 0.03<br />
K20 3.47 5.01 2.13<br />
TiO2 0.49 0.69 0.34<br />
P205 0.11 0.26 0.07<br />
MnO 0.04 0.11 0.03<br />
LOI 18.77 27.02 10.10<br />
Trace Elements<br />
Nb 19.6 36.5 5.6<br />
Zr<br />
Y<br />
100.2<br />
45.7<br />
135.7<br />
80.2<br />
74.9<br />
20.9<br />
Sr<br />
Rb<br />
254.6<br />
142.6<br />
328.0<br />
196.4<br />
156.8<br />
81.4<br />
Pb 30.1 49.6 16.7<br />
Zn 70.3 155.3 7.8<br />
Cu 14.5 22.7 10.4<br />
Ni 19.9 63.3 8.4<br />
Co 9.8 28.0 N.D.<br />
Cr<br />
Ba<br />
37.0<br />
299.1<br />
48.4<br />
437.9<br />
20.7<br />
122.5<br />
V 83.8 143.8 44.1<br />
S(*) 2.4 3.0 0.5<br />
Ga 23.2 38.5 7.3
94<br />
element data <strong>and</strong> a comparison of Brown's (1985) major element<br />
data with the data in Table 8 suggests that his chip samples<br />
represent homogenized organic-poor <strong>and</strong> organic-rich Marcellus<br />
intervals <strong>and</strong> possibly intervals of enclosing strata. This<br />
also illustrates the thin nature of the organic-rich beds in<br />
the Marcellus <strong>and</strong> the <strong>potential</strong> for dilution problems in their<br />
extraction.<br />
4.2 Organic<br />
Samples selected from three of the six Marcellus<br />
Formation drill cores <strong>and</strong> from well-cuttings of nineteen<br />
exploration wells drilled beneath Lake Erie were analyzed, for<br />
organic carbon content <strong>and</strong> yield on pyrolysis. Results from<br />
cores are reported by Barker (1985) whereas TOG determinations<br />
on well cuttings samples are reported in Table 10 with the<br />
techniques shown in Appendix 1. These data combined with<br />
previous studies (Barker et al. 1983; Powell et al. 1984)<br />
which investigated the geochemical nature, origins <strong>and</strong><br />
maturity of the organic matter in the Marcellus, enables an<br />
evaluation of the <strong>oil</strong> <strong>shale</strong> <strong>potential</strong> of this formation.<br />
Thermal maturity. Studies of the sedimentary sequence in<br />
southern <strong>Ontario</strong> (Powell et al. 1984; Legall et al. 1981)<br />
conclude that organic matter in the Devonian strata only<br />
attained an immature to marginally-mature level of thermal<br />
maturity. That is, the indigenous organic matter (i.e.
95<br />
TABLE 10. Total Organic Carbon (TOC) determinations for well<br />
cutting samples of the Marcellus Formation<br />
Well Location<br />
Depth (m)<br />
TOC (weight %)<br />
154<br />
BL<br />
BL<br />
BL<br />
BL<br />
BL<br />
BL<br />
BL<br />
BL<br />
BL<br />
BL<br />
BL<br />
BL<br />
BL<br />
BL<br />
BL<br />
BL<br />
BL<br />
BL<br />
E<br />
157<br />
157<br />
157<br />
182<br />
182<br />
182<br />
183<br />
183<br />
183<br />
185<br />
185<br />
185<br />
185<br />
220<br />
220<br />
220<br />
220<br />
221<br />
TR<br />
TR<br />
TR<br />
TR<br />
TR<br />
TR<br />
TR<br />
TR<br />
TR<br />
TR<br />
TR<br />
TR<br />
TR<br />
TR<br />
TR<br />
TR<br />
TR<br />
TR<br />
D<br />
G<br />
R<br />
R<br />
R<br />
X<br />
G<br />
R<br />
S<br />
T<br />
A<br />
D<br />
H<br />
F<br />
H<br />
M<br />
N<br />
N (A)<br />
(B)<br />
(C)<br />
167<br />
171<br />
174<br />
177<br />
180<br />
183<br />
153<br />
162<br />
168<br />
174<br />
180<br />
186<br />
-<br />
-<br />
219<br />
153<br />
195<br />
198<br />
201<br />
207<br />
207<br />
168<br />
140<br />
165<br />
210<br />
213<br />
165<br />
136<br />
171<br />
245<br />
232<br />
250<br />
220<br />
209<br />
158<br />
156<br />
1.<br />
1.<br />
2.<br />
2.<br />
1.<br />
3.<br />
1.<br />
1.<br />
2.<br />
2.<br />
3.<br />
1.<br />
3.<br />
3.<br />
2.<br />
3.<br />
1.<br />
2.<br />
2.<br />
3.<br />
3.<br />
4.<br />
10.<br />
5.<br />
2.<br />
2.<br />
2.<br />
6.<br />
6.<br />
3.<br />
1.<br />
2.<br />
2.<br />
4.<br />
1.<br />
1.<br />
1<br />
6<br />
1<br />
6<br />
1<br />
0<br />
5<br />
5<br />
2<br />
9<br />
4<br />
7<br />
7<br />
4<br />
6<br />
3<br />
6<br />
6<br />
6<br />
4<br />
0<br />
5<br />
6<br />
8<br />
4<br />
3<br />
2<br />
8<br />
1<br />
9<br />
3<br />
4<br />
1,2.2<br />
2<br />
0<br />
1
96<br />
kerogen) has not experienced a thermal history sufficient to<br />
have generated significant quantities of migratable<br />
hydrocarbon (i.e. conventional <strong>oil</strong>). Barker et al (1983)<br />
reported that the temperature-programmed pyrolysis of two<br />
Marcellus samples yielded only small peaks attributable to<br />
bitumen, suggesting the Marcellus to be only marginally<br />
mature. Vitrinite reflectance values for the Marcellus also<br />
reported by Barker et al (1983) supported this maturation<br />
level.<br />
The organic geochemical studies by Powell et al. (1984)<br />
determined that Marcellus Formation samples have a<br />
sufficiently high proportion of hydrocarbon of the bitumen<br />
type to be considered marginally mature to mature <strong>and</strong> that the<br />
yield of hydrocarbons are sufficient to consider the Marcellus<br />
a "good" <strong>potential</strong> source rock for conventional petroleum<br />
generation (see Figure 15 in Powell et al. 1984).<br />
Thus, the Marcellus Formation is consider to have<br />
generally attained a marginally-mature level of thermal<br />
maturity such that a significant, but small proportion of the<br />
organic carbon is present in the form of bitumen with the<br />
remainder in the form of kerogen. It is unlikely that a<br />
significant portion of the bitumen has been lost by migration<br />
processes. Thus, the Marcellus Formation is intermediate in<br />
thermal maturity somewhere between <strong>Ontario</strong>'s immature Devonian<br />
Kettle Point Formation <strong>and</strong> the mature Ordovician Collingwood<br />
Member.
97<br />
Geochemistry of the organic matter. Visual assessment of<br />
kerogen particles from two samples of the Marcellus by P.<br />
Gunther (Petro-Canada) reported in Barker et al. (1983)<br />
indicated a dominance of amorphous (possibly algal or<br />
bacterial) <strong>and</strong> exinous (possibly spores <strong>and</strong> pollen) particles<br />
over plant-derived vitrinous <strong>and</strong> fusinous particles. This<br />
assemblage is typical of organic matter from both marine <strong>and</strong><br />
terrestrial sources deposited in a marine environment. This<br />
material typically has a geochemistry of Type II kerogen<br />
(Tissot <strong>and</strong> Welte, 1978) <strong>and</strong> is similar to the kerogen<br />
geochemistry ascribed to the Collingwood <strong>and</strong> Kettle Point<br />
<strong>shale</strong>s.<br />
The relative "richness" of the Marcellus Formation<br />
organic matter can be assessed by comparing the pyrolysis<br />
yield per unit weight of organic carbon for samples from this<br />
formation to that of the other <strong>Ontario</strong> <strong>oil</strong> <strong>shale</strong>s. In order<br />
to make this comparison among units which are themselves<br />
variable, the linear regression expressions relating Fischer<br />
Assay pyrolysis yield to the amount of total organic carbon<br />
(TOC) are used to predict the FA yields for hypothetical<br />
samples having 10* TOC. The regression equations parameters<br />
<strong>and</strong> the predicted pyrolysis yields are shown in Table 11.
98<br />
TABLE 11. Regression equation parameters <strong>and</strong> predicted<br />
Fischer Assay yield for hypothetical samples with<br />
icn TOG.<br />
FA - a TOG -H b<br />
Regression Eq. Parameters Hypothetical FA<br />
a b (l/tonne)<br />
Kettle Point<br />
Formation<br />
5.26<br />
-4.08<br />
48.5<br />
Marcellus<br />
Formation<br />
5.74<br />
+0.412<br />
57.8<br />
Collingwood<br />
Member<br />
(Lindsay Fm.)<br />
7.52<br />
-11.7<br />
63.5<br />
The TOG/FA relationships in Table 11 indicates that<br />
relative to the other <strong>Ontario</strong> <strong>oil</strong> <strong>shale</strong>s the Marcellus<br />
Formation yields an intermediate amount of <strong>oil</strong>. The Hytort<br />
pyrolysis (a technique in which hydrogen is added to the<br />
retorting process) of Collingwood <strong>and</strong> Kettle Point samples<br />
always result in higher yields than the Fischer Assay (no<br />
hydrogen added), indicating that hydrogen, not carbon limits<br />
pyrolysis yield <strong>and</strong> that the organic "richness" of these<br />
samples really relates to the amount of hydrogen contained in<br />
its organic matter. This observation, combined with the<br />
relatively lower yields per unit of organic carbon of the<br />
Marcellus Formation (Table 11) suggests that the Marcellus<br />
Formation organic matter is somewhat hydrogen-poor with<br />
respect to the Collingwood Member <strong>oil</strong> <strong>shale</strong>s.
99<br />
The somewhat hydrogen-poor nature of the Marcellus<br />
Formation organic matter could result from the incorporation<br />
of either less hydrogen-rich, type I material or more<br />
hydrogen-poor, terrestrial, type III material. Visual<br />
assessment (Barker et al. 1983) points to a slightly greater<br />
proportion of terrestrial-derived vitrinous <strong>and</strong> fusinous<br />
material in the organic matter as the cause of its "leanness"<br />
relative to the Collingwood <strong>oil</strong> <strong>shale</strong>s.<br />
Conclusions. The Marcellus Formation contains a<br />
significant thickness of organic rich (greater than l* TOC)<br />
<strong>shale</strong>. The organic matter is dominantly kerogen, but up to<br />
15% could be bitumen produced by thermal cracking of the<br />
kerogen at the marginally-mature thermal maturation level<br />
attained by this <strong>shale</strong>. The kerogen is probably geochemically<br />
type II, but less-hydrogen-rich than the Collingwood Member<br />
<strong>oil</strong> <strong>shale</strong>. This geochemical difference probably reflects a<br />
greater proportion of terrestrially-derived type III<br />
(geochemically) kerogen in the Marcellus Shale.
100<br />
5. RESOURCE EVALUATION<br />
Two types of resource estimates were prepared for the<br />
Marcellus Formation. The first, termed L<strong>and</strong> Accessible<br />
Resource Estimate, is based largely on information or<br />
interpretations from the four OGS drillholes which intersected<br />
the formation. The premise for this estimate is that any<br />
resource development of the Marcellus would most likely be in<br />
the area where the overburden is thinnest <strong>and</strong> the unit is most<br />
accessible (i.e. on l<strong>and</strong>).<br />
However, the Marcellus Formation also extends beneath<br />
Lake Erie <strong>and</strong>, although data from this subcrop area is not as<br />
reliable, this information was combined with the OGS drillhole<br />
data to produce the second estimate, termed the Total Canadian<br />
Formation Estimate.<br />
Both estimates have severe limitations. The L<strong>and</strong><br />
Accessible Resource Estimate is based on a small data set <strong>and</strong><br />
should be regarded with caution. At best, this evaluation<br />
should only be viewed as a general guide.<br />
South of the OGS drillhole pattern, beneath Lake Erie,<br />
the Marcellus is apparently thicker <strong>and</strong> underlies a large<br />
area. However, the unit can be identified only by its<br />
geophysical log signature <strong>and</strong> the presence of dark <strong>shale</strong><br />
cuttings in some petroleum exploration wells. Thus, both the<br />
location <strong>and</strong> very nature of the formation becomes very<br />
speculative, making the Total Canadian Formation Estimate<br />
somewhat arbitrary.
101<br />
5.1 L<strong>and</strong> Accessible Resource Estimate<br />
Although probably more reliable than the Total Canadian<br />
Formation Estimate that follows, this estimate is based on a<br />
minimal amount of data, hence is considered only a reasonable<br />
estimate of what may be present, <strong>and</strong> not what is present.<br />
Geochemical data used in this resource evaluation of the<br />
Marcellus Formation are shown in Tables 5 <strong>and</strong> 12. Clearly<br />
identifiable are the relatively high Total Organic Carbon<br />
(TOC) values which distinguish the upper <strong>and</strong> lower organic<br />
rich beds. These are also noted in the integrated drill hole<br />
logs (Appendix 2), <strong>and</strong> have been discussed previously, see<br />
Section 3.3.<br />
Also evident from Table 5 is that, apart from the upper<br />
<strong>and</strong> lower organic beds, all the intervening strata appears to<br />
have an average T.O.C. content of less than 2.5%. As this is<br />
the normal cut-off point for an <strong>oil</strong> <strong>shale</strong> to be of economic<br />
interest (or indeed to be an <strong>oil</strong> <strong>shale</strong> by definition - see<br />
Section 1.2 <strong>and</strong> Macauley, 1985), these low grade strata have<br />
not been included in this evaluation. Thus, this estimate<br />
only includes the organic rich beds.<br />
Shown in Table 12 are the results of Fischer Assays <strong>and</strong><br />
Rock-Eval Analyses of the OGS core samples (carried out by the<br />
Institute of Sedimentary <strong>and</strong> Petroleum <strong>Geology</strong> in Calgary).<br />
Fischer Assay is an <strong>oil</strong> <strong>shale</strong> industry st<strong>and</strong>ard which suggests<br />
the <strong>oil</strong> recovery that may be achieved using a simple retorting<br />
process. Rock-Eval Analysis provides a range of information
102<br />
a 4)<br />
tt H^<br />
rH<br />
a c<br />
f^<br />
rH<br />
(0<br />
w 1<br />
^^<br />
8<br />
a<br />
4J<br />
V.0<br />
rH<br />
1 f^ rH<br />
0 •* —4<br />
•H 0<br />
4-1 O<br />
*0 4J<br />
a<br />
4-1<br />
x^<br />
O*<br />
•X<br />
•o<br />
rH rt<br />
4)<br />
-H x. s<br />
X rH<br />
* en CM in<br />
O rH P* VO<br />
• 4 . *<br />
PH P* P* VO<br />
vo en ^ o<br />
* * * *<br />
en CM ^ ^<br />
co oo rt rt<br />
vo T in<br />
* * t<br />
CM o o en<br />
PH rH en oo<br />
rt CM<br />
en en<br />
p* ^ vo in<br />
* * * *<br />
PH PH PH PH<br />
CM rt rt<br />
•V CM 00 CM<br />
* * * *<br />
rt O rt ••r<br />
PH PH rt rt<br />
PH rH O* rH<br />
* * * *<br />
CM ^ 00 O<br />
en oo oo en<br />
•H rH<br />
4J<br />
rH<br />
en vo rH PH<br />
p* o en en oo PH<br />
rt rt<br />
rt PH CM PH<br />
rH PH PH PH<br />
CO PH rt rt<br />
4J<br />
\ O<br />
g<br />
rH<br />
0 rH<br />
4* -H<br />
4-1 0<br />
10 o<br />
X 4J<br />
rt<br />
VO rt<br />
- rt<br />
in<br />
in<br />
•V P*<br />
O CO<br />
g *<br />
vo vo<br />
rt<br />
in<br />
c<br />
^i<br />
w 4)<br />
in<br />
j*.<br />
•H<br />
(0<br />
c<br />
(^<br />
^^<br />
10<br />
10<br />
10<br />
r4^<br />
1<br />
•0<br />
rH<br />
4)<br />
•H<br />
^<br />
f i<br />
Zx.<br />
c- (<br />
•H<br />
O<br />
1<br />
13<br />
^•4<br />
4)<br />
**H<br />
^<br />
IH<br />
4) 4J<br />
4J \<br />
(0 rH<br />
2<br />
iH<br />
4-1<br />
"s.<br />
rH<br />
o<br />
in<br />
r*<br />
en<br />
o '<br />
o<br />
rt -<br />
in in<br />
•H in<br />
CM<br />
en<br />
^ *<br />
VO (M<br />
CM<br />
PH 00<br />
* *<br />
vo in<br />
rt PH<br />
* *<br />
o o<br />
^1* PH<br />
rH<br />
CM VO<br />
en en<br />
in CM<br />
rt<br />
*<br />
rt<br />
rH<br />
00<br />
*<br />
00<br />
^<br />
•^<br />
.<br />
o<br />
CM<br />
ea<br />
4)<br />
tH 4)<br />
Jj<br />
0<br />
O)<br />
*^4<br />
b,<br />
0<br />
•H<br />
•M<br />
•H ^i<br />
0 4J<br />
4) ~*<br />
a><br />
V) A<br />
1 b<br />
rH O<br />
H<br />
O<br />
in<br />
rH rt<br />
en o eṇ<br />
rt r*<br />
o o<br />
en en<br />
1<br />
toH^<br />
rH<br />
10<br />
C<br />
i4j<br />
rH<br />
10<br />
^<br />
jj<br />
•H<br />
CO<br />
c<br />
s<br />
B W<br />
O O*<br />
i 3<br />
*<br />
CJ<br />
*<br />
0<br />
*<br />
oo<br />
rt O<br />
CM<br />
rt en<br />
•^ vo in<br />
* * * rt<br />
•H CM CM<br />
•H rH rH •^•<br />
PH en<br />
rt rt<br />
CM CM<br />
co en ^ PH<br />
m T oo en<br />
co * * rt * *<br />
. O O - -9 •V<br />
G\ ^ *H ^*<br />
(<br />
en<br />
^•<br />
CM<br />
in oo in<br />
. . .<br />
^ CM rt<br />
W<br />
1<br />
o o<br />
a<br />
•c<br />
c^10<br />
(0<br />
(0<br />
l4j<br />
(4<br />
4)<br />
X3<br />
o(0<br />
•H<br />
H<br />
a<br />
t 4)<br />
*J<br />
CH<br />
41<br />
•H a<br />
S 1<br />
a<br />
M<br />
en<br />
00 CO 00 rH<br />
* * * *<br />
00 00 00 rH<br />
O O O rH<br />
rH rH rH rH<br />
ill i in<br />
vO vo vo O rt rt<br />
00 00 00 rH rH H<br />
O O O rH rH rH<br />
rH rH rH rH rH tH<br />
•a -o<br />
O q)<br />
in ea co<br />
Z<br />
0 O<br />
1 -H -H<br />
c c<br />
a ia<br />
a o* o*<br />
O x tH o 14<br />
o<br />
J r-l M<br />
J 4) 41<br />
HO, 3<br />
aa o<br />
OD .J<br />
VO<br />
CO<br />
' CM<br />
en vo<br />
l en<br />
•* l -* *<br />
VO VO O rH rt rt<br />
rt rt rt vo vo vo<br />
on en en en en en<br />
•o -a<br />
4) 4)<br />
vo aa to<br />
z<br />
O 0<br />
1 -r-l -H<br />
W C (0 C<br />
A<br />
t*<br />
O X r-l 0 0<br />
J 3 U 4) iH<br />
41<br />
Q D* S<br />
VO rH O<br />
- en CM in<br />
•C<br />
4)<br />
oo 03<br />
Z<br />
O<br />
1 -H<br />
C<br />
10<br />
a ^ p1<br />
O rH<br />
X O<br />
J IH<br />
J 4)<br />
H 3<br />
g 3<br />
* A *<br />
VO PH PH<br />
co oo oo<br />
l l l<br />
VO VO rH<br />
PH en CM<br />
CO VO PH<br />
co co oo<br />
•H<br />
(b<br />
1<br />
c<br />
0<br />
iH<br />
4J<br />
(0<br />
eo<br />
(b<br />
(0<br />
3<br />
rH<br />
rH<br />
41<br />
0<br />
U<br />
•C<br />
Z<br />
1<br />
CM<br />
rH<br />
03<br />
a<br />
eS
103<br />
(SI, S2, Tmax, etc.) including total yield estimate that is<br />
similar to, but higher than the Fischer Assay Values (for<br />
details of both tests - see Appendix 1).<br />
Rock density values are needed for any resource estimate.<br />
As the Marcellus Formation contains at least three lithologies<br />
(carbonate, normal <strong>shale</strong> <strong>and</strong> <strong>oil</strong> <strong>shale</strong>), any density estimate<br />
for the unit tends to be something of an average. As actual<br />
density measurements for the rock samples were not made, the<br />
density values were taken from logs run from the boreholes<br />
(see Johnson 1985).<br />
Using the above mentioned data, this estimate considers<br />
only the part of the Marcellus Formation which lies below<br />
l<strong>and</strong>, or is below Lake Erie within l kilometre of the<br />
shoreline. The on-shore subcrop pattern for the unit is based<br />
on the map of Uyeno et al. (1982) with some modification to<br />
allow for the new data from the OGS cores. Because of the<br />
scatter of data points (wells) <strong>and</strong> the difficulty in defining<br />
the Marcellus Formation in the subsurface, the proposed<br />
subcrop distribution of the unit remains tentative.<br />
North of Lake Erie, the Marcellus underlies about 440<br />
square kilometres of <strong>Ontario</strong>; a further 35 square kilometres<br />
of subcrop area lies beneath Lake Erie within l kilometre of<br />
the shoreline. Therefore, the total l<strong>and</strong> accessible<br />
Marcellus amounts to about 475 square kilometres. To the<br />
west, the Marcellus Formation is overlain by units of the<br />
Hamilton Group, <strong>and</strong> is not considered as accessible to
104<br />
resource extraction <strong>and</strong> therefore is not included in this<br />
estimate.<br />
As there are two organic rich zones in the Marcellus,<br />
separate resource estimates are made for each zone as follows.<br />
These values are then combined for the L<strong>and</strong> Accessible<br />
Formation Estimate. Drill core M-8 did not intersect an upper<br />
organic zone, although the gamma ray peak locations on the<br />
geophysical logs suggest it is present. Its absence, in M-8,<br />
is probably a result of core recovery problems, more than an<br />
absence of the upper organic bed, thus it has been included in<br />
this calculation. As both the upper <strong>and</strong> lower organic rich<br />
beds were intersected by several drillholes, values for<br />
organic rich bed thickness <strong>and</strong> yield were averaged from data<br />
in Tables 5 <strong>and</strong> 6.<br />
av. density av. thickness Yield<br />
(m.) (1/t)<br />
Upper Organic 2.37 0.68 61.7<br />
Lower Organic 2.39 0.45 24.3<br />
(Individual values for each hole are shown in Table 5 <strong>and</strong> 6).<br />
The calculations for a reserve value for each organic bed<br />
were calculated using the following equation:<br />
Surface area (m2) x zone thickness (m) x rock density x<br />
yield (I/tonne)/1000 = Reserve in cubic metres of <strong>oil</strong><br />
(equivalent kerogen)
105<br />
The calculations are as follows:<br />
Upper Organic 7<br />
475 x 1000 x 1000 x 0.68 x 2.37 x 61.7/1000 = 4.7 x 10<br />
Lower Organic<br />
475 x 1000 x 1000 x 0.45 X 2.39 x 24.3/1000 - 1.2 x 10 7<br />
Thus the total l<strong>and</strong> accessible Marcellus Formation resource<br />
amounts to 5.9 x 10 cubic metres or approximately 3.7 x 10<br />
barrels.<br />
From the limited data, some interpretation can be made of<br />
the kerogen distribution within the l<strong>and</strong> accessible portion of<br />
the formation. From Table 12, it is evident that the<br />
relationship (ratios) between T.O.C. content <strong>and</strong> yield (as per<br />
Rock-Eval data) is fairly constant <strong>and</strong> is sufficient to use<br />
T.O.C. as a predictor of yield. As the drillholes align in an<br />
approximate east to west line (M-5, M-6, M-8, OGS-82-3) an<br />
east-west trend in kerogen richness is suggested. For the<br />
upper zone, kerogen content increases to the east (T.O.C.%:<br />
M-5s 11.4, M-6 = 9.8, OGS-82-3 - 4.9).<br />
Unit thickness for the upper zone increases to the west<br />
(thickness (m): M-5 - 0.41, M-6 ^.50, M-8 (estimated from<br />
gamma ray logs) ^.7, M-9 - 1.15). For the lower organic-rich<br />
zone, the kerogen content appears to increase to the west<br />
(T.O.C.%: M-5 = 4.3, M-6 = 4.3, M-8 =3.5 / OGS-82-3 = 7 .3*)<br />
while the zone thickens to the east, up to M-5 where it thins<br />
again (M-5 - 0.25, M-6 = 0.75, M-8 ^.68, OGS-82-3 = 0.15).
106<br />
Thus, according to the OGS core data, there appears to be an<br />
inverse relationship between kerogen richness <strong>and</strong> unit<br />
thickness for both organic rich zones. Whether this<br />
relationship applies to the substantially thicker off-shore<br />
Marcellus is not known.<br />
5.2 Total Canadian Formation Evaluation<br />
An estimate can be made of the kerogen (<strong>oil</strong> equivalent)<br />
content of the Marcellus Formation which is present below l<strong>and</strong><br />
<strong>and</strong> below the Canadian part of Lake Erie. Two basic<br />
assumptions have been made which appear to be supported by the<br />
geophysical logs. Firstly, the two main organic beds present<br />
on l<strong>and</strong> are also found below Lake Erie <strong>and</strong>, secondly, as the<br />
formation appears to thicken (to over 12 metres), the relative<br />
proportion of the unit which is organic rich remains constant.<br />
Although the precise shape of the subcrop/subsurface<br />
distribution pattern for the Marcellus remains uncertain, it<br />
appears to be lensoidal with a length of at least 175 km <strong>and</strong> a<br />
width of 75 km. Using the total formation isopach map (back<br />
pocket) for thickness, it is suggested that the total Canadian<br />
portion of the formation amounts to 3.25 x 10¹⁰ cubic metres<br />
of strata.<br />
Using data from the complete l<strong>and</strong> cores as a guide (M-5,<br />
M-6 <strong>and</strong> OGS-82-3, Table 6), it appears the two organic rich<br />
9 3<br />
beds average 27% of the total formation, thus 9.0 x 10 m of
107<br />
the formation is organic rich.. Averaging Fischer Assay <strong>and</strong><br />
density values from Table 12, give an average yield of 43.5<br />
litres per tonne <strong>and</strong> a density of 2.38. Applying this to the<br />
total organic rich volume above, using the previous equation,<br />
83 9<br />
suggests that the unit may contain 9.31 x 10 m or 5.8 x 10<br />
barrels of <strong>oil</strong> (kerogen equivalent).<br />
5.3 Development Considerations<br />
Although the above figures for both the L<strong>and</strong> Accessible<br />
Formation Estimate (3.7 x 10⁸ barrels) <strong>and</strong> Total Canadian<br />
Formation Estimate (5.8 x 10⁹ barrels) are very large <strong>and</strong> even<br />
assuming an <strong>oil</strong> price much higher than at present (1986),<br />
development <strong>potential</strong> of the unit is probably limited. Drift<br />
cover over the unit, even in the most accessible on-shore<br />
area, is at least 86 metres. This, combined with a unit<br />
thickness of only a couple of metres, suggests stripping<br />
ratios of 50:1. This <strong>and</strong> other environmental factors clearly<br />
precludes a strip mining operation. Furthermore, the organicrich<br />
beds are separated by beds of organic poor material<br />
necessitating a more complex high grading process. As the<br />
beds are often less than 0.5 metres thick, selective<br />
underground mining of the individual organic rich zones would<br />
be difficult <strong>and</strong> expensive based on existing technology.
108<br />
In addition, the nearby Upper Devonian Kettle Point<br />
Formation <strong>oil</strong> <strong>shale</strong> (Russell 1985) <strong>and</strong> Upper Ordovician<br />
Collingwood Member <strong>oil</strong> <strong>shale</strong> (Russell <strong>and</strong> Telford 1983) are of<br />
greater thickness, underlie much larger areas, <strong>and</strong> can be<br />
found under thinner overburden cover, making them more<br />
attractive alternatives.
109<br />
6. REFERENCES<br />
Baltrusaitis, E.J.<br />
1974: Middle Devonian bentonites in the Michigan Basin;<br />
American Association of Petroleum Geologists<br />
Bulletin, Vol. 58, p.1323-1330.<br />
Barker, J.F.<br />
1985: Geochemical analysis of <strong>Ontario</strong> <strong>oil</strong> <strong>shale</strong>s; <strong>Ontario</strong><br />
Geological Survey, Open File Report 5568, 77pp.<br />
Barker, J.F., <strong>and</strong> Chatten, S.<br />
1982: A technique for determining low concentrations of<br />
total carbonate in geological materials;<br />
Chemical <strong>Geology</strong>, Vol. 36, p.317-323.<br />
Barker, J.F., Dickhout, R.D., Russell, D.J., Johnson, M.D. <strong>and</strong><br />
Gunther, P.<br />
1983: Paleozoic black <strong>shale</strong>s of <strong>Ontario</strong> - possible <strong>oil</strong><br />
<strong>shale</strong>s; in Miknis, E.P. <strong>and</strong> McKay, J.F. (editors),<br />
Geochemistry <strong>and</strong> Chemistry of Oil Shales, American<br />
Chemical Society Symposium Series No.23O, American<br />
Chemical Society, p.119-138.<br />
Barnes, C.R., Norford, B.S., <strong>and</strong> Skevington, D.<br />
1981: The Ordovician system in Canada: correlation chart<br />
<strong>and</strong> explanatory notes; Paris, International<br />
Union of Geological Sciences, 27p.<br />
Beards, R.J.<br />
1967: Guide to subsurface Paleozoic <strong>stratigraphy</strong> of<br />
southern <strong>Ontario</strong>; <strong>Ontario</strong> Department of Energy <strong>and</strong><br />
Resources Management, Paper 67-2.<br />
Bolton, T.E.<br />
1957: Silurian <strong>stratigraphy</strong> <strong>and</strong> paleontology of the<br />
Niagara Escarpment in <strong>Ontario</strong>; Geological Survey of<br />
Canada, Memoir 289, 145p., with maps.<br />
Brown, G.<br />
1985: Comparative geochemistry of southwestern <strong>Ontario</strong><br />
black <strong>shale</strong>s, in Bedrock <strong>and</strong> Till Clasts, for<br />
Glacier Provenance; Unpublished Bachelor of Science<br />
Thesis, University of Western <strong>Ontario</strong>, 143p.<br />
Caley, F.J.<br />
1945: Paleozoic <strong>Geology</strong> of the Windsor-Sarnia Area,<br />
<strong>Ontario</strong>; Canada Department of Mines <strong>and</strong> Resources,<br />
Geological Survey, Memoir 240, 4 maps, 277p.
110<br />
Church, P.L.<br />
1984: <strong>Geology</strong> <strong>and</strong> geochemistry of the Collingwood<br />
Member,Lindsay Formation, southern <strong>Ontario</strong>; Unpubl.<br />
B.Se.Thesis, University of Waterloo, 4Op.<br />
Churcher, P.L., <strong>and</strong> Dickhout, R.D.<br />
1987: Analysis of ancient sediments for total organic<br />
carbon- a new method; Journal of Geochemical<br />
Exploration, Vol. 29, p.235-246.<br />
Cooper, G.A.<br />
1930: Stratigraphy of the Hamilton Group of New York;<br />
Parts l <strong>and</strong> 2; American Journal of Science, Vol. 19,<br />
p.116-134, 214-236.<br />
Delitala, F.A.<br />
1984: The Mineralogy <strong>and</strong> Geochemistry of the Kettle Point<br />
Oil Shale, Southwestern <strong>Ontario</strong>; Unpublished Master<br />
of Science Thesis, University of Western <strong>Ontario</strong>,<br />
194p.<br />
Dennison, D.M.<br />
1976: Appalachian Queenston delta related the eustatic sea<br />
level drops accompanying Late Ordovician glaciation<br />
centered in Africa in Basset, M.G. (ed.). The<br />
Ordovician System, University of Wales Press,<br />
Cardif, p.107-120.<br />
Dennison, J.M. <strong>and</strong> Textoris, D.A.<br />
1977: Tioga Bentonite Time-Marker associated with Devonian<br />
<strong>shale</strong>s in Appalachian Basin in Schott, G.L.,<br />
Overbey, W.K. Jr., Hunt, A.E. <strong>and</strong> Komar, C.A. eds.,<br />
Eastern Gas Shales Symposium 1st Proceedings: U.S.<br />
Dept. of Energy, Special Paper MERC/SP-775, p.166-<br />
182.<br />
Dennison, J.M. <strong>and</strong> Naegele, O.D.<br />
1978: Tioga Bentonite time marker associated with Devonian<br />
<strong>shale</strong>s in Appalachian Basin; in Schott,%2% G.L.,<br />
Overbey, W.K., Jr., Hunt, A.E., <strong>and</strong> Komar, C.A.<br />
(editors) of Eastern Gas Shales Symposium, 1st<br />
Proceedings, United States Department of Energy,<br />
Special Paper MERC/SP-77/5, p.166-182.<br />
Droste, J.B. <strong>and</strong> Vitaliano, C.J.<br />
1973: Tioga Bentonite (Middle Devonian) of Indiana; Clay<br />
s<strong>and</strong> Clay Minerals Bulletin, Vol. 21, p.9-13.<br />
Dusseault, M.B. <strong>and</strong> Loftsson, M.<br />
1985: The mechanical properties of the Kettle Point <strong>oil</strong><br />
<strong>shale</strong>s; <strong>Ontario</strong> Geological Survey, Open File Report<br />
5560, 93p.
Ill<br />
Ells, G.D.<br />
1978: Stratigraphic cross sections extending xfrom Devonian<br />
Antrim Shale to Mississippian Sunbury Shale in the<br />
Michigan Basin; United States Department of Energy,<br />
Report No. FE-2346-30.<br />
Espitalie, J., Laporte, J.L., Madec, M., Masquis, F.,<br />
Laplat, P., <strong>and</strong> Boute, V.A.<br />
1977: Methode rapide de caracterisation des roches meres,<br />
de Leaur Potential petrolier et de leur degre<br />
d'evolution; Rev. Inst. Fr. Petrolieo., Vol. 32,<br />
p.23-42.<br />
Ferrigno, K.F.<br />
1971: Environmental influences on the distribution <strong>and</strong><br />
abundance of conodonts from the Dundee Limestone<br />
(Devonian), St. Marys, <strong>Ontario</strong>; Canadian Journal of<br />
Earth Sciences, Vol. 8, p.378-386.<br />
Grey, J.P., Hodges, D.A., <strong>and</strong> Knapp, N.F.<br />
1982: An integrated study of the Devonian age black <strong>shale</strong>s<br />
in eastern Ohio; Ohio Department of Natural<br />
Resources, Division of Geological Survey, Report for<br />
Contract D.E. AS21-76ET12131, 174p.<br />
Hall, J.<br />
1939: Third Annual Report to the 4th Geologic District of<br />
the State of New York; New York Geological Survey<br />
Annual Report 3, p.287-339.<br />
Harper, J.A. <strong>and</strong> Piotrowski, R.G.<br />
1978: Stratigraphy, extent, gas production, <strong>and</strong> future gas<br />
<strong>potential</strong> of the Devonian organic rich <strong>shale</strong>s in<br />
Pennsylvania; United States Department of Energy,<br />
Second Eastern Gas Shale Symposium, Vol.1, p.310-<br />
329.<br />
Harris, D.<br />
1985: Graphic logs of <strong>oil</strong> <strong>shale</strong> intervals - Ordovician<br />
Collingwood Member <strong>and</strong> the Devonian Kettle Point <strong>and</strong><br />
Marcellus Formation; <strong>Ontario</strong> Geological Survey, Open<br />
File Report 5527, 222p.<br />
Hasson, K.O. <strong>and</strong> Dennison, J.M.<br />
1978: Devonian Harrell <strong>and</strong> Millboro Shales in parts of<br />
Pennsylvania, Maryl<strong>and</strong>, West Virginia, <strong>and</strong> Virginia;<br />
in Schoot, G.L., Overbey, W.K., Jr., Hunt, A.E., <strong>and</strong><br />
Komer, C.A. (editors) for: Eastern Gas<br />
Shale Symposium, 1st Proceedings, United States<br />
Department of Energy, Special Paper MERC/SP-77/5,<br />
p.634-642.
112<br />
Hubbard, A.B.<br />
1965: Automated modified Fischer Assay retorts for<br />
assaying <strong>oil</strong> <strong>shale</strong> <strong>and</strong> bituminous materials; United<br />
States Department of the Interior, Bureau of Mines<br />
Report of Investigations 6676, 19p.<br />
Janka, J.C. <strong>and</strong> Dennison, J.M.<br />
1980: Devonian <strong>oil</strong> <strong>shale</strong>; in Symposium Papers: Synthetic<br />
fuels from <strong>oil</strong> <strong>shale</strong>s; Chicago Institute of Gas<br />
Technology, p.21-116.<br />
Johnson, M.D.<br />
1982: Oil Shale Assessment Project; p.135-138 in Summary<br />
of Field Work, 1982, by the <strong>Ontario</strong> Geological<br />
Survey, edited by J. Wood, O.L. White, R.B. Barlow,<br />
<strong>and</strong> A.C. Colvine, <strong>Ontario</strong> Geological Survey,<br />
Miscellaneous Paper 106, 235p.<br />
Johnson, M.D.<br />
1983: Oil Shale Assessment Project, deep drilling results<br />
1982-1983, Toronto Region; <strong>Ontario</strong> Geological<br />
Survey, Open File Report 5477, 17p.<br />
1985: Oil Shale Assessment Project, shallow drilling<br />
results, 1982-1983, Kettle Point <strong>and</strong> Marcellus<br />
Formations; <strong>Ontario</strong> Geological Survey, Open File<br />
Report 5531, l figure, 2 maps, numerous lithological<br />
<strong>and</strong> geological logs in back pocket, 44p.<br />
Johnson, M.D., <strong>and</strong> Telford, P.G.<br />
1985: Paleozoic <strong>Geology</strong> of the Kagawong area, District of<br />
Manitoulin (41G/16); <strong>Ontario</strong> Geological Survey,<br />
Preliminary Map 2669, scale 1:50 000, <strong>Geology</strong> 1979-<br />
1981.<br />
Johnson, M.D., Russell, D.J., <strong>and</strong> Telford, P.G.<br />
1983a: Oil Shale Assessment Project, Volume l, shallow<br />
drilling results 1981-1982; <strong>Ontario</strong> Geological<br />
Survey, Open File Report 5458, 36p.<br />
1983b: Oil Shale Assessment Project, Volume 2, drill holes<br />
for regional correlation 1981-1982; <strong>Ontario</strong><br />
Geological Survey, Open File Report 5459, 2Op.<br />
1985: Oil Shale Assessment Project, drillholes for<br />
regional correlation 1983-1984; <strong>Ontario</strong> Geological<br />
Survey, Open File Report 5565, 8 figures, 6 drill<br />
logs in back pocket, 49p.
113<br />
Klapper, G., <strong>and</strong> Philip, G.M.<br />
1971: Devonian conodont apparatuses <strong>and</strong> their vicarious<br />
skeletal elements; Lethaia, Vol. 4, p.429-452.<br />
Lafferty, R.C.<br />
1941: Central basin of Appalachian geosyncline; American<br />
Association of Petroleum Geologists, Bulletin, Vol.<br />
25, p.781-825.<br />
Larter, S.R., <strong>and</strong> Douglas, A.G.<br />
1978: Low-molecular weight aromatic hydrocarbons in coal<br />
maceral pyrolysates as indicators of diagenesis <strong>and</strong><br />
organic matter type in "Environment Bio-chemistry<br />
<strong>and</strong> Geomicrobiology", Krumbein, W.E. (ed.), Ann<br />
Arbor Science, p.373-386.<br />
Legall, F.D., Barnes, C.R., <strong>and</strong> Macqueen, R.W.<br />
1981: Thermal maturation, burial history <strong>and</strong> hot spot<br />
development, Paleozoic strata of southern <strong>Ontario</strong>-<br />
Quebec, from conodont <strong>and</strong> acritarch colour<br />
alteration studies; Bulletin of Canadian Petroleum<br />
<strong>Geology</strong>, v.29, p.492-539.<br />
Lilienthal, R.T.<br />
1978: Stratigraphic cross sections of the Michigan Basin;<br />
Michigan Department of Natural Resources, Geological<br />
Survey Division, Report of Investigations 19, 36p.,<br />
89 sections.<br />
Liberty, B.A.<br />
1969: Paleozoic geology of the Lake Simcoe area, <strong>Ontario</strong>;<br />
Geological Survey of Canada, Memoir 355, 201p.<br />
Lomenick, T.E.<br />
1983: Regional geologic assessment of the Devonian-<br />
Mississippian <strong>shale</strong> sequence of the Appalachian,<br />
Illinois, <strong>and</strong> Michigan Basins relative to <strong>potential</strong><br />
storage/disposal of radioactive wastes; Oak Ridges<br />
National Lab, 145p.<br />
Macauley, G.<br />
1984: <strong>Geology</strong> of the <strong>oil</strong> <strong>shale</strong> deposits of Canada;<br />
Geological Survey of Canada, Paper 81-25, 65p.<br />
Macauley, G., Snowdon, L.R., <strong>and</strong> Ball, F.D.<br />
1985: Geochemistry <strong>and</strong> geological factors governing<br />
exploitation of selected Canadian <strong>oil</strong> <strong>shale</strong><br />
deposits; Geological Survey of Canada, Paper 85-13,<br />
65p.
114<br />
Martini, I.P.<br />
1971: Regional analysis of sedimentology of the Medina<br />
Formation (Silurian), <strong>Ontario</strong> <strong>and</strong> New York; American<br />
Association of Petroleum Geologists Bulletin 55,<br />
p.1245-1251.<br />
Matthews, R.D.<br />
1983: The Devonian-Mississippian <strong>oil</strong> <strong>shale</strong> resource of the<br />
eastern United States; 16th Oil Shale Symposium:<br />
Institute of Gas Technology, Golden Colorado, p.l-<br />
12.<br />
Musial, R.P.<br />
1982: <strong>Geology</strong> of the Marcellus Formation in southwestern<br />
<strong>Ontario</strong>; Unpublished B.Se. Thesis, University of<br />
Western <strong>Ontario</strong>, 4 maps, 32p.<br />
Oliver, W.A., Jr.<br />
1976: Noncystimorph colonial rugose corals of the<br />
Onesquethaw <strong>and</strong> lower Cazenovia stages (Lower <strong>and</strong><br />
Middle Devonian) in New York <strong>and</strong> adjacent areas;<br />
United States Geological Survey, Professional Paper<br />
869.<br />
Powell, T.G., Macqueen, R.W., Barker, J.F., <strong>and</strong> Bree, D.G.<br />
1984: Geochemical character <strong>and</strong> origin of <strong>Ontario</strong> <strong>oil</strong>s;<br />
Bulletin of the Canadian Society of Petroleum<br />
Geologists, Vol. 32, p.289-312.<br />
Rickard, L.V.<br />
1975: Correlation of the Silurian <strong>and</strong> Devonian rocks in<br />
New York State; New York State map <strong>and</strong> Chart Series<br />
24, 16p.<br />
1984: Correlation of the subsurface Lower <strong>and</strong> Middle<br />
Devonian of the Lake Erie region; Geological Society<br />
of American Bulletin, Vol. 95, p.814-828.<br />
Robl, T.L., <strong>and</strong> Koppenaal, D.W.<br />
1982: The chemical <strong>and</strong> engineering properties of eastern<br />
<strong>oil</strong> <strong>shale</strong>s; Institute of Mining <strong>and</strong> Minerals<br />
Research, Lexington, Kentucky, 288p.<br />
Roen, J.B.<br />
1984: <strong>Geology</strong> of the Devonian black <strong>shale</strong>s of the<br />
Appalachian Basin; Organic Geochemistry, Vol. 5,<br />
p.241-254.
115<br />
Roen, J.B., <strong>and</strong> Hosterman, J.W.<br />
1982: Misuse of the term "bentonite" for ash beds of<br />
Devonian age in the Appalachian Basin; Geological<br />
Society of America Bulletin, Vol. 93, p.921-925.<br />
Russell, D.J.<br />
1985: Depositional analysis of a black <strong>shale</strong> using gammaray<br />
<strong>stratigraphy</strong>: the Upper Devonian Kettle Point<br />
Formation of <strong>Ontario</strong>; Bulletin of the Canadian<br />
Society of Petroleum Geologists, Vol. 33, p.236-253.<br />
Russell, D.J. <strong>and</strong> Telford, P.G.<br />
1983: Revisions to the <strong>stratigraphy</strong> of the Upper<br />
Ordovician Collingwood beds of <strong>Ontario</strong> - a <strong>potential</strong><br />
<strong>oil</strong> <strong>shale</strong>; Canadian Journal of Earth Science, Vol.<br />
20, p.1780-1790.<br />
Russell, D.J. <strong>and</strong> Telford, P.G.<br />
1984a: Stratigraphy <strong>and</strong> <strong>oil</strong> <strong>shale</strong> <strong>potential</strong> of the Upper<br />
Ordovician Collingwood Member in the northeast<br />
Michigan Basin; Geological Association of Canada -<br />
Mineralogical Association of Canada, Abstracts with<br />
Programs, Vol. 9, p.102.<br />
Russell, D.J. <strong>and</strong> Telford, P.G.<br />
1984b: <strong>Geology</strong> of the Long Rapids Formation, Moose River<br />
Basin; p.117-118 in Summary of Field Work, 1984,<br />
<strong>Ontario</strong> Geological Survey, edited by J. Wood, O.L.<br />
White, R.B. Barlow <strong>and</strong> A.C. Colvine, <strong>Ontario</strong><br />
Geological Survey, Miscellaneous Paper 119, 309p.<br />
Rybansky, R. <strong>and</strong> Trevail, R.A.<br />
1983: Oil <strong>and</strong> Gas Exploration, Drilling <strong>and</strong> Production<br />
Summary, 1982, <strong>Ontario</strong> Ministry of Natural<br />
Resources, Oil <strong>and</strong> Gas Paper 4, 174p.<br />
Sacheli, A.L.<br />
1985: The geochemistry of the Ordovician Collingwood<br />
Member, Lindsay Formation, southern <strong>Ontario</strong>;<br />
University of Western <strong>Ontario</strong>, London; Unpublished<br />
B.Se. thesis, 50p.<br />
Sanford, B.V.<br />
1961: Subsurface <strong>stratigraphy</strong> of Ordovician rocks in<br />
southwestern <strong>Ontario</strong>; Geological Survey of Canada,<br />
Paper 60-26, 54p.<br />
1968: Devonian of <strong>Ontario</strong> <strong>and</strong> Michigan; in Proceedings of<br />
the International Symposium on the Devonian System,<br />
D.H. Oswald (editor), Alberta Society of Petroleum<br />
Geologists, Calgary, Vol. 2, p.973-999.
116<br />
Sanford, B.V.<br />
1969a: Subsurface studies of the Paleozoic; in Report of<br />
Activities, Part A: April to October, 1968,<br />
Geological Survey of Canada, Paper 69-1A, p.244.<br />
1969b: <strong>Geology</strong>, Toronto-Winsdor area, <strong>Ontario</strong>; Geological<br />
Survey of Canada, Map 1263A.<br />
Sanford, B.V., <strong>and</strong> Brady, W.B.<br />
1955: Paleozoic <strong>Geology</strong> of the Windsor-Sarnia Area,<br />
<strong>Ontario</strong>; Geological Survey of Canada, Memoir 278, 2<br />
maps, 65p.<br />
Sanford, B.V., <strong>and</strong> Quillian, R.C.<br />
1959: Subsurface <strong>stratigraphy</strong> of Upper Cambrian rocks in<br />
southwestern <strong>Ontario</strong>; Ottawa Department of Mines <strong>and</strong><br />
Technical Surveys, 33p.<br />
Sanford, B.V., Thompson, F.J. <strong>and</strong> McFall, G.H.<br />
1985: Plate tectonics - a possible controlling mechanism<br />
in the development of hydrocarbon traps in<br />
southwestern <strong>Ontario</strong>; Bulletin of the Canadian<br />
Society of Petroleum Geologists, Vol. 33, p.52-71.<br />
Scalan, R.S. <strong>and</strong> Smith, J.E.<br />
1970: An improved measure of the odd-even predominance in<br />
the normal alkanes of sediment extracts <strong>and</strong><br />
petroleum: Geochemica et cosmochemica Acta. Vol. 34,<br />
p.611-620.<br />
Schwietering, J.F.<br />
1979: Devonian <strong>shale</strong>s of Ohio <strong>and</strong> their eastern <strong>and</strong><br />
southern equivalents; United States Department of<br />
Energy CR-79/2, 68p.<br />
Schwietering, J.F., Neal, D.W., <strong>and</strong> Dowse, M.E.<br />
1978: Tully (?) Limestone <strong>and</strong> Hamilton Group in northcentral<br />
<strong>and</strong> east-central West Virginia; in United<br />
States Department of Energy, Second Eastern Gas<br />
Shales Symposium Vol.1, p.240-250.<br />
Snowdon, L.R.<br />
1984: A comparison of Rock-Eval pyrolysis <strong>and</strong> solvent<br />
extraction results from the Collingwood <strong>and</strong> Kettle<br />
Point <strong>oil</strong> <strong>shale</strong>s, <strong>Ontario</strong>; Bulletin of the Canadian<br />
Society of Petroleum <strong>Geology</strong>, Vol. 32, No. 3, p.327-<br />
334.
117<br />
Sparling, D.R.<br />
1985: Correlation of the subsurface Lower to Middle<br />
Devonian of the Lake Erie region: Alternative<br />
interpretation <strong>and</strong> reply; Geological Society of<br />
American Bulletin, Vol. 96, p.1213-1220.<br />
Stauffer, C.R.<br />
1915: The Devonian of southwestern <strong>Ontario</strong>; Geological<br />
Department of Mines, Geological Survey Memoir 34,<br />
34Ip, l map.<br />
Stromquist, J.K., Dickhout, R., <strong>and</strong> Barker, J.F.<br />
1984: Oil Shale Assessment Project; Volume 4, analytical<br />
geochemistry of selected <strong>Ontario</strong> <strong>potential</strong> <strong>oil</strong><br />
<strong>shale</strong>s; <strong>Ontario</strong> Geological Survey, Open File Report<br />
5461, 41p.<br />
Swanson, V.E.<br />
1960: Oil yield <strong>and</strong> uranium content of black <strong>shale</strong>s;<br />
United States Geological Survey Professional Paper<br />
356-A, 44p.<br />
Telford, P.G.<br />
1976: Paleozoic <strong>Geology</strong> of the Woodstock-Gr<strong>and</strong> Bend area,<br />
southern <strong>Ontario</strong>; in Summary of Fieldwork, 1976 by<br />
the Geological Branch, V.G. Milne et al. eds.,<br />
<strong>Ontario</strong> Division of Mines, Miscellaneous Paper<br />
MP 67, p.156-158.<br />
1978: Silurian <strong>stratigraphy</strong> of the Niagara Escarpment,<br />
Niagara Falls to the Bruce Peninsula, <strong>Ontario</strong>;<br />
Toronto '78 Field Trip Guidebook, edited by A.L.<br />
Currie <strong>and</strong> W.O. Mackasey, Geological Society of<br />
America - Geological Association of Canada -<br />
Mineralogical Association of Canada, Annual Meeting,<br />
p.28-42.<br />
1979: Devonian conodont distribution - provinces or<br />
communities?; in Historical Biogeography, Plate<br />
tectonics, <strong>and</strong> the Changing Environment, Gray, J.,<br />
<strong>and</strong> Boucot, A.J. (editors), Oregon State University,<br />
p.201-213.<br />
Telford, P.G. <strong>and</strong> Hamblin, A.P.<br />
1980: Paleozoic <strong>Geology</strong> of the Simcoe Area, Southern<br />
<strong>Ontario</strong>; <strong>Ontario</strong> Geological Survey, Preliminary Map<br />
P.2234, <strong>Geology</strong> Series, scale 1:50 000, <strong>Geology</strong><br />
1975, 1976.
118<br />
Telford, P.G., <strong>and</strong> Johnson, M.D.<br />
1984: Paleozoic <strong>Geology</strong> of Southwestern <strong>Ontario</strong>;<br />
Geological Association of Canada - Mineralogical<br />
Association of Canada Field Trip Guidebook #1, 45p.<br />
Telford, P.G. <strong>and</strong> Tarrant, G.A.<br />
1975a: Paleozoic <strong>Geology</strong> of the Well<strong>and</strong> - Fort Erie area,<br />
southern <strong>Ontario</strong>; <strong>Ontario</strong> Division of Mines,<br />
Preliminary Map P.989, Geological Series, scale<br />
1:50 000, <strong>Geology</strong> 1974.<br />
1975b: Paleozoic geology of Dunnville area, southern<br />
<strong>Ontario</strong>; <strong>Ontario</strong> Division of Mines, Preliminary Map<br />
P.988, Geological Series, scale 1:50 000, <strong>Geology</strong><br />
1974.<br />
Telford, P.G., Russell, D.J., <strong>and</strong> Johnson, M.D.<br />
1984: Paleozoic <strong>stratigraphy</strong> nomenclature in the <strong>Ontario</strong><br />
portion of the Michigan Basin; Geological<br />
Association of Canada - Mineralogical Association of<br />
Canada, Program with Abstracts, Vol. 9, p.110.<br />
Tissot, B., <strong>and</strong> Welte, D.<br />
1978: Petroleum Formation <strong>and</strong> occurrence; Springer- Verlag<br />
Publishers, Berlin-New York, 538p.<br />
Tuffnell, P., <strong>and</strong> Ludvigsen, R.<br />
1984: The trilobite Triarthrus in the Whitby Formation<br />
(Upper Ordovician) of southern <strong>Ontario</strong> <strong>and</strong> a<br />
biostratigraphical framework; <strong>Ontario</strong> Geological<br />
Survey, Open File Report 5516, 55p.<br />
Turekian, K.K., Wedepohl, K.H.<br />
1961: Distribution of the elements in some major units of<br />
the Earth's crust; Geological Society of America,<br />
Bulletin, Vol. 72, p.175-191.<br />
Uyeno, T.T., Telford, P.G., <strong>and</strong> Sanford, B.V.<br />
1982: Devonian conodonts <strong>and</strong> <strong>stratigraphy</strong> of southwestern<br />
<strong>Ontario</strong>; Geological Survey of Canada Bulletin 322,<br />
55p.<br />
VanTyne, A.M. <strong>and</strong> Peterson, J.C.<br />
1978: Thickness, extent of, <strong>and</strong> gas occurrence in Upper<br />
<strong>and</strong> Middle Devonian black <strong>shale</strong>s of New York; in<br />
United States Department of Energy, Second Eastern<br />
Gas Shale Symposium, Vol. l, p.99-129.
119<br />
Vanuxem, L.<br />
1840: Fourth Annual Report to the Geological Survey of the<br />
Third District; New York Geological Survey Annual<br />
Report 4, p.355-383.<br />
Vine, J., <strong>and</strong> Tourtelot, E.<br />
1970: Geochemistry of black <strong>shale</strong> deposits - a summary<br />
report; Economic <strong>Geology</strong>, Vol. 65, p.253-272.<br />
Wedepohl, K.H. (ed.)<br />
1969: "H<strong>and</strong>book of Geochemistry", Springer-Verlay, New<br />
York.<br />
Williams, D.A., <strong>and</strong> Rae, A.M.<br />
1983: Paleozoic geology of the Ottawa-St. Lawrence<br />
Lowl<strong>and</strong>, southern <strong>Ontario</strong>, p.107-110, in Summary of<br />
Field Work, 1983, by the <strong>Ontario</strong> Geological Survey,<br />
edited by John Wood, Owen L. White, R.B. Barlow, <strong>and</strong><br />
A.C. Colvine, <strong>Ontario</strong> Geological Survey,<br />
Miscellaneous Paper 116, 235p.<br />
Williams, D.A., <strong>and</strong> Wolf, R.R.<br />
1982: Paleozoic geology of the northern part of Ottawa-St.<br />
Lawrence Lowl<strong>and</strong>, southern <strong>Ontario</strong>, p.132-134; in<br />
Summary of Field Work, 1982, by the <strong>Ontario</strong><br />
Geological Survey, edited by John Wood,<br />
Owen L. White, R.R. Barlow, <strong>and</strong> A.C. Colvine,<br />
<strong>Ontario</strong> Geological Survey, Miscellaneous Paper 106,<br />
235p.<br />
Williams, D.A., Rae, A.M., <strong>and</strong> Wolf, R.R.<br />
1984: Paleozoic geology of the Ottawa area, southern<br />
<strong>Ontario</strong>; <strong>Ontario</strong> Geological Survey, Preliminary Map<br />
P.2716, <strong>Geology</strong> 1982.<br />
Winder, C.G., <strong>and</strong> Sanford, B.V.<br />
1972: Stratigraphy <strong>and</strong> paleontology of the Paleozoic rocks<br />
of southern <strong>Ontario</strong>; Excursion A45-C45 (Guidebook)<br />
24th Session, International <strong>Geology</strong> Conference,<br />
Montreal, Quebec.<br />
Winder, C.G., Barnes, C.R., Telford, P.G., <strong>and</strong> Uyeno, T.T.<br />
1975: Ordovician <strong>and</strong> Devonian <strong>stratigraphy</strong> <strong>and</strong> conodont<br />
bio<strong>stratigraphy</strong> of southern <strong>Ontario</strong>; in Field<br />
Excursions Guidebook, Part B: Phanerozoic <strong>Geology</strong>,<br />
P.G. Telford (editor), Geological Association of<br />
Canada, Waterloo, Canada, p.119-160.
120<br />
Wolf, R.R.<br />
1985: Paleozoic <strong>Geology</strong> of Cockburn Isl<strong>and</strong>, District of<br />
Manitoulin; in Summary of Field Work <strong>and</strong> other<br />
Activities 1985, by the <strong>Ontario</strong> Geological Survey,<br />
p.155-158, edited by J. Wood, O.L. White, R.B.<br />
Barlow, <strong>and</strong> A.C. Colvine, <strong>Ontario</strong> Geological Survey,<br />
Miscellaneous Paper 126, 351p.
121<br />
APPENDIX I<br />
- Organic Geochemical Techniques<br />
Page<br />
A. 1.1 Introduction ... . . . . . . . . . . . . . . . . . . . . . . . . . . . . . . . . 122<br />
A.l.2 Total organic carbon ........ . . . . . . . . . . . . . . . . . . . 125<br />
A.l.3 Fischer assay ................................ . . 128<br />
A.l.4 Bitumen <strong>and</strong> kerogen isolation . . . . . . . . . . . . . . . . . . 129<br />
A.1.5 Ash content of kerogen ..................... . . . . 130<br />
A.1.6 Whole rock analysis ........ . . .... . . .. . . . .. . . ... 130<br />
A.1.7 Rock-Eval analysis .......................... . . . 135
122<br />
A. 1.1 INTRODUCTION<br />
Geochemical analyses of <strong>oil</strong> <strong>shale</strong>s have been undertaken<br />
to evaluate their <strong>potential</strong> as a source of petroleum products<br />
<strong>and</strong> to assist in the geological studies into the factors<br />
controlling their <strong>potential</strong>. Oil <strong>shale</strong>s are not clearly<br />
defined (Tissot <strong>and</strong> Welte 1978; Macauley et al. 1985). They<br />
are sedimentary rocks which contain organic matter sufficient<br />
to produce petroleum products in economic amounts when heated<br />
without the presence of oxygen. This heating or retorting<br />
without oxygen is a form of pyrolysis. Organic-rich<br />
sedimentary rocks may be combusted in oxygen or air to yield<br />
heat <strong>and</strong> may have value for other processing, but these<br />
aspects are beyond the scope of this geochemical study. The<br />
current evaluation has stressed their <strong>potential</strong> as a source of<br />
crude petroleum products.<br />
The petroleum product yield, both specific products <strong>and</strong><br />
amounts, depends upon the commercial process used. It also<br />
depends upon the organic matter content <strong>and</strong> type of organic<br />
matter present <strong>and</strong> in the rock-factors controlling its<br />
"richness". This richness <strong>and</strong> geological/geochemical control<br />
of richness is being evaluated by geochemical analyses of rock<br />
samples. These analyses can be grouped<br />
into three categories:<br />
1. Pyrolysis yield<br />
The st<strong>and</strong>ard assay for yield upon retorting pyrolysis is<br />
the Fischer Assay. This analysis requires large (200 g)
123<br />
samples <strong>and</strong> is relatively expensive. However, a large Fischer<br />
Assay data base exists for many <strong>oil</strong> <strong>shale</strong>s. Retorting with a<br />
hydrogen atmosphere can enhance yields <strong>and</strong> this possibly was<br />
evaluated by Hytort (R) retorting.<br />
2. Organic matter content<br />
The organic matter content of specific samples has been<br />
assessed by measurement of their total organic carbon (TOC)<br />
content. Carbon makes up from 60 to 90 weight percent of<br />
sedimentary organic matter. For formations of limited depth<br />
<strong>and</strong> areal extent containing a similar type of organic matter -<br />
the case for <strong>Ontario</strong>'s <strong>potential</strong> <strong>oil</strong> <strong>shale</strong>s - the weight<br />
percent carbon is much more limited <strong>and</strong> TOC accurately<br />
assesses the organic matter content.<br />
3. Organic matter geochemistry<br />
The pyrolysis yield of <strong>oil</strong> <strong>shale</strong>s also depends upon the<br />
chemistry of the organic matter. Hydrogen-rich organic matter<br />
yields more petroleum-like pyrolysis products, termed<br />
pyrolysates, than hydrogen-poor organic matter. Pyrolysis<br />
yields seem to be limited more by organic hydrogen than by<br />
organic carbon content. Thus, the nature of the organic<br />
matter must be assessed in the evaluation of this resource.<br />
These studies also assist in the determination of geological<br />
controls of <strong>oil</strong> <strong>shale</strong> richness.<br />
Organic matter in sedimentary rocks is operationally<br />
divided into solvent-soluble bitumen <strong>and</strong> solvent-insoluble<br />
kerogen. The former more closely approaches the composition<br />
of crude <strong>oil</strong>s, being relatively enriched in hydrogen, <strong>and</strong> it
124<br />
is generally considered to be derived from the thermal<br />
maturation of kerogen. The amount of bitumen generated<br />
increases as the hydrogen-richness of the initially-deposited<br />
organic matter increases <strong>and</strong> its relative proportion to<br />
kerogen increases with maturation level. By definition, all<br />
<strong>oil</strong> <strong>shale</strong>s contain indigenous organic matter (kerogen) at low<br />
to intermediate thermal maturation levels.<br />
The organic matter geochemistry is assessed by a number<br />
of techniques. Temperature-programmed pyrolysis, including<br />
Rock-Eval analysis, permits estimates of the bitumen/kerogen<br />
proportion <strong>and</strong> gas chromatography/mass spectrometry of the<br />
pyrolysates helps characterize the chemistry of these factors.<br />
The origin <strong>and</strong> thermal maturation level of kerogen is assessed<br />
by elemental analysis, infrared spectroscopy <strong>and</strong> stable carbon<br />
isotopic (13C/12C) analyses.<br />
The depositional environment of these organic-rich rocks<br />
is partially assessed by geochemical analyses. Parameters<br />
determined include carbonate content (as total inorganic<br />
carbon or TIC), total sulphur content, phosphorous content (as<br />
P2O5), <strong>and</strong> stable carbonate isotope analyses of the carbonate<br />
minerals.<br />
This comprehensive suite of geochemical analyses provides<br />
the geochemical basis for the evaluation of this <strong>oil</strong> <strong>shale</strong><br />
resource. Adequate evaluation, however, requires the<br />
integration of this data with geological, engineering <strong>and</strong><br />
economic studies.
125<br />
A. 1.2 TOTAL ORGANIC CARBON (TOC)<br />
The following description is taken from Churcher (1984)<br />
<strong>and</strong> Churcher <strong>and</strong> Dickhout (1987). About 0.2 to 0.5 gram,<br />
finely crushed ^200 mesh) rock samples are weighed onto glass<br />
microfibre filter papers. The filter papers are placed on<br />
Hirsch funnels <strong>and</strong> the samples acidified with warm 30% HC1 <strong>and</strong><br />
then thoroughly washed with deionized water. Bituminous<br />
samples are wetted with a drop of methanol prior to<br />
acidification. The inorganic-carbon-free sample contained<br />
inside the filter paper is dried <strong>and</strong> then combusted at about<br />
800lC in a Lindburg tube furnace. The combustion products are<br />
swept with CO2-free oxygen through a water sorban l (Drierite)<br />
<strong>and</strong> then into a Beckman non-dispersive infrared detector where<br />
the CO2 from combustion of organic matter is detected.<br />
Quantification is accomplished by comparing the area of the<br />
CO2 peak from sample combustion to that of gravimetrically<br />
prepared charcoal-pumice st<strong>and</strong>ards. This calibration of the<br />
detector response is made daily. In addition, two homogeneous<br />
"in house" st<strong>and</strong>ards are prepared from the Kettle Point<br />
Formation material are analyzed frequently to confirm<br />
reproducibility. These st<strong>and</strong>ards <strong>and</strong> other st<strong>and</strong>ards were<br />
analyzed by other laboratories <strong>and</strong> the agreement with our<br />
results is very good (see Table 13 from Churcher 1984).<br />
Churcher (1984) evaluated the major sources of bias in this<br />
analysis, especially the <strong>potential</strong> loss of organic matter
126<br />
during acidification <strong>and</strong> methanol addition as well as the<br />
<strong>potential</strong> addition of carbon via the methanol. No significant<br />
bias was documented. For the major "in house" st<strong>and</strong>ards<br />
analyzed from 8 to 39 times the relative st<strong>and</strong>ard deviation<br />
was always less than S.5% <strong>and</strong> the mean differed from the<br />
average value reported by all other labs by less than S.4%<br />
except for CLGD-Composite where a difference of about 12% was<br />
found (see Table 13). We therefore feel the TOG analyses are<br />
generally accurate <strong>and</strong> reproducible to within about 5% over<br />
the TOG concentration range of 4% to 15%. Poorer accuracy <strong>and</strong><br />
precision may occur at lower concentrations, but accuracy at<br />
these lower concentrations is of less significance in<br />
evaluating these <strong>potential</strong> <strong>oil</strong> <strong>shale</strong>s.
127<br />
w EH<br />
Z<br />
W<br />
2<br />
o<br />
Q<br />
O<br />
f-t<br />
w<br />
s<br />
en<br />
X -C<br />
H O*<br />
1 -H<br />
(X X<br />
en<br />
x<br />
M 3<br />
A3<br />
tt<br />
rH<br />
1<br />
JH<br />
en<br />
T3 *0<br />
-H d)<br />
0 A<br />
a u)<br />
1 (0<br />
r*4 5<br />
O<br />
^4<br />
0<br />
•o<br />
•H<br />
O t3<br />
a d)<br />
i x:<br />
Q CO<br />
Sg<br />
o<br />
d)<br />
-P<br />
-H<br />
1 W<br />
o<br />
O Q.<br />
o e<br />
J 0<br />
o o<br />
^<br />
M CO<br />
O-H<br />
4-1 CO<br />
0 ^t<br />
U rH<br />
o a<br />
a c<br />
S*<br />
c<br />
o<br />
W-H<br />
d) -P<br />
P (O<br />
IM U<br />
(8 -H IM<br />
U-H<br />
O 73<br />
EH -H<br />
O(0<br />
CM<br />
O rH<br />
Sri<br />
di CM<br />
i-3 s<br />
i<br />
CO<br />
o<br />
1<br />
1<br />
1<br />
1<br />
Tj"<br />
.<br />
CO<br />
(4<br />
d)<br />
A *<br />
P C<br />
C fl<br />
3 0<br />
O<br />
O<br />
rH 14<br />
3 4J<br />
(Q d)<br />
•K<br />
C<br />
rH O<br />
rtJ XJ<br />
O (0<br />
EH U<br />
rH<br />
(0 CO<br />
-P -H<br />
C CO<br />
d) ^<br />
SrH<br />
d) (Q<br />
rH C<br />
U *<br />
f<br />
CM<br />
rH<br />
Tj"<br />
O<br />
1<br />
p*<br />
.<br />
in<br />
c^<br />
i<br />
CM O<br />
* .<br />
VO P*<br />
^*<br />
CO<br />
o<br />
-p<br />
^ vo<br />
. .<br />
CM CO<br />
C<br />
o o*<br />
•P C<br />
3 W<br />
(0<br />
Z rH<br />
(O<br />
S -0<br />
d) -H<br />
IM c s<br />
0 rH d)<br />
•H x;<br />
D S U<br />
C 0 C<br />
0<br />
•H -H<br />
tt ^J Ij 1^<br />
d) to d) (0<br />
•PU PU -K<br />
IM .H IM -H C<br />
(O IM (0 (M rH O<br />
•H -H (0 XJ<br />
O T3 O T3 P W<br />
O -H O -H O (0<br />
EH O EH O EH O<br />
(Q (0<br />
.M.<br />
C<br />
O rH<br />
d) -H (0 (0<br />
p 4J P -H<br />
•H a c co<br />
M CMVt CM d) ?1<br />
(0 O O O rH g rH<br />
U U CO U l 0) Q<br />
CO ^^ *O (U Dfi ^^ C<br />
irf ,rf ^j 3E b) (^<br />
t 1<br />
1<br />
oo at<br />
1<br />
at at<br />
l l l<br />
i i i<br />
i i i<br />
t i i<br />
CM<br />
1 - 1<br />
ea (0<br />
d) to<br />
o x<br />
PC to d)<br />
3d) XI EH<br />
O -H (B<br />
xj o -4 -<br />
x en c<br />
so -o<br />
•H x: M SP<br />
(MOP (0 '(O<br />
O M O* X 3<br />
. (0 (0 .Q<br />
^Z) 05 &1 3C St 3C<br />
i j.)<br />
a)<br />
c a<br />
1 -H fl<br />
P a<br />
3 -O<br />
1 O 0) CO<br />
1 C -H<br />
w -H x;<br />
< rH p<br />
CO<br />
p* in CM<br />
CM CM O<br />
rH rH<br />
CM<br />
VO VO CM<br />
Ot O O<br />
d)<br />
rH (0 CM in in<br />
XI 3 0 00<br />
(0 rH .<br />
U) (Q O O O<br />
3 ?- II<br />
CM<br />
P- P* O\<br />
* * t<br />
in *r o<br />
rH rH<br />
CO<br />
VO P- CM<br />
VO VO O<br />
rH<br />
•* in in<br />
CO CO O<br />
P* CM<br />
co at CM<br />
CO CO O<br />
1<br />
o<br />
d) -^<br />
a ^ ' c<br />
MS T3 O<br />
d) OP* M -H<br />
CT -H CO D (OP<br />
(0 C -H ^ T3 (8<br />
M fl S C C -H<br />
d) O* d) X) H3 KJ ><br />
> M x: (Q d) P d)<br />
^ O O J Z CO Q<br />
at<br />
*<br />
CM<br />
rH<br />
1<br />
O *<br />
CM CO<br />
H<br />
aṭ<br />
at i<br />
rH Ot<br />
at<br />
,<br />
i- P*<br />
rH Ot<br />
O O<br />
tt * fO<br />
O 0<br />
in .<br />
in<br />
rH<br />
i<br />
rH<br />
' CM<br />
TT<br />
rH<br />
O<br />
.<br />
P*<br />
1<br />
co at<br />
. rH<br />
VO<br />
at *<br />
CO<br />
l<br />
O CO<br />
.<br />
CO<br />
^*<br />
*J"<br />
1 p*<br />
VO Tf<br />
.<br />
CO<br />
CO<br />
d)<br />
rH<br />
a<br />
3<br />
(0<br />
CO<br />
IM<br />
d) O<br />
^y\<br />
c<br />
(0 O<br />
B Z<br />
VO ^f<br />
* t<br />
O O<br />
rH O<br />
* *<br />
P* P*<br />
TT<br />
II II rH<br />
P* * .<br />
VO O<br />
rH II<br />
tt<br />
o x:<br />
fj o*<br />
Q II -H<br />
J M x:<br />
CJ O 1<br />
? en<br />
ox<br />
CO rH H<br />
d) 1 04<br />
3 CO tt<br />
rH<br />
(Q<br />
^<br />
U<br />
M<br />
E"<br />
O<br />
••H<br />
C (0<br />
v7JiT3<br />
M C<br />
O rtJ<br />
C<br />
•H U<br />
0)<br />
fl) IH<br />
P (0<br />
o m<br />
p c<br />
IM -H<br />
O<br />
C 0)<br />
o c<br />
H -H<br />
P rH<br />
O P<br />
10 3<br />
lH O<br />
P<br />
Q T3<br />
3 O<br />
co x:<br />
P<br />
d) o)<br />
x: s<br />
P<br />
suit<br />
X)<br />
T3<br />
•O d)<br />
d) C<br />
C -H<br />
•H 03<br />
a P<br />
P XI -<br />
XI 0 ~<br />
O CM<br />
—— CO<br />
CJ O 01<br />
P H rH<br />
N.^<br />
!M C<br />
O C d)<br />
O P<br />
CO X) P<br />
d) M (0<br />
3 (C x:<br />
rH O O<br />
(0<br />
t<br />
00<br />
at<br />
rH<br />
d)<br />
x:<br />
v-i<br />
o<br />
3<br />
x:<br />
u<br />
s<br />
o<br />
(^<br />
IM<br />
^"<br />
CO<br />
d)<br />
•H<br />
M<br />
O<br />
P<br />
(O<br />
j.)<br />
0<br />
xt<br />
t-j<br />
^<br />
d)<br />
A<br />
PO<br />
T3<br />
C(0<br />
s"<br />
3<br />
•~*<br />
^<br />
V4<br />
4J<br />
Ul<br />
•H<br />
g<br />
0)<br />
x:<br />
o<br />
d)<br />
CP<br />
o<br />
•H<br />
C<br />
(0<br />
CT<br />
J.4<br />
o<br />
g o<br />
)b4<br />
'M<br />
CO<br />
rH<br />
3ea<br />
d)<br />
O<br />
g<br />
IM<br />
O<br />
C<br />
O<br />
CO<br />
•H<br />
(0<br />
a<br />
e o<br />
u<br />
i<br />
ro<br />
H<br />
u<br />
J<br />
CO<br />
g
128<br />
A. 1.3 FISCHER ASSAY (FA)<br />
The st<strong>and</strong>ard method for evaluating the <strong>oil</strong> yield upon<br />
retorting <strong>oil</strong> <strong>shale</strong>s is the Fischer Assay. The technique is<br />
described by Hubbard (1965). All analyses were performed by<br />
the Analytical Services Laboratory (L.C. Cox, Manager),<br />
Colorado School of Mines Research Institute, P.O. Box 112,<br />
Golden, Colorado. One hundred grains of less than 8 mesh <strong>shale</strong><br />
chips are added to the retort in five layers to promote<br />
effective pyrolysis. The retort is heated without air entry<br />
to 500 0C over 40 minures <strong>and</strong> held at 500 OC for 20 minutes.<br />
The pyrolysate is collected in an attached receiver held<br />
between 0 OC <strong>and</strong> 37.8 OC. The volume <strong>and</strong> weight of condensate<br />
(<strong>oil</strong> plus water) is determined <strong>and</strong>, if sufficient <strong>oil</strong> is<br />
present, its specific gravity is determined. The volumes of<br />
<strong>oil</strong> <strong>and</strong> water produced are converted to units of US gallons<br />
per ton or litres per metric ton. Unaccounted sample weight<br />
loss (or gain) is also reported <strong>and</strong> the difference, if a loss,<br />
is usually attributed to the generation of uncondensed gases.<br />
Hubbard (1965) reports that <strong>oil</strong> yields for an <strong>oil</strong> <strong>shale</strong> with a<br />
mean <strong>oil</strong> yield of 39.5 gallons per ton had a range from 38.3<br />
to 40.2 or within 3% for twelve replicate analyses. Water <strong>and</strong><br />
<strong>oil</strong> specific gravity showed a similar small range of values.
129<br />
A. 1.4 BITUMEN AND KEROGEN ISOLATION<br />
Solvent Extraction for Bitumen Isolation<br />
After experimenting unsuccessfully with a rapid<br />
chloroform extraction of bitumen, a regular soxhlet extraction<br />
procedure was employed. This involves the continuous<br />
extraction of rock by chloroform over a 12 to 14 hour period.<br />
The chloroform reservoir is heated, the chloroform vapours<br />
condensed <strong>and</strong> recirculated through the rock powder (greater<br />
than 200 mesh). The chloroform is then concentrated to about<br />
3<br />
l cm by evaporation in a modified Kuderna-Danish<br />
concentrator. This procedure extracts the chloroform-soluble<br />
organics (bitumen) <strong>and</strong> retains those less volatile than<br />
chloroform which has a b<strong>oil</strong>ing point of about 62 C.<br />
Kerogen Isolation<br />
Initially, powdered (less than 100 mesh) rock samples<br />
were alternately digested in 50% HC1 <strong>and</strong> 50% HF to remove<br />
inorganic mineral matter. The kerogen was further purified<br />
from inorganically contaminated kerogen by density difference<br />
in a ZnC12 solution in which the purest kerogen rose to near<br />
the top of the solution. This procedure was found to leave up<br />
to 37% inorganic material in the kerogen. Subsequent kerogen<br />
isolations involved initial soxhlet extraction with chloroform<br />
to remove bitumen, followed by leaching with concentrated HC1<br />
<strong>and</strong> HF to remove inorganic minerals. The acid-leaching was
130<br />
repeated once. The kerogen concentrate was repeatedly rinsed<br />
with deionized water, separated by centrifugation with the<br />
final wet isolate allowed to dry at room temperature before<br />
storage over a desiccant (Drierite). Generally, the kerogen<br />
was found to contain less than 2C^ inorganic impurities.<br />
This kerogen was then subjected to various geochemical<br />
analyses including ash content, elemental carbon <strong>and</strong> hydrogen<br />
analysis, pyrolysis <strong>and</strong> infrared absorption studies.<br />
A. 1.5 ASH CONTENT OF KEROGEN<br />
The kerogen extract is heated to about 80 OC <strong>and</strong> cooled in<br />
a water vapour free container. An aliquiot of about 0.1 gram<br />
is then weighed, combusted at 600 O C for l hour, cooled <strong>and</strong><br />
reweighed. The residual material is taken as inorganic ash.<br />
A. 1.6 WHOLE ROCK ANALYSIS<br />
Approximately 10 mg of pulverized whole rock powder is<br />
placed in the quartz tube of an Envirochem model 787 high<br />
temperature furnace. The sample is purged with helium for a<br />
few minutes, then heated from ambient temperature to 300 OC at<br />
4O 0 min <strong>and</strong> held at the final temperature until the signal<br />
from an FID detector monitoring the evolution of hydrocarbons<br />
has returned to the baseline. At this point the hot zone is<br />
removed from the sample, the pyrolysis products having been<br />
collected on a tenax trap.
131<br />
With the completion of the cycle, the tenax is thermally<br />
desorbed, <strong>and</strong> a small fraction of the products split to a<br />
flame ionization detector to produce a "bitumen, total<br />
hydrocarbon" peak. The rest is transferred onto a narrower<br />
bore trap for subsequent desorption onto a 60 m DBS quartz<br />
capillary column for chromatography. Here the individual<br />
hydrocarbon components are resolved before detection by an FID<br />
detector. Pyrolysis components are identified on the basis of<br />
retention time determined with pure st<strong>and</strong>ards.<br />
The hot zone of the high temperature furnace is then<br />
repositioned over the sample <strong>and</strong> heating is resumed at the<br />
previous rate up to 700 OC. This results in the thermal<br />
breakdown of kerogen, the products of which are h<strong>and</strong>led in the<br />
same way as those of bitumen. The initial split to an FID<br />
detector generates a "kerogen, total hydrocarbon" peak <strong>and</strong> the<br />
kerogen pyrolysate chromatography carried out as with the<br />
bitumen pyrolysate.<br />
The chromotograph uses, in both cases, a 60 m DBS column,<br />
heated from 35 to 280 OC at a rate of 8 oC7min <strong>and</strong> held at 280 0 C<br />
for 10 min.<br />
The following parameters are determined from the<br />
chromatograms.
132<br />
Transformation Ratio<br />
The transformation ratio is defined as bitumen/<br />
bitumen+kerogen <strong>and</strong> is obtained from the total hydro<br />
carbon responses (bitumen, total hydrocarbon/(bitumen,<br />
total hydrocarbon plus kerogen, total hydrocarbon)). It<br />
is an indicator of thermal maturation, i.e. maturity is<br />
greater with increasing value.<br />
Pristane/phytane Ratio<br />
The peak areas of these two isoprenoid compounds are<br />
obtained from the bitumen pyrochromatogram. The<br />
pristane/phytane ratio is commonly used to indicate the<br />
lacustrine/terrestrial nature of the original organic ma<br />
terial. Generally, ratios lower than 1.5 indicate a<br />
marine <strong>shale</strong>-carbonate sequence while ratios greater than<br />
3.0 indicate a significant amount of terrestrial source<br />
material. This ratio can be affected by depositional<br />
environment (i.e. whether the environment<br />
was oxidizing or reducing <strong>and</strong> by maturation).<br />
Odd-even Preference (PEP)<br />
The predominance of odd or even n-alkanes is determined<br />
by summing the peak areas on odd <strong>and</strong> even n-alkanes in<br />
the bitumen pyrochromatogram. The CI6 to C20 n-alkanes<br />
are examined <strong>and</strong> the ratio established according to the<br />
method of Scalan <strong>and</strong> Smith (1970).
133<br />
4. p—m-xylene/n-octene Ratio<br />
This ratio is calculated from the areas of the<br />
appropriate compound peaks on the kerogen<br />
pyrochromatogram. It defines the aromaticity of the<br />
kerogen <strong>and</strong> serves as an indicator of source material<br />
type according to the classification scheme of Larter <strong>and</strong><br />
Douglas (1978). The scheme is defined as follows:<br />
Kerogen Type Ratio Value<br />
type I: alignites; R < 0.4<br />
type II: sporinites; 0.4 < R ^.3<br />
type III: vitrinites; R > 1.3<br />
For quality control purposes, four samples of Collingwood<br />
Formation from borehole CLGD-4 at a depth of 70.31 to 70.41 m<br />
were pyrolyzed <strong>and</strong> the bitumen pyrolysate (room temperature to<br />
300 C) analyzed by gas chromatography. The values of various<br />
geochemical parameters calculated from the chromatgram are<br />
shown in Table 14. Interpretation of the results must<br />
consider the 9 to 24% st<strong>and</strong>ard deviations observed for these<br />
replicate analyses.
134<br />
Table 14.<br />
Analyses from a Collingwood sample-Bitumen<br />
Pyrolysate.<br />
Parameter<br />
Replicates<br />
1<br />
2<br />
3<br />
4<br />
CPI OEP PR/PH PR/C17 PB/C18<br />
1.06<br />
0.882<br />
0.954<br />
0.868<br />
1.03<br />
0.847<br />
0.943<br />
0.864<br />
1.44<br />
1.48<br />
1.27<br />
0.831<br />
1.36<br />
1.30<br />
1.08<br />
0.978<br />
0.991<br />
0.811<br />
0.900<br />
0.935<br />
Mean 0.941 0.906 1.26 1.18 0.912<br />
St<strong>and</strong>ard<br />
Deviation, S 0.088 0.101 0.297 0.180 0.075<br />
S as % of<br />
Mean 9.35% 11.0% 23.6% 15.3% S.22%
135<br />
A. 1.7 ROCK-EVAL ANALYSIS<br />
Rock-Eval whole-rock pyrolysis was conducted by the<br />
Institute of Sedimentary <strong>and</strong> Petroleum <strong>Geology</strong> (I.S.P.G.),<br />
Calgary. The technique, developed by Espatalie, et al.<br />
(1977), is described in Tissot <strong>and</strong> Welte (1978). It involves<br />
heating a finely crushed rock powder progressively to 500lC<br />
<strong>and</strong> measuring evolved hydrocarbons. Hydrocarbons evolve in<br />
two stages; those already present in the rock in a free state,<br />
or bitumen components, evolve at 200 to 250 OC <strong>and</strong> are defined<br />
as SI yield. The pyrolysis of kerogen occurs at higher<br />
temperatures (400 to 500 OC) <strong>and</strong> generates second stage<br />
hydrocarbons terms S2 yield. Oxygen-containing volatiles,<br />
namely CO2 <strong>and</strong> water, derived from oxygen-containing kerogen<br />
structures evolve at high temperatures <strong>and</strong> are known as S3<br />
yield. Figure 14 depicts a recorded pyrolysis sequence <strong>and</strong><br />
additional information that can be obtained from the<br />
pyrolysis.<br />
In viewing information obtained from the pyrolysis, it is<br />
useful to consider that bitumen is a product of thermally<br />
matured kerogen. Therefore, the amount of bitumen (SI) can be<br />
considered the "bitumen show" of the rock. The ratio of<br />
bitumen to bitumen plus kerogen represents the amount of<br />
thermal maturation endured, <strong>and</strong> a transformation ratio<br />
[(SI/(SI -i- S2) J can therefore be used as a maturation<br />
indicator. Tmax, the temperature of maximum hydrocarbon<br />
generation, is also indicative of thermal maturation.
136<br />
ROCK-EVAL PYROLYSIS<br />
COOLING<br />
Information obtained for this study:<br />
SI- <strong>oil</strong> or gas show (kg./ton rock)<br />
S1/S1+S2- transformation ratio<br />
Tmax.- temperature of Biaximun hydrocarbon generation<br />
( 0 C)<br />
S1+S2- petroleum <strong>potential</strong> (kg./ton rock)<br />
S2/TOC- hydrogen index (mg. yield/g. TOC)<br />
S3/TOC- oxygen index (rng. yield/g. TOC)<br />
Fig. 14. Rock-Eval pyrolysis cycle <strong>and</strong> typical detector<br />
response (from Sacheli 1985).
137<br />
Tissot <strong>and</strong> Welte (1978) indicate that the Tmax. increases<br />
progressively with maturation, but numerical scaling is<br />
dependent on the rate of pyrolysis heating. Tmax can be<br />
correlated with other maturation indicators such as vitrinite<br />
reflectance (Tissot <strong>and</strong> Welte 1978). The petroleum <strong>potential</strong><br />
(S +S.) reflects the overall organic richness of the <strong>shale</strong>.<br />
Samples with high petroleum <strong>potential</strong> are rich in bitumen<br />
<strong>and</strong>/or kerogen or both.<br />
Kerogen typing can also be performed by Rock-Eval<br />
pyrolysis using hydrogen <strong>and</strong> oxygen indices, which are<br />
calculated by S^/TOC <strong>and</strong> S /TOC respectively. A modified Van<br />
M J<br />
Krevelen diagram can be constructed to determine organic<br />
matter type. Espatalie, et al. (1977) discusses the<br />
correlation between Rock-Eval calculated indices <strong>and</strong> elemental<br />
concentration in kerogens. Major limitations of Rock-Eval<br />
kerogen typing are discussed by Snowdon (1984).
138<br />
APPENDIX 2<br />
INTEGRATED DRILLHOLE LOGS<br />
The following logs graphically display information for<br />
each of the OGS boreholes drilled into or immediately adjacent<br />
to the Marcellus Formation. Of the 6 holes included (M-5 to<br />
M-9, <strong>and</strong> OGS-82-3), 4 intersected Marcellus (M-5, M-6, M-8 <strong>and</strong><br />
OGS-82-3). Detailed description of each at the 6 holes has<br />
already been released (see Johnson 1985, Johnson et al. 1985).<br />
The lithology log presented here is quite general <strong>and</strong> intended<br />
to indicate gross lithological units. Geophysical logs were<br />
made in some of the holes but not all, depending on whether or<br />
not Marcellus was intersected (i.e. no logs for M-7 <strong>and</strong> M-9)<br />
or for reasons connected with the drilling (i.e. the logs<br />
start too low to pick up the Marcellus in OGS-82-3).
•.••••••r MBMMB fl<br />
139<br />
INTEGRATED BORE HOLE DATA SHEET : M-5<br />
L ocation : County : Norfolk Township : Htlderwood<br />
Lot 1, Cone. 9 Elevation : 1 09.26m (asl.)<br />
T<br />
i a<br />
w<br />
0<br />
106<br />
107<br />
108-<br />
GEOLOGICAL<br />
FORMATION LITH<br />
-IHI-G-<br />
Bell<br />
-Ir-iHIr-I<br />
GEOPHVSICAL<br />
GAMMA R. FOG. E<br />
l A P J ' "<br />
Ui-m<br />
J 200 0 1<br />
x<br />
l<br />
'<br />
x<br />
V<br />
1<br />
s<br />
s<br />
10*<br />
n<strong>oil</strong>l<br />
112<br />
Marcellus<br />
Dundee<br />
~^.r^j"^r<br />
^jZZ-EZ.<br />
i-iRi-i<br />
1 \<br />
j ' | E<br />
fx<br />
x<br />
i<br />
1<br />
**<br />
'<br />
,<br />
s<br />
'<br />
l1<br />
1<br />
L.<br />
,- % TOG<br />
00 J 10 15<br />
GEOCHEMICAL<br />
f<br />
x<br />
^<br />
s<br />
x<br />
s<br />
^<br />
y<br />
s<br />
1<br />
M<br />
1<br />
.^..<br />
('<br />
t<br />
s<br />
— - - .<br />
i..<br />
T<br />
\<br />
/<br />
X<br />
1<br />
::;.J<br />
^T<br />
^<br />
4<br />
1<br />
(<br />
1<br />
f<br />
1<br />
'<br />
113<br />
j i j i:<br />
•l<br />
' ><br />
V,<br />
^
140<br />
INTEGRATED BORE HOLE DATA SHEET : M-6<br />
Location: County :Norfolk Township : Houghton<br />
1<br />
l c<br />
93<br />
94<br />
95<br />
96<br />
97-<br />
98<br />
99<br />
Lot 1-2. Cone. 4 Elevation :194.89m(asl.)<br />
GEOLOGICAL G EOPHYSICAL l GEOCHEMICAL<br />
GAM MA R. FOG. EL. l<br />
(fkP " ta-m j 1 ?; * TOC 1U^<br />
FORMATION LITH A 20QH 20 Oi S1015<br />
ru-^j-^r<br />
Bell<br />
Marcellus<br />
Dundee<br />
SSss<br />
••t VMM* BMB OW<br />
•w W* BMMV WB*<br />
IM* BBBr aBH* BVM*<br />
r""~~ i~" V<br />
"-HLT" ""<br />
FS..PS..H<br />
t 11^ 11 ^<br />
y<br />
y<br />
y<br />
7<br />
/^<br />
x<br />
^<br />
V<br />
1<br />
V<br />
V<br />
/<br />
f<br />
1<br />
.<br />
~<br />
-<br />
1<br />
1<br />
—.<br />
'--,<br />
- - - .<br />
---*<br />
t f<br />
f<br />
\<br />
s<br />
\<br />
^ ^ ^<br />
' — -i -<br />
<<br />
i<br />
t<br />
4<br />
><br />
s ;<br />
)<br />
\<br />
(<br />
f<br />
7<br />
)<br />
^<br />
)<br />
1<br />
^<br />
"" 1<br />
;: —<br />
1<br />
i<br />
i<br />
i<br />
1(<br />
100'<br />
)<br />
s
141<br />
INTEGRATED BORE HOLE DATA SHEET : M - 7<br />
Location : County : Elgin Township : Bayham<br />
1<br />
a.<br />
tt<br />
O<br />
45<br />
Lot 6, Cone. Ill Elevation : lg o.75m (asl.)<br />
GEOLOGICAL<br />
FORMATION LITH<br />
GEOPHYSICAL<br />
GAMMA R. FOG. EL.<br />
( A f 1 J -<br />
0 300 0 1000<br />
!fc TOG<br />
* 1C 15<br />
GEOCHEMICAL<br />
46<br />
H<br />
47-<br />
overburden<br />
US<br />
lifl<br />
8!<br />
N(3 C;i•c )!M1Y S 1C:j i R U N<br />
48'<br />
49-<br />
8* ^<br />
* , T*<br />
. 1 . ' *<br />
—.^———~l——<br />
50<br />
51<br />
52<br />
Dundee<br />
' 1 ' -I<br />
Jm———BLMV.<br />
—-A-—-^l~m——*JL-i~<br />
.<br />
; i ' -<br />
±-——J—^<br />
1 . '<br />
^—.a..—.<br />
——.^.^.^L.<br />
i...^.—.<br />
' ' ' '<br />
1 . '<br />
—.^.^M^- '<br />
—^U^—ML^<br />
k.—^JiH—.<br />
...J.—.^..<br />
L.—.^.—.<br />
-.1^..^^—<br />
Lmm-m^———rm.<br />
..—L.——.-L—<br />
1 , '<br />
——u..^—<br />
1 . ' -,<br />
—ajH^^^A.<br />
' 1 ' 1<br />
' 1 1 j 1<br />
C^ZZZC^^<br />
1 . J<br />
^...^^••B<br />
1 ' 1 1 '<br />
' . ' ,<br />
1 . J<br />
1 '<br />
..Jbi.^ii^Aa<br />
1 . '<br />
1 . '<br />
' . '<br />
f——l~i.—^t~<br />
L.^—.^M.—<br />
' j ' '<br />
1 . ' 1<br />
1 . '<br />
m~ml———f^±m*<br />
' . '<br />
' . '<br />
1 . '<br />
r-^^—^^M<br />
1———L~-—<br />
1 . '<br />
1 . '<br />
;. ' . '<br />
! i ! i<br />
-
142<br />
INTEGRATED BORE HOLE DATA SHEET : M-8<br />
Location : County : Elgin Township ; Malahide<br />
Lot 26, Cone. 1 Elevation :204. 48m (asl.)<br />
GEOLOGICAL<br />
GEOPHYSICAL<br />
GEOCHEMICAL<br />
1<br />
l*r<br />
O<br />
83<br />
85-<br />
86'<br />
84-<br />
87-<br />
88<br />
89<br />
90<br />
FORMATION<br />
^:m<br />
LITH<br />
^•ffi -0.4&0<br />
overburden<br />
Jo'*VV. :<br />
-^Lir"^iL<br />
Marcellus<br />
Dundee<br />
I—I— Z—I:<br />
s-si-sE<br />
ffitO1!<br />
GAMMA R. FOG .EL.<br />
t A f' 1)<br />
% TOC<br />
tt.m l<br />
1000 si IB<br />
p 500 o<br />
{<br />
( s<br />
\<br />
<<br />
\<br />
(<br />
<<br />
(<br />
(<br />
><br />
><br />
s<br />
t<br />
/<br />
)<br />
^<br />
1<br />
S<br />
t<br />
\<br />
f<br />
;<br />
(<br />
\<br />
\<br />
\<br />
/<br />
5(<br />
\<br />
s<br />
/<br />
\<br />
s<br />
\<br />
f<br />
1\<br />
i<br />
\S<br />
j<br />
N, S<br />
::: ::<br />
"^.<br />
* ^<br />
rt*<br />
p<br />
j<br />
:<br />
t<br />
Peak<br />
f<br />
ix - J<br />
FE<br />
values<br />
7000<br />
6000<br />
6000<br />
3000
143<br />
INTEGRATED BORE HOLE DATA SHEET :M-B<br />
Location: County :Elgin Township : Dunwich<br />
I<br />
x<br />
c.<br />
0<br />
0<br />
10-<br />
Lot 24, Cone. 12<br />
Geological<br />
FORMATION<br />
LITH<br />
S<br />
Elevation : 177 .32 (as!.)<br />
Geophysical<br />
GAMMA R.<br />
FOG. EL.<br />
1 JOO 0 9QQ<br />
% TOG<br />
S<br />
10 IS<br />
Geochemical<br />
20-<br />
overburden<br />
y'ft&k<br />
r^.O^o<br />
NO GEOPHYSICS<br />
RUN<br />
30-<br />
n<br />
40-<br />
50-<br />
60'<br />
Dundee<br />
end of core<br />
. 1 . i<br />
1 , i<br />
-<br />
70-<br />
60
144<br />
INTEGRATED BORE HOLE DAT A SHEET- : DCS- 82 -3 Port Stanley 1 of 2<br />
Locition : County : Elgin Township lYarmouth<br />
Lot 9. Con. 1 Tritt 3 E levat ion : 21 1 .4m (isl.)<br />
|<br />
x<br />
a<br />
O<br />
86<br />
GEOLOGICAL<br />
FORMATION LITH<br />
GEOPHYSICAL<br />
GAMMA R. FOG. EL.<br />
?; TOC<br />
lAPl)<br />
(ft. m 1<br />
0 5OO 0 TOO 0 4 1 l*<br />
GEOCHEMICAL<br />
87<br />
88'<br />
T-"-<br />
NO GEOPHYSICS RU N<br />
89<br />
Bell<br />
90<br />
91<br />
•GOiiH<br />
~ "~ '"" *~<br />
-<br />
92<br />
I-LKHr<br />
lOs^<br />
93<br />
94<br />
^
145<br />
(ml DtpHi<br />
INTEGRATED BORE HOLE DATASHEET :OGS -12 - J Pon Stanley 2 of 2<br />
LociTion : County : El8'n Townihip rVarmouih<br />
Lot 9. Con. 1 Tract 3 i levat ion :211.4m(as1.)<br />
!<br />
GEOLOGICAL<br />
G EOPHYSICAL<br />
GEOCHEMICAL<br />
GAM! MA R. FOG. EL.<br />
i* M)<br />
% TOC<br />
(ft. m j<br />
FORMATION LITH 0<br />
5pp n i nnr<br />
5 1 P 1 5<br />
-ir^rO;<br />
95<br />
Karcellus<br />
96-<br />
' i ' . NO ( 3EOPHY5il(:j5 R LIN<br />
i i i T -^-- -<br />
97<br />
98-<br />
H<br />
'<br />
0<br />
Dundee<br />
99<br />
-^---<br />
-<br />
-
146<br />
APPENDIX 3<br />
CATALOGUE OF OIL AND GAS EXPLORATION WELLS, LAKE ERIE<br />
The following, mostly gas exploration wells, were used to<br />
produce the isopach map (Back Pocket) for the Marcellus<br />
Formation. This list does not include all wells drilled in<br />
the Lake Erie area. Many wells had geophysical logs/samples<br />
which did not prove or disprove the presence of Marcellus<br />
Formation, therefore, only those wells were used which had<br />
logs/samples which positively indicated the presence (or<br />
absence) of the formation. For additional information on<br />
these <strong>and</strong> other exploration wells in the area contact<br />
Petroleum Resources Section, Ministry of Natural Resources, 58<br />
Central Avenue, London, <strong>Ontario</strong>. Included are gamma-ray <strong>and</strong><br />
focussed electric logs. Other types of logs (e.g. density,<br />
neutron caliper, sonic) were also taken in these holes <strong>and</strong> are<br />
released in separate open file reports (Johnson 1985 <strong>and</strong><br />
Johnson et al. 1985) .
147<br />
Map No. Well Name Lots <strong>and</strong> Cone or Block<br />
<strong>and</strong> tracks<br />
1<br />
2<br />
3<br />
4<br />
5<br />
6<br />
7<br />
8<br />
9<br />
10<br />
11<br />
12<br />
13<br />
14<br />
15<br />
16<br />
17<br />
18<br />
19<br />
20<br />
21<br />
22<br />
23<br />
24<br />
25<br />
26<br />
27<br />
28<br />
29<br />
30<br />
31<br />
32<br />
33<br />
34<br />
35<br />
36<br />
37<br />
38<br />
39<br />
40<br />
41<br />
42<br />
43<br />
44<br />
45<br />
46<br />
47<br />
48<br />
49<br />
M-9<br />
OGS-82-3<br />
M-8<br />
M-7<br />
M-6<br />
M-5<br />
Shawee UBR Malahide 2.31.Ill<br />
Forbes #9 Malahide 2.91.NTR<br />
C-G-33119/Malahide 4.21.1<br />
Bluewater S. Dorchester 7-16-11<br />
Anschutz (Can.) Exp. Ltd.<br />
CG 13030<br />
CG 13124<br />
C-Amoco 13104<br />
C-Pan Am 13038<br />
CG 13491<br />
C-Amoco 13093<br />
CG 13216<br />
CG 13472<br />
CG 13168<br />
CG 13414<br />
CG 13746<br />
CG 13553<br />
CG 13658<br />
CG 13294<br />
CG 13224<br />
CG 13325<br />
CG-Pan Am 13053<br />
CG 13525<br />
CG 13524<br />
CG 13398<br />
Anschutz<br />
Anschutz #3<br />
Anschutz (Can.) Exp. Ltd.<br />
CG Pan Am Petrol. Ltd.<br />
CG Pan Am Petrol. Ltd.<br />
Anschutz #1<br />
CG 13519<br />
CG 13715<br />
CG 13340<br />
CG 13578<br />
CG 13579<br />
CG 13122<br />
CG 13006<br />
CG 13212<br />
CG 13296<br />
CG 13426<br />
CG 13836<br />
CG 13168<br />
Lot 24, Cone. XII<br />
Lot 9, Cone. I<br />
Lot 26, Cone. I<br />
Lot 6, Cone. Ill<br />
Lots l <strong>and</strong> 2, Cone.<br />
Lot l, Cone. IX<br />
Lot 31, Cone. Ill<br />
Lot 91, Cone. NTR<br />
Lot 21, Cone. I<br />
Lot 16, Cone.VIII<br />
110-S<br />
113-C<br />
104-N<br />
103-P<br />
102-B<br />
101-1<br />
100-A<br />
99-1<br />
97-E<br />
126-F<br />
95-M<br />
95-U<br />
125-C<br />
124-C<br />
123-D<br />
121-A<br />
120-1<br />
119-A<br />
118-B<br />
118-C<br />
117-K<br />
116-Y<br />
115-G<br />
161-M<br />
161-W<br />
113-U<br />
162-G<br />
159-D<br />
160-H<br />
158-B<br />
157-F<br />
157-G<br />
157-C<br />
157-A<br />
155-E<br />
154-E<br />
154-C<br />
126-O<br />
126-M<br />
IV<br />
CG = Consumers Gas Ltd.
Map No. Well Name Lots <strong>and</strong> Cone or Block<br />
<strong>and</strong> tracks<br />
50<br />
51<br />
52<br />
53<br />
54<br />
55<br />
56<br />
57<br />
58<br />
59<br />
60<br />
61<br />
62<br />
63<br />
64<br />
65<br />
66<br />
67<br />
68<br />
69<br />
70<br />
71<br />
72<br />
73<br />
74<br />
75<br />
76<br />
77<br />
78<br />
79<br />
80<br />
81<br />
82<br />
83<br />
84<br />
85<br />
86<br />
87<br />
88<br />
89<br />
90<br />
91<br />
92<br />
93<br />
94<br />
95<br />
96<br />
97<br />
CG 13556<br />
CG 13100<br />
CG 13313<br />
CG 13736<br />
CG 13332<br />
CG 13776<br />
CG-Pan Am 13041<br />
CG 13519<br />
CG 13164<br />
CG 13582<br />
CG 13584<br />
CG 13777<br />
CG 13042<br />
CG 13803<br />
CG 13010<br />
CG 13522<br />
CG 13498<br />
CG 13586<br />
CG 13046<br />
CG 13750<br />
CG 13589<br />
CG 13807<br />
CG 13715<br />
CG 13628<br />
CG 13598<br />
CG 13700<br />
CG 13336<br />
CG 13601<br />
CG 13396<br />
CG 13600<br />
CG 13394<br />
CG 13465<br />
CG 13599<br />
CG 13337<br />
CG 13457<br />
CG 13397<br />
CG 13393<br />
CG Pan Am 13032<br />
CG 13733<br />
CG 13633<br />
Anschutz #2<br />
CG 13116<br />
Anschutz #3<br />
Anschutz Can. Expl. Ltd<br />
CG 13515<br />
CG 13718<br />
CG 13516<br />
CG 13507<br />
126-N<br />
126-P<br />
152-A<br />
151-D<br />
152-C<br />
188-E<br />
187-D<br />
157-D<br />
157-M<br />
157-N<br />
157-S<br />
157-V<br />
157-R<br />
157-Y<br />
185-D<br />
185-A<br />
185-1<br />
185-E<br />
184-J<br />
185-M<br />
185-J<br />
185-T<br />
160-1<br />
182-A<br />
183-G<br />
-183-K<br />
183-T<br />
183-V<br />
183-S<br />
18 3-R<br />
183-X<br />
18 3-N<br />
182-K<br />
182-K<br />
182-S<br />
183-P<br />
182-Y<br />
161-W<br />
181-C<br />
180-1<br />
179-J<br />
162-Y<br />
179-G<br />
178-L<br />
220-H<br />
221-R<br />
220-N<br />
220-P
149<br />
Map No. Well Name Lots <strong>and</strong> Cone or Block<br />
<strong>and</strong> tracks<br />
98 CG 13610 221-J<br />
99 CG 13192 221-H<br />
100 CG 13193 221-D<br />
101 CG 13244 221-P<br />
102 CG 13253 221-O<br />
103 CG 13611 221-N<br />
104 CG 13262 220-P<br />
105 CG 13609 220-C<br />
106 CG 13625 220-M<br />
107 CG 13510 175-V<br />
108 CG 13385 238-R<br />
109 CG 13502 284-C<br />
110 CG 13560 313-J<br />
111 C.W.P. Taylor Dover 69-10 46-E<br />
112 Pembina #4 63-K<br />
113 Pembina #1 (5872) 63-A<br />
114 CG 13465 183-N<br />
115 Anschutz #4 (5444) 129-R<br />
116 CG-Pan Am 13002 185-O<br />
CG = Consumers Gas Ltd.
40-1<br />
1:250,000 CANADA<br />
40-1<br />
LONG POINT<br />
Port Inner Bay<br />
Rowan<br />
Me MftVEYS AMD MVPING MANCH<br />
MTOFCNCMCY •NNESMHDimOUIICES<br />
a*i USA aartmi ot*Mrt M wrt taut HMD (197?) twwdad<br />
Ike Uinta* 9Mn 6a*M|ica<br />
ERIE<br />
CANADA-UNITED STATES OF AMERICA<br />
*v to MKCTMM KS LCVCS CT K LA O*rrO6**PM*E<br />
L CfieWGIC KS WMES CT KS *CSSOU*CES<br />
•t CJH*4 i MOuG AMMMMMS a ^w Ms *n mtmuK au *J<br />
carte<br />
tlals 0"n<br />
OF THE FORMATIOH