Identification of hydrocarbons in chalk reservoirs from surface - GEUS
Identification of hydrocarbons in chalk reservoirs from surface - GEUS
Identification of hydrocarbons in chalk reservoirs from surface - GEUS

You also want an ePaper? Increase the reach of your titles
YUMPU automatically turns print PDFs into web optimized ePapers that Google loves.
Moduli (GPa)<br />
40<br />
0.4<br />
K<br />
Sw<br />
1.0<br />
30<br />
0.3<br />
0.8<br />
20 G<br />
0.6<br />
0.2<br />
10<br />
0.4<br />
0.2<br />
0.0<br />
A<br />
B<br />
0<br />
0.1<br />
10 20 30 40 50 10 20 30 40 50<br />
Porosity (%) Porosity (%)<br />
Poisson ratio (-)<br />
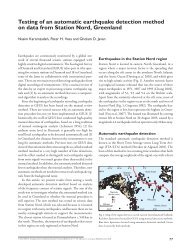
Fig. 2. Acoustic properties <strong>of</strong> <strong>chalk</strong> as a<br />
function <strong>of</strong> porosity and water saturation<br />
(Sw). A: Bulk (K) and shear modulus (G);<br />
B: Poisson ratio. Note the pronounced<br />
difference <strong>in</strong> the Poisson ratio between<br />
br<strong>in</strong>e and oil for porosities above c. 30%.<br />
MUHS prediction based on f<strong>in</strong>e-scale mix<strong>in</strong>g<br />
and fluid properties for the South Arne field.<br />
Modified <strong>from</strong> Japsen et al. (2004).<br />
Versus Offset (AVO) <strong>in</strong>version <strong>of</strong> <strong>surface</strong> seismic data. This is<br />
because the variation <strong>in</strong> seismic reflection amplitude with<br />
change <strong>in</strong> distance between shotpo<strong>in</strong>t and receiver may <strong>in</strong>dicate<br />
differences <strong>in</strong> rock properties above and below the reflector.<br />
Changes <strong>in</strong> AVO can be directly related to changes <strong>in</strong> the<br />
Poisson ratio and thus to differences <strong>in</strong> pore fluid properties.<br />
The uppermost part <strong>of</strong> the <strong>chalk</strong> <strong>of</strong> the South Arne field is<br />
rich <strong>in</strong> clay (the Ek<strong>of</strong>isk Formation). Core data <strong>in</strong>dicate that<br />
clayrich <strong>chalk</strong> has significantly smaller P- and S-velocities and<br />
a higher Poisson ratio than observed for pure <strong>chalk</strong> (see Japsen<br />
et al. 2004, fig. 2). The relatively small velocities for a<br />
given porosity are probably an artefact due to a reduction <strong>in</strong><br />
porosity because clay fills up the pore space without affect<strong>in</strong>g<br />
the acoustic properties <strong>of</strong> the <strong>chalk</strong> matrix. However, the<br />
amount <strong>of</strong> silicates (typically quartz and clay) cannot always<br />
be predicted <strong>from</strong> the gamma log, because the <strong>chalk</strong> may be<br />
rich <strong>in</strong> very f<strong>in</strong>e-gra<strong>in</strong>ed silicates which are not all radioactive.<br />
In water-wet <strong>chalk</strong> the amount <strong>of</strong> very f<strong>in</strong>e-gra<strong>in</strong>ed<br />
material may be estimated <strong>from</strong> the water saturation (cf.<br />
Fabricius et al. 2002). The MUHS model <strong>of</strong> the acoustic<br />
properties <strong>of</strong> the <strong>chalk</strong> is therefore scaled accord<strong>in</strong>g to silicate<br />
content estimated <strong>from</strong> the water saturation.<br />
Comparison <strong>of</strong> well log data and core data<br />
The l<strong>in</strong>k between the <strong>surface</strong> seismic data and the reservoir<br />
properties <strong>in</strong> the South Arne field is complicated by difficulties<br />
<strong>in</strong> <strong>in</strong>terpret<strong>in</strong>g the sonic log, because mud filtrate has<br />
<strong>in</strong>vaded the reservoir near the well bore where the sonic log is<br />
registered (Fig. 3). The water saturation can be estimated at<br />
<strong>in</strong>termediate and long distances <strong>from</strong> the bore hole based on<br />
resistivity logs, but not adjacent to the well bore. However,<br />
the sonic waves travel close to the well bore and it is thus difficult<br />
to perform ‘fluid substitution’ <strong>of</strong> the data, i.e. to transform<br />
the acoustic data <strong>from</strong> the pore fluid environment<br />
where they are measured to the fully hydrocarbon-saturated<br />
environment <strong>of</strong> the reservoir (the virg<strong>in</strong> zone; cf. Gommesen<br />
2003).<br />
Comparison <strong>of</strong> P-wave velocity and porosity <strong>from</strong> log and<br />
core data clearly shows that the logg<strong>in</strong>g data record conditions<br />
close to the well bore, where mud filtrate has almost<br />
completely flushed the reservoir (Fig. 4). Core porosities<br />
match log porosities estimated <strong>from</strong> the density log assum<strong>in</strong>g<br />
full <strong>in</strong>vasion <strong>of</strong> mud filtrate (Fig. 4A) and P-wave velocities<br />
<strong>of</strong> br<strong>in</strong>e saturated cores generally correspond to read<strong>in</strong>gs <strong>of</strong> P-<br />
wave velocity <strong>in</strong> the borehole (Fig. 4B). Estimation <strong>of</strong> <strong>in</strong>vasion<br />
effects is usually difficult because <strong>of</strong> the lack <strong>of</strong> different<br />
types <strong>of</strong> data, and this study underl<strong>in</strong>es the importance <strong>of</strong><br />
hav<strong>in</strong>g access to core data.<br />
Sw<br />
Sxo<br />
?<br />
Water saturation<br />
Seismic Acoustic Acoustic<br />
Seismic<br />
data<br />
log log<br />
data<br />
Distance <strong>from</strong> drill hole Distance <strong>from</strong> drill hole<br />
Velocity<br />
Vp<br />
?<br />
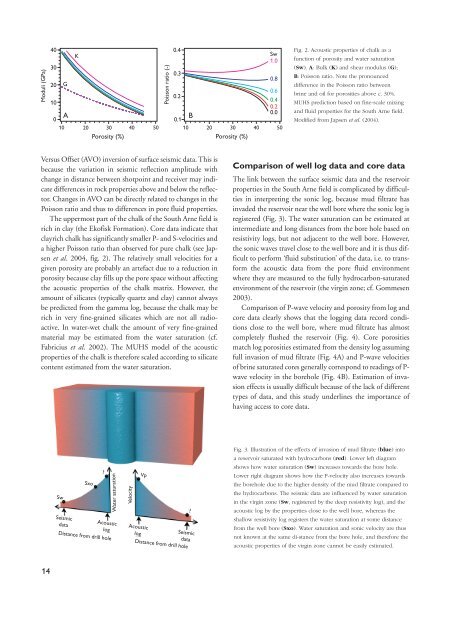
Fig. 3. Illustration <strong>of</strong> the effects <strong>of</strong> <strong>in</strong>vasion <strong>of</strong> mud filtrate (blue) <strong>in</strong>to<br />
a reservoir saturated with <strong>hydrocarbons</strong> (red). Lower left diagram<br />
shows how water saturation (Sw) <strong>in</strong>creases towards the bore hole.<br />
Lower right diagram shows how the P-velocity also <strong>in</strong>creases towards<br />
the borehole due to the higher density <strong>of</strong> the mud filtrate compared to<br />
the <strong>hydrocarbons</strong>. The seismic data are <strong>in</strong>fluenced by water saturation<br />
<strong>in</strong> the virg<strong>in</strong> zone (Sw, registered by the deep resistivity log), and the<br />
acoustic log by the properties close to the well bore, whereas the<br />
shallow resistivity log registers the water saturation at some distance<br />
<strong>from</strong> the well bore (Sxo). Water saturation and sonic velocity are thus<br />
not known at the same di-stance <strong>from</strong> the bore hole, and therefore the<br />
acoustic properties <strong>of</strong> the virg<strong>in</strong> zone cannot be easily estimated.<br />
14