CONTINUOUS GRAVITY MEASUREMENTS FOR RESERVOIR ...
CONTINUOUS GRAVITY MEASUREMENTS FOR RESERVOIR ...
CONTINUOUS GRAVITY MEASUREMENTS FOR RESERVOIR ...

Create successful ePaper yourself
Turn your PDF publications into a flip-book with our unique Google optimized e-Paper software.
PROCEEDINGS, Twenty-Fourth Workshop on Geothermal Reservoir Engineering<br />
Stanford University, Stanford, California, January 25-27, 1999<br />
SGP-TR-162<br />
<strong>CONTINUOUS</strong> <strong>GRAVITY</strong> <strong>MEASUREMENTS</strong> <strong>FOR</strong> <strong>RESERVOIR</strong> MONITORING<br />
M. Sugihara<br />
Geological Survey of Japan, 1-1-3, Higashi, Tsukuba, 305-8567, Japan<br />
e-mail: sugihara@gsj.go.jp<br />
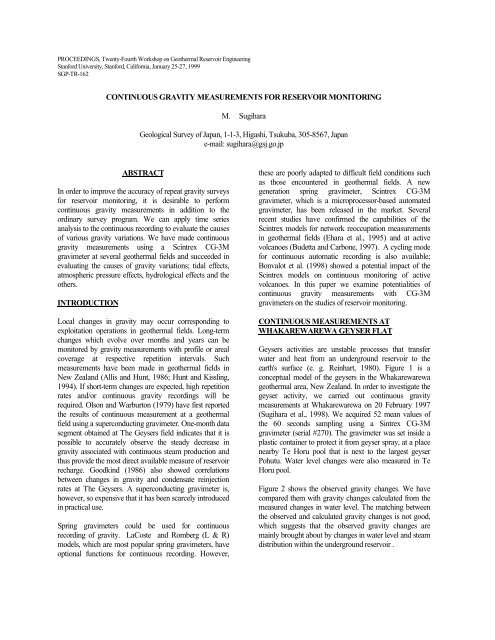
ABSTRACT<br />
In order to improve the accuracy of repeat gravity surveys<br />
for reservoir monitoring, it is desirable to perform<br />
continuous gravity measurements in addition to the<br />
ordinary survey program. We can apply time series<br />
analysis to the continuous recording to evaluate the causes<br />
of various gravity variations. We have made continuous<br />
gravity measurements using a Scintrex CG-3M<br />
gravimeter at several geothermal fields and succeeded in<br />
evaluating the causes of gravity variations; tidal effects,<br />
atmospheric pressure effects, hydrological effects and the<br />
others.<br />
INTRODUCTION<br />
Local changes in gravity may occur corresponding to<br />
exploitation operations in geothermal fields. Long-term<br />
changes which evolve over months and years can be<br />
monitored by gravity measurements with profile or areal<br />
coverage at respective repetition intervals. Such<br />
measurements have been made in geothermal fields in<br />
New Zealand (Allis and Hunt, 1986; Hunt and Kissling,<br />
1994). If short-term changes are expected, high repetition<br />
rates and/or continuous gravity recordings will be<br />
required. Olson and Warburton (1979) have first reported<br />
the results of continuous measurement at a geothermal<br />
field using a superconducting gravimeter. One-month data<br />
segment obtained at The Geysers field indicates that it is<br />
possible to accurately observe the steady decrease in<br />
gravity associated with continuous steam production and<br />
thus provide the most direct available measure of reservoir<br />
recharge. Goodkind (1986) also showed correlations<br />
between changes in gravity and condensate reinjection<br />
rates at The Geysers. A superconducting gravimeter is,<br />
however, so expensive that it has been scarcely introduced<br />
in practical use.<br />
Spring gravimeters could be used for continuous<br />
recording of gravity. LaCoste and Romberg (L & R)<br />
models, which are most popular spring gravimeters, have<br />
optional functions for continuous recording. However,<br />
these are poorly adapted to difficult field conditions such<br />
as those encountered in geothermal fields. A new<br />
generation spring gravimeter, Scintrex CG-3M<br />
gravimeter, which is a microprocessor-based automated<br />
gravimeter, has been released in the market. Several<br />
recent studies have confirmed the capabilities of the<br />
Scintrex models for network reoccupation measurements<br />
in geothermal fields (Ehara et al., 1995) and at active<br />
volcanoes (Budetta and Carbone, 1997). A cycling mode<br />
for continuous automatic recording is also available;<br />
Bonvalot et al. (1998) showed a potential impact of the<br />
Scintrex models on continuous monitoring of active<br />
volcanoes. In this paper we examine potentialities of<br />
continuous gravity measurements with CG-3M<br />
gravimeters on the studies of reservoir monitoring.<br />
<strong>CONTINUOUS</strong> <strong>MEASUREMENTS</strong> AT<br />
WHAKAREWAREWA GEYSER FLAT<br />
Geysers activities are unstable processes that transfer<br />
water and heat from an underground reservoir to the<br />
earth's surface (e. g. Reinhart, 1980). Figure 1 is a<br />
conceptual model of the geysers in the Whakarewarewa<br />
geothermal area, New Zealand. In order to investigate the<br />
geyser activity, we carried out continuous gravity<br />
measurements at Whakarewarewa on 20 February 1997<br />
(Sugihara et al., 1998). We acquired 52 mean values of<br />
the 60 seconds sampling using a Sintrex CG-3M<br />
gravimeter (serial #270). The gravimeter was set inside a<br />
plastic container to protect it from geyser spray, at a place<br />
nearby Te Horu pool that is next to the largest geyser<br />
Pohutu. Water level changes were also measured in Te<br />
Horu pool.<br />
Figure 2 shows the observed gravity changes. We have<br />
compared them with gravity changes calculated from the<br />
measured changes in water level. The matching between<br />
the observed and calculated gravity changes is not good,<br />
which suggests that the observed gravity changes are<br />
mainly brought about by changes in water level and steam<br />
distribution within the underground reservoir .
Gravimeter<br />
Te Horu<br />
PWF Pohutu Waikorohihi<br />
Figure 1. A schematic model of Whakarewarewa Geyser<br />
Flat, New Zealand. Three geysers (PWF, Pohutu and<br />
Waikorohihi) are active and the water level in Te Horu<br />
pool changes.<br />
observed gravity changes<br />
3M has an in-built function to correct for the earth-tide<br />
effect using the formulae given by Longman (1959)<br />
assuming the amplification factor to be 1.16 and the lag<br />
time as zero. We did not use the in-built function for tidal<br />
correction, but followed usual procedure at Wairakei, that<br />
is, assuming the amplification factor to be 1.20 (Hunt,<br />
1988). Figure 3 suggests that the tide correction procedure<br />
does not fully remove all tidal signatures.<br />
Another tide correction using the program GOTIC (Sato<br />
and Hanada, 1984) were made. The GOTIC program<br />
calculates amplitudes and phases of the oceanic gravity<br />
tides for major 9 components by using the Schwiderski's<br />
oceanic tidal model and the Green's function based on the<br />
1066A Earth model. The secondary effect of elastic<br />
deformation of the earth to tidal loading was thus<br />
appropriately considered. The result has substantially<br />
improved, but still contains semi-diurnal components.<br />
This is partly because the amplitude and phase of the<br />
semi-diurnal component of the oceanic tide depend<br />
largely on the location and the results are influenced by<br />
the accuracy of topographical maps of the program.<br />
gravity (mGal)<br />
0.01<br />
0<br />
estimated gravity changes<br />
10 12 14 16 18<br />
Hour (FEB 20,1997)<br />
Figure 2. The gravity changes estimated from the changes<br />
in water level in Te Horu pool (lower line) and the<br />
observed gravity changes (upper line). The observed<br />
gravity changes was low-pass filtered.<br />
<strong>CONTINUOUS</strong> <strong>MEASUREMENTS</strong> AT<br />
WAIRAKEI<br />
In 1996 we made gravity measurements at a few hundreds<br />
points in the Taupo Volcanic Zone, New Zealand. Before<br />
the measurements we set a CG-3M (serial #270) for<br />
eleven days to check the drift rate at a reference point in<br />
the X-ray laboratory in Building 3, Wairakei Research<br />
Center. The gravimeter was set to record values averaged<br />
over two minutes, every ten minutes.<br />
Large offsets caused by moderate Kermadec earthquakes<br />
are seen in the record (Figure 3). A change with a longer<br />
period appears as the residual earth tide components. CG-<br />
gravity (microGal)<br />
-50 0 50 100<br />
Gotic Tide Model<br />
Default Tide Model<br />
Kermadic Earthquake<br />
26 28 30 32 34 36 38<br />
Julian Day, 1996 (UT)<br />
Figure 3. A 11-day data segment from Wairakei. Residual<br />
signals obtained after removal of a linear drift and two tide<br />
models.<br />
TIME SERIES ANALYSIS<br />
Time-series data acquired from continuous gravity<br />
measurements contain information about tide,<br />
instrumental effects, influences of external mass<br />
displacements (atmospheric, hydrological, and tectonic<br />
processes), and measurement errors. The program<br />
BAYTAP-G can be adapted to data which include tidal<br />
effects and irregularities such as drift, occasional steps and<br />
disturbances caused by meteorological influences<br />
(Tamura et al., 1991). Figure 4 is a flow chart of<br />
BAYTAP-G. The basic assumption of the method is the
smoothness of the drift. This assumption is represented in<br />
the form of prior probability in the Baysian model. Once<br />
the prior distribution is determined, the parameters used in<br />
the analysis model are obtained by maximizing the<br />
posterior distribution of the parameters. In contrast to the<br />
previous methods, only the smoothness of the drift is<br />
assumed in this new procedure. In order to determine the<br />
precise cause of various variations, it is first necessary to<br />
look for a possible correlation between the gravity<br />
observations and other parameters simultaneously<br />
recorded (e.g. atmospheric pressure, groundwater level,<br />
rainfall). If a correlation with environmental variables is<br />
found, it can be studied for phenomena of interest or used<br />
to eliminate uninteresting effects. (It seems interesting to<br />
apply the program BAYTAP-G to the data shown in<br />
Figure 3. However, only eleven days of data are not<br />
enough to separate the main tidal components.)<br />
Observation Processing Solution<br />
their comparison with other recordings made<br />
simultaneously (atmospheric pressure, rainfall, and<br />
groundwater level), the gravity signals were later resampled<br />
at a sampling rate of one point per an hour.<br />
Figure 5 shows the raw gravity recordings acquired with a<br />
Scintrex CG-3M gravimeter. The drift parameter was set<br />
to zero in order to quantify the actual instrumental drift.<br />
Residual gravity signals obtained after removal of a<br />
quadratic drift are shown in Figure 6.<br />
gravity (mGal)<br />
0 10 20 30 40<br />
g= 1.61 + 0.0297 x T<br />
Continuous<br />
Gravity<br />
Air Pressure<br />
Groundwater<br />
BAYTAP<br />
BAYsian<br />
Tidal Analysis<br />
Program<br />
Drift<br />
Irregular Comp.<br />
Tide<br />
Response to<br />
Air Pressure<br />
Groundwater<br />
0 200 600 1000<br />
hours from 0:00 SEP 21, 1997 (JST)<br />
Figure 5. The raw gravity recordings at Sumikawa.<br />
Figure 4. A flow chgart of the program BAYTAP-G.<br />
We tried to apply the method to data from the Sumikawa<br />
geothermal field in northern Japan. Since 1994, we have<br />
been carrying out repeat microgravity surveys using a<br />
LaCoste & Romberg D gravimeter (serial #35) at<br />
Sumikawa. Gravity changes corresponding to fluid<br />
reinjection have been observed since full-scale plant<br />
operation began in 1995. The observed microgravity<br />
changes were in good agreement with earlier predictions<br />
based upon a mathematical reservoir model (Sugihara and<br />
Ishido, 1998). The accuracy of the measurements were<br />
evaluated to be 10-20 microGal.<br />
In order to perform reproducible measurements, it is<br />
important for us to evaluate tide and other effects on<br />
gravity measurements. We, therefore, made continuous<br />
gravity measurements using a CG-3M (serial #352) at<br />
Sumikawa in 1997. Recordings were made at a sampling<br />
rate of one point per 10 minute (cycle time 600 seconds,<br />
read time 120 seconds). To ease the reading of the timeseries<br />
recording over a long period of time and to facilitate<br />
gravity (mGal)<br />
-0.15 -0.05 0.05<br />
0 200 600 1000<br />
hours from 0:00 SEP 21, 1997 (JST)<br />
Figure 6. Residual gravity signals obtained after removal<br />
of a quadratic drift.<br />
It is seen that the quadratic model correctly fits the<br />
instrumental drift for the gravimeter. Amplitude factors<br />
and phase delays of twelve tide constituents were<br />
determined. A coefficient of gravity changes<br />
corresponding to groundwater level changes at the site<br />
was estimated by BAYTAP-G as 2.0 microGal / m.<br />
Assuming horizontally structure we can estimate from this<br />
value porosity to be 5 percent.
Figure 7 shows the result of another field. Recordings<br />
were made at a sampling rate of one point per minute at<br />
the Amihari Absolute Gravity Station, about 6 km to the<br />
east of the Kakkonda Geothermal Power Plant (Sugihara<br />
and Yamamoto, 1998). Tide effects and atmospheric<br />
pressure effects were decomposed by BAYTAP-G. The<br />
drift components for two models are shown in Figure 7.<br />
Model 1 includes the response to air pressure, Model 2<br />
does not. Model 0 includes the difference of tidal<br />
components to the Longman's model.<br />
Gravity (mGal)<br />
0.0 0.02 0.04<br />
Model 0<br />
Model 1<br />
Model 2<br />
5 10 15 20<br />
Day (SEP 1998)<br />
Response to<br />
Typhoon<br />
Figure 7. The results of decomposition by BAYTAP-G.<br />
The drift components for two models are shown. Model 1<br />
includes the response to air pressure, Model 2 does not.<br />
Model 0 includes the difference of tidal components to the<br />
Longman's model.<br />
DISCUSSION<br />
Analysis of measured gravity changes allows us to<br />
evaluate values of reservoir properties such as<br />
permeability or storativity. Now consider the two cases<br />
which Hunt and Kissling (1994) examined. One case is<br />
for the early stages of exploitation when a two-phase zone<br />
is rapidly expanding. The second case is for the effects of<br />
reinjection into a deep-liquid zone overlain by a twophase<br />
zone. The peak anomaly was 415 microGal and<br />
120 microGal for the first and second cases, respectively.<br />
The accuracy obtained by reoccupying the networks with<br />
spring gravimeters (L&R, CG-3M) usually varies from 10<br />
to 20 microGal (Hunt, 1988; Torge, 1989). In order to<br />
infer reservoir properties from gravity change data, it is<br />
important to reduce uncertainties as small as possible.<br />
Harnisch (1993) discussed systematic errors which<br />
influence the accuracy of high precision gravity<br />
measurements: tidal effects, atmospheric pressure<br />
fluctuations, hydrological effects and local gravity<br />
variations. The first three effects can be separated by<br />
continuous gravity monitoring. Tidal and atmospheric<br />
effects change in time, but are almost uniform in space on<br />
a small network such as used for the geothermal reservoir<br />
monitoring. Therefore, it is effective to make continuous<br />
measurement at a point in the study area. It may be useful<br />
even if a period of the continuous measurement is a few<br />
months or less. Usually amplitude and phase of each tidal<br />
component do not change so much. It is the same with<br />
admittance of atmospheric pressure (see van Dam and<br />
Francis, 1998).<br />
At present the greatest uncertainties arise from<br />
hydrological influences. Harnisch (1993) estimated that<br />
gravity variations are more than 10 microGal and more<br />
than 30 microGal for the soil moisture and the<br />
groundwater influences, respectively. Generally speaking<br />
these hydrological effects appear in microgravity<br />
recordings differently at each station in a geologically<br />
heterogeneous area such as geothermal fields in Japan.<br />
Hunt and Kissling (1994) proposed plans of gravity<br />
monitoring for the two cases mentioned above: gravity<br />
monitoring at a few selected points in the borefield area<br />
for several years at a 6-12-month interval, gravity<br />
monitoring at a few selected points around the injection<br />
well for several years at about three-month intervals.<br />
Continuous recordings at the selected points during the<br />
intervals are significant to evaluate the systematic errors.<br />
Continuous recording may be useful to select a few<br />
stations which are appropriate for the reiteration network<br />
and not sensitive to shallow hydrological effects.<br />
It is efficient for improving the signal-to-noise ratio to<br />
low-pass filter the data recorded at a high sampling rate.<br />
Sugihara and Tamura (1998) made a continuous gravity<br />
measurement at the Esashi Earth Tide Station of the<br />
National Astronomical Observatory (latitude 39-08-53 N,<br />
longitude 141-20-07 E), where a superconducting<br />
gravimeter are operating. Recordings were made at a<br />
sampling rate of one point per one minute (cycle time 60<br />
seconds, read time 48 seconds) and data were transferred<br />
to a personal computer through the RS-232C port. The<br />
separated tidal components of the CG-3M data were in<br />
agreement (within 0.5 microGal) with those from the<br />
superconducting gravimeter. Considering the nominal<br />
accuracy of the CG-3M is 1 microGal, it is quite a<br />
marvelous fact. In addition to that the ground noise level is<br />
quite low and the ambient temperature is well controlled<br />
at the site, digital filtering was quite effective to get this<br />
good result.<br />
CONCLUDING REMARKS<br />
Although the data presented here are insufficient to yield<br />
new conclusions concerning reservoir processes, they do
demonstrate that continuous gravity recording with CG-<br />
3M meters is a promising tool for geothermal reservoir<br />
monitoring. Continuous microgravity recordings<br />
associated with conventional reiteration networks will<br />
probably improve the accuracy of reservoir monitoring.<br />
The accuracy obtained by reoccupying the networks with<br />
spring gravimeters (e.g. L&R, CG-3M) usually varies<br />
from 10 to 20 microGals. Comparing this accuracy to<br />
observable signals we have not enough resolution to<br />
analyze reservoir properties. It is efficient for improving<br />
the resolution to make continuous gravity recording for a<br />
month or two at a few selected stations in and around the<br />
network. It is useful, especially in Japan because several<br />
CG-3M meters have already introduced for reservoir<br />
monitoring (Ehara et al., 1995; Nakanishi et al., 1998),<br />
and reducible systematic errors are likely to be contained<br />
in microgravity observations. We have many sources of<br />
the systematic errors which influence the accuracy of high<br />
precision gravity measurements in Japan: (1) oceanic tide<br />
effects are large, (2) low atmospheric pressure area moves<br />
across the Japanese islands frequently, and (3) heavy<br />
rainfall may cause significant hydrological effects. To<br />
reduce the systematic errors and evaluate reservoir<br />
parameters more precisely, it is desirable to make use of<br />
(the existing) CG-3M meters not only for reiteration<br />
surveys but also for continuous measurements.<br />
ACKNOWLEDGMENTS<br />
The author wish to thank Dr. Tsuneo Ishido for his helpful<br />
discussions and pertinent advice. The author is also<br />
greatful to Dr. Yoshio Tamura of the National<br />
Astronomical Observatory for his valuable comments<br />
about the program BAYTAP-G. The data presented in<br />
this paper were acquired in cooperative work.<br />
REFERENCES<br />
Allis, R. G. and Hunt, T. M. (1986), “Analysis of<br />
exploitation-induced gravity changes at Wairakei<br />
Geothermal Field,” Geophysics, 51, 1647-1660.<br />
Bonvalot, S., Diament, M. and Gabalda, G. (1998),<br />
“Continuous gravity recording with Scintrex CG-3M<br />
meters: a promising tool for monitoring active<br />
zones,” Geophys. J. Int., 135, 470-494.<br />
Budetta, G. and Carbone, D. (1997), “Potential<br />
application of the Scintrex CG-3M gravimeter for<br />
monitoring volcanic activity: results of field trials on<br />
Mt. Etna,” J. Volc. Geotherm. Res., 76, 199-214.<br />
Ehara, S., Fujimitsu, Y., Motoyama, T., Akasaka, C.,<br />
Furuya, S., Goto, H. and Motomatsu, T. (1995),<br />
“Gravity monitoring of geothermal reservoirs - A<br />
case study of the production and reinjection test at<br />
the Takigami Geothermal Field, Central Kyushu,<br />
Japan,” Proc. WGC, 1955-1958.<br />
Goodkind, J. M. (1986), “Continuous Measurement of<br />
nontidal variations of gravity,” J. Geophys. Res., 91,<br />
9125-9134.<br />
Harnisch, G. (1993), “Systematic errors affecting the<br />
accuracy of high precision gravity measurements,”<br />
IAG Symposia, 112, 200-204.<br />
Hunt, T. (1988), “Exploitation-induced gravity changes<br />
in New Zealand geothermal fields,” BGI, 62, 79-85.<br />
Hunt, T. M. and Kissling, W. M. (1994),<br />
“Determination of reservoir properties at Wairakei<br />
Geothermal Field using gravity change<br />
measurements,” J. Volc. Geotherm. Res., 63, 129-<br />
143.<br />
Longman, I. M. (1959), “Formulas for computing the<br />
tidal accelerations due to the Moon and the Sun,” J.<br />
Geophys. Res., 64, 2351-2356.<br />
Nakanishi, S., Iguchi, K., Akasaka, C. and Iwai, N.<br />
(1998), “Microgravity monitoring for the Oguni<br />
Geothermal Reservoir System, Japan - A preliminary<br />
correction of seasonal gravity changes before<br />
exploitation,” GRC Transactions, 22, 179-189.<br />
Olson, J. J. and Warburton, R. J. (1979), “Continuous<br />
gravity observations at The Geysers: a preliminary<br />
report,” GRC Transactions, 3, 519-522.<br />
Rinehart, J. S. (1980), “Geysers and geothermal<br />
energy,” Springer, New York.<br />
Sato, T. and Hanada, H. (1984), “A program for the<br />
computation of oceanic tidal loading effects<br />
'GOTIC',” Publ. Int. Latit. Mizusawa, 18, 63-82.<br />
Sugihara, M. and Ishido, T. (1998), “Gravity monitoring<br />
at the Sumikawa Geothermal Field, Japan,” GRC<br />
Transactions, 22, 191-195.<br />
Sugihara, M., Nishi, Y. and Scott, (1998), “Gravity<br />
monitoring at Geyser Flat, Whakarewarewa, New<br />
Zealand,” Abstracts Volcanol. Soc. Japan, 1998 Fall<br />
Meeting, A15 (in Japanese)<br />
Sugihara, M. and Tamura, Y. (1998), “Performance of the
Scintrex CG-3M gravimeter tested at Esashi Earth<br />
Tide station,” Abstracts, 1998 Japan Earth and<br />
Planetary Science Joint Meeting, Dc007, (in Japanese)<br />
Sugihara, M. and Yamamoto, H. (1998), “Continuous<br />
gravity measurement using a Scintrex CG-3M<br />
gravimeter at Iwate volcano,” Abstracts Seism. Soc.<br />
Japan 1998, Fall Meeting, P38 (in Japanese).<br />
Tamura, Y., Sato, T., Ooe, M. and Ishiguro, M. (1991),<br />
“A procedure for tidal analysis with a Bayesian<br />
information criterion,” Geophys. J. Int., 104, 507-516.<br />
Torge, W. (1989), “Gravimetry,” Walter de Gruyter,<br />
465p,<br />
van Dam, T. M. and Francis, O. (1998), “Two years of<br />
continuous measurements of tidal and nontidal<br />
variations of gravity in Boulder, Colorado,” Geophys.<br />
Res. Lett., 25, 393-396.