3 The Occupational Structure of England c.1710 - University of ...
3 The Occupational Structure of England c.1710 - University of ...
3 The Occupational Structure of England c.1710 - University of ...

You also want an ePaper? Increase the reach of your titles
YUMPU automatically turns print PDFs into web optimized ePapers that Google loves.
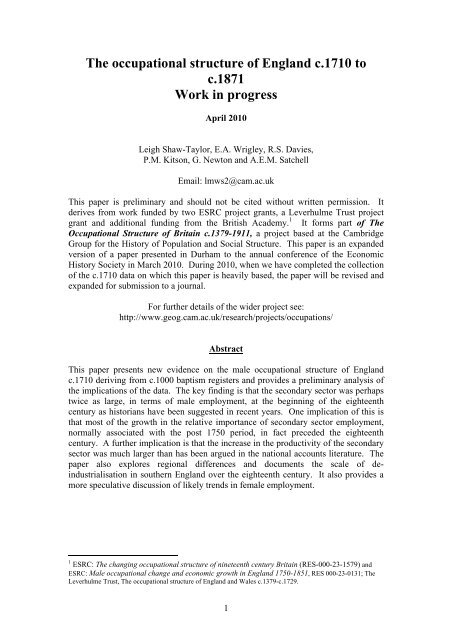
<strong>The</strong> occupational structure <strong>of</strong> <strong>England</strong> <strong>c.1710</strong> to<br />
c.1871<br />
Work in progress<br />
April 2010<br />
Leigh Shaw-Taylor, E.A. Wrigley, R.S. Davies,<br />
P.M. Kitson, G. Newton and A.E.M. Satchell<br />
Email: lmws2@cam.ac.uk<br />
This paper is preliminary and should not be cited without written permission. It<br />
derives from work funded by two ESRC project grants, a Leverhulme Trust project<br />
grant and additional funding from the British Academy. 1 It forms part <strong>of</strong> <strong>The</strong><br />
<strong>Occupational</strong> <strong>Structure</strong> <strong>of</strong> Britain c.1379-1911, a project based at the Cambridge<br />
Group for the History <strong>of</strong> Population and Social <strong>Structure</strong>. This paper is an expanded<br />
version <strong>of</strong> a paper presented in Durham to the annual conference <strong>of</strong> the Economic<br />
History Society in March 2010. During 2010, when we have completed the collection<br />
<strong>of</strong> the <strong>c.1710</strong> data on which this paper is heavily based, the paper will be revised and<br />
expanded for submission to a journal.<br />
For further details <strong>of</strong> the wider project see:<br />
http://www.geog.cam.ac.uk/research/projects/occupations/<br />
Abstract<br />
This paper presents new evidence on the male occupational structure <strong>of</strong> <strong>England</strong><br />
<strong>c.1710</strong> deriving from c.1000 baptism registers and provides a preliminary analysis <strong>of</strong><br />
the implications <strong>of</strong> the data. <strong>The</strong> key finding is that the secondary sector was perhaps<br />
twice as large, in terms <strong>of</strong> male employment, at the beginning <strong>of</strong> the eighteenth<br />
century as historians have been suggested in recent years. One implication <strong>of</strong> this is<br />
that most <strong>of</strong> the growth in the relative importance <strong>of</strong> secondary sector employment,<br />
normally associated with the post 1750 period, in fact preceded the eighteenth<br />
century. A further implication is that the increase in the productivity <strong>of</strong> the secondary<br />
sector was much larger than has been argued in the national accounts literature. <strong>The</strong><br />
paper also explores regional differences and documents the scale <strong>of</strong> deindustrialisation<br />
in southern <strong>England</strong> over the eighteenth century. It also provides a<br />
more speculative discussion <strong>of</strong> likely trends in female employment.<br />
1 ESRC: <strong>The</strong> changing occupational structure <strong>of</strong> nineteenth century Britain (RES-000-23-1579) and<br />
ESRC: Male occupational change and economic growth in <strong>England</strong> 1750-1851, RES 000-23-0131; <strong>The</strong><br />
Leverhulme Trust, <strong>The</strong> occupational structure <strong>of</strong> <strong>England</strong> and Wales c.1379-c.1729.<br />
1
This paper is very much work in progress. At the time <strong>of</strong> writing the estimates for the<br />
period around 1710 have been available for about three weeks. This is therefore not a<br />
very considered in-depth interpretation <strong>of</strong> the data but is very much a first look at new<br />
data and its implications. <strong>The</strong> paper is multi-authored. However, it needs to be<br />
emphasised that the paper is the result <strong>of</strong> work by an even larger group <strong>of</strong> people as<br />
can be seen from figure 1.<br />
Figure 1 People who contributed to the paper<br />
Project management: Leigh Shaw-Taylor<br />
Production <strong>of</strong> the estimates <strong>of</strong> occupational structure <strong>c.1710</strong> and c.1817 from<br />
the raw data. P.M Kitson.<br />
Drafting the paper: Leigh Shaw-Taylor<br />
<strong>Occupational</strong> coding: E.A. Wrigley and R.S. Davies<br />
Population data: E.A. Wrigley. Research assistance: S. Bottomley<br />
Database construction: P.M. Kitson and G. Newton<br />
Management <strong>of</strong> early register data collection: J. Field<br />
Data collection for early registers: O. Dunn, J. Field and P.M. Kitson<br />
Management <strong>of</strong> 1813-20 data collection: P.M. Kitson.<br />
Collection <strong>of</strong> 1813-20 data: J. Barker, R. Churchley, O. Dunn, S. Hennesey, P.M.<br />
Kitson , A. Jones, V. Masten, N. Modha, L. Monaghan-Pisano, S. Sovic, G.<br />
Stanning, T. Swain, A. Warren, L. Ward, M. Ward, M. Westlake.<br />
Input <strong>of</strong> published census material: R. Tyler with assistance from S., Basten, L. J.<br />
Gibbs, Monaghan-Pisano, G. Stanning, and M. Westlake.<br />
Spatial matching <strong>of</strong> datasets: P.M. Kitson, G. Newton, M. Satchell, E.A. Wrigley.<br />
Research assistance from: S. Basten, S. Bottomley, Z. Crisp, J. Gibbs, G. Wade, S.<br />
Thompson, D. Walsh and R.M. Whyte.<br />
GIS resource creation: M. Satchell.<br />
GIS mapping: M. Satchell and J. Field.<br />
<strong>The</strong> paper is part <strong>of</strong> a long-run project covering the period 1379-1911 which has been<br />
funded by the ESRC and the Leverhulme Trust with some additional funding from<br />
the British Academy. All <strong>of</strong> the occupational data have been coded to the PST<br />
system <strong>of</strong> occupational classification devised by Tony Wrigley. 2 At the simplest<br />
level <strong>of</strong> the PST scheme, illustrated in figure 2, all occupations are coded to one <strong>of</strong><br />
three sectors: primary, secondary or tertiary.<br />
Figure 2 PST Definitions<br />
• Primary Sector: Agriculture, forestry, estate work, fishing and mining.<br />
• Secondary sector: manufacture, construction, handicraft. Anyone<br />
making something.<br />
• Tertiary sector: all services - transport, retail, wholesale, pr<strong>of</strong>essional,<br />
clerical, hospitality, government, military.<br />
At its most complex level though the system recognises 1,600 distinct occupational<br />
groupings and all the data have been coded to one or other <strong>of</strong> these groupings. We<br />
have presented data on the period 1750-1871 previously. 3 What we can present now,<br />
that is new, are data for the beginning <strong>of</strong> the eighteenth century.<br />
2 For a more detailed account <strong>of</strong> the system see: Wrigley, E.A., ‘<strong>The</strong> PST System.’<br />
3 Shaw-Taylor, L. et al, ‘<strong>The</strong> occupational structure <strong>of</strong> <strong>England</strong> c.1750 to 1871: A preliminary report.’<br />
2
We will begin by reviewing what we already know about the nineteenth century<br />
before presenting new data on the eighteenth century. 4 Figure 3 (below) shows the<br />
percentage <strong>of</strong> adult males employed in the primary sector (with mining excluded so<br />
this was predominantly agriculture) in each mid nineteenth century registration<br />
district in 1813-20 on the left and in 1881 on the right. 5 <strong>The</strong> data for 1813-20<br />
(sometimes abbreviated to c.1817 – the midpoint <strong>of</strong> the dataset) derive from c.11,400<br />
Anglican baptism registers and were collected as part <strong>of</strong> two ESRC funded projects.<br />
From 1 st January 1813 it was a legal requirement to record the occupations <strong>of</strong> fathers<br />
in Anglican baptism registers for all legitimate births. For technical reasons we have<br />
used the term ‘Anglican registration unit’ to describe the area represented by a<br />
baptism register rather than refer to them as parishes and chapelries. 6 <strong>The</strong> data for the<br />
1881 map derive ultimately from the Census Enumerators’ books but were originally<br />
made machine-readable by the Mormon church and were then enhanced by Kevin<br />
Schürer and Matthew Woollard at the <strong>University</strong> <strong>of</strong> Essex. 7<br />
Figure 3 <strong>The</strong> percentage <strong>of</strong> adult males employed in the primary sector<br />
(excluding mining) in 1813-20 and 1881.<br />
4 For a more detailed account <strong>of</strong> the nineteenth century see: Shaw-Taylor et al, ‘<strong>The</strong> occupational<br />
structure <strong>of</strong> <strong>England</strong> and Wales c.1817 to 1881.’<br />
5 <strong>The</strong> registration districts are those <strong>of</strong> 1851. We have patched the 1813-20 and 1881 datasets into<br />
those registration districts. This was done to make them comparable with the occupational data<br />
published by registration district in the published census reports <strong>of</strong> 1851 and 1861.<br />
6 This is because while many <strong>of</strong> these units were indeed parishes or chapelries some <strong>of</strong> them were in<br />
fact those parts <strong>of</strong> parishes not covered by chapelries which were therefore neither parishes or<br />
chapelries.<br />
7 Schürer, K., and Woollard, M., 1881 Census for <strong>England</strong> and Wales (enhanced version).<br />
3
As one might expect agriculture was declining in importance in almost all parts <strong>of</strong><br />
<strong>England</strong> and Wales but its share <strong>of</strong> employment varied considerably between<br />
different regions.<br />
Figure 4 below shows the percentage <strong>of</strong> adult males employed in the secondary sector<br />
in each mid-nineteenth century registration district in 1813-20 on the left and in 1881<br />
on the right. <strong>The</strong> data derivation is the same as for figure 3.<br />
Figure 4 <strong>The</strong> percentage <strong>of</strong> adult males employed in the secondary sector<br />
in 1813-20 and 1881.<br />
Figure 4 shows that there was very little change in the broad regional geography <strong>of</strong><br />
secondary sector employment over the course <strong>of</strong> the nineteenth century. 8 Nationally<br />
the increase in the share <strong>of</strong> secondary sector employment was very modest rising<br />
from 42.2 per cent in 1813-20 to 46.8 per cent in 1871. Given that this encompasses<br />
the second half <strong>of</strong> the period conventionally described as the Industrial Revolution<br />
this is a very modest change indeed.<br />
Figure 5 shows the percentage <strong>of</strong> adult males employed in the tertiary sector in each<br />
mid nineteenth century registration district in 1813-20 on the left and in 1881 on the<br />
right. <strong>The</strong> data derivation is the same as for figure 3.<br />
8 <strong>The</strong>re are some very interesting second order features <strong>of</strong> the map which cannot be explored in this<br />
paper. In particular the declining relative importance <strong>of</strong> the secondary sector within industrial districts<br />
over the period 1813-20 to 1881 and the emergence <strong>of</strong> some new areas <strong>of</strong> industrial concentration by<br />
1881, most notably in the north-east and in south Wales.<br />
4
Figure 5<br />
<strong>The</strong> percentage <strong>of</strong> adult males employed in the tertiary sector in<br />
1813-20 and 1881.<br />
It is clear from figure 5 that rapid tertiary growth took place in nearly all parts <strong>of</strong><br />
<strong>England</strong> and Wales between 1813-20 and 1881. At a national level structural change<br />
consisted largely <strong>of</strong> a shift from agricultural to tertiary employment.<br />
It is never going to be possible to acquire such spatially comprehensive male<br />
occupational data for any date before 1813. Nevertheless, some Anglican parish<br />
registers did record occupations before 1813. Whilst collecting the 1813-20 data on<br />
the two ESRC funded projects it also proved possible to search all 11,400 baptism<br />
registers in <strong>England</strong> and Wales for occupational recording between 1690 and 1799. 9<br />
With funding from the Leverhulme Trust we are in the process <strong>of</strong> collecting the data<br />
from those registers which record occupations for the period between 1695 and<br />
1729. 10 <strong>The</strong>re are data for around 1,200 parishes and chapelries in <strong>England</strong> and<br />
Wales (around ten per cent <strong>of</strong> all parishes and chapelries). <strong>The</strong> location <strong>of</strong> around<br />
1,000 parishes and chapelries in <strong>England</strong> for which we currently have data are shown<br />
in figure 6 while figure 7 indicates the percentage <strong>of</strong> parishes and chapelries this<br />
represents in each ancient county.<br />
9 ESRC: RES-000-23-1579 and ESRC: RES 000-23-0131<br />
10 For a detailed discussion <strong>of</strong> the recording <strong>of</strong> occupations in Anglican baptism repgisters between<br />
1695 and 1813 see: P.M. Kitson, ‘<strong>The</strong> recording <strong>of</strong> occupations in the Anglican baptism registers <strong>of</strong> <strong>England</strong><br />
and Wales, 1690-1799.’<br />
5
Figure 6 Parishes with occupational data in the baptism registers <strong>c.1710</strong><br />
Figure 7<br />
Percentage <strong>of</strong> parishes within each county with occupational data in<br />
the baptism registers <strong>c.1710</strong><br />
6
Even though we have a very large sample with around 1,000 out <strong>of</strong> 10,000 units in<br />
<strong>England</strong> it is evident that this is a very long way from a random sample. It is clear<br />
from figures 3 to 5 that, even at registration district level, occupational structure is<br />
highly geographically variegated. Figure 8 below demonstrates that this even more<br />
starkly at parish level.<br />
Figure 8 <strong>The</strong> proportion <strong>of</strong> males in the secondary and tertiary sectors in<br />
1813-20 by parish<br />
Given the highly variegated nature <strong>of</strong> occupational structure, a non-random sample <strong>of</strong><br />
even as many as 1,000 units is unlikely to be fully representative <strong>of</strong> the country as a<br />
whole. However, because we have data for all 11,400 parishes and chapelries in<br />
1813-20 then, for whatever area we can get data for periods before 1813, it is possible<br />
to get data for exactly the same area in 1813-20. <strong>The</strong> degree <strong>of</strong> bias caused by<br />
making such a selection in 1813-20 is straightforward to establish. Applying the<br />
same correction factor that would be necessary in 1813-20 to data from earlier<br />
periods this makes it viable to re-weight non-random samples with some degree <strong>of</strong><br />
plausibility. 11<br />
Table 1 shows our raw results. In the first phase <strong>of</strong> coding all occupations were<br />
coded to the primary, secondary or tertiary sectors with the exception <strong>of</strong> labourers.<br />
<strong>The</strong> description ‘labourer’ will, in a majority <strong>of</strong> cases, refer to a labourer in<br />
agriculture. However, not all labourers worked in agriculture and the accurate<br />
11 This is not the only approach to re-weighting the data but it is the only one used in this preliminary<br />
exploration <strong>of</strong> the data. In time we plan to use a variety <strong>of</strong> approaches to re-weighting the data and to<br />
triangulate the different approaches which should serve to limit the possible scale <strong>of</strong> errors to modest<br />
levels.<br />
7
sectoral allocation <strong>of</strong> labourers poses a major methodological problem to which we<br />
will return shortly. <strong>The</strong> first column <strong>of</strong> data in table 1 shows the results from our<br />
non-random sample <strong>c.1710</strong>. <strong>The</strong> second column shows the results for the parallel<br />
sample <strong>of</strong> the same set <strong>of</strong> units in 1813-20 whilst the last column shows the results<br />
for <strong>England</strong> as a whole in 1813-20. It is clear from comparing columns 2 and 3 that<br />
the sample is biased towards parishes with a rather higher than average share <strong>of</strong> the<br />
workforce in the secondary sector, though the bias is not overwhelming.<br />
Table 1<br />
Sectoral occupational breakdowns for <strong>England</strong> in the <strong>c.1710</strong> sample<br />
and in c.1817<br />
SAMPLE<br />
<strong>c.1710</strong><br />
SAMPLE<br />
c.1817<br />
TOTAL<br />
c.1817<br />
Sector % % %<br />
Primary 20.2 12.2 14.9<br />
Secondary 42.5 47.2 39.2<br />
Tertiary 15.4 14.9 17.2<br />
Labourers 22.0 25.7 28.7<br />
TOTAL 100 100 100<br />
N 153,866 349,322 2,605,361<br />
Table 2 documents the re-weighting methodology used here. <strong>The</strong> first column shows<br />
the uncorrected <strong>c.1710</strong> data. <strong>The</strong> second column shows the correction factor used –<br />
which is the ratio <strong>of</strong> the third to second columns in table 1. <strong>The</strong> third column shows<br />
the estimates this generates for national male occupational structure in <strong>c.1710</strong>.<br />
Table 2 Estimating <strong>England</strong>’s male occupational structure <strong>c.1710</strong><br />
SAMPLE<br />
<strong>c.1710</strong><br />
Correction<br />
factor<br />
TOTAL<br />
<strong>c.1710</strong><br />
Sector % %<br />
Primary 20.2 1.2 24.1<br />
Secondary 42.5 0.8 34.5<br />
Tertiary 15.4 1.2 17.4<br />
Labourers 22.0 1.1 24<br />
TOTAL 100 100<br />
Table 3 repeats the estimate for <strong>c.1710</strong> in the first column. In the second column is<br />
our data from 1813-20 and in the third column data for 1851 deriving from the<br />
8
published census. We must now return to the issue <strong>of</strong> how to allocate labourers<br />
between the primary, secondary and tertiary sectors. 12 In 1851, and for later census<br />
derived datasets, this is relatively simple since the census itself divided labourer into<br />
agricultural labourers and other labourers. At that date around 75 per cent <strong>of</strong> all<br />
labourers were agricultural.<br />
Table 3<br />
Estimate <strong>of</strong> <strong>England</strong>’s male occupational structure <strong>c.1710</strong> compared<br />
with 1817 and 1851<br />
<strong>c.1710</strong> 1817 1851<br />
Sector % % %<br />
Primary 24.1 14.9 14.6<br />
Secondary 34.5 39.2 40.1<br />
Tertiary 17.4 17.2 23.1<br />
Labourers 24.0 28.7 21.2<br />
TOTAL 100 100 100<br />
Table 4 below shows our current estimates for the relative size <strong>of</strong> the primary,<br />
secondary and tertiary sectors between <strong>c.1710</strong> and 1871 based on the estimated<br />
occupational structure in 1710 discussed above and some preliminary procedures for<br />
allocating labourers to each sector. For the moment we are making two stylised<br />
assumptions to allow us to allocate these non-agricultural labourers. Firstly, that they<br />
all belong in mining within the primary sector, or within the secondary sector, or in<br />
transport within the tertiary sector. Secondly, that they should be allocated to mining,<br />
the secondary sector and transport in proportion to the size <strong>of</strong> those sectors as<br />
measured before any allocation <strong>of</strong> labourers. In the future we expect to be able to<br />
improve on this method <strong>of</strong> allocating non-agricultural labourers, but any changes are<br />
unlikely to produce major revisions to the results. <strong>The</strong> third and fourth columns <strong>of</strong><br />
table 4 show the results <strong>of</strong> this procedure in 1851 and 1871. For the pre-census<br />
estimates for <strong>c.1710</strong> and 1813-20 we also need to adopt a procedure for allocating<br />
labourers between agriculture and the rest. <strong>The</strong> basis for doing this is discussed<br />
elsewhere. 13 But the basic methodology is to use the share <strong>of</strong> labourers in the nonagricultural<br />
sectors in 1851 in the same area as the basis for the allocation <strong>of</strong><br />
labourers to mining, the secondary sector and transport at earlier dates and to allocate<br />
the residual to agriculture. This procedure results in around 80 per cent <strong>of</strong> all<br />
labourers being allocated to agriculture in both <strong>c.1710</strong> and 1813-20 and the results are<br />
shown in the first and second columns <strong>of</strong> table 4.<br />
One further adjustment has been made to the raw data for 1813-20 to produce the<br />
results shown in table 4. <strong>The</strong> 1813-20 data have been re-weighted by census derived<br />
population data to correct for differing levels <strong>of</strong> under-registration <strong>of</strong> baptisms<br />
between Anglican registration units. This procedure has been fully described<br />
12 For a much fuller discussion <strong>of</strong> this issue and the procedures adopted see Shaw-Taylor L., and<br />
Kitson, P.M., ‘<strong>The</strong> sectoral allocation <strong>of</strong> labourers.’<br />
13 Ibid.<br />
9
elsewhere. 14 As it happens it makes only a modest difference to the national figures.<br />
No such re-weighting has been effected for <strong>c.1710</strong> because we do not currently have<br />
the local population data required for re-weighting. That will change in the future<br />
and may lead to some minor refinement <strong>of</strong> these estimates.<br />
Table 4 Current best guesses for <strong>England</strong>’s male occupational<br />
sectoral distribution <strong>c.1710</strong> to 1871<br />
Sector<br />
<strong>c.1710</strong> 1817 1851 1871<br />
% % % %<br />
Primary 43.4 38.9 30.7 25.2<br />
Secondary 38.7 42.2 45.3 46.8<br />
Tertiary 18.0 18.9 24.0 28<br />
TOTAL 100 100 100 100<br />
Note: <strong>The</strong> figures for 1817 to 1871 are fairly stable though some further adjustments<br />
may be made to the sectoral allocation <strong>of</strong> labourers. <strong>The</strong> figures for 1710 are<br />
provisional and likely to be subject to more change.<br />
Between 1710 and 1817 structural change for <strong>England</strong> as a whole was modest with a<br />
small fall <strong>of</strong> around 10 percent in the primary sector’s share <strong>of</strong> the workforce. This<br />
was mirrored by a modest rise, <strong>of</strong> around 10 per cent, in the secondary share <strong>of</strong> male<br />
employment from 38. 7 per cent to 47.2 and a 4 per cent rise in the tertiary sector’s<br />
share from 18.0 to 18.9 per cent. Structural change consisted largely <strong>of</strong> a shift from<br />
primary to secondary sector employment as might be expected. <strong>The</strong> nineteenth<br />
century pattern was quite different. Between 1813-20 and 1871 the dominant<br />
structural shift was from primary employment to tertiary employment. <strong>The</strong> primary<br />
sector’s share <strong>of</strong> male employment fell by 54 per cent whilst the tertiary sector rose<br />
by 48 per cent. <strong>The</strong> secondary sector’s share <strong>of</strong> employment grew by only 11 per cent<br />
in the same period. Perhaps what is most striking about the new data is that the<br />
primary sector <strong>of</strong> the English economy accounted for less than half <strong>of</strong> male<br />
employment as early as 1710.<br />
<strong>The</strong> virtual absence <strong>of</strong> tertiary growth in the eighteenth century is surprising in the<br />
light <strong>of</strong> our finding that this was most dynamic sector in the nineteenth century. 15<br />
However, it must be borne in mind that these are highly provisional estimates at this<br />
stage so it is possible that future estimates will increase the growth <strong>of</strong> the tertiary<br />
sector somewhat. However, any such effect is unlikely to be large and it is equally<br />
possible that further work will remove or reverse what little tertiary growth we can<br />
measure. <strong>The</strong> remarkably large size <strong>of</strong> the secondary sector is very unlikely to be an<br />
artefact <strong>of</strong> either the crudeness <strong>of</strong> the re-weighting <strong>of</strong> the data used here or <strong>of</strong> the<br />
method <strong>of</strong> allocating labourers. In fact if we allocated all labourers to agriculture in<br />
<strong>c.1710</strong>, an entirely improbable allocation, we would only reduce the secondary<br />
sector’s share <strong>of</strong> male employment to 34.5 per cent. What this suggests is that most<br />
14 Kitson, P.M. et al. ‘<strong>The</strong> creation.’<br />
15 Shaw-Taylor, L et al, ‘<strong>The</strong> occupational structure <strong>of</strong> <strong>England</strong> and Wales c.1817-1881.’<br />
10
<strong>of</strong> the long-term rise in the share <strong>of</strong> secondary sector employment conventionally<br />
associated with the Industrial Revolution antedated <strong>c.1710</strong>.<br />
<strong>The</strong> historiographical implications <strong>of</strong> these data can best be seen by comparing the<br />
data in table 4 with the estimates currently in use by historians. Table 5 shows the<br />
figures used by Nick Crafts which derive from Peter Lindert and Ge<strong>of</strong>frey<br />
Williamson’s reworking <strong>of</strong> Gregory King’s estimates. 16 It should be noted that the<br />
figures are not strictly comparable for three reasons. Firstly, Crafts’ estimates<br />
nominally relate to Britain not <strong>England</strong>. That said, Lindert and Williamson’s data for<br />
1688 relate only to <strong>England</strong> and <strong>England</strong> was, demographically speaking, around 85<br />
per cent <strong>of</strong> Britain. Secondly, Crafts’ data include women as well as men. However,<br />
their inclusion in 1688 is again fairly nominal. 17 Thirdly, Crafts’ data include mining<br />
within the secondary sector. However this was a very small sector in 1688 and<br />
reallocating mining to the secondary sector in our data would only increase the<br />
discrepancy between the two datasets. Our estimate for the share <strong>of</strong> the secondary<br />
sector is slightly more than twice the figure used by Crafts. It is inconceivable that<br />
the caveats just mentioned account for a large proportion <strong>of</strong> the difference between<br />
our estimates and those <strong>of</strong> Crafts.<br />
Table 5 Crafts’ figures for Britain’s labour force shares 1688-1841<br />
1688<br />
%<br />
1759<br />
%<br />
1802-3<br />
%<br />
1841<br />
%<br />
Primary 55.6 48.0 41.7 22.2<br />
Secondary 18.5 23.8 24.7 40.5<br />
Tertiary 25.9 28.2 33.6 37.3<br />
Total 100.0 100.0 100.0 100.0<br />
Note: Table 5 is not strictly comparable with table 4 because Crafts’ data (1)<br />
nominally pertain to Britain (2) nominally include women (3) include mining in the<br />
secondary sector.<br />
It is, <strong>of</strong> course possible, that too many labourers have been allocated to the secondary<br />
sector in <strong>c.1710</strong>. However, even if we allocated all labourers to agriculture in <strong>c.1710</strong><br />
to produce a lower bound figure for the secondary sector we would still end up with<br />
an estimate <strong>of</strong> 35.5 per cent <strong>of</strong> the adult male workforce in the secondary sector<br />
which is still nearly twice the figure used by Crafts. <strong>The</strong> same procedure would<br />
produce an upper bound exercise <strong>of</strong> the proportion <strong>of</strong> the adult male workforce in<br />
agriculture <strong>of</strong> 48.1 per cent which is still substantially below Crafts’ figure <strong>of</strong> 55.6 per<br />
cent in 1688.<br />
It is important to stress that Lindert and Williamson were very open about the need<br />
for more data from parish registers to improve on the work they had begun. 18 <strong>The</strong>ir<br />
own samples consisted only <strong>of</strong> between 27 and 51 parishes in each time period. 19 It<br />
should be very clear from figure 8, that a non-random sample <strong>of</strong> even 50 parishes out<br />
16 Crafts, N.F.R., British economic growth; Lindert, P.H., and Williamson, J.G., ‘Revising <strong>England</strong>’s<br />
social tables’; Lindert, P.H., ‘English occupations, 1670-1811.’<br />
17 Lindert in essence was only able to document women in domestic service and appears therefore not<br />
to have counted women in the primary and secondary sectors. This may go some way towards<br />
explaining why the Lindert and Williamson estimates produce a much larger tertiary sector than the<br />
estimates presented here: Lindert, ‘English occupations.’<br />
18 Lindert, ‘English occupations’, p.711-12.<br />
19 Lindert, ‘English occupations’, p.688.<br />
11
<strong>of</strong> 10,000 carries a heavy risk <strong>of</strong> being very unrepresentative. As table 1 shows the<br />
problem is not eliminated even when the sample is increased twenty or forty-fold to<br />
cover 1,000 registration units. <strong>The</strong>re may be a further source <strong>of</strong> difference between<br />
Lindert and Williamson’s work and our own. We have imposed a very strict data<br />
quality threshold on parish registers for inclusion in our sample. We have only made<br />
use <strong>of</strong> parish registers where for a period <strong>of</strong> one or more years, 95 per cent <strong>of</strong> all<br />
legitimate baptism include the fathers’ occupations. 20 Lindert used burial registers<br />
but it is not clear what level <strong>of</strong> occupational recording was required for a parish to be<br />
included in the sample. 21 It is possible that he set the threshold as low as 70 per cent.<br />
<strong>The</strong> ways in which that might bias the outcome can only be guessed at.<br />
<strong>The</strong> new data indicate that the secondary sector was about twice the size (in<br />
employment terms) that Crafts’ reworking <strong>of</strong> the Lindert and Williamson figures<br />
suggested for the beginning <strong>of</strong> the eighteenth century. It is unlikely that any<br />
subsequent reworking <strong>of</strong> our data will dramatically reduce the size <strong>of</strong> that<br />
discrepancy. While Crafts’ work suggested that the economy was much more<br />
developed in 1688 than Deane and Cole had believed, our work suggests that Crafts’<br />
revisionism did not go far enough. 22 <strong>The</strong> fundamental question this finding opens up<br />
is during what period before <strong>c.1710</strong> did the sustained rise in the relative importance<br />
<strong>of</strong> the secondary sector take place? Further research is currently underway on this<br />
vital question as part <strong>of</strong> the work funded by the Leverhulme Trust. 23<br />
<strong>The</strong> much larger size <strong>of</strong> the secondary sector in <strong>c.1710</strong> implies a much slower growth<br />
in the size <strong>of</strong> the secondary sector during the eighteenth and nineteenth century.<br />
Whilst his this will not affect the estimates made by Crafts and by Crafts and Harley<br />
<strong>of</strong> the rates <strong>of</strong> economic growth in the period it does have major implications for the<br />
our understanding <strong>of</strong> growth rates in sectoral productivity. 24 <strong>The</strong> new findings must<br />
imply that productivity growth in the secondary sector was much greater in the period<br />
than is currently suggested in the national accounts literature. This may in turn imply<br />
that new technology had a much larger impact than is currently argued in that<br />
literature. That said it must be remembered that any increase in productivity could<br />
have been generated by Smithian processes (i.e. an increase in the division <strong>of</strong> labour).<br />
It is our intention, once the data are in a more final form, to investigate formally the<br />
implications for the Crafts-Harley story in collaboration with Crafts.<br />
One <strong>of</strong> the attractions <strong>of</strong> occupational data is that it is possible to examine not just<br />
aggregate trends but regional and local trends too. In the next section <strong>of</strong> the paper I<br />
want to examine, in a highly preliminary way, some differences between the north<br />
and the south <strong>of</strong> <strong>England</strong>. Table 6 shows the male occupational structure for a number<br />
<strong>of</strong> northern counties for which have good data coverage <strong>c.1710</strong>. 25 Table 7<br />
summarises the data we have available for a number <strong>of</strong> non-metropolitan southern<br />
20 This is something <strong>of</strong> a simplification and algorithm used will be detailed in full either in the<br />
expanded version <strong>of</strong> this paper or in a separate publication.<br />
21 Lindert, P.H., ‘English occupations’, p. 689.<br />
22 Deane, P., and Cole, W.A., British economic growth; Crafts, N.F.R., British economic growth.<br />
23 We hope, within twelve months, to be able to map local population densities c.1676 for most <strong>of</strong><br />
<strong>England</strong> and Wales. Since low population densities are characteristic <strong>of</strong> a predominantly agricultural<br />
economy and high population densities are suggestive <strong>of</strong> high levels <strong>of</strong> non agricultural activity this<br />
should provide a robust means <strong>of</strong> assessing the importance <strong>of</strong> non-agricultural employment in 1676.<br />
We also hope to be able to replicate this work for the later medieval period using the poll tax returns <strong>of</strong><br />
1379-81. All this work will be done as part <strong>of</strong> the new project funded by the Leverhulme Trust.<br />
24 Crafts, N.F.R., British economic growth; Crafts, N.F.R., and Harley, K., ‘A restatement.’<br />
25 Cheshire, Lancashire, East Riding <strong>of</strong> Yorkshire, North Riding <strong>of</strong> Yorkshire and the West Riding <strong>of</strong><br />
Yorkshire<br />
12
English counties at that date. 26 In both these tables the re-weighted data have been<br />
used for <strong>c.1710</strong>.<br />
A comparison <strong>of</strong> tables 6 and 7 reveals some striking contrasts. Firstly, secondary<br />
sector employment was substantially higher in the northern counties by <strong>c.1710</strong> than it<br />
was in the southern counties. Thus the north-south differences which are so familiar<br />
in the later period emerged long before the onset <strong>of</strong> mechanisation in the textile sector<br />
in the late eighteenth century. Secondly, whereas secondary sector growth was quite<br />
muted at national level over the eighteenth century it was more rapid in the north <strong>of</strong><br />
<strong>England</strong> rising from 47 per cent to 62 per cent in these counties between <strong>c.1710</strong> and<br />
1813-20. Thirdly, the southern counties experienced a significant level <strong>of</strong> deindustrialisation<br />
over the eighteenth century with secondary sector employment<br />
falling from 39 per cent to 28 per cent and the primary sector rising from 51 per cent<br />
to 61 per cent.<br />
Table 6 Male occupational structure for northern counties <strong>c.1710</strong> and 1813-20<br />
<strong>c.1710</strong> 1817<br />
Sector % %<br />
Primary 39 25<br />
Secondary 47 62<br />
Tertiary 14 13<br />
TOTAL 100 100<br />
<strong>The</strong> counties covered by this table are Cheshire, Lancashire,<br />
East Riding <strong>of</strong> Yorkshire, North Riding <strong>of</strong> Yorkshire and the<br />
West Riding <strong>of</strong> Yorkshire<br />
26 Bedfordshire, Buckinghamshire, Cambridgeshire, Huntingdonshire, Northamptonshire, Oxfordshire, Rutland,<br />
Wiltshire.<br />
13
Table 7 Male occupational structure for southern counties <strong>c.1710</strong> and 1813-20<br />
<strong>c.1710</strong> 1817<br />
Sector % %<br />
Primary 51 61<br />
Secondary 39 28<br />
Tertiary 10 11<br />
TOTAL 100 100<br />
<strong>The</strong> counties covered by this table are Bedfordshire, Buckinghamshire,<br />
Cambridgeshire, Huntingdonshire, Northamptonshire, Oxfordshire, Rutland,<br />
Wiltshire. Counties encompassing parts <strong>of</strong> London have been excluded.<br />
Table 8 shows male secondary sector employment shares in all the counties<br />
represented in tables 6 and 7. Significant de-industrialisation is apparent in every<br />
southern county between <strong>c.1710</strong> and 1813-20. This is true both <strong>of</strong> the county level<br />
estimates shown in columns 3 and 4 and for the sample parishes. It follows that the<br />
effect cannot be an aretefact <strong>of</strong> the re-weighting process. Experience in the north <strong>of</strong><br />
<strong>England</strong> was more varied. Lancashire and the West Riding experienced significant<br />
industrialisation while levels <strong>of</strong> secondary sector employment were broadly stable<br />
elsewhere.<br />
Table 8<br />
Male secondary sector share <strong>c.1710</strong> and c.1817 (percentages)<br />
Sample<br />
<strong>c.1710</strong><br />
Parallel<br />
sample<br />
1817<br />
Estimate<br />
<strong>c.1710</strong><br />
Population<br />
1817<br />
Bedfordshire 26.5 19.5 28.6 21.3<br />
Buckinghamshire 32.1 22.9 29.8 22.1<br />
Cambridgeshire 26.5 17.4 33.4 19.7<br />
Huntingdonshire 27.1 21.9 29.7 22.3<br />
Northamptonshire 38.1 31.4 35.3 28.6<br />
Oxfordshire 32.5 28.6 30.1 26.1<br />
Rutland 28.1 18.5 29.1 23.6<br />
Sussex 26.2 22.4 26.9 23.5<br />
Wiltshire 37.6 26.3 48.7 29.0<br />
Cheshire 35.9 34.8 44.5 42.5<br />
Lancashire 48.0 66.7 46.6 64.2<br />
Warwickshire 41.8 39.8 56.6 52.8<br />
Yorkshire City and Ainsty <strong>of</strong> York 42.8 46.1 39.9 45.2<br />
Yorkshire East Riding 27.9 28.3 26.2 26.7<br />
Yorkshire North Riding 40.2 35.6 33.3 31.0<br />
Yorkshire West Riding 55.4 68.0 48.6 61.4<br />
14
Which sectors were driving de-industrialisation in the south <strong>of</strong> <strong>England</strong>? Table 9<br />
shows estimates <strong>of</strong> male employment shares in textiles. <strong>The</strong> ubiquity <strong>of</strong> the declining<br />
importance <strong>of</strong> textiles in the non-metropolitan south is striking, as is the scale <strong>of</strong> the<br />
decline in Wiltshire. <strong>The</strong> disappearance and decline <strong>of</strong> textile industries in the south<br />
<strong>of</strong> <strong>England</strong> in the eighteenth century is clearly a major component <strong>of</strong> deindustrialisation.<br />
<strong>The</strong> increase in the West Riding is modest but the scale <strong>of</strong> the increase in Lancashire<br />
from 17.8 per cent to 38.3 per cent is more dramatic. It is clear that the rise in<br />
industrial employment in both counties was primarily driven by an expansion <strong>of</strong><br />
textile employment.<br />
Table 10 (below) shows estimates <strong>of</strong> male employment shares in the manufacture <strong>of</strong><br />
clothes. This shows a large fall in every area shown with the sole exception <strong>of</strong> the<br />
city <strong>of</strong> York. On average the decline in the tailoring trades is from around 5 per cent<br />
to around 3 per cent. <strong>The</strong> fact that it affects both the north and the south is<br />
particularly striking. Three possible explanations may be advanced. <strong>The</strong> first, that<br />
the production <strong>of</strong> clothes was declining over the eighteenth century can be dismissed<br />
as improbable without further discussion.<br />
Table 9<br />
Male shares <strong>of</strong> employment in textiles <strong>c.1710</strong> and c.1817 (percentages)<br />
Sample<br />
<strong>c.1710</strong><br />
Parallel<br />
sample<br />
1817<br />
Estimate<br />
<strong>c.1710</strong><br />
Population<br />
1817<br />
Bedfordshire 2.1 0.3 3.5 0.6<br />
Buckinghamshire 2.4 0.5 2.7 0.5<br />
Cambridgeshire 1.7 0.0 6.9 0.1<br />
Huntingdonshire 1.0 0.2 1.5 0.4<br />
Northamptonshire 5.9 1.7 4.8 1.4<br />
Oxfordshire 3.1 1.7 3.0 1.6<br />
Rutland 4.0 0.0 3.7 0.6<br />
Sussex 1.2 0.4 0.6 0.2<br />
Wiltshire 11.7 3.0 28.5 8.4<br />
Cheshire 5.2 6.3 11.1 13.5<br />
Lancashire 22.1 44.5 17.8 38.3<br />
Warwickshire 9.8 11.8 6.4 7.8<br />
Yorkshire City and Ainsty <strong>of</strong> York 3.5 1.8 5.2 3.1<br />
Yorkshire East Riding 2.9 1.1 3.7 1.5<br />
Yorkshire North Riding 8.9 4.3 8.9 4.6<br />
Yorkshire West Riding 20.8 26.5 20.4 28.4<br />
15
Table 10 Male shares <strong>of</strong> employment in clothing <strong>c.1710</strong> and c.1817<br />
(percentages)<br />
Sample<br />
<strong>c.1710</strong><br />
Parallel<br />
sample<br />
1817<br />
Estimate<br />
<strong>c.1710</strong><br />
Population<br />
1817<br />
Bedfordshire 4.7 1.7 5.8 2.3<br />
Buckinghamshire 4.9 2.2 3.2 1.4<br />
Cambridgeshire 3.6 1.3 4.5 1.7<br />
Huntingdonshire 6.8 1.7 6.9 1.9<br />
Northamptonshire 4.6 2.8 3.7 2.3<br />
Oxfordshire 5.4 3.0 4.2 2.4<br />
Rutland 3.9 2.9 3.2 2.5<br />
Sussex 3.9 1.3 3.9 1.3<br />
Wiltshire 3.8 1.4 3.2 1.4<br />
Cheshire 5.7 2.4 9.1 3.8<br />
Lancashire 4.6 3.4 4.2 3.3<br />
Warwickshire 5.6 2.1 12.0 4.6<br />
Yorkshire City and Ain 5.2 7.0 3.4 5.2<br />
Yorkshire East Riding 4.9 3.1 4.7 3.1<br />
A second possible explanation is that this period saw the rise <strong>of</strong> a ready-made clothing<br />
industry in areas not covered by table 10. Some support for this possibility can be<br />
seen in figure 9 below. It is very clear that such an industry had already emerged in<br />
the east Midlands by the early nineteenth century. However, we do not, at present,<br />
know whether this industry came into being during the eighteenth century or began at<br />
an earlier date. More importantly, it seems unlikely that East Midlands industry was<br />
large enough to account for tailoring falling from 5 per cent to 3 per cent <strong>of</strong> the adult<br />
male workforce.<br />
16
Figure 9<br />
<strong>The</strong> percentage <strong>of</strong> adult males employed in the clothing trades<br />
in 1813-20<br />
<strong>The</strong>re is a third possible explanation which is likely to prove to be the key to the<br />
puzzle: the feminization <strong>of</strong> the workforce for the making <strong>of</strong> clothes from the late<br />
seventeenth century. This trend is well documented in the existing literature but has<br />
not been quantified. 27 This new evidence, albeit indirect, would suggest that the<br />
growth <strong>of</strong> female employment in dress-making and related trades was very substantial<br />
over the long eighteenth century. Whereas the existing historiography suggests a rise<br />
in the importance <strong>of</strong> women in the needle trades, the scale <strong>of</strong> the decline in male<br />
employment documented here suggests we may be looking at a wholesale take-over<br />
by women. 28 To the extent that the decline in the male tailoring trades was driven by<br />
feminisation it was not part <strong>of</strong> any process <strong>of</strong> de-industrialisation, so the figures given<br />
in table 7 and 8 may somewhat overstate the scale <strong>of</strong> southern de-industrialisation and<br />
the figures in table 6 may slightly understate the growth <strong>of</strong> the secondary sector in the<br />
north.<br />
27 See the discussion in Amy Erickson, ‘Clockmakers, Milliners and Mistresses: Women Trading in the City<br />
<strong>of</strong> London Companies 1700-1750.’<br />
28 I am grateful to Amy Erickson for this point.<br />
17
Table 11 shows the estimates for the proportion <strong>of</strong> adult males employed in the<br />
tertiary sector <strong>c.1710</strong> and 1813-20. Trends over time were geographically mixed with<br />
many counties experiencing slight rises or slight declines. Both Lancashire and<br />
Rutland show rather peculiar trends which seem improbable. It will be necessary to<br />
inspect the data more closely to see whether these trends are real or artifactual,<br />
perhaps relating to some problem with the dataset. <strong>The</strong> very muted changes in<br />
tertiary employment shares over the eighteenth century in most <strong>of</strong> the counties makes<br />
it unlikely that any more careful re-weighting <strong>of</strong> the data for <strong>c.1710</strong> will produce a<br />
very big shift from our current estimates <strong>of</strong> a minor increase in the importance <strong>of</strong> the<br />
tertiary sector over the eighteenth century, though it would not take much <strong>of</strong> a change<br />
to transform this from a stable trend <strong>of</strong> to a slight decrease. <strong>The</strong> very high figures for<br />
Middlesex and Surrey reflect the great importance <strong>of</strong> the tertiary sector in the<br />
Metropolis even at the beginning <strong>of</strong> the eighteenth century.<br />
Table 11<br />
<strong>The</strong> percentage <strong>of</strong> adult males employed in the tertiary sector<br />
(percentages).<br />
Sample<br />
<strong>c.1710</strong><br />
Parallel<br />
sample<br />
1817<br />
Estimate<br />
<strong>c.1710</strong><br />
Population<br />
1817<br />
Bedfordshire 8.9 8.7 8.6 9.3<br />
Buckinghamshire 11.7 12.2 9.9 10.4<br />
Cambridgeshire 8.7 8.6 10.6 10.8<br />
Huntingdonshire 15.5 13.8 12.9 12.2<br />
Northamptonshire 10.6 13.4 8.9 11.2<br />
Oxfordshire 13.2 14.9 11.9 13.2<br />
Rutland 12.5 4.2 24.7 9.5<br />
Sussex 6.6 11.9 8.4 16.3<br />
Wiltshire 9.7 10.7 7.4 9.5<br />
Cheshire 12.7 14.3 11.9 14.1<br />
Lancashire 14.6 10.3 18.8 13.1<br />
Warwickshire 7.3 9.2 9.7 12.5<br />
Yorkshire City and Ainsty <strong>of</strong> York 38.0 39.7 21.7 25.1<br />
Yorkshire East Riding 16.2 18.4 14.7 17.9<br />
Yorkshire North Riding 10.2 15.4 8.6 15.1<br />
Yorkshire West Riding 6.6 7.2 7.0 8.6<br />
Middlesex 32.3 33.7 39.6 41.8<br />
Surrey 14.7 17.0 28.2 30.1<br />
Table 4 and tables 6 through 11 document the changing male occupational<br />
structure over the period <strong>c.1710</strong> to 1813-20. But they shed no light on the subperiods<br />
within this century in which the various shifts document were occurred.<br />
At the national level it is currently too early too provide an answer. In due<br />
18
course, when we have completed our parish register data collection for the<br />
eighteenth century and have integrated these data with our militia list datasets<br />
(mainly for southern <strong>England</strong>) for the second half <strong>of</strong> the eighteenth century we<br />
will be able to answer this question. At present we can only provide a tentative<br />
answer for the counties <strong>of</strong> northern <strong>England</strong> because these are the only areas for<br />
which we have data in a consistent format at dates intermediate between <strong>c.1710</strong><br />
and 1813-20. Table 12 shows the estimates currently available. While the<br />
importance <strong>of</strong> the secondary sector appears more or less stable over the course<br />
<strong>of</strong> these 100 years in Cheshire and most <strong>of</strong> Yorkshire, the sustained increases in<br />
the West Riding <strong>of</strong> Yorkshire and in Lancashire, driven primarily by an<br />
expansion <strong>of</strong> textile employment, appear to come to an end by 1785. It<br />
therefore follows that the increase in the relative importance <strong>of</strong> male secondary<br />
sector employment in the northern counties almost entirely antedates the<br />
beginnings <strong>of</strong> mechanisation in the late eighteenth century. Whilst we are not in<br />
a position to examine the de-industrialisation which took place in much <strong>of</strong><br />
southern <strong>England</strong> between <strong>c.1710</strong> and 1813-20 it seems likely that much <strong>of</strong> this<br />
post-dated 1785 because that de-industrialisation was probably caused by the<br />
mechanisation in the north. 29<br />
Table 12 Percentage <strong>of</strong> adult males employed in the secondary sector in<br />
Northern counties c.1720 to 1813-20<br />
Year 1720 1755 1785 1817<br />
Cheshire 44.5 40.5 41.0 43.5<br />
Lancashire 46.6 62.3 67.4 64.1<br />
Yorkshire City and Ainsty <strong>of</strong> York 39.9 44.5 43.3 43.0<br />
Yorkshire East Riding 26.2 27.6 26.8 26.4<br />
Yorkshire North Riding 33.3 30.9 30.1 29.0<br />
Yorkshire West Riding 48.6 52.5 60.6 60.8<br />
Conclusions<br />
<strong>The</strong> estimates provided in this paper are highly provisional for the reasons set<br />
out above. More work is required on ways <strong>of</strong> extrapolating from the nonrandom<br />
sample and on the sectoral allocation <strong>of</strong> labourers to produce national<br />
estimates. However, these estimates are almost certainly more robust than the<br />
figures used by Crafts based on Lindert and Williamson’s reworking <strong>of</strong> Gregory<br />
King’s famous social tables and they suggest that the secondary sector was<br />
almost twice as large at the beginning <strong>of</strong> the eighteenth century as current<br />
orthodoxy suggests. It is therefore clear that most <strong>of</strong> the growth in the relative<br />
size <strong>of</strong> the secondary sector normally associated with the classic Industrial<br />
Revolution period, say 1750 to 1850, had already taken place by 1710. <strong>The</strong><br />
growth <strong>of</strong> the secondary sector’s share <strong>of</strong> male employment across the<br />
eighteenth century was modest for <strong>England</strong> as a whole. In the north <strong>of</strong> <strong>England</strong><br />
the growth in the relative importance <strong>of</strong> the secondary sector had peaked by<br />
1785. It is likely that much <strong>of</strong> the de-industrialisation in the south took place<br />
29 <strong>The</strong> virtual disappearance <strong>of</strong> the worsted industry from Northamptonshire can be shown to date from<br />
the very end <strong>of</strong> the eighteenth century and coincides with the onset <strong>of</strong> mechanisation in the West<br />
Riding. See Shaw-Taylor L., and Jones, A., ‘<strong>The</strong> male occupational structure <strong>of</strong> Northamptonshire.’<br />
19
etween 1785 and 1813-20 and it is therefore quite possible that nationally the<br />
secondary sector’s share <strong>of</strong> male employment actually fell somewhat in that<br />
period. It is certainly the case that the vast bulk <strong>of</strong> the increase in the secondary<br />
sector’s share <strong>of</strong> total male employment preceded the onset <strong>of</strong> mechanisation in<br />
the late eighteenth century. Outside London the south <strong>of</strong> <strong>England</strong> experienced<br />
substantial de-industrialisation as formerly successful textile industries<br />
collapsed or declined.<br />
We are not yet in a position to present data on long-term trends in female<br />
employment. However, it is possible, and arguably probable, that if we were, it<br />
would show that total female employment contracted sharply at the national<br />
level at the turn <strong>of</strong> the eighteenth and nineteenth centuries because the<br />
mechanisation <strong>of</strong> wool and worsted spinning in the West Riding swept away the<br />
traditional industrial employment <strong>of</strong> hundreds <strong>of</strong> thousands <strong>of</strong> women outside<br />
the industrialising north-west. Craig Muldrew has estimated that by 1780 most<br />
adult women in <strong>England</strong> may have been involved in spinning wool and<br />
worsted. 30 By 1851 outside parts <strong>of</strong> Lancashire, the West Riding and north-east<br />
Cheshire and a number <strong>of</strong> very small textile districts elsewhere, female<br />
employment in spinning was almost non-existent. 31 <strong>The</strong> decline in female<br />
participation rates documented for Corfe Castle between 1793 and 1851 by<br />
Osamu Saito, driven by the extinction <strong>of</strong> hand spinning, was probably typically<br />
<strong>of</strong> most parts <strong>of</strong> <strong>England</strong> and Wales. 32 By 1851 employment in textiles was<br />
fairly evenly split between males and females. All <strong>of</strong> the accounts we have <strong>of</strong><br />
textile employment prior to mechanisation suggest far more women were<br />
required to spin than men to weave. Thus it seems likely that the decline in<br />
male employment in the textile sector, so visible in our data, was paralleled,<br />
over a wider area by a substantially greater loss <strong>of</strong> female employment. If this<br />
line <strong>of</strong> reasoning turns out to be correct, and it clearly requires empirical testing,<br />
then overall secondary sector employment may well have been significantly<br />
lower in 1813-20 than earlier in the 1780s and possibly lower than at the<br />
beginning <strong>of</strong> the eighteenth century.<br />
Whether this is so or not, the male evidence on its own suggests that the rise in<br />
the productivity <strong>of</strong> the secondary sector as a whole over the eighteenth century<br />
must have been substantially greater than the national accounts literature<br />
currently suggests. If the speculative argument about a sharp decline in female<br />
employment is correct the estimates <strong>of</strong> productivity increases will need be<br />
increased that much further. Whilst much <strong>of</strong> these productivity increases may<br />
have been caused by Smithian growth it is possible, and perhaps likely that the<br />
bulk <strong>of</strong> this increase was caused by technological improvements. If that turns<br />
out to be so, then the new data on occupational structure will push our narrative<br />
<strong>of</strong> the classic Industrial Revolution period back to a much greater emphasis on<br />
the productive impact <strong>of</strong> new technology than has been the case in recent<br />
years. 33<br />
30 Muldrew, J.C. ‘Th’ancient distaff’ and whirling spindle.’<br />
31 Shaw-Taylor, L., ‘Diverse experiences’<br />
32 Saito, O., ‘Who worked when?’<br />
33 This chimes neatly with the emphasis on technological change in the recent books by Bob Allen and<br />
Joel Mokyr: Allen, R.C., <strong>The</strong> British Industrial Revolution; Mokyr, J., <strong>The</strong> enlightened economy.<br />
20
One fascinating feature <strong>of</strong> the new findings is the sharp contrast between the<br />
nature <strong>of</strong> structural change in male employment in the eighteenth century and in<br />
the nineteenth century. 34 In the nineteenth century structural change consisted<br />
very largely <strong>of</strong> a relative shift out <strong>of</strong> agricultural employment and into tertiary<br />
employment. In the eighteenth century the relative shift was very largely out <strong>of</strong><br />
agricultural employment and into secondary sector employment. Why<br />
structural change should be so different in these two periods is a question <strong>of</strong><br />
great importance which will need to be fully investigated. For the moment a<br />
preliminary speculation will have to suffice.<br />
It is possible that down to about 1780 technological change had produced a very<br />
limited increase in aggregate levels <strong>of</strong> productivity in the secondary sector. As<br />
Crafts and Wrigley have argued, high productivity agriculture released labour to<br />
low productivity industry. 35 But, once mechanisation began in earnest, perhaps<br />
very large increases in the overall output <strong>of</strong> the secondary sector were possible<br />
without significant increases in labour inputs. <strong>The</strong> secondary sector’s share <strong>of</strong><br />
the workforce may therefore have grown only modestly in relative importance,<br />
if at all. Whilst it may be true that GDP per capita was increasing only very<br />
modestly in the late eighteenth century it is <strong>of</strong>ten overlooked that GDP itself<br />
was growing very rapidly, because population was growing very rapidly. <strong>The</strong><br />
very rapid growth in the overall size <strong>of</strong> the economy, the increasing spatial<br />
concentration <strong>of</strong> the population (inadequately described as ‘urbanisation’) and<br />
the increasing specialisation <strong>of</strong> the north in manufacturing and the south in the<br />
production <strong>of</strong> foodstuffs meant much larger quantities <strong>of</strong> primary and secondary<br />
products needed to be moved around the country. Over half <strong>of</strong> male<br />
employment in the tertiary sector in this period was accounted for by the<br />
distributive trades: wholesaling, shop-keeping and transport. It may be that the<br />
majority <strong>of</strong> tertiary growth in the nineteenth century was required simply to<br />
move the greatly increased output <strong>of</strong> primary and secondary goods longer<br />
average distances around the country. If this is the case then the rise <strong>of</strong> the<br />
tertiary sector was caused, at least in part, by the marked expansion in the<br />
productivity <strong>of</strong> other sectors and in that sense heralds the onset <strong>of</strong> modern<br />
economic growth.<br />
Bibliography<br />
Allen, R.C., <strong>The</strong> British Industrial Revolution in global perspective (2009).<br />
Crafts, N.F.R., British economic growth during the industrial revolution (1985).<br />
Crafts, N.F.R., and Harley, C. K., ‘Output growth and the Industrial Revolution: A<br />
restatement <strong>of</strong> the Crafts-Harley view’. Economic History Review (1992) 45, pp. 703-<br />
30.<br />
Mokyr, J., <strong>The</strong> Enlightened Economy: An Economic History <strong>of</strong> Britain 1700-1850<br />
(2009).<br />
Lindert, P.H., and Williamson, J.G., ‘Revising <strong>England</strong>’s social tables 1688-1812’,<br />
Explorations in Economic History 19, 385-408 (1982).<br />
Lindert, P.H., ‘English occupations, 1670-1811’, Journal <strong>of</strong> Economic History, XL, 4<br />
(1980), pp. 685-712.<br />
34 Shaw-Taylor, et al, ‘<strong>The</strong> occupational structure <strong>of</strong> <strong>England</strong> and Wales c.1817-1881.’<br />
35 Wrigley, E.A., Continuity chance and change; Crafts, N.F.R., British economic growth.<br />
21
Saito, O, ‘Who worked when? Life-time pr<strong>of</strong>iles <strong>of</strong> labour force participation in<br />
Cardington and Corfe Castle in the late eighteenth and mid-nineteenth century’, in<br />
Goose, N., (ed.) Women’s work in Industrial <strong>England</strong>: Regional and local<br />
perspectives (2007), pp. 209-227.<br />
Shaw-Taylor, L., ‘Diverse experiences: the geography <strong>of</strong> adult female employment<br />
and the 1851 census’ in Goose, N., (ed.) Women’s work in Industrial <strong>England</strong>:<br />
Regional and local perspectives (2007), pp. 29-50.<br />
Wrigley, E.A., Continuity chance and change: <strong>The</strong> character <strong>of</strong> the Industrial<br />
Revolution in <strong>England</strong> (1988).<br />
Unpublished papers<br />
Erickson, A.L., ‘Clockmakers, milliners and mistresses: Women trading in the City <strong>of</strong><br />
London companies 1700-1750.’ (2010), unpub. paper available as paper 16 at<br />
http://www.geog.cam.ac.uk/research/projects/occupations/abstracts/<br />
Kitson, P.M., Shaw-Taylor, L., Wrigley, E.A., Davies, R.S., Newton, G., and Satchell,<br />
A.E.M., ‘<strong>The</strong> creation <strong>of</strong> a ‘census’ <strong>of</strong> adult male employment for <strong>England</strong> and<br />
Wales for 1817’ (2010) available as paper 3 at<br />
http://www.geog.cam.ac.uk/research/projects/occupations/britain19c/papers.html<br />
Muldrew, J.C.M., ‘”Th’ancient distaff’ and whirling spindle”: Measuring the<br />
contribution <strong>of</strong> spinning to household earnings and the national economy in <strong>England</strong><br />
1550-1770’, forthcoming Economic History Review.<br />
Shaw-Taylor L., and Jones, A., ‘<strong>The</strong> male occupational structure <strong>of</strong> Northamptonshire<br />
1777-1881: A case <strong>of</strong> partial de-industrialization?’ Available as paper 5 at<br />
http://www.geog.cam.ac.uk/research/projects/occupations/abstracts/<br />
Shaw-Taylor, L., and Kitson, P., ‘'<strong>The</strong> sectoral allocation <strong>of</strong> labourers <strong>c.1710</strong>-1911:<br />
towards an optimal methodology’, forthcoming at<br />
http://www.geog.cam.ac.uk/research/projects/occupations/britain19c/papers.html as<br />
paper 8.<br />
Shaw-Taylor, L., and Wrigley, E.A., ‘<strong>The</strong> <strong>Occupational</strong> <strong>Structure</strong> <strong>of</strong> <strong>England</strong> c.1750-<br />
1871: A Preliminary Report’ available at:<br />
http://www.geog.cam.ac.uk/research/projects/occupations/abstracts/ as paper 1.<br />
Shaw-Taylor, L., Wrigley, E.A., Davies, R.S., Kitson, P.M., Newton, G., and Satchell,<br />
A.E.M, ‘<strong>The</strong> occupational structure <strong>of</strong> <strong>England</strong> and Wales c.1817-1881’ available as<br />
paper 4 at<br />
http://www.geog.cam.ac.uk/research/projects/occupations/britain19c/papers.html<br />
Digital datasets<br />
UK Data Archive, SN4177, Schürer, K., and Woollard, M., 1881 Census for <strong>England</strong><br />
and Wales, the Channel Islands and the Isle <strong>of</strong> Man (Enhanced Version).<br />
22