Annual Report 2003 - Hannover Re
Annual Report 2003 - Hannover Re
Annual Report 2003 - Hannover Re

You also want an ePaper? Increase the reach of your titles
YUMPU automatically turns print PDFs into web optimized ePapers that Google loves.
Management report<br />
life and health reinsurance<br />
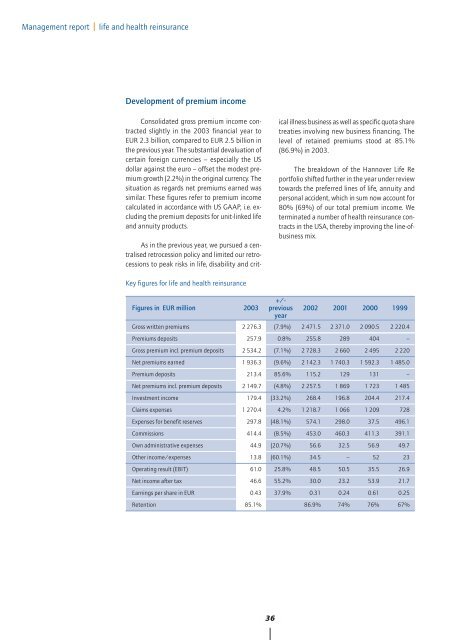
Development of premium income<br />
Consolidated gross premium income contracted<br />
slightly in the <strong>2003</strong> financial year to<br />
EUR 2.3 billion, compared to EUR 2.5 billion in<br />
the previous year. The substantial devaluation of<br />
certain foreign currencies – especially the US<br />
dollar against the euro – offset the modest premium<br />
growth (2.2%) in the original currency. The<br />
situation as regards net premiums earned was<br />
similar. These figures refer to premium income<br />
calculated in accordance with US GAAP, i.e. excluding<br />
the premium deposits for unit-linked life<br />
and annuity products.<br />
As in the previous year, we pursued a centralised<br />
retrocession policy and limited our retrocessions<br />
to peak risks in life, disability and critical<br />
illness business as well as specific quota share<br />
treaties involving new business financing. The<br />
level of retained premiums stood at 85.1%<br />
(86.9%) in <strong>2003</strong>.<br />
The breakdown of the <strong>Hannover</strong> Life <strong>Re</strong><br />
portfolio shifted further in the year under review<br />
towards the preferred lines of life, annuity and<br />
personal accident, which in sum now account for<br />
80% (69%) of our total premium income. We<br />
terminated a number of health reinsurance contracts<br />
in the USA, thereby improving the line-ofbusiness<br />
mix.<br />
Key figures for life and health reinsurance<br />
Figures in EUR million<br />
<strong>2003</strong><br />
+/-<br />
previous<br />
year<br />
2002 2001 2000 1999<br />
Gross written premiums 2 276.3 (7.9%) 2 471.5 2 371.0 2 090.5 2 220.4<br />
Premiums deposits 257.9 0.8% 255.8 289 404 –<br />
Gross premium incl. premium deposits 2 534.2 (7.1%) 2 728.3 2 660 2 495 2 220<br />
Net premiums earned 1 936.3 (9.6%) 2 142.3 1 740.3 1 592.3 1 485.0<br />
Premium deposits 213.4 85.6% 115.2 129 131 –<br />
Net premiums incl. premium deposits 2 149.7 (4.8%) 2 257.5 1 869 1 723 1 485<br />
Investment income 179.4 (33.2%) 268.4 196.8 204.4 217.4<br />
Claims expenses 1 270.4 4.2% 1 218.7 1 066 1 209 728<br />
Expenses for benefit reserves 297.8 (48.1%) 574.1 298.0 37.5 496.1<br />
Commissions 414.4 (8.5%) 453.0 460.3 411.3 391.1<br />
Own administrative expenses 44.9 (20.7%) 56.6 32.5 56.9 49.7<br />
Other income/expenses 13.8 (60.1%) 34.5 – 52 23<br />
Operating result (EBIT) 61.0 25.8% 48.5 50.5 35.5 26.9<br />
Net income after tax 46.6 55.2% 30.0 23.2 53.9 21.7<br />
Earnings per share in EUR 0.43 37.9% 0.31 0.24 0.61 0.25<br />
<strong>Re</strong>tention 85.1% 86.9% 74% 76% 67%<br />
36