East African Breweries Limited - Imara
East African Breweries Limited - Imara
East African Breweries Limited - Imara

Create successful ePaper yourself
Turn your PDF publications into a flip-book with our unique Google optimized e-Paper software.
<strong>East</strong> <strong>African</strong> <strong>Breweries</strong> <strong>Limited</strong><br />
FY 2011 Results & Update - Geared up for regional opportunities in the wake of an exigent<br />
environment in the key market…<br />
07 October 2011<br />
Analyst<br />
Batanai Matsika<br />
+263 772 889 556<br />
batanai.matsika@imara.co<br />
www.imara.co
EQUITY RESEARCH<br />
KENYA<br />
1<br />
07 October 2011<br />
BREWERIES/BEVERAGES<br />
EAST AFRICAN BREWERIES LIMITED<br />
Geared up for regional opportunities in the wake of an<br />
exigent environment in the key market…<br />
EABL has recently concluded the consolidation of Serengeti<br />
<strong>Breweries</strong> <strong>Limited</strong> (SBL) and is now in the final stages of<br />
relinquishing its 20% stake in Tanzania <strong>Breweries</strong> <strong>Limited</strong><br />
(TBL) through a public offering in the next few months. SBL is<br />
one of EABL’s “strategic acquisitions” and is expected to<br />
deliver incremental sales and profit growth in the future.<br />
While short term prospects in the key market (Kenya) remain<br />
bleak on the back of skyrocketing inflation (c17%) and a<br />
weakening currency (about KES 100/USD 1.00), the group is<br />
consolidating its position as a leading alcoholic beverage<br />
company within the <strong>East</strong>ern Africa region.<br />
• Other consolidation opportunities in the region still<br />
exist. We see further M&A opportunities in which EABL<br />
may participate in the <strong>East</strong> <strong>African</strong> region. In a recent<br />
development, Diageo (EABL’s parent company) won a<br />
bid to buy Ethiopia's last-remaining state brewery (Meta<br />
Abo) for USD 225.0m. Indications are that the new<br />
operation will be consolidated into EABL.<br />
• We like management’s focus on cost control. EABL<br />
management has focused more on improving the group’s<br />
operational efficiencies. This has entailed price hedging<br />
for sugar and cereals and outsourcing operations such as<br />
logistics and warehousing. The group has also embarked<br />
on a “brand-value engineering” strategy that essentially<br />
substitutes malt and barley with “cheaper sorghum”.<br />
• Valuation upside. A combination of our two valuation<br />
techniques yields a target price of KES 187 per share.<br />
The share price has taken a knock from its 52-wk high of<br />
KES 230 per share. We think prospects in the region are<br />
encouraging and therefore upgrade our recommendation<br />
from HOLD to Long Term BUY.<br />
BLOOMBERG: EABL:KN<br />
LT BUY<br />
Current Price (KES) 157.00<br />
Current Price (USD) 1.57<br />
Target Price (KES) 187.00<br />
Target Price (USD) 1.87<br />
Upside/ Downside 19.1%<br />
Liquidity<br />
Market Cap (KESm) 124,152<br />
Market Cap (USDm) 1,242<br />
Shares (m) 790.8<br />
Free Float 50%<br />
Ave. Daily vol ('000) 174<br />
Share Price Performance<br />
6 Months (KES) 195 -19.5%<br />
Relative change (%)* -1.9%<br />
12 Months (KES) 192 -18.2%<br />
Relative change (%)* -1.8%<br />
*Relative to MSCI Frontier Market Index<br />
Financials (KESm)-FY 30 June 2011 2012F 2013F<br />
Turnover 44,895 51,629 58,083<br />
EBITDA 14,984 17,038 19,400<br />
Attributable earnings 7,353 8,459 9,164<br />
EPS (KES) 9.3 10.7 11.6<br />
DPS (KES) 8.8 10.1 10.9<br />
NAV/share (KES) 26.9 35.3 36.9<br />
Ratios 2011 2012F 2013F<br />
D/E Ratio 18.4% 16.1% 17.8%<br />
RoaA 16.7% 16.4% 16.1%<br />
RoaE 34.9% 34.4% 32.1%<br />
EV/EBITDA 7.5 5.9 5.4<br />
EV/hl (USD) 134.9 111.3 109.4<br />
PBV (x) 5.8 4.4 4.3<br />
PER (x) 16.9 14.7 13.5<br />
Earnings Yield 5.9% 6.8% 7.4%<br />
Dividend Yield 5.6% 6.4% 6.9%<br />
EBITDA Margin 33.4% 33.0% 33.4%<br />
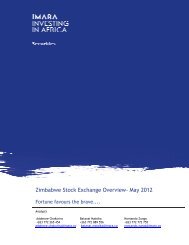
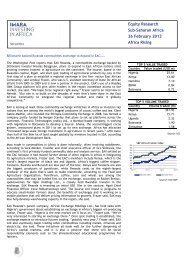
250<br />
EABL: Price Vs Volume<br />
3,000,000<br />
STRENGTHS<br />
Low levels of gearing<br />
WEAKNESSES<br />
Susceptible to fiscal constraints<br />
200<br />
2,500,000<br />
Supply optimisation and cost leadership<br />
Strong regional presence<br />
Heavily taxed products relative to SSA peers<br />
Growth of illicits/parallels/counterfeits<br />
150<br />
2,000,000<br />
Diverse product portfolio that suits<br />
different market segments<br />
in main markets affects the groups<br />
competitive strengths<br />
100<br />
1,500,000<br />
1,000,000<br />
Reduced reliance on barley through use<br />
of sorghum to lower production costs<br />
OPPORTUNITIES<br />
THREATS<br />
50<br />
500,000<br />
Further regional expansion-Ethiopia, SSudan<br />
Spirits opportunity<br />
Excise duty increases<br />
Drought threats in the EAC region<br />
-<br />
02-Jan-09<br />
02-Mar-09<br />
02-May-09<br />
02-Jul-09<br />
02-Sep-09<br />
02-Nov-09<br />
02-Jan-10<br />
02-Mar-10<br />
02-May-10<br />
02-Jul-10<br />
02-Sep-10<br />
02-Nov-10<br />
02-Jan-11<br />
02-Mar-11<br />
02-May-11<br />
02-Jul-11<br />
02-Sep-11<br />
-<br />
Growing middle class population<br />
Harmonisation of tax regimes in Kenya<br />
as a result of an intergration of EAC<br />
economies<br />
High oil/ energy prices<br />
Competition-SABMillers' competitive<br />
aspirations in Kenya<br />
Weakening of KES and Inflation<br />
Volume-RHS<br />
Price-LHS (KES)<br />
Privatisation of breweries in <strong>East</strong> Africa<br />
Increased legislation in Kenya & Uganda<br />
1
<strong>Imara</strong> Africa Securities<br />
Nature of Operations<br />
<strong>East</strong> <strong>African</strong> <strong>Breweries</strong> <strong>Limited</strong> (EABL) is an alcohol beverage<br />
business whose main operations are in Kenya while it also has<br />
a footprint in Uganda and Tanzania. EABL also exports its<br />
products to Rwanda, Burundi and Southern Sudan. The<br />
company has breweries, distilleries, support industries and a<br />
distribution network across the <strong>East</strong> <strong>African</strong> region. Core<br />
brands include the Kenya’s leading brand – Tusker (the<br />
flagship brand and a Kenyan icon). Other brands include<br />
Tusker Malt, Pilsner, White Cap, White Cap Light, Senator,<br />
Guinness, Allsopps, President and the latest addition,<br />
Windhoek Lager.<br />
Market developments and background<br />
Back to the old days of price wars. Tusker, which is brewed<br />
by Kenya <strong>Breweries</strong> <strong>Limited</strong>, is the most popular beer in<br />
Kenya. It is popularly known as "Keroro" beer. It is worth<br />
noting that Tusker is a source of Kenyan pride, highlighted in<br />
the late 1990s, where EABL played the patriotic card to win a<br />
marketing war against Castle <strong>Breweries</strong> (now Tanzania<br />
<strong>Breweries</strong> <strong>Limited</strong>), a subsidiary of SABMiller. In the nasty<br />
media campaign that followed, Castle, which had constructed<br />
a multi-million dollar brewery in the industrial town of Thika,<br />
was depicted as foreign and uncommitted to Kenya. The<br />
prolonged marketing wars came to an end in 2002, when the<br />
two brewers reached a settlement in which they carved out<br />
the beer market in <strong>East</strong> Africa among themselves. Castle<br />
agreed to exit Kenya, and EABL decided to leave the<br />
Tanzanian market to the SABMiller subsidiary. This was<br />
followed by a selling and distribution agreement between<br />
Tanzania <strong>Breweries</strong> (SABMiller) and EABL (Diageo). However,<br />
this has since been reversed as EABL will now “go it alone’ in<br />
the Tanzanian market through its investment in Serengeti<br />
<strong>Breweries</strong> limited (SBL). Meanwhile, SABMiller has agreed to<br />
sell its 20% in Kenya <strong>Breweries</strong> <strong>Limited</strong> for about KES 19.5bn<br />
and has made it public that it is keen to “set up shop” in the<br />
Kenyan market.<br />
<strong>East</strong> Africa remains one of the most attractive beer markets<br />
in SSA. Generally, growth of beer production in the EAC<br />
region has largely been led by Kenya, which is well ahead of<br />
other countries. EABL is the largest brewer in the region and<br />
has a total production capacity in the region of 13.0m hl. The<br />
other major player in the region is SABMiller, which has about<br />
c70% market share in Tanzania and 52% in Uganda. EABL<br />
commands approximately 90% of the beer market in Kenya,<br />
c30% in Tanzania and c45% in Uganda.<br />
FY 2011 Financial Results Overview<br />
Results showed 16% top-line growth. After consolidating<br />
with SBL, the group reported net sales growth of 16.1% y-o-y<br />
to KES 44.9bn (USD 439.1m). The growth was commendable<br />
given the exigent operating environment in the form of the<br />
full effects of the Alcoholic Drinks and Control Act that was<br />
introduced in November 2010 in Kenya. Furthermore, clear<br />
beer pricing in Kenya was affected by an increase in excise<br />
taxes. In Uganda, the use of sachets was discontinued.<br />
Competition in Uganda, Tanzania and Southern Sudan remains<br />
largely heated. Overall, clear beer constituted c75% to total<br />
sales, spirits, 20% and CSDs, 5%.<br />
<strong>East</strong> <strong>African</strong> <strong>Breweries</strong> <strong>Limited</strong><br />
FY 2011 Results & Update<br />
Top 5 Shareholder's List<br />
Diageo Kenya <strong>Limited</strong> 42.82%<br />
Diageo Holdings Netherlands BV 4.55%<br />
Board of Trustees NSSF Board 4.55%<br />
Guinness Overseas Ltd 2.61%<br />
CFC Stanbic Nominees 2.37%<br />
Source: IAS<br />
<strong>East</strong> <strong>African</strong> <strong>Breweries</strong> <strong>Limited</strong><br />
Kenya <strong>Breweries</strong> <strong>Limited</strong> (100%)<br />
Uganda <strong>Breweries</strong> <strong>Limited</strong> (98.2%)<br />
UDV Kenya (46%)<br />
EABL Tanzania <strong>Limited</strong> (100%)<br />
Serengeti <strong>Breweries</strong> <strong>Limited</strong> (51%)<br />
Income Statement (KESm) FY 2010 FY 2011 % ∆<br />
Net Revenue 38,679 44,895 16.1%<br />
COS (19,537) (22,831) 16.9%<br />
Gross profit 19,142 22,064 15.3%<br />
Operating Profit 11,256 12,412 10.3%<br />
Net finance charge 169 (163)<br />
Income from associate 1,144 0<br />
Profit before tax 12,569 12,249 -2.5%<br />
Taxation (3,731) (3,235) -13.3%<br />
Profit after tax 8,838 9,014 2.0%<br />
Attributable earnings 7,179 7,353 2.4%<br />
EPS (KES) 9.08 9.30 2.4%<br />
DPS(KES) 8.75 8.75 0.0%<br />
Balance Sheet (KESm) FY 2010 FY 2011 % ∆<br />
Total Assets 38,421 49,712 29.4%<br />
NAV 23,953 26,888 12.3%<br />
Current Assets 17,359 16,320 -6.0%<br />
Current Liabilities 11,684 15,509 32.7%<br />
Current ratio 1.49 1.05<br />
Cash flow (KESm) FY 2010 FY 2011<br />
Operating activities 12,203 8,878<br />
Investing activities (3,236) (9,735)<br />
Financing activities (7,560) (6,360)<br />
Net cash increase/decrease 1,407 (7,217)<br />
2
<strong>Imara</strong> Africa Securities<br />
Sales volumes up despite a strain on disposable incomes.<br />
Another exciting highlight is that total sales volumes were up 15%<br />
(including SBL). This was achieved through expanded volumes in<br />
the beer and spirits categories. It is worth mentioning that the<br />
group-wide spirits portfolio grew by 56% on the year, indicating<br />
rising demand. There was generally a stable tax regime in the<br />
spirits category. Furthermore, a turnaround in Uganda <strong>Breweries</strong><br />
<strong>Limited</strong> (UBL) in H2 2011 was a major contributor to the increase<br />
in volumes.<br />
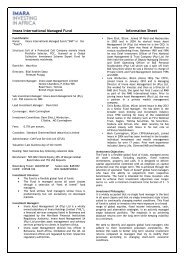
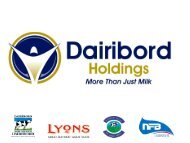
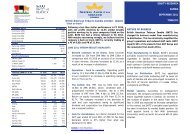
FY 2011: Revenues Spit by Product<br />
Spirits, 20%<br />
<strong>East</strong> <strong>African</strong> <strong>Breweries</strong> <strong>Limited</strong><br />
FY 2011 Results & Update<br />
CSDs, 5%<br />
Marginal decline in margins. For FY 2011, operating cost<br />
increases on fuel, electricity and the high cost of raw materials<br />
affected the group’s margins. The GP margin declined marginally<br />
by 34 basis points to 49.1% and the cost of goods sold (COGS)<br />
increased 17%. The OP margin lost 145 basis points to 27.6%. The<br />
group registered operating profit growth of 10.3% y-o-y to KES<br />
12.4bn (USD 121.4m).<br />
Source: IAS/Company Reports<br />
Beer, 75%<br />
Profit before tax down 2.5%. PBT of KES 2.25bn (USD 120.0m) was<br />
2.5% lower than the FY 2010 figure. The PBT margin deteriorated<br />
by 521 basis points to 27.3%. This was largely due to the fact that<br />
EABL did not recognise its share of associate, Tanzania <strong>Breweries</strong><br />
<strong>Limited</strong> (TBL). Its 20% stake in TBL was reclassified as available for<br />
sale in 2010. EABL expects to conclude the disposal process,<br />
through a public offer for sale, by the end of October 2011.<br />
A flat performance on the bottom line. The brewer registered<br />
profit after tax of KES 9.0bn (USD 88.2m), representing a 2.0%<br />
growth on FY 2010, as margins declined to 20.1% versus 22.8% in<br />
the prior period. Broadly speaking, we note that performance for<br />
the group was largely affected by once-off integration and capex<br />
costs associated with SBL. Overall, a total dividend payout of KES<br />
8.75 per share (FY 2010: KES 8.75) was declared, implying a<br />
dividend cover of 1.1x.<br />
Operational Review<br />
Kenya Operations<br />
ADCA limiting market place wins. Despite a solid performance in<br />
the spirits category in FY 2011 (spirits volumes up 78% in Kenya),<br />
clear beer volumes declined 1.0% on the year. The flat beer outturn<br />
was also a result of the effect of an increase in excise tax.<br />
However, the Alcoholic Drinks Control Act (ADCA) is limiting<br />
growth in the key Kenyan market. The new Act basically enforces<br />
laws that control the production, manufacture, sale, labelling,<br />
promotion, sponsorship and consumption of alcoholic drinks.<br />
There are also restrictions to the hours within which the sale of<br />
alcoholic drinks is permitted. The overall objective is that of<br />
“protecting” consumers and avoiding irresponsible drinking.<br />
While EABL management has expressed that it is largely<br />
agreeable with the underlying intents of the Act, they have<br />
pointed out that certain clauses of the law do not serve the<br />
intended purposes and therefore there is need to engage<br />
authorities.<br />
Growth in key brands. While the ADCA has generally slowed<br />
down sales in Kenya, EABL has largely focused on promoting its<br />
key brands. The brewer experienced good growth in its key<br />
brands Tusker (+5.0%) and, Guinness (+3.0%), and an impressive<br />
uplift in spirits during the year.<br />
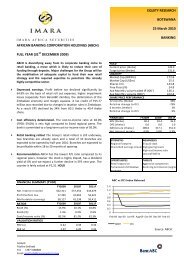
FY 2011: Revenues Spit by Business Unit/Region<br />
Great Lakes, 8%<br />
Tanzania, 5%<br />
Uganda, 12%<br />
Kenya, 75%<br />
Source: IAS/Company Reports<br />
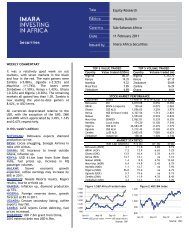
EABL: Financial Analysis<br />
70<br />
60<br />
50<br />
40<br />
30<br />
20<br />
10<br />
-<br />
2009 2010 2011 F2012 F2013<br />
Revenue (KES m)-LHS EBITDA Margin-RHS OP Margin-RHS<br />
Source: IAS Estimates/Company Reports<br />
40%<br />
35%<br />
30%<br />
25%<br />
20%<br />
15%<br />
10%<br />
5%<br />
0%<br />
3
<strong>Imara</strong> Africa Securities<br />
EABL also introduced new packaging for its legendary regional<br />
brand Tusker Lager which contributed to refreshed consumer<br />
awareness and net sales growth.<br />
EABL: Capex Vs Production Volumes<br />
8.00<br />
<strong>East</strong> <strong>African</strong> <strong>Breweries</strong> <strong>Limited</strong><br />
FY 2011 Results & Update<br />
12.00<br />
Increased marketing efforts. EABL has reinforced its focus on<br />
generating growth through investing in its brands (including<br />
renovation and customer partnering). Marketing costs for FY 2011<br />
increased 36% to KES 3.5bn (USD 34.2m). Marketing costs are<br />
roughly 10%-15% of turnover. Furthermore, the group increased<br />
its marketing spend on activation platforms such as Tusker<br />
Project Fame and Guinness Football Challenge, which led to the<br />
good growth of Tusker and Guinness as aforementioned. Senator<br />
also benefited from an expansion in the distribution footprint.<br />
Uganda Operations<br />
A surprise H2 2011 performance. Uganda delivered a solid<br />
performance in H2 2011 as a result of enhanced line efficiencies,<br />
better cost management and improved product availability as a<br />
result of an investment in a new packaging line. Bell Lager is also<br />
reinforcing its leadership position in the Ugandan market as<br />
Uganda <strong>Breweries</strong> <strong>Limited</strong> (UBL) re-launched the brand in a newlook<br />
bottle. Overall, UBL contributes c12% to group turnover. H2<br />
2011 operating profit for UBL was up 69% on H1 2011, indicating<br />
a swift turnaround.<br />
Tanzania Operations<br />
SBL consolidation concluded. EABL acquired a 51% stake in SBL<br />
for KES 4.9bn in November 2010, in a deal that was funded from<br />
internally generated funds. SBL is the second largest beverage<br />
alcohol company in Tanzania. The company now has an expanded<br />
brands portfolio (PSL, Tusker, Guinness) with three functioning<br />
breweries in Dar es Salaam, Mwanza and Moshi. EABL’s FY 2011<br />
results therefore, have consolidated eight months of SBL financial<br />
performance. SBL contributed KES 4.0bn (USD 39.1m) in net sales<br />
and 7.0% to group volumes. However, the unit posted a net loss<br />
largely due to once-off integration costs of KES 300.0m and<br />
interest cost of KES 200.0m. EABL spent approximately KES 2.0bn<br />
(USD 19.5m) in capex on completing the Moshi plant and on<br />
additional crates and bottles required for SBL. The company also<br />
invested significantly in integrating the business to EABL/ Diageo<br />
standards. This involved integrating all systems and processes<br />
(including financial reporting and, the IT infrastructure.<br />
7.00<br />
6.00<br />
5.00<br />
4.00<br />
3.00<br />
2.00<br />
1.00<br />
0.00<br />
2007 2008 2009 2010 2011 2012 2013<br />
Beer Production (mhl)-RHS<br />
Capex (KES bn)-LHS<br />
Source: IAS/ Company Reports<br />
EABL’s Main Beer Brands<br />
Source: Company Website<br />
10.00<br />
8.00<br />
6.00<br />
4.00<br />
2.00<br />
0.00<br />
EABL International (Great Lakes Region)<br />
The Great Lakes region contributed about 8.0% to group revenues.<br />
Sales volumes were down 10% y-o-y and net sales were up just<br />
3.0%. FY 2011 was a “tricky year” for EABL’s operations in South<br />
Sudan as a result of the uncertainty over the referendum and<br />
scarcity of foreign currency.<br />
Group-wide Operational Review<br />
Cost-value management. EABL management has focused more on<br />
improving the group’s operational efficiencies. This has entailed<br />
price hedging for sugar and cereals (c60% of input costs) and<br />
outsourcing operations such as logistics and warehousing in various<br />
markets. Furthermore, the group has embarked on a “brand-value<br />
engineering” strategy that essentially substitutes malt and barley<br />
with “cheaper sorghum’, without compromising on quality. We<br />
think these strategies are a recipe for margin expansion in the long<br />
term. However, because of the drought, EABL will be forced to<br />
import about 5.0% of its cereal requirements in FY 2012.<br />
Africa Beer Market (m hl)<br />
Central Africa<br />
6.0<br />
7%<br />
English-West Africa<br />
15.0<br />
17%<br />
Source: IAS Estimates<br />
<strong>East</strong> Africa<br />
14.0<br />
16%<br />
French-West Africa<br />
9.0<br />
10%<br />
North Africa<br />
5.0<br />
5%<br />
Southern Africa<br />
13.0<br />
14%<br />
South Africa<br />
28.0<br />
31%<br />
4
<strong>Imara</strong> Africa Securities<br />
Capex investments remain a priority. The total capex for FY<br />
2011 amounted to KES 6.4bn versus KES 3.8bn in FY 2010. The<br />
capex budget for FY 2012 is expected to be in the region of KES<br />
6.0bn. In Kenya, EABL invested in a new water storage facility<br />
with a capacity of 4,000m³ and upgraded its power supply line<br />
from 11kV to 66kV in an effort to stabilise utility supply to the<br />
plant and reduce power expenses. The carbon dioxide plant was<br />
also expanded to optimise production output. The upgrading of<br />
the malting plant in Nairobi which started two years ago<br />
continued in FY 2011 with new equipment being installed.<br />
Recent Capex Investments<br />
The new Moshi Brewery<br />
<strong>East</strong> <strong>African</strong> <strong>Breweries</strong> <strong>Limited</strong><br />
FY 2011 Results & Update<br />
The new Line 4 in Uganda<br />
In the region, capacity enhancement has been ongoing, with a<br />
new 50,000 bottle per hour capacity packaging line installed at<br />
Uganda <strong>Breweries</strong> <strong>Limited</strong> (UBL) in Kampala, Uganda in<br />
November, 2010. Other investments include the commissioning of<br />
Moshi brewery in Tanzania. Furthermore, the installation of a<br />
new mash filter also in Uganda is in progress.<br />
Outlook<br />
Leveraging on growing economies in the <strong>East</strong> <strong>African</strong><br />
Community (EAC). The EAC is increasing its population and as a<br />
result, there is a growing middle class in the region. Increased<br />
integration in the EAC provides a solid investment case for EABL<br />
given its dominant position and strong brands portfolio.<br />
Management has indicated that Tanzania and South Sudan will<br />
continue to be the key growth markets. In addition, the group’s<br />
growth strategy will also focus on other <strong>East</strong> <strong>African</strong> nations such<br />
as Rwanda, Burundi and Eritrea. Management has also alluded to<br />
the fact that this would largely be done through green field<br />
investments, joint ventures and contract packing/arrangements.<br />
Export opportunities also exist within the region.<br />
In a recent development, Diageo, (EABL’s parent company), won<br />
a bid to buy Ethiopia's last-remaining state brewery (Meta Abo)<br />
for USD 225.0m. Indications are that the new operation will be<br />
consolidated into EABL.<br />
South Sudan looks promising. The new nation of South Sudan is set<br />
to benefit from an “oil-led” economic recovery. EABL has indicated<br />
that it is looking at a more significant presence in South Sudan. An<br />
interesting point is that EABL has a larger share of the beer market<br />
in South Sudan (ahead of SABMiller) but largely operates through<br />
third party distribution agents. EABL has announced that it plans to<br />
build a 700,000hl plant in Juba, in South Sudan, which can be<br />
expanded to 1.0m hl. SABMiller has already invested in Southern<br />
Sudan Beverages Ltd (SSBL) brewery in Juba. The brewery produces<br />
White Bull lager and Chairman’s Extra Strong Beer as well as the<br />
Club Minerals Sparkling Soft Drinks range and Source Pure Drinking<br />
Water. SSBL has also announced it will start the production of two<br />
of SABMiller’s existing brands Nile Special Lager and Club Pilsner.<br />
EAC: 2011 Population and Inflation Statistics<br />
80<br />
70<br />
60<br />
50<br />
40<br />
30<br />
20<br />
10<br />
0<br />
Kenya Uganda Tanzania Sudan Ethiopia Rwanda Burundi<br />
Population (m)-LHS<br />
Inflation-RHS<br />
Source: IAS/Company Reports<br />
EAC: Alcohol per capita consumption (l)<br />
Uganda<br />
6.8<br />
Tanzania<br />
7.0<br />
Rwanda<br />
9.0<br />
18%<br />
16%<br />
14%<br />
12%<br />
10%<br />
8%<br />
6%<br />
4%<br />
2%<br />
0%<br />
To leverage on the spirits opportunity. It is worth noting that<br />
parent company Diageo is the world's biggest spirits group. As<br />
indicated in the company’s FY 2011 results, spirits volumes have<br />
grown significantly, supported by tax reprieves and price<br />
increases of premium/mainstream brands. We think that brand<br />
building and market development initiatives within this category<br />
are likely to drive future growth across the main markets.<br />
Kenya<br />
11.0<br />
Burundi<br />
18.0<br />
0.0 2.0 4.0 6.0 8.0 10.0 12.0 14.0 16.0 18.0 20.0<br />
Source: IAS Estimates<br />
5
<strong>Imara</strong> Africa Securities <strong>East</strong> <strong>African</strong> <strong>Breweries</strong> <strong>Limited</strong><br />
FY 2011 Results & Update<br />
COMPETITIVE ANALYSIS- PORTERS’ FIVE FORCES MODEL<br />
Threats of new entrants<br />
Low & Increasing<br />
Capital Intensive Industry. Generally, the huge capex requirements tend to limit market<br />
entry in the breweries sector. However, multinational group SABMiller has indicated that it<br />
will soon enter the Kenyan market. SABMiller already has operations in Tanzania (TBL) and<br />
South Sudan (SSBL).<br />
Regulatory environment. The new Alcoholic Drinks and Control Act (ADCA) poses a serious<br />
threat to any new market participants.<br />
Strong brand loyalty. EABL has already established itself as a leader in the Kenyan market<br />
with a market share of c90% largely through its strong brands e.g. Tusker is the most<br />
popular brand in Kenya. Another factor that limits market entry includes EABL’s operational<br />
scale (economies of scale advantages) and its distribution channels.<br />
Power of Suppliers<br />
Low & Stable<br />
Suppliers of raw materials, components, labour,<br />
and services (such as expertise) to the firm can be<br />
a source of power over the firm, when there are<br />
few substitutes.<br />
Generally, EABL suppliers across all its markets<br />
have little bargaining power in the industry largely<br />
due to the fact that sorghum growers are abundant<br />
within the region. There is also a high degree of<br />
differentiation of inputs as the company has<br />
embarked on brand value engineering, which<br />
substitutes barley and malt with “cheaper<br />
sorghum”.<br />
Competitive Rivalry<br />
Low & Increasing<br />
Rivalry is the extent to which companies compete with one another for customers. It can be<br />
price-based or non price-based and it is measured by the concentration level of the industry.<br />
Factors that increase rivalry are large capital asset requirements and high switching costs.<br />
EABL is a strong incumbent player in the Kenyan beer market and competitors have low<br />
market share.<br />
However, there is evidence of price-based rivalry in Uganda where UBL competes with<br />
SABMiller. In addition, Tanzania could potentially become a highly competitive market.<br />
Substitute Products<br />
Low & Increasing<br />
It has been identified that as per capita incomes improve, consumers tend to move up “the<br />
drinking curve”, preferring clear beer to traditional brews. Furthermore, as they become<br />
more affluent they become “more discerning”.<br />
Generally, substitutes to clear beer are numerous. Customers can easily switch to other<br />
forms of alcohol such as spirits or wines. A key positive for EABL is that it has been focussing<br />
more on spirits.<br />
In terms of CSDs, fruit juices are alternatives but do not have dominant brands and are not<br />
readily available.<br />
Power of Customers/Buyers<br />
Low & Stable<br />
The bargaining power of customers is the ability<br />
of customers to put the firm under pressure,<br />
which also affects the customer's sensitivity to<br />
price changes.<br />
Buyers have little power due to the fragmented<br />
customer base. In addition, EABL controls its<br />
distribution network hence the final outlets. In<br />
addition, buyer concentration is low given that<br />
the brewer operates in various locations across<br />
<strong>East</strong> Africa.<br />
However, it is worth mentioning that if price<br />
increases are too aggressive, customers may<br />
trade down thereby limiting the ability for EABL<br />
to pass on costs.<br />
6
<strong>Imara</strong> Africa Securities<br />
<strong>East</strong> <strong>African</strong> <strong>Breweries</strong> <strong>Limited</strong><br />
FY 2011 Results & Update<br />
Valuation<br />
COMPARATIVE VALUATION<br />
Market Cap EV/hl<br />
EV/EBITDA PER PBV Div Yield<br />
Company USDm USD Hist T + 1 T + 2 Hist T + 1 T + 2 Hist T + 1 T + 2 Hist T + 1 T + 2<br />
Bralirwa 244.8 194.5 11.7 5.2 4.2 14.0 10.7 8.8 9.0 8.0 7.2 7.1% 9.4% 11.4%<br />
Delta 894.4 158.0 11.2 7.5 5.4 16.9 12.1 9.0 4.3 3.3 2.6 2.0% 2.3% 2.8%<br />
EABL 1,241.5 134.9 7.5 5.9 5.4 16.9 14.7 13.5 5.8 4.4 4.3 5.6% 6.4% 6.9%<br />
Guiness Nigeria 2,076.5 378.1 10.2 8.3 7.3 18.1 14.7 12.5 8.1 7.0 6.1 4.5% 5.0% 5.5%<br />
Guiness Ghana 171.0 201.7 7.2 5.9 4.8 n/a n/a 25.6 4.4 4.5 4.2 0.0% 0.0% 2.3%<br />
Nambrew 278.5 87.8 5.4 5.1 4.4 10.8 10.4 8.2 2.8 2.3 1.9 5.4% 6.0% 7.5%<br />
Natbrew 96.6 55.0 9.1 9.0 6.6 14.9 13.6 9.8 17.1 16.1 15.1 7.1% 7.7% 10.7%<br />
NB 4,120.2 450.8 11.9 10.3 9.0 20.9 17.9 15.7 12.8 12.1 11.8 2.7% 5.4% 6.1%<br />
Phoenix 114.4 102.3 6.1 5.5 4.8 19.7 17.6 15.7 1.5 1.4 1.2 3.2% 3.6% 3.8%<br />
SAB Miller 61,004 237.6 12.7 10.7 9.7 20.1 16.2 14.6 2.8 2.5 2.3 2.1% 2.3% 2.5%<br />
Sechaba 239.2 102.2 5.3 6.8 6.9 12.9 15.9 16.0 6.3 6.3 6.2 7.8% 6.9% 7.4%<br />
TBL 369.0 131.9 3.4 3.2 2.9 6.4 5.9 5.3 2.8 2.7 2.5 8.2% 8.9% 10.0%<br />
Zambrew 198.8 188.8 11.5 9.8 8.7 20.9 15.4 12.6 4.5 4.3 4.1 0.0% 0.0% 0.0%<br />
Average 197.4 8.7 7.0 6.1 16.2 13.8 13.1 5.4 4.9 4.5 4.1% 4.7% 5.5%<br />
Note: Averages exclude Natbrew<br />
Source: IAS Estimates<br />
A comparative analysis of EABL against its peers in SSA broadly indicates that brewers in <strong>East</strong> Africa are cheap given an<br />
average EV/hl of about USD 154/hl versus a SSA average of USD 197/hl. An EV/hl of USD 135/hl for EABL, represents a<br />
32% discount to our SSA average. We think there is significant scope for growth given that EABL has a total production<br />
capacity in the region of 13.0m hl. We used a 25% discount on our SSA average of USD 197/hl and applied it to EABL’s<br />
total production capacity. We generated a prospective EV of USD 1.9bn. This indicates a fair value of KES 220 per share.<br />
DCF VALUATION<br />
KESm 2011 F2012 F2013 F2014 F2015 F2016 Terminal FCF 12,771.36<br />
FREE CASH FLOW 6,524.3 12,796.6 9,218.5 10,133.0 10,528.0 12,771.4 Perpetuity Growth Rate 5.0%<br />
Discount Period - 1 2 3 4 5 WACC 19%<br />
Discount Factor 1.00 0.84 0.70 0.59 0.49 0.41 Terminal FCF 92,650.54<br />
Present Value of Free Cash Flow 6,524 10,711 6,458 5,942 5,167 5,247<br />
Implied Equity Value and Share Price<br />
Enterprise Value 126,175.3<br />
Less: Total Debt (1,230.0)<br />
Less: Non controlling Interest (5,587.2)<br />
Plus: Cash and Cash Equivalents 1,649.5<br />
Implied Equity Value 121,007.6<br />
Number of Shares 790.8<br />
Implied Share Price (KES) 153.0<br />
Source: IAS Estimates<br />
Our DCF model generates FCFs over a 5-year horizon and uses a Perpetuity Growth method to calculate the terminal<br />
FCFs. The Capital Asset Pricing Model (CAPM) was used in calculating our cost of equity (ke). As a result, we derived a<br />
weighted average cost of capital of 19%. The method generates a target price of KES 153 per share.<br />
Recommendation<br />
A combination of our two valuation techniques (DCF and Comparative Valuation) yields a target price of KES 187 per<br />
share, representing 19% potential upside on the current trading price of KES 157. The share price has taken a knock from<br />
its 52-wk high of KES 230 per share. We think negative sentiments surrounding competitive threats and the effects of the<br />
ADCA in the key Kenyan market are the main culprits. In addition, the weak price is also a function of risk aversion by<br />
foreign investors given the weak economic fundamentals in Kenya (high inflation, drought and a weakening currency). In<br />
addition, there is also political uncertainty ahead of the elections next year. However, prospects in the region remain<br />
exciting. We foresee solid growth coming in from the spirits business category. We think investors can take advantage of<br />
the weak price and therefore upgrade our recommendation from HOLD to Long Term BUY.<br />
7
<strong>Imara</strong> Africa Securities<br />
<strong>East</strong> <strong>African</strong> <strong>Breweries</strong> <strong>Limited</strong><br />
FY 2011 Results & Update<br />
EABL- 5 YEAR CGR COMPARISON<br />
30 JUNE (KESm) 2006 2007 2008 2009 2010 2011 2012F 2013F 5yr CAGR<br />
Income Statement<br />
Sales 20,907 25,871 32,488 34,408 38,679 44,895 51,629 58,083 17%<br />
COS (7,896) (11,610) (15,007) (17,561) (19,537) (22,831) (25,866) (29,041) 24%<br />
Gross Profit 13,011 14,260 17,481 16,846 19,142 22,064 25,763 29,041 11%<br />
Operational Expenses 'excluding D&A' (4,451) (4,019) (5,338) (4,709) (5,603) (7,080) (6,053) (6,961) 10%<br />
EBITDA 8,560 10,241 12,144 12,138 13,539 14,984 17,038 19,400 12%<br />
Depreciation and Amortization (627) (766) (1,260) (1,581) (2,283) (2,892) (2,065) (2,556) 36%<br />
Operating Profit 7,933 9,474 10,884 10,557 11,256 12,412 14,972 16,844 9%<br />
Net Finance Income/ (Cost) 342 495 624 493 168 (163) (187) (215)<br />
Profit before Tax 8,577 10,636 12,316 11,507 12,568 12,250 13,940 15,102 7%<br />
Taxation (2,167) (3,107) (3,132) (3,244) (3,731) (3,235) (3,624) (3,926) 8%<br />
Profit After Tax 6,410 7,529 9,184 8,262 8,838 9,014 10,316 11,175 7%<br />
Minority Interest (1,018) (1,396) (1,631) (1,378) (1,659) (1,661) (1,857) (2,012) 10%<br />
Attributable Earnings 5,392 6,133 7,554 6,884 7,179 7,353 8,459 9,164 6%<br />
Ratios<br />
Weighted shares (m) 659.0 659.0 790.8 790.8 790.8 790.8 790.8 790.8<br />
EPS (KES) 6.8 7.8 9.6 8.7 9.1 9.3 10.7 11.6<br />
DPS (KES) 4.9 7.3 8.1 8.1 8.8 8.8 10.1 10.9<br />
Dividend Cover 1.4 1.1 1.2 1.1 1.0 1.1 1.1 1.1<br />
Dividend Yield 3.1% 4.7% 5.1% 5.1% 5.6% 5.6% 6.4% 6.9%<br />
Sales (m hl) 7.5 8.5 9.1 9.8 10.5<br />
EV/hl (USD) 157.4 137.3 134.9 111.3 109.4<br />
Growth Ratios<br />
Sales growth 9.0% 23.7% 25.6% 5.9% 12.4% 16.1% 15.0% 12.5%<br />
EBITDA growth 3.0% 19.6% 18.6% 0.0% 11.5% 10.7% 13.7% 13.9%<br />
OP growth 5.8% 19.4% 14.9% -3.0% 6.6% 10.3% 20.6% 12.5%<br />
PBT growth 4.3% 24.0% 15.8% -6.6% 9.2% -2.5% 13.8% 8.3%<br />
Earnings growth 11.0% 17.5% 22.0% -10.0% 7.0% 2.0% 14.4% 8.3%<br />
Margins<br />
Gross margin 62.2% 55.1% 53.8% 49.0% 49.5% 49.1% 49.9% 50.0%<br />
OP margin 37.9% 36.6% 33.5% 30.7% 29.1% 27.6% 29.0% 29.0%<br />
PBT margin 41.0% 41.1% 37.9% 33.4% 32.5% 27.3% 27.0% 26.0%<br />
PAT margin 30.7% 29.1% 28.3% 24.0% 22.8% 20.1% 20.0% 19.2%<br />
Effective Tax Rate 25.3% 29.2% 25.4% 28.2% 29.7% 26.4% 26.0% 26.0%<br />
EBITDA Margin 40.9% 39.6% 37.4% 35.3% 35.0% 33.4% 33.0% 33.4%<br />
8
<strong>Imara</strong> Africa Securities<br />
<strong>East</strong> <strong>African</strong> <strong>Breweries</strong> <strong>Limited</strong><br />
FY 2011 Results & Update<br />
Notes<br />
Capital<br />
Securities<br />
Botswana<br />
Ground Floor,<br />
Exchange<br />
House<br />
Block 6, Plot<br />
64511<br />
Fairgrounds,<br />
Gaborone,<br />
Botswana<br />
Tel: + 267 318<br />
8886<br />
Cell: + 267 7<br />
132 1421 / 7<br />
162 4390<br />
<strong>Imara</strong> Africa<br />
Securities (A division<br />
of <strong>Imara</strong> SP Reid)<br />
<strong>Imara</strong> House, Block 3,<br />
257 Oxford Road,<br />
Illovo,<br />
Johannesburg, 2146<br />
South Africa<br />
Tel: +27 11 550 6200<br />
Fax: +27 11 550 6295<br />
<strong>Imara</strong> Securities<br />
Angola<br />
SCVM Limitada<br />
Rua Rainha Ginga 74,<br />
13 th Floor, Luanda,<br />
Angola<br />
Tel: +244 222 372<br />
029/36<br />
Fax: +244 222 332 340<br />
<strong>Imara</strong> Edwards<br />
Securities (Pvt.) Ltd.<br />
Tendeseka Office Park<br />
1st Floor Block 2<br />
Samora Machel Ave.<br />
Harare, Zimbabwe<br />
Tel: +2634 790590<br />
Fax:+2634 791435<br />
4 Fanum House<br />
Cnr. Leopold<br />
Takawira/Josiah<br />
Tongogara Street<br />
Bulawayo<br />
Tel: +263 9 74554<br />
Fax: +263 9 66024<br />
Members of the<br />
Zimbabwe Stock<br />
Exchange<br />
<strong>Imara</strong> S P Reid (Pty)<br />
Ltd<br />
<strong>Imara</strong> House, Block 3,<br />
257 Oxford Road,<br />
Illovo, Johannesburg,<br />
2146<br />
South Africa<br />
Tel: +27 11 550 6200<br />
Fax: +27 11 550 6295<br />
Member of the<br />
JSE Securities<br />
Exchange<br />
Namibia Equity<br />
Brokers (Pty) Ltd<br />
1st Floor City Centre<br />
Building, West Wing<br />
Levinson Arcade<br />
Windhoek<br />
Namibia<br />
Tel: +264 61 246666<br />
Fax: +264 61256789<br />
Member of the<br />
Namibia Stock<br />
Exchange<br />
Stockbrokers<br />
Malawi Ltd<br />
Able House<br />
Cnr. Hanover<br />
Avenue/<br />
Chilembwe Road<br />
Blantyre<br />
Malawi<br />
Tel: +265 1822803<br />
Member of the<br />
Malawi Stock<br />
Exchange<br />
Stockbrokers<br />
Zambia Ltd<br />
2nd Floor (Wing), Stock<br />
Exchange Building<br />
Central Park Corner<br />
Church/Cairo Roads<br />
P O Box 38956<br />
Lusaka<br />
Zambia<br />
Tel: +260 211232455<br />
Fax: +260 211224055<br />
Member of the<br />
Zambia<br />
Stock Exchange<br />
This research report is not an offer to sell or the solicitation of an offer to buy or subscribe for any securities. The securities referred to in this report may not be eligible for sale in<br />
some jurisdictions. The information contained in this report has been compiled by <strong>Imara</strong> S.P. Reid (Pty) Ltd, (“<strong>Imara</strong>”) from sources that it believes to be reliable, but no<br />
representation or warranty is made or guarantee given by <strong>Imara</strong> or any other person as to its accuracy or completeness. All opinions and estimates expressed in this report are<br />
(unless otherwise indicated) entirely those of <strong>Imara</strong> as of the date of this report only and are subject to change without notice. Neither <strong>Imara</strong> nor any other member of the <strong>Imara</strong><br />
group of companies including their respective associated companies (together “Group Companies”), nor any other person, accepts any liability whatsoever for any loss howsoever<br />
arising from any use of this report or its contents or otherwise arising in connection therewith. Each recipient of this report shall be solely responsible for making its own<br />
independent investigation of the business, financial condition and prospects of companies referred to in this report. Group Companies and their respective affiliates, officers,<br />
directors and employees, including persons involved in the preparation or issuance of this report may, from time to time (i) have positions in, and buy or sell, the securities of<br />
companies referred to in this report (or in related investments); (ii) have a consulting, investment banking or broking relationship with a company referred to in this report; and<br />
(iii) to the extent permitted under applicable law, have acted upon or used the information contained or referred to in this report including effecting transactions for their own<br />
account in an investment (or related investment) in respect of any company referred to in this report, prior to or immediately following its publication. This report may not have<br />
been distributed to all recipients at the same time. This report is issued only for the information of and may only be distributed to professional investors (or, in the case of the<br />
United States, major US institutional investors as defined in Rule 15a-6 of the US Securities Exchange Act of 1934) and dealers in securities and must not be copied, published or<br />
reproduced or redistributed (in whole or in part) by any recipient for any purpose. © <strong>Imara</strong> Africa Securities (A division of <strong>Imara</strong> SP Reid)<br />
9