Improved content-based classification and retrieval of images using ...
Improved content-based classification and retrieval of images using ...
Improved content-based classification and retrieval of images using ...

You also want an ePaper? Increase the reach of your titles
YUMPU automatically turns print PDFs into web optimized ePapers that Google loves.
RESEARCH COMMUNICATIONS<br />
If a proper partition function is chosen it will wholly<br />
define the behaviour <strong>of</strong> clouds to thermodynamic parameters.<br />
We quote them as follows 12<br />
Entropy<br />
Helmholtz<br />
3 3<br />
S = kNlog Z+ Nk, kNlog z+<br />
Nk,<br />
2 2<br />
free energy F =− kT log Z,<br />
Total energy<br />
Enthalpy<br />
Gibbs potential<br />
Pressure<br />
Specific heat<br />
2 ⎡ δ ⎤<br />
E= NkT ⎢ (log z) ,<br />
δT<br />
⎥<br />
⎣ ⎦<br />
2 ⎡δ<br />
⎤<br />
H = NkT ⎢ (log Z) + RT,<br />
δt<br />
⎥<br />
⎣ ⎦<br />
G= RT − NkTlog<br />
z<br />
⎡ δ<br />
2 ⎤<br />
P= NkT ⎢ (log z) + T ,<br />
δ v<br />
⎥<br />
⎣<br />
⎦<br />
⎡<br />
2<br />
δ<br />
2<br />
⎛δ<br />
log Z ⎞⎤<br />
CV<br />
= Nk⎢2 T (log Z) + T<br />
.<br />
2<br />
δT<br />
⎜<br />
⎥<br />
δT<br />
⎟<br />
⎢⎣<br />
⎝ ⎠⎥⎦<br />
1. Chaiken, P. M. <strong>and</strong> Lubernsky, T. C., Principles <strong>of</strong> Condensed<br />
Matter Physics, Cambridge University Press, 1999.<br />
2. http://earth observatory.nasa.gov/fa/clouds/printall.php<br />
3. Earth radiation B data on the Earth radiation budget satellite <strong>and</strong><br />
NOAA-9 processed at NASA.<br />
4. Mani, A. <strong>and</strong> Rangarajan, S., Solar Radiations over India, Allied<br />
Publishers, India, 1982.<br />
5. Gufee, K. <strong>and</strong> Henderson-Sellors, A., A Climate Modeling Primer,<br />
John Wiley, 1997.<br />
6. Ema, K. A., Annu. Rev. Fluid Mech., 1991, 23, 179–196.<br />
7. Laurence, M. G., The relationship between relative humidity <strong>and</strong><br />
the dew point temperature in moist air: a simple conversion <strong>and</strong><br />
applications. Bull. Am. Meteorol. Soc., 2005, 86, 225–233.<br />
8. Kondratyev, K. K., Radiations in the Atmosphere, The International<br />
Geophysics Series, Academic Press, 1969, vol. 12.<br />
9. Dufour, L. <strong>and</strong> Defay, R., Thermodynamics <strong>of</strong> Clouds, International<br />
Geophysics Series, Academic Press, 1963.<br />
10. L<strong>and</strong>alu, L. D. <strong>and</strong> Lifshitz, E. M., Statistical Physics, Pergamon<br />
Press, 1975, vol. 5.<br />
11. Agrawal, B. K. <strong>and</strong> Eisner, M., Statistical Mechanics, New Age<br />
International (P) Limited, 1994.<br />
12. Brij, L., Subramaniam, N. <strong>and</strong> Hemne, P. S., Heat, Thermodynamics<br />
<strong>and</strong> Statistical Physics, S. Ch<strong>and</strong> Publisher, 2008.<br />
Received 22 March 2013; revised accepted 18 September 2013<br />
V<br />
V<br />
V<br />
V<br />
<strong>Improved</strong> <strong>content</strong>-<strong>based</strong> <strong>classification</strong><br />
<strong>and</strong> <strong>retrieval</strong> <strong>of</strong> <strong>images</strong> <strong>using</strong> support<br />
vector machine<br />
V. Karpagam 1, * <strong>and</strong> R. Rangarajan 2<br />
1 Department <strong>of</strong> Information Technology,<br />
Sri Ramakrishna Engineering College, Coimbatore 641 022, India<br />
2 Indus College <strong>of</strong> Engineering, Coimbatore 641 101, India<br />
Content-<strong>based</strong> image <strong>retrieval</strong> (CBIR) entails probing<br />
for similar <strong>images</strong> for a query image in an image<br />
database <strong>and</strong> returning the most relevant <strong>images</strong>. The<br />
proposed methodology aims at improving the <strong>classification</strong><br />
<strong>and</strong> <strong>retrieval</strong> accuracy <strong>of</strong> <strong>images</strong>. Wavelet histograms<br />
are used to design a simple <strong>and</strong> efficient CBIR<br />
system with good performance <strong>and</strong> without <strong>using</strong> any<br />
intensive image-processing feature extraction technique.<br />
The unique indexed colour histogram <strong>and</strong> wavelet<br />
decomposition-<strong>based</strong> horizontal, vertical <strong>and</strong><br />
diagonal image attributes serve as the main features<br />
for the <strong>retrieval</strong> system. Support vector machine is used<br />
for <strong>classification</strong> <strong>and</strong> thereby to improve <strong>retrieval</strong><br />
accuracy <strong>of</strong> the system. The performance <strong>of</strong> the<br />
proposed <strong>content</strong>-<strong>based</strong> image <strong>classification</strong> <strong>and</strong><br />
<strong>retrieval</strong> system is evaluated with the st<strong>and</strong>ard SIM-<br />
PLIcity dataset. Precision is used as a metric to measure<br />
the performance <strong>of</strong> the system. The system is validated<br />
with holdout <strong>and</strong> k-fold cross-validation techniques.<br />
The proposed system performs better than SIMPLIcity<br />
<strong>and</strong> all the other compared methods.<br />
Keywords: Colour image representation, discrete wavelet<br />
decomposition, image <strong>classification</strong>, image feature extraction.<br />
CONTENT-<strong>based</strong> image <strong>retrieval</strong> (CBIR) finds application<br />
in a number <strong>of</strong> areas like video surveillance, medicine<br />
<strong>and</strong> geographic information system (GIS). All these<br />
applications require a high degree <strong>of</strong> accuracy with<br />
minimal user involvement. A myriad <strong>of</strong> CBIR engines<br />
have been proposed in the literature. Though most <strong>of</strong> the<br />
methods perform significantly well, the semantic gap<br />
remains to be bridged. Most <strong>of</strong> the popular methods<br />
involve region-<strong>based</strong> techniques which are computationally<br />
intensive <strong>and</strong> the success <strong>of</strong> the methods depends on<br />
the segmentation techniques used. Many relevance-<strong>based</strong><br />
techniques have also been proposed, but the retrieved<br />
results may depend on individual perception <strong>of</strong> relevance.<br />
This spawns the need for a simple <strong>and</strong> efficient <strong>retrieval</strong><br />
system with no user involvement.<br />
There are several methods being used for the <strong>retrieval</strong><br />
<strong>of</strong> <strong>images</strong> <strong>based</strong> on visual features such as colour, texture<br />
<strong>and</strong> shape. Most <strong>of</strong> the successful methods use sophisticated,<br />
time-consuming image processing techniques to<br />
*For correspondence. (e-mail: karpagam11@yahoo.com)<br />
CURRENT SCIENCE, VOL. 105, NO. 9, 10 NOVEMBER 2013 1267
RESEARCH COMMUNICATIONS<br />
learn the semantic <strong>content</strong> <strong>of</strong> the image. For example, if<br />
we want to study the separate regions <strong>of</strong> the image, then<br />
suitable colour or texture segmentation algorithms should<br />
be used to separate the homogeneous regions for further<br />
analysis to classify them <strong>based</strong> on the features. Even after<br />
such sophisticated semantic analysis, the improvements<br />
in the results were not so significant. Further, simple<br />
image-matching policies <strong>of</strong>ten lead to poor accuracy in<br />
image <strong>retrieval</strong>. So, a CBIR system with model-<strong>based</strong><br />
<strong>classification</strong> technique may lead to better results. Lu <strong>and</strong><br />
Weng 1 present a comprehensive survey <strong>of</strong> advanced<br />
image <strong>classification</strong> techniques. The image processing<br />
procedure <strong>and</strong> selection <strong>of</strong> suitable <strong>classification</strong> method<br />
has been stated to play a significant role in improving the<br />
<strong>classification</strong> accuracy.<br />
Here, a simple CBIR system is modelled which will<br />
use features that can be acquired from the image in a fast<br />
mode. An attempt is made to show that the accuracy <strong>of</strong> a<br />
simple CBIR system can be made competitively equal to<br />
that <strong>of</strong> a sophisticated CBIR system, if the simple <strong>and</strong><br />
more significant features <strong>of</strong> the image are chosen for coding<br />
in the image feature dataset. To improve the image<br />
<strong>retrieval</strong> accuracy, a support vector machine (SVM)-<br />
<strong>based</strong> <strong>classification</strong> model is used. The development<br />
process for this project involves three phases – image feature<br />
extraction, training the SVM network <strong>and</strong> matching<br />
the query image with database <strong>images</strong> <strong>using</strong> the previously<br />
trained network. For the first phase, wavelet histograms<br />
(WH) are used 2 . For the second phase, SVM neural<br />
network is used <strong>and</strong> for the <strong>retrieval</strong> part, the previously<br />
trained network as well as simple distance measure are<br />
used.<br />
A CBIR system <strong>based</strong> on a multiscale geometric analysis<br />
(MGA) tool, called ripplet transform type-I (RT) has<br />
been presented by Chowdhury et al. 3 . The scheme utilizes<br />
a neural network-<strong>based</strong> pre-classifier for the <strong>images</strong> to<br />
improve the <strong>retrieval</strong> accuracy. Similarity is measured<br />
<strong>using</strong> Manhattan distance <strong>and</strong> fuzzy entropy-<strong>based</strong> feature<br />
is used for relevance feedback. The performance <strong>of</strong><br />
the CBIR system has been evaluated <strong>using</strong> a 2 × 5-fold<br />
cross validation followed by a statistical analysis.<br />
Deselaers et al. 4 have conducted experiments on five<br />
different publicly available image databases <strong>and</strong> have<br />
analysed the <strong>retrieval</strong> performance <strong>of</strong> the features. The<br />
correlation <strong>of</strong> the features has also been analysed <strong>and</strong> it<br />
has been concluded that the frequently used, but simple,<br />
colour histogram performs well in many applications.<br />
An image <strong>retrieval</strong> scheme which makes use <strong>of</strong> visually<br />
significant point features has been presented earlier 5 .<br />
The clusters <strong>of</strong> points around significant curvature regions<br />
are extracted <strong>using</strong> a fuzzy set theoretic approach. Some<br />
invariant colour features are computed from these points<br />
to evaluate the similarity between <strong>images</strong>. A set <strong>of</strong> relevant<br />
<strong>and</strong> non-redundant features is selected <strong>using</strong> the mutual<br />
information-<strong>based</strong> minimum redundancy–maximum<br />
relevance framework. The relative importance <strong>of</strong> each<br />
1268<br />
feature is evaluated <strong>using</strong> a fuzzy entropy-<strong>based</strong> measure.<br />
Salient points determination is <strong>based</strong> on colour saliency 6 .<br />
The combination <strong>of</strong> the local colour, texture <strong>and</strong> the<br />
global shape features have been used to provide a robust<br />
feature set for image <strong>retrieval</strong>. SIMPLIcity makes use <strong>of</strong><br />
a wavelet-<strong>based</strong> approach for feature extraction, <strong>and</strong> integrated<br />
region matching <strong>based</strong> upon image segmentation 7 .<br />
The image is represented by a set <strong>of</strong> regions, roughly corresponding<br />
to objects characterized by colour, texture,<br />
shape <strong>and</strong> location. The system classifies <strong>images</strong> into<br />
semantic categories enhancing the <strong>retrieval</strong>. The system<br />
is fairly robust to image alterations.<br />
Fuzzy SVM network makes use <strong>of</strong> a SVM with a kernel<br />
comprised <strong>of</strong> fuzzy basis functions 8 . This network has<br />
been evaluated <strong>using</strong> <strong>images</strong> from the aceMedia Repository1,<br />
specifically for the beach/urban scenes <strong>classification</strong><br />
problem. A good <strong>classification</strong> rate has been achieved<br />
while f<strong>using</strong> edge histogram, colour layout <strong>and</strong> scalable<br />
colour MPEG-7 descriptors. The performances <strong>of</strong> SVM,<br />
KNN <strong>and</strong> logistic regression classifiers on different categories<br />
<strong>of</strong> <strong>images</strong> have been compared 9 . While both KNN<br />
<strong>and</strong> SVM perform better than logistic regression, the<br />
choice <strong>of</strong> k is essential for the success <strong>of</strong> the algorithm.<br />
Another major problem with KNN is that the class with<br />
the more frequent training samples would dominate the<br />
prediction <strong>of</strong> the new vector. An integrated many artificial<br />
neural networks (ANNs) <strong>and</strong> one SVM for <strong>classification</strong><br />
<strong>and</strong> recognition method for Roman numeral <strong>images</strong><br />
has been proposed 10 . Though the precision <strong>of</strong> the twolayer<br />
classifier is high, the processing time needs to be<br />
improved for complex image <strong>classification</strong> applications.<br />
In image recognition or pattern recognition in general,<br />
the two major issues are feature extraction <strong>and</strong> distance<br />
measure definition. Failure in either <strong>of</strong> the two issues will<br />
lead to poor performance <strong>of</strong> the recognition system.<br />
There is no exception to the CBIR system. In this work,<br />
we propose the use <strong>of</strong> a unique colour histogram <strong>and</strong><br />
wavelet decomposition-<strong>based</strong> horizontal, vertical <strong>and</strong><br />
diagonal image attributes as the main features <strong>and</strong> design<br />
the <strong>retrieval</strong> system.<br />
Generally, the three colour layers information <strong>of</strong> a<br />
typical RGB image is h<strong>and</strong>led separately in the feature<br />
extraction process. This may lead to inaccurate representation<br />
<strong>of</strong> the colour features. For example, the same level<br />
<strong>of</strong> one particular layer colour may create different colours<br />
in different parts <strong>of</strong> the image, since the colours <strong>of</strong> the<br />
other two layers will decide the colour <strong>of</strong> the pixel.<br />
Several previous works h<strong>and</strong>le the three layers separately<br />
<strong>and</strong> use separate histograms to measure the colour features.<br />
In the study by N<strong>and</strong>agopalan et al. 11 , a single feature<br />
vector represents the colour, texture <strong>and</strong> edge information.<br />
The image is segmented. The mean, median <strong>and</strong><br />
st<strong>and</strong>ard deviation <strong>of</strong> the red, green <strong>and</strong> blue channels <strong>of</strong><br />
the colour histograms are computed for the dominant<br />
segments. Texture co-occurrence matrix-<strong>based</strong> entropy<br />
CURRENT SCIENCE, VOL. 105, NO. 9, 10 NOVEMBER 2013
RESEARCH COMMUNICATIONS<br />
<strong>and</strong> energy are calculated <strong>and</strong> for edge density the edge<br />
histogram descriptor (EHD) is found.<br />
Laplacian transform <strong>of</strong> the sharpened greyscale image<br />
is statistically quantized into colour histogram bins in Malik<br />
<strong>and</strong> Baharudin 12 . It has been shown that the category-wise<br />
precision for 32 bins was the best value achieved <strong>using</strong><br />
the method. Patil <strong>and</strong> Kolhe 13 have segmented every<br />
image <strong>using</strong> k-means clustering to identify regions. Then,<br />
the features <strong>of</strong> every region are extracted to form the feature<br />
vector. KNN multiple instance learning is carried out<br />
to classify <strong>and</strong> annotate the unlabelled image object.<br />
In the proposed method, the RGB image is converted<br />
to an indexed image with low level <strong>of</strong> colour detail. All<br />
the 16,777,216 possible colours <strong>of</strong> the RGB space are not<br />
perceivable by the human eye. Therefore, the 24 bit colour<br />
image is quantized to a 256-colour-indexed colour<br />
image. A common operation that reduces the size <strong>of</strong> large<br />
24 bit bitmaps is to convert them to indexed colour with<br />
an optimized palette, that is, a palette which best represents<br />
the colours available in the bitmap. The colour map<br />
<strong>of</strong> only one image <strong>of</strong> the whole dataset is stored separately<br />
to decompose the remaining <strong>images</strong> <strong>of</strong> the dataset.<br />
A colour approximation method is used to do the colour<br />
mapping <strong>and</strong> the <strong>images</strong> will be almost in their original<br />
colour.<br />
Indexed colour is an economical way <strong>of</strong> storing colour<br />
bitmaps without <strong>using</strong> 3 bytes per pixel. As with 8-bit<br />
grey bitmaps, each pixel has a byte associated with it.<br />
Only now the value in the byte is no longer a colour<br />
value, but an index into a table <strong>of</strong> colours called a palette<br />
or colour table. Figure 1 shows the colour map.<br />
There are a number <strong>of</strong> interesting attributes <strong>of</strong> such a<br />
colour indexing system. If there are less than 256 colours<br />
in the image then this bitmap will have the same quality<br />
as a 24 bit bitmap, but it can be stored with one-third the<br />
data. Interesting colouring <strong>and</strong> animation effects can be<br />
achieved by simply modifying the palette. This immediately<br />
changes the appearance <strong>of</strong> the bitmap <strong>and</strong> with careful<br />
design can lead to intentional changes in the visual<br />
appearance <strong>of</strong> the bitmap.<br />
Figure 1. Colour map.<br />
After this decomposition, each indexed 8-bit pixel will<br />
represent a particular colour which is stored separately as<br />
a map. For example, if the colour red (255, 0, 0) is indexed<br />
with a number 78, then all the indexed pixels with value<br />
78 will represent the same red colour (255, 0, 0). So, now<br />
the value 78 indicates red <strong>and</strong> the value 78 in all the indexed<br />
<strong>images</strong> <strong>of</strong> the whole dataset will represent red <strong>and</strong><br />
red only. Now it becomes possible to represent the colour<br />
distribution <strong>of</strong> the image with a single histogram in which<br />
the bin 78 will just represent the count <strong>of</strong> the red colour<br />
indexed pixels.<br />
The colour indexed histogram represents the colour<br />
distribution <strong>of</strong> the image, but it excludes the shape information.<br />
Two <strong>images</strong> with the same colour distribution<br />
may be semantically different, for example, a red colour<br />
car <strong>and</strong> a red colour ball. Therefore, there is a necessity to<br />
combine the power <strong>of</strong> colour indexed histograms with a<br />
method which can extract the shape <strong>and</strong> texture features<br />
from an image.<br />
Wavelet transform has become popular in different<br />
fields <strong>and</strong> is <strong>of</strong>ten used for analysis, de-noising <strong>and</strong> compression<br />
<strong>of</strong> signals <strong>and</strong> <strong>images</strong>. The resultant <strong>images</strong> <strong>of</strong><br />
single-level two-dimensional wavelet decomposition<br />
have several interesting characteristics. Generally, the 2D<br />
wavelet decomposition will produce four output <strong>images</strong>,<br />
L1, H1, V1 <strong>and</strong> D1. The MATLAB implementation<br />
<strong>of</strong> two-dimensional dwt function (dwt2) computes the<br />
approximation coefficients matrix L1 <strong>and</strong> details coefficients<br />
matrices H1, V1, D1, obtained by a wavelet decomposition<br />
<strong>of</strong> the input image matrix.<br />
The feature dataset is nothing but a feature-<strong>based</strong> index<br />
that will represent the whole image data in a most simplified<br />
form. These features will reflect the <strong>content</strong> <strong>of</strong> the<br />
image. A recent trend for image search is to fuse two<br />
basic modalities <strong>of</strong> the <strong>images</strong>. The key issue is how to<br />
fuse the two modalities to represent the image. Information<br />
from multiple sources is expected to increase the robustness<br />
<strong>and</strong> <strong>retrieval</strong> accuracy <strong>of</strong> the system through<br />
redundancy. Different levels <strong>of</strong> fusion have been identified,<br />
namely pixel, fusion <strong>and</strong> decision. Feature-level<br />
fusion is performed here. Fusion can also be categorized<br />
as early fusion or delayed fusion. Numerous methods <strong>of</strong><br />
<strong>classification</strong> use an early fusion <strong>of</strong> features by concatenating<br />
the descriptors extracted from one image in one<br />
single vector. An advantage <strong>of</strong> this approach is the use <strong>of</strong><br />
a simple fusion model involving low-cost computing<br />
compared to a late fusion model. Early fusion <strong>of</strong> the features<br />
is proposed in this work. The final feature set obtained<br />
is a simple concatenation <strong>of</strong> the colour features<br />
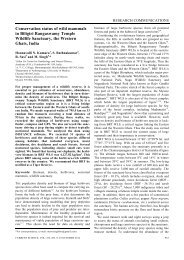
<strong>and</strong> texture features. The feature set is a vector <strong>of</strong> 263<br />
dimensions. The first 256 values represent the frequency<br />
<strong>of</strong> the histogram bins, for the 256 colours present in the<br />
colour map. The wavelet coefficients form the next four<br />
features in the vector. The next three values represent the<br />
traditional RGB colour histogram. The structure <strong>of</strong> the<br />
final feature vector is shown in Figure 2.<br />
CURRENT SCIENCE, VOL. 105, NO. 9, 10 NOVEMBER 2013 1269
RESEARCH COMMUNICATIONS<br />
Figure 2.<br />
Structure <strong>of</strong> the wavelet histogram feature vector.<br />
1<br />
min || w ||,<br />
wb , 2<br />
<br />
s.t. y 1 wx .<br />
<br />
= + ⇒ + b≥ + 1,<br />
i<br />
<br />
s.t. y 1 wx .<br />
<br />
= − ⇒ −b≤−1,<br />
i<br />
<br />
s.t. ( .<br />
<br />
y wx + b) ≥1, ∀i.<br />
i<br />
i<br />
i<br />
i<br />
(1)<br />
1270<br />
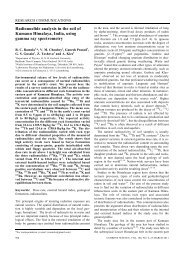
Figure 3.<br />
Data <strong>classification</strong> <strong>using</strong> support vector machine.<br />
For matching the input image features with the stored<br />
features <strong>of</strong> the image dataset, the simple Euclidean distance<br />
is used as a distance metric. The rank <strong>of</strong> the matching<br />
<strong>images</strong> was calculated <strong>based</strong> on the Euclidean distance<br />
with the query image. The image with minimum Euclidean<br />
distance is started with rank 1 <strong>and</strong> all the <strong>images</strong><br />
were ranked in an increasing order <strong>based</strong> on the Euclidean<br />
distance. In our evaluations, we only considered the<br />
top 50 ranked matching <strong>images</strong> <strong>and</strong> calculated the precision<br />
by taking the average <strong>of</strong> precision <strong>of</strong> several runs<br />
with same category input query <strong>images</strong>.<br />
The SVM approach is considered a good c<strong>and</strong>idate for<br />
<strong>classification</strong> because <strong>of</strong> its high generalization performance<br />
without the need to add a priori knowledge, even<br />
when the dimension <strong>of</strong> the input space is very high 14,15 .<br />
Although the SVM can be applied to various optimization<br />
problems such as regression, the classic problem is that<br />
<strong>of</strong> data <strong>classification</strong>. SVM has been largely used in<br />
CBIR as a learning technique <strong>based</strong> on relevance feedback.<br />
All these methods pose the limitation that it requires<br />
the users’ involvement. The decisions made by the system<br />
will be tailored to the needs <strong>of</strong> individuals <strong>and</strong> may<br />
not be applicable generally.<br />
The basic idea <strong>of</strong> SVM is shown in Figure 3. The data<br />
points are identified as being positive or negative, <strong>and</strong> the<br />
problem is to find a hyper-plane that separates the data<br />
points by a maximal margin. Figure 3 only shows the<br />
two-dimensional case where the data points are linearly<br />
separable.<br />
The mathematics <strong>of</strong> the problem to be solved is the<br />
following<br />
The identification <strong>of</strong> each data point x i is y i , which can take<br />
a value <strong>of</strong> +1 or –1 (representing positive or negative respectively).<br />
The solution hyper-plane is the following<br />
<br />
u = w⋅ x+<br />
b.<br />
The scalar b is also termed the bias. A st<strong>and</strong>ard method to<br />
solve this problem is to apply the theory <strong>of</strong> Lagrange to<br />
convert it to a dual Lagrangian problem. The dual problem<br />
is the following<br />
N N N<br />
∑∑yy i j xi xj i j ∑ i<br />
i= 1 j= 1 i=<br />
1<br />
1 <br />
min Ψ ( α) = min ( ⋅ ) αα − α ,<br />
α<br />
α 2<br />
N<br />
i=<br />
1<br />
(2)<br />
∑ α iyi<br />
= 0, α i ≥ 0, ∀i. (3)<br />
The variables α i are the Lagrangian multipliers for corresponding<br />
data point x i .<br />
The proposed CBIR system is implemented <strong>and</strong> evaluated<br />
in LIBSVM toolbox 16 for MATLAB.<br />
SVM solves non-separable feature vectors by relaxing<br />
the constraints <strong>of</strong> the hyper-plane. A cost function is<br />
added into the separating margin regions. In most practical<br />
applications where <strong>classification</strong> is required, the data<br />
to be separated are not linearly separable. A solution that<br />
ignores the few weird instances would be preferable.<br />
Therefore, an instance variable x i is allowed to exist<br />
without meeting the margin requirement, at a cost proportional<br />
to a slack variable ζ i .<br />
The steps <strong>of</strong> the proposed CBIR system <strong>using</strong> SVM<br />
include:<br />
• Constructing a SVM model <strong>of</strong> a <strong>classification</strong> network<br />
<strong>using</strong> the colour indexed image histogram features<br />
CURRENT SCIENCE, VOL. 105, NO. 9, 10 NOVEMBER 2013
RESEARCH COMMUNICATIONS<br />
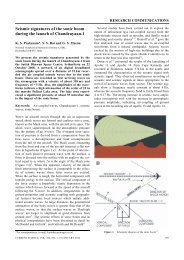
Figure 4. Model <strong>of</strong> the proposed SVM-<strong>based</strong> CBIR system.<br />
<strong>and</strong> discrete wavelet decomposition <strong>of</strong> the training<br />
<strong>images</strong>.<br />
• Classifying the input image <strong>using</strong> the trained model.<br />
• Retrieving all the best matching <strong>images</strong> from the<br />
matching class <strong>of</strong> the input image <strong>using</strong> a simple distance<br />
metric.<br />
Figure 4 explains the proposed SVM-<strong>based</strong> CBIR<br />
system.<br />
Supervised <strong>classification</strong> has been used in this research<br />
to categorize the <strong>images</strong> as the SIMPLIcity dataset contains<br />
<strong>images</strong> with well-defined labels. Input <strong>images</strong> to the<br />
supervised classifier are labelled as Africa, beach, buildings,<br />
buses, dinosaurs, elephants, flowers, horses, mountains<br />
<strong>and</strong> food. The feature descriptors <strong>of</strong> the <strong>images</strong>, in<br />
the WH format are given to the supervised classifier to<br />
infer a rule that assigns a label to each image. The classifier<br />
assigns a class label to the output value y, that best<br />
matches the given input pattern <strong>and</strong> is denoted by Ck,<br />
k = 1, 2, …, K, where K is the number <strong>of</strong> classes. Here,<br />
K = 10. The input data source is the feature descriptor<br />
obtained by f<strong>using</strong> the colour indexed histogram <strong>and</strong> the<br />
output <strong>of</strong> the wavelet transformation. A vector <strong>of</strong> 263 real<br />
numbers forms the input vector denoted by x .<br />
The vector format <strong>of</strong> the image features is suitable for<br />
an SVM classifier. The ability <strong>of</strong> a supervised classifier<br />
to map an input vector x to the desired output class y is<br />
<strong>based</strong> on the performance <strong>of</strong> the learning algorithm.<br />
Image <strong>classification</strong> is cast as learning a prediction<br />
y ≈ H( x),<br />
(4)<br />
that maps the space <strong>of</strong> <strong>images</strong> X to the space <strong>of</strong> classes Y,<br />
<strong>based</strong> on a training set <strong>of</strong> input/output pairs.<br />
There are two approaches to minimize the mapping<br />
error in eq. (4), namely empirical risk minimization <strong>and</strong><br />
structural risk minimization. The appeal <strong>of</strong> SVM is that it<br />
uses structural risk minimization. SVM attempts to map<br />
the correct intensities <strong>of</strong> the colour indexed histogram<br />
<strong>and</strong> the energy output <strong>of</strong> the wavelet transformation that<br />
will prove to be the most probable match between the<br />
input vector <strong>and</strong> the correct class.<br />
CURRENT SCIENCE, VOL. 105, NO. 9, 10 NOVEMBER 2013 1271
RESEARCH COMMUNICATIONS<br />
SVM is susceptible to scaling <strong>of</strong> data. Therefore, it is<br />
necessary to normalize the input vector. Min–max<br />
normalization is carried out on the WH feature vector.<br />
This preserves the relationships among the original data<br />
values. Min–max normalization is the process <strong>of</strong> transforming<br />
data to a value between 0.0 <strong>and</strong> 1.0. The minimum<br />
value is set to 0.0 <strong>and</strong> the maximum is set to 1.0.<br />
This provides an easy way to compare values that are<br />
measured <strong>using</strong> different scales. Normalization is given<br />
by eq. (5)<br />
1272<br />
Normalized value = Minimum value/<br />
Range <strong>of</strong> values. (5)<br />
SVM which was originally designed for binary <strong>classification</strong><br />
has been extended to support multi-class <strong>classification</strong><br />
through one-against-all (1AA) <strong>and</strong> one-against-one<br />
(1A1) strategies. The 1A1 strategy decomposes the multiclass<br />
problem into a set <strong>of</strong> binary classifiers. For n number<br />
<strong>of</strong> output classes, n*(n – 1)/2 classifiers are constructed<br />
<strong>and</strong> each one is trained with data from two classes i <strong>and</strong> j.<br />
A separate decision boundary is independently created<br />
between every pair <strong>of</strong> classes. Equation (1) is transformed<br />
to the form given in eq. (6):<br />
ij T<br />
ij<br />
sign(( w ) φ ( x) + b ),<br />
(6)<br />
where φ (x) represents the <strong>images</strong> mapped in highdimensional<br />
feature space, <strong>and</strong> i <strong>and</strong> j represent the corresponding<br />
pairs <strong>of</strong> classes.<br />
The voting strategy called as max–wins approach is<br />
followed to predict the class <strong>of</strong> the WH feature vector. If<br />
eq. (6) predicts x to belong to the ith class, the vote for i<br />
is incremented, else the vote for j is incremented. Then, x<br />
is predicted as belonging to the class with the maximum<br />
number <strong>of</strong> votes.<br />
The default parameters <strong>of</strong> LIBSVM are used. Experiments<br />
conducted with different parameters show that the<br />
performance <strong>of</strong> SVM with the default parameters is found<br />
to be good. Only the following parameters are changed.<br />
–s 1 –t 3 –g 0.1 –e 0.01 –p 0.0000000001.<br />
Choice <strong>of</strong> parameter-s indicates that nu-SVC is used. The<br />
range <strong>of</strong> nu in nu-SVC is 0 to 1, upper bounded by the<br />
fraction <strong>of</strong> outliers <strong>and</strong> lower bounded by the fraction <strong>of</strong><br />
support vectors. This value decides whether a hard margin<br />
or s<strong>of</strong>t margin separation is performed. The default<br />
value <strong>of</strong> 0.5 is chosen, leading to s<strong>of</strong>t margin SVM.<br />
The choice <strong>of</strong> the kernel function is a decisive factor in<br />
the performance <strong>of</strong> the SVM classifier. Kernels provide a<br />
simple bridge from linearity to nonlinearity in algorithms.<br />
Sigmoid kernel is used in this research. The hyperbolic<br />
tangent kernel is also known as the sigmoid kernel <strong>and</strong> as<br />
the MLP kernel. The sigmoid kernel comes from the neural<br />
networks field, where the bipolar sigmoid function is<br />
<strong>of</strong>ten used as activation for artificial neurons.<br />
k(x i , x j ) = tan h(gamma*u′*v + coef0), (7)<br />
where –g 0.1 – gamma. coef0 is the coefficient for the<br />
Kernel <strong>and</strong> the default value is 0.<br />
An SVM model <strong>using</strong> a sigmoid kernel function is<br />
equivalent to a two-layer perceptron neural network. It<br />
has been found to perform well in practice.<br />
There are different metrics for evaluating the performance<br />
<strong>of</strong> a typical CBIR system. We selected precision as<br />
the main evaluation metric because it was used in several<br />
previous works 2,5–7 .<br />
The quantitative measure defined is average precision<br />
<strong>and</strong> is explained as<br />
1 ⎛<br />
⎞<br />
pi () = 1 .<br />
n ⎜ ∑ (8)<br />
l ≤ j ≤ N, r( i, j) ≤ n, C( i) =<br />
⎟<br />
⎝<br />
C( j)<br />
⎠<br />
This value is the percentile <strong>of</strong> <strong>images</strong> belonging to the<br />
category <strong>of</strong> image i in the first n retrieved <strong>images</strong>, where<br />
p(i) is precision <strong>of</strong> query image i, n the number <strong>of</strong> <strong>images</strong><br />
in each category. In this case, there are 100 <strong>images</strong> in<br />
each category <strong>and</strong> so n = 100. N is the total number <strong>of</strong><br />
<strong>images</strong> in the database. In this case, N = 1000. C(i) <strong>and</strong><br />
C(j) are category ID <strong>of</strong> <strong>images</strong> i <strong>and</strong> j respectively. In this<br />
experiment, the category ID will be in the range 1–10. r(i,<br />
j) is the rank <strong>of</strong> image j (i.e. position <strong>of</strong> image j in the<br />
retrieved <strong>images</strong> for query image i, an integer between 1<br />
<strong>and</strong> N).<br />
The average precision p c for category C(1 ≤ c ≤ n) is<br />
given by<br />
p<br />
c<br />
1 ⎛ ⎞<br />
= 1 .<br />
n ⎜ ∑ (9)<br />
l ≤ j ≤ N, C( i)<br />
=<br />
⎟<br />
⎝<br />
c ⎠<br />
The holdout method for cross-validation divides the data<br />
into two disjoint subsets, namely training <strong>and</strong> test sets.<br />
The training set is used to train the classifier. The test set<br />
is used to estimate the error rate <strong>of</strong> the trained classifier.<br />
Holdout validation is performed by r<strong>and</strong>omly selecting<br />
90% <strong>of</strong> <strong>images</strong> for training the <strong>classification</strong> model <strong>and</strong><br />
the remaining 10% <strong>of</strong> the <strong>images</strong> for testing the model.<br />
The validation is repeated five times <strong>and</strong> the average is<br />
calculated.<br />
In this work k-fold cross-validation is chosen as the<br />
main metric for evaluating the performance <strong>of</strong> the image<br />
<strong>classification</strong> system. Also, ten-fold cross-validation is<br />
applied for evaluating the performance <strong>of</strong> the classifiers.<br />
The k-fold validation creates a k-fold partition <strong>of</strong> the<br />
dataset. The experiment for model selection is repeated k<br />
times, with k – 1 folds forming the training dataset <strong>and</strong><br />
the remaining one-fold forming the test dataset. k-fold<br />
CURRENT SCIENCE, VOL. 105, NO. 9, 10 NOVEMBER 2013
RESEARCH COMMUNICATIONS<br />
cross-validation has the advantage that all instances in the<br />
dataset are eventually used for both training <strong>and</strong> testing.<br />
The ten-fold cross-validation is performed in this work.<br />
The results are benchmarked with st<strong>and</strong>ard systems,<br />
viz. SIMPLIcity 7 , FIRM 17 <strong>and</strong> other previous works <strong>using</strong><br />
the same database. We compared our earlier results 2 with<br />
those <strong>of</strong> the proposed method. The performance <strong>of</strong> the<br />
system is measured with more accuracy. Two validation<br />
methods, viz. holdout validation <strong>and</strong> k-fold cross-validation<br />
are used. The category-wise precision is measured<br />
<strong>and</strong> tabulated. The average <strong>of</strong> precision in all the categories<br />
is considered as the overall precision <strong>of</strong> the CBIR<br />
system. Table 1 shows the results <strong>of</strong> some earlier<br />
CBIR systems which are compared with the proposed<br />
CBIR system.<br />
Generally, during k-fold validation, the value <strong>of</strong> k is<br />
taken as 10. Therefore, 90% <strong>of</strong> data will be used for the<br />
construction <strong>of</strong> the network model <strong>and</strong> the remaining<br />
10% for validating the model.<br />
Figure 5 shows the 3D plot <strong>of</strong> all the <strong>images</strong> classified<br />
<strong>using</strong> the SVM-<strong>based</strong> classifier. This virtual image space<br />
shows the clusters <strong>of</strong> <strong>images</strong> which belong to different<br />
categories. Each colour legend in this plot shows one<br />
category <strong>of</strong> image in the database. If we see the class<br />
‘dinosaurs’ (black dots at the right top), it forms a distinct<br />
Table 1.<br />
The results <strong>of</strong> other previous methods<br />
Class FEI SIMPLIcity Simple Hist FIRM<br />
Africa 0.45 0.48 0.30 0.47<br />
Beach 0.35 0.32 0.30 0.35<br />
Buildings 0.35 0.35 0.25 0.35<br />
Buses 0.60 0.36 0.26 0.60<br />
Dinosaurs 0.95 0.95 0.90 0.95<br />
Elephants 0.60 0.38 0.36 0.25<br />
Flower 0.65 0.42 0.40 0.65<br />
Horses 0.70 0.72 0.38 0.65<br />
Mountains 0.40 0.35 0.25 0.30<br />
Food 0.40 0.38 0.20 0.48<br />
Average 0.545 0.471 0.36 0.505<br />
cluster in this image space. That is why the precision <strong>of</strong><br />
<strong>classification</strong> <strong>of</strong> dinosaurs is high compared to the other<br />
classes.<br />
Table 2 shows the results <strong>of</strong> the proposed CBIR<br />
systems. The first column <strong>of</strong> Table 2 shows the result <strong>of</strong><br />
WH method 2 . The second <strong>and</strong> third are the results <strong>of</strong> the<br />
proposed WHSVM model. The precision <strong>of</strong> the proposed<br />
model is presented through holdout <strong>and</strong> k-fold validation.<br />
The performance <strong>of</strong> the proposed CBIR model in terms<br />
<strong>of</strong> precision is significantly higher compared to the earlier<br />
works, as shown in Tables 1 <strong>and</strong> 2, <strong>and</strong> Figure 6.<br />
Figure 7 shows the comparison <strong>of</strong> category-wise performance<br />
<strong>of</strong> the proposed CBIR systems WHSVM <strong>and</strong><br />
WH 2 . The proposed WHSVM model is pr<strong>of</strong>icient in finding<br />
matching <strong>images</strong> from the database with more accuracy<br />
in almost all the categories <strong>of</strong> <strong>images</strong>. The categorywise<br />
precision was found to be good during both holdout<br />
validation as well as k-fold validation. This proves that<br />
there is significant improvement in the accuracy <strong>of</strong> the<br />
proposed SVM-<strong>based</strong> CBIR system.<br />
Figure 8 shows the category-wise comparison <strong>of</strong> performance<br />
<strong>of</strong> the earlier methods <strong>and</strong> the proposed methods.<br />
Table 2.<br />
The results <strong>of</strong> proposed methods<br />
Precision at n (calculated <strong>using</strong> n topmost results)<br />
Proposed Proposed<br />
Proposed WHSVM WHSVM<br />
Class method (holdout) (k-fold)<br />
Africa 0.69 0.76 0.82<br />
Beach 0.35 0.73 0.76<br />
Buildings 0.46 0.66 0.74<br />
Buses 0.62 0.86 0.75<br />
Dinosaurs 0.98 1.00 0.98<br />
Elephants 0.38 0.78 0.73<br />
Flower 0.60 0.90 0.98<br />
Horses 0.91 0.88 0.89<br />
Mountains 0.44 0.72 0.88<br />
Food 0.58 0.90 0.69<br />
Average 0.60 0.82 0.82<br />
WHSVM, Wavelet Histogram with Support Vector Machine.<br />
Figure 5. The virtual image space.<br />
Figure 6.<br />
Performance in terms <strong>of</strong> precision.<br />
CURRENT SCIENCE, VOL. 105, NO. 9, 10 NOVEMBER 2013 1273
RESEARCH COMMUNICATIONS<br />
Figure 7.<br />
Category-wise performance <strong>of</strong> proposed method.<br />
A CBIR system has been implemented successfully<br />
<strong>using</strong> the SVM neural network-<strong>based</strong> <strong>classification</strong> <strong>and</strong><br />
<strong>retrieval</strong> model. For constructing the model the simple<br />
colour indexed histogram <strong>and</strong> wavelet features are used 2 .<br />
The performance <strong>of</strong> the proposed CBIR system has been<br />
evaluated with st<strong>and</strong>ard SIMPLIcity dataset <strong>and</strong> has been<br />
compared with the results <strong>of</strong> some previous studies. The<br />
precision <strong>of</strong> the proposed system measured was found to<br />
be good <strong>and</strong> the proposed model was able to compete<br />
with all the compared models. Most <strong>of</strong> the earlier models<br />
produced almost equal or poor results even with the aid<br />
<strong>of</strong> sophisticated region, shape <strong>and</strong> texture matching techniques.<br />
But the proposed model provided excellent performance<br />
with simple features <strong>and</strong> a simple <strong>classification</strong><br />
model. Hence we have shown here the possibility <strong>of</strong> a<br />
better CBIR system with more simple <strong>and</strong> significant feature<br />
sets. It has been observed that the cause <strong>of</strong> error in<br />
finding the correct match is the nature <strong>of</strong> some <strong>images</strong><br />
which may belong to more than one category. So, our<br />
future work will address <strong>and</strong> solve this problem <strong>using</strong> a<br />
multi-modal system or with a multi-class <strong>classification</strong><br />
technique. In this study, we have directly used the feature<br />
set which has more than 256 attributes. Future studies<br />
may address more sophisticated statistical techniques<br />
such as PCA <strong>and</strong> LDA to select principal features/<br />
attributes from the whole attributes.<br />
Figure 8. Category-wise comparison <strong>of</strong> proposed methods with earlier<br />
methods.<br />
This fulfills the original research objective. It has been<br />
proved that the performance <strong>of</strong> a simple features-<strong>based</strong><br />
CBIR system can be made better than most <strong>of</strong> the sophisticated<br />
texture <strong>and</strong> shape-<strong>based</strong> CBIR systems, if the<br />
simple <strong>and</strong> distinct features are selected from the<br />
image <strong>and</strong> a suitable <strong>classification</strong> model is employed.<br />
1274<br />
1. Lu, D. <strong>and</strong> Weng, Q., A survey <strong>of</strong> image <strong>classification</strong> methods<br />
<strong>and</strong> techniques for improving <strong>classification</strong> performance. Int. J.<br />
Remote Sensing, 2007, 28, 823–870.<br />
2. Karpagam, V. <strong>and</strong> Rangarajan, R., A simple <strong>and</strong> competent system<br />
for <strong>content</strong> <strong>based</strong> <strong>retrieval</strong> <strong>of</strong> <strong>images</strong> <strong>using</strong> color indexed image<br />
histogram combined with discrete wavelet decomposition. Eur. J.<br />
Sci. Res., 2012, 73, 278–290.<br />
3. Chowdhury, M., Das, S. <strong>and</strong> Kundu, M. K., Novel CBIR system<br />
<strong>based</strong> on ripplet transform <strong>using</strong> interactive neuro-fuzzy technique.<br />
Electron. Lett. Computer Vision Image Anal., 2012, 11, 1–13.<br />
4. Deselaers, T., Keysers, D. <strong>and</strong> Ney, H., Features for image<br />
<strong>retrieval</strong>: an experimental comparison. Inf. Retrieval, 2008, 11,<br />
77–107.<br />
5. Banerjee, M., Kundua, M. K. <strong>and</strong> Maji, P., Content-<strong>based</strong> image<br />
<strong>retrieval</strong> <strong>using</strong> visually significant point features. Fuzzy Sets Syst.,<br />
2009, 160, 3323–3341.<br />
6. Hiremath, P. S. <strong>and</strong> Pujari, J., Content <strong>based</strong> image <strong>retrieval</strong> <strong>using</strong><br />
color boosted salient points <strong>and</strong> shape features <strong>of</strong> an image. Int. J.<br />
Image Process., 2008, 2, 10–17.<br />
7. Wang, J. Z., Li, J. <strong>and</strong> Wiederhold, G., SIMPLIcity: semanticssensitive<br />
integrated matching for picture libraries. IEEE Trans.<br />
Pattern Anal. Mach. Intelli., 2001, 23, 947–963.<br />
8. Spyrou, E., Stamou, G., Avrithis, Y. <strong>and</strong> Kollias, S., Fuzzy support<br />
vector machines for image <strong>classification</strong> f<strong>using</strong> MPEG-7 visual<br />
descriptors. In Proceeding <strong>of</strong> Integration <strong>of</strong> Knowledge,<br />
Semantics <strong>and</strong> Digital Media Technology, 2005. EWIMT 2005.<br />
The 2nd European Workshop on the (Ref. No. 2005/11099),<br />
ISBN: 0-86341-595-4.<br />
9. Gu, Q. <strong>and</strong> Song, Z., Image <strong>classification</strong> <strong>using</strong> SVM, KNN <strong>and</strong><br />
performance comparison with logistic regression, www.cs.<br />
dartmouth.edu/~afra/courses/44/w09/.../gu-song-report.pdf, 2009.<br />
10. Thai, L. E., Hai, T. S. <strong>and</strong> Thuy, N. T., Image <strong>classification</strong> <strong>using</strong><br />
support vector machine <strong>and</strong> artificial neural network. Int. J. Infor.<br />
Technol. Comput. Sci., 2012, 5, 32–38.<br />
CURRENT SCIENCE, VOL. 105, NO. 9, 10 NOVEMBER 2013
RESEARCH COMMUNICATIONS<br />
11. N<strong>and</strong>agopalan, S., Adiga, B. S. <strong>and</strong> Deepak, N., A universal<br />
model for <strong>content</strong>-<strong>based</strong> image <strong>retrieval</strong>. Int. J. Electr. Comput.<br />
Eng., 2009, 4.<br />
12. Malik, F. <strong>and</strong> Baharudin, B. B., Feature analysis <strong>of</strong> quantized histogram<br />
color features for <strong>content</strong>-<strong>based</strong> image <strong>retrieval</strong> <strong>based</strong> on<br />
Laplacian filter. In International Conference on System Engineering<br />
<strong>and</strong> Modeling. IACSIT Press, Singapore, 2012, vol. 34.<br />
13. Patil, M. P. <strong>and</strong> Kolhe, S. R., Automatic image categorization <strong>and</strong><br />
annotation <strong>using</strong> K-NN for corel dataset. Adv. Comput. Res., 4,<br />
108–112.<br />
14. Chapelle, O., Haffner, P. <strong>and</strong> Vapnik, V. N., Support vector<br />
machines for histogram-<strong>based</strong> image <strong>classification</strong>. IEEE Trans.<br />
Neural Networks, 1999, 10, 1055–1064.<br />
15. Chen, Y. <strong>and</strong> Wang, J. Z., A region-<strong>based</strong> fuzzy feature matching<br />
approach to <strong>content</strong>-<strong>based</strong> image <strong>retrieval</strong>. IEEE Trans. Pattern<br />
Anal. Mach. Intelli., 2002, 24, 1252–1267.<br />
16. Chang, C.-C. <strong>and</strong> Lin, C.-J., LIBSVM: a library for support vector<br />
machines, 2001; S<strong>of</strong>tware available at http://www.csie.ntu.edu.<br />
tw/~cjlin/libsvm<br />
17. Li, J., Wang, J. Z. <strong>and</strong> Wiederhold, G., IRM: integrated region<br />
matching for image <strong>retrieval</strong>. Proceedings <strong>of</strong> the 8th ACM International<br />
Conference on Multimedia, Los Angeles, CA, USA,<br />
2000, pp. 147–156.<br />
Received 18 January 2013; revised accepted 28 August 2013<br />
Application <strong>of</strong> fractal geometry in<br />
determining optimal quadrat size for<br />
vegetation sampling<br />
Anubhav Chaturvedi 1, * <strong>and</strong><br />
P. Rama Ch<strong>and</strong>ra Prasad 2<br />
1 Centre for Computational, Natural Sciences <strong>and</strong> Bioinformatics, <strong>and</strong><br />
2 Lab for Spatial Informatics, International Institute <strong>of</strong> Information<br />
Technology, Gachibowli, Hyderabad 500 032, India<br />
Geometry in ecological patterns <strong>of</strong> l<strong>and</strong>scape <strong>and</strong><br />
vegetation is not truly fractal, <strong>and</strong> varies across a<br />
range <strong>of</strong> scales, whereas fractal geometry provides<br />
tools for predicting <strong>and</strong> describing ecological patterns.<br />
In this study, fractal analysis is used to assess presence<br />
<strong>of</strong> pseudo r<strong>and</strong>om quadrats or spatial dependence<br />
which hamper generality <strong>and</strong> performance <strong>of</strong> classical<br />
inferential statistics. Fractal dimension (FD) as a function<br />
<strong>of</strong> scale is used to determine quadrat size which<br />
eliminates spatial dependence. The semivariograms<br />
are plotted with fractograms to correlate structures <strong>of</strong><br />
spatial dependence <strong>of</strong> the properties studied. The use<br />
<strong>of</strong> FD as a degree <strong>of</strong> spatial dependence <strong>of</strong> variables is<br />
the basis <strong>of</strong> applications <strong>of</strong> fractals.<br />
Keywords: Ecological patterns, fractal geometry, quadrat<br />
size, spatial dependence, vegetation sampling.<br />
A significant challenge encountered in plant ecological<br />
studies is vegetation sampling 1,2 . Researchers worldwide<br />
*For correspondence. (e-mail: anubhav.chaturvedi@students.iiit.ac.in)<br />
have analysed ecological attributes (species diversity,<br />
richness, dominance, etc.) <strong>of</strong> vegetation <strong>using</strong> r<strong>and</strong>om or<br />
stratified r<strong>and</strong>om sampling or by laying transects across<br />
some gradient 3–6 . Ecologists have used larger contiguous<br />
area <strong>and</strong> researchers have also designed certain plots as<br />
‘long-term ecological plots’ or ‘permanent dynamic plots’<br />
to monitor variability in species characteristics in spatiotemporal<br />
domain 7–15 . Whichever method is adopted, sampling<br />
is always a time-consuming process. Also, the size<br />
<strong>of</strong> the plot or quadrat that is used as the basic unit <strong>of</strong> sampling,<br />
varies depending on the type <strong>of</strong> vegetation <strong>and</strong> area<br />
covered. Though significant variation exists in the ecological<br />
patterns captured by r<strong>and</strong>om method (usually high<br />
<strong>and</strong> diverse) compared with large-area contiguous plots,<br />
these are basically used to underst<strong>and</strong> the behavioural<br />
patterns <strong>of</strong> the species in contiguous scale 11,16–19 .<br />
Studying the large-area plots (which range between 1<br />
<strong>and</strong> 50 ha), researchers have subdivided the entire plot<br />
into smaller units for better <strong>and</strong> quick sampling. The size<br />
<strong>of</strong> the smaller units are 1 m × 1 m, 10 m × 10 m, 30 m ×<br />
30 m or sometimes circular plots with varied dimensions<br />
2,19–22 . Within sub-units, ecologists study characteristic<br />
features <strong>of</strong> a species <strong>and</strong> its population or general<br />
diversity patterns, <strong>and</strong> compare the changing attributes<br />
across the quadrats conceptualizing the pattern at higher<br />
scale 23 . But when comparisons are made between neighbouring<br />
or adjacent quadrats, probability <strong>of</strong> variation is<br />
low as it lies in the same homogenous conditions – may<br />
be precipitation, edaphic, sometimes topography. This indicates<br />
greater similarity in two closely spaced quadrats<br />
compared to those that are separated by larger distances.<br />
These samples may be referred to as pseudo replicates,<br />
violating the most important assumption <strong>of</strong> classical<br />
inferential statistics that the samples are spatially independent<br />
24 .<br />
A homogeneous distribution is one that remains similar<br />
on repeated sub-division 25 . The arrangement or ordering<br />
<strong>of</strong> data as a function <strong>of</strong> location is called spatial autocorrelation<br />
<strong>of</strong> the function <strong>and</strong> the range <strong>of</strong> spatial scales in<br />
which spatial autocorrelation exists is called spatial<br />
dependence 26 . Avoiding spatially dependent quadrats<br />
(pseudo replicates), that do not contribute significant<br />
changes in any ecological property is necessary, to improve<br />
the performance <strong>of</strong> classical inferential statistics, as<br />
the existence <strong>of</strong> spatial dependence hampers the generality<br />
<strong>of</strong> results <strong>and</strong> overall performance <strong>of</strong> classical inferential<br />
statistics 27 .<br />
The concepts <strong>of</strong> fractal geometry can suggest a better<br />
statistically rectified sampling scheme, which eliminates<br />
the problem <strong>of</strong> spatial dependence among the quadrats 25 .<br />
Optimal quadrat sizes for homogeneous or spatially<br />
independent distribution can be determined by <strong>using</strong><br />
the methods <strong>of</strong> fractal analysis on the data. The quadrats<br />
<strong>of</strong> suggested sizes will be spatially independent <strong>and</strong><br />
thus independent <strong>of</strong> the distances by which they are separated.<br />
CURRENT SCIENCE, VOL. 105, NO. 9, 10 NOVEMBER 2013 1275