Download - GRaBS
Download - GRaBS
Download - GRaBS

You also want an ePaper? Increase the reach of your titles
YUMPU automatically turns print PDFs into web optimized ePapers that Google loves.
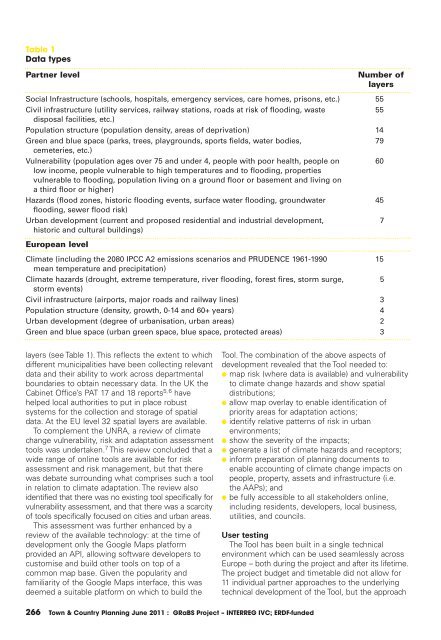
Table 1<br />
Data types<br />
Partner level<br />
Social Infrastructure (schools, hospitals, emergency services, care homes, prisons, etc.)<br />
Civil infrastructure (utility services, railway stations, roads at risk of flooding, waste<br />
disposal facilities, etc.)<br />
Population structure (population density, areas of deprivation)<br />
Green and blue space (parks, trees, playgrounds, sports fields, water bodies,<br />
cemeteries, etc.)<br />
Vulnerability (population ages over 75 and under 4, people with poor health, people on<br />
low income, people vulnerable to high temperatures and to flooding, properties<br />
vulnerable to flooding, population living on a ground floor or basement and living on<br />
a third floor or higher)<br />
Hazards (flood zones, historic flooding events, surface water flooding, groundwater<br />
flooding, sewer flood risk)<br />
Urban development (current and proposed residential and industrial development,<br />
historic and cultural buildings)<br />
European level<br />
Climate (including the 2080 IPCC A2 emissions scenarios and PRUDENCE 1961-1990<br />
mean temperature and precipitation)<br />
Climate hazards (drought, extreme temperature, river flooding, forest fires, storm surge,<br />
storm events)<br />
Civil infrastructure (airports, major roads and railway lines)<br />
Population structure (density, growth, 0-14 and 60+ years)<br />
Urban development (degree of urbanisation, urban areas)<br />
Green and blue space (urban green space, blue space, protected areas)<br />
Number of<br />
layers<br />
55<br />
55<br />
14<br />
79<br />
60<br />
45<br />
7<br />
15<br />
5<br />
3<br />
4<br />
2<br />
3<br />
layers (see Table 1). This reflects the extent to which<br />
different municipalities have been collecting relevant<br />
data and their ability to work across departmental<br />
boundaries to obtain necessary data. In the UK the<br />
Cabinet Office’s PAT 17 and 18 reports 5,6 have<br />
helped local authorities to put in place robust<br />
systems for the collection and storage of spatial<br />
data. At the EU level 32 spatial layers are available.<br />
To complement the UNRA, a review of climate<br />
change vulnerability, risk and adaptation assessment<br />
tools was undertaken. 7 This review concluded that a<br />
wide range of online tools are available for risk<br />
assessment and risk management, but that there<br />
was debate surrounding what comprises such a tool<br />
in relation to climate adaptation. The review also<br />
identified that there was no existing tool specifically for<br />
vulnerability assessment, and that there was a scarcity<br />
of tools specifically focused on cities and urban areas.<br />
This assessment was further enhanced by a<br />
review of the available technology: at the time of<br />
development only the Google Maps platform<br />
provided an API, allowing software developers to<br />
customise and build other tools on top of a<br />
common map base. Given the popularity and<br />
familiarity of the Google Maps interface, this was<br />
deemed a suitable platform on which to build the<br />
Tool. The combination of the above aspects of<br />
development revealed that the Tool needed to:<br />
● map risk (where data is available) and vulnerability<br />
to climate change hazards and show spatial<br />
distributions;<br />
● allow map overlay to enable identification of<br />
priority areas for adaptation actions;<br />
● identify relative patterns of risk in urban<br />
environments;<br />
● show the severity of the impacts;<br />
● generate a list of climate hazards and receptors;<br />
● inform preparation of planning documents to<br />
enable accounting of climate change impacts on<br />
people, property, assets and infrastructure (i.e.<br />
the AAPs); and<br />
● be fully accessible to all stakeholders online,<br />
including residents, developers, local business,<br />
utilities, and councils.<br />
User testing<br />
The Tool has been built in a single technical<br />
environment which can be used seamlessly across<br />
Europe – both during the project and after its lifetime.<br />
The project budget and timetable did not allow for<br />
11 individual partner approaches to the underlying<br />
technical development of the Tool, but the approach<br />
266 Town & Country Planning June 2011 : <strong>GRaBS</strong> Project – INTERREG IVC; ERDF-funded