offshore grids for wind power integration - Greenpeace
offshore grids for wind power integration - Greenpeace
offshore grids for wind power integration - Greenpeace

You also want an ePaper? Increase the reach of your titles
YUMPU automatically turns print PDFs into web optimized ePapers that Google loves.
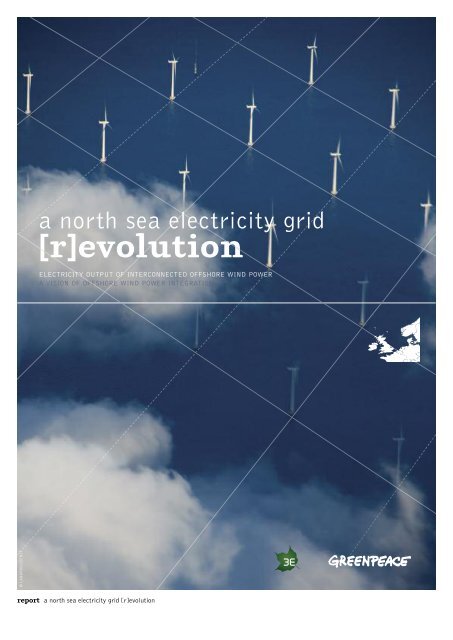
a north sea electricity grid<br />
[r]evolution<br />
ELECTRICITY OUTPUT OF INTERCONNECTED OFFSHORE WIND POWER<br />
A VISION OF OFFSHORE WIND POWER INTEGRATION<br />
© LANGROCK/ZENIT<br />
© DREAMSTIME<br />
© ISTOCK<br />
report a north sea electricity grid [r]evolution
executive summary 3<br />
abbreviations 7<br />
1 introduction 8<br />
1.1 objectives 8<br />
1.2 previous studies 9<br />
1.3 approach 10<br />
1.4 guide to the reader 10<br />
2 <strong>wind</strong> <strong>power</strong> in the <strong>power</strong> system:<br />
availability and variability 11<br />
3 methodology 13<br />
3.1 installed <strong>wind</strong> <strong>power</strong> scenario 13<br />
3.2 time series of <strong>wind</strong> speed and <strong>power</strong> 15<br />
4 <strong>offshore</strong> <strong>grids</strong> <strong>for</strong> <strong>wind</strong> <strong>power</strong> <strong>integration</strong> 16<br />
4.1 existing offhore grid concepts 16<br />
4.2 technology 16<br />
4.3 drivers <strong>for</strong> <strong>offshore</strong> grid development 18<br />
4.4 <strong>offshore</strong> grid proposal 19<br />
5 results and analysis 23<br />
5.1 <strong>offshore</strong> <strong>power</strong> generation 23<br />
5.2 <strong>wind</strong> <strong>power</strong> output over time 24<br />
5.3 availability of <strong>wind</strong> <strong>power</strong> generation 25<br />
5.4 variability of <strong>wind</strong> <strong>power</strong> generation 27<br />
6 discussion and conclusions 29<br />
6.1 availability and variability 29<br />
6.2 flexibility 30<br />
6.3 perspectives <strong>for</strong> an <strong>offshore</strong> grid 31<br />
annex 32<br />
references 37<br />
<strong>Greenpeace</strong>, 3E<br />
date August 2008<br />
3E Rue du Canal 61 Vaartstraat, B-1000 Brussels, Belgium<br />
<strong>Greenpeace</strong> Belgium Haachtsesteenweg 159, chaussée de Haecht, 1030 Brussels, Belgium<br />
authors Achim Woyte, Jan De Decker, Vu Van Thong (3E)<br />
acknowledgements The authors thank Abha Sood and Michael Schmidt from For<strong>wind</strong>, Oldenburg<br />
<strong>for</strong> the calculation of the time series of <strong>wind</strong> speed and <strong>power</strong> generation <strong>for</strong> the <strong>wind</strong> farm sites. Frans Van Hulle<br />
from the European Wind Energy Association, Brussels, is acknowledged <strong>for</strong> technical discussion and critical review of the study.<br />
maps Grégory Ignace<br />
design & layout onehemisphere, Sweden, www.onehemisphere.se<br />
printing Imprimerie Massoz, Belgium, www.massoz.be<br />
contact <strong>Greenpeace</strong> Belgium: jputte@be.greenpeace.org<br />
3E: info@3E.eu<br />
<strong>for</strong> further in<strong>for</strong>mation about the global, regional and national scenarios please visit<br />
the energy [r]evolution website: www.energyblueprint.info/<br />
GPI REF JN 035. Published by <strong>Greenpeace</strong> and 3E. Printed on 100% recycled paper created entirely<br />
from post consumer waste, using vegetable oil based inks.<br />
© DREAMSTIME<br />
cover image OFFSHORE WINDFARM, MIDDELGRUNDEN, COPENHAGEN, DENMARK.<br />
image WIND TURBINE.<br />
2
executive summary<br />
“IT IDENTIFIES PRIORITIES FOR AN EFFICIENT INTEGRATION OF LARGE-SCALE OFFSHORE WIND POWER INTO THE EUROPEAN POWER<br />
SYSTEMS WITH SPECIAL FOCUS ON THE DEVELOPMENT OF AN OFFSHORE GIRD IN THE NORTH SEA.”<br />
© PAUL LANGROCK/ZENIT/GREENPEACE<br />
image OFFSHORE WINDFARM, MIDDELGRUNDEN, COPENHAGEN, DENMARK.<br />
objectives & scope<br />
The study shows how <strong>offshore</strong> <strong>wind</strong> <strong>power</strong> in the North Sea is<br />
suited to supplying the electricity demand. Perspectives are<br />
developed <strong>for</strong> the interconnection of <strong>offshore</strong> <strong>wind</strong> farms by a<br />
transnational <strong>offshore</strong> grid including an estimate of the cost <strong>for</strong><br />
marine <strong>power</strong> transmission infrastructure.<br />
This study builds on the acquired knowledge from a large number<br />
of studies by <strong>Greenpeace</strong> and other organisations, in which,<br />
amongst other results, development roadmaps or <strong>for</strong>ecasts of<br />
installed <strong>offshore</strong> <strong>wind</strong> <strong>power</strong> capacity have been presented. In<br />
contrast with those studies, the present study is technical. It<br />
identifies priorities <strong>for</strong> an efficient <strong>integration</strong> of large-scale<br />
<strong>offshore</strong> <strong>wind</strong> <strong>power</strong> into the European <strong>power</strong> systems with special<br />
focus on the development of an <strong>offshore</strong> grid in the North Sea.<br />
availability & variability of <strong>wind</strong> <strong>power</strong><br />
Although dependent on meteorological variations, the electricity<br />
generated from <strong>wind</strong> energy over the years can be estimated with<br />
high precision. Wind energy, there<strong>for</strong>e, is a reliable source <strong>for</strong><br />
electricity generation. Since <strong>wind</strong> <strong>power</strong> has neither fuel costs nor<br />
noxious emissions <strong>wind</strong> farms should always be operated at the<br />
maximal available <strong>power</strong> level.<br />
With increasing amounts of <strong>wind</strong> <strong>power</strong> in today’s <strong>power</strong> systems,<br />
<strong>wind</strong> <strong>power</strong> affects the dispatch of conventional <strong>power</strong> plants.Two<br />
main effects, that have an impact on the overall efficiency of the<br />
<strong>power</strong> system are explored here: availability of <strong>power</strong> and its<br />
variability.The availability of <strong>wind</strong> <strong>power</strong> over the year is put in<br />
relation to other generation units and demand. Especially at <strong>wind</strong><br />
<strong>power</strong> penetration levels of 10% and higher (corresponding to EU<br />
targets <strong>for</strong> 2020), the variability of <strong>wind</strong> <strong>power</strong> generation over<br />
several hours and days requires a more flexible dispatch of different<br />
types of <strong>power</strong> plants than is done today.<br />
The ability to meet demand at any time must be regarded <strong>for</strong> a<br />
<strong>power</strong> system as a whole, taking into account the demand, the<br />
flexibility of available conventional <strong>power</strong> plants, and<br />
complementary renewable sources. In view of the social consensus<br />
in favour of ambitious renewable energy targets in the European<br />
Union, the <strong>power</strong> system needs to integrate generation from<br />
sustainable sources proactively.<br />
3
GLOBAL ENERGY [R]EVOLUTION<br />
A NORTH SEA ELECTRICITY GRID [R]EVOLUTION<br />
The following means can facilitate the transition to an efficient<br />
<strong>power</strong> system based on sustainable sources:<br />
• increased transmission capacity between <strong>power</strong> systems<br />
and synchronous zones,<br />
• use of solar <strong>power</strong> and marine renewables being uncorrelated<br />
to <strong>wind</strong> <strong>power</strong>,<br />
• demand-side management, e.g., by introduction of demand<br />
elasticity on the <strong>power</strong> market,<br />
• energy storage, distributed and centralized.<br />
<strong>wind</strong> <strong>power</strong> scenario & modelling<br />
The <strong>wind</strong> <strong>power</strong> scenario used in this study assumes a total<br />
installed capacity of 68.4 GW (Table 1). Locations of <strong>offshore</strong><br />
<strong>wind</strong> <strong>power</strong> generation have been identified based on lists of<br />
envisioned projects.The totals of installed <strong>power</strong> per country have<br />
been cross-checked with national and international targets.<br />
Geographically, the scenario is limited to the North Sea.<br />
The authors consider the proposed scenario to be a best guess <strong>for</strong><br />
the long term. Since the applied <strong>offshore</strong> <strong>wind</strong> <strong>power</strong> scenario<br />
mainly serves as a boundary condition <strong>for</strong> the technical study, no<br />
time frame has been assigned to it. Based on other recent studies<br />
however, the estimated timeframe <strong>for</strong> the development of 68GW<br />
<strong>offshore</strong> <strong>wind</strong> in the North Sea is between 2020 and 2030. Finally,<br />
the study does not account <strong>for</strong> emerging technology solutions like<br />
floating <strong>wind</strong> turbines on the open sea, wave <strong>power</strong> and tidal<br />
stream <strong>power</strong> generation.There<strong>for</strong>e, in terms of these emerging<br />
technologies, the scenario is conservative.<br />
Wind <strong>power</strong> generation has been calculated from hourly time series<br />
of <strong>wind</strong> speed <strong>for</strong> a 9x9 km² grid.The time series have been<br />
computed by downscaling empirical data from a period of three<br />
years with a lower resolution in time and space, with a mesoscale<br />
numerical weather prediction model.<br />
For the conversion of <strong>wind</strong> speed into output <strong>power</strong> per <strong>wind</strong> farm,<br />
a regional <strong>power</strong> curve has been used.<br />
table 1: capacity scenario <strong>for</strong> <strong>offshore</strong> <strong>wind</strong> <strong>power</strong>,<br />
electricity generation, capacity factor and electricity<br />
consumption per country (WIND POWER IN THE NORTH SEA ONLY)<br />
COUNTRY<br />
Belgium<br />
Denmark<br />
France<br />
Germany<br />
Great Britain<br />
Netherlands<br />
Norway<br />
Total<br />
INSTALLED<br />
CAPACITY<br />
[MW]<br />
3,846<br />
1,577<br />
1,000<br />
26,418<br />
22,238<br />
12,039<br />
1,290<br />
68,408<br />
ELECTRICITY<br />
/ YEAR [TWH]<br />
13.1<br />
5.6<br />
3.4<br />
97.5<br />
80.8<br />
41.7<br />
4.9<br />
247.0<br />
AVERAGE<br />
CAPACITY<br />
FACTOR [%]<br />
38.9<br />
40.5<br />
38.8<br />
42.1<br />
41.5<br />
39.6<br />
43.7<br />
41.2<br />
TOTAL<br />
ELECTRICITY<br />
CONSUMPTION<br />
2006 [TWH]<br />
89.9<br />
36.4<br />
478.4<br />
559.0<br />
405.8<br />
116.2<br />
122.6<br />
1,808.3<br />
technology <strong>for</strong> marine <strong>power</strong> transmission<br />
Wind farms situated more than approximately 90 km from an<br />
onshore substation should be connected by high-voltage DC<br />
(HVDC) cables in order to reduce electrical losses and investment<br />
costs. Wind farms situated less than 50 km from the onshore<br />
transmission grid will in general be connected by high-voltage AC<br />
(HVAC) cables. In the intermediate range, the choice <strong>for</strong> AC or DC<br />
technology will depend on project-specific parameters.<br />
For technical and economic reasons, high-voltage DC systems <strong>for</strong><br />
the connection of <strong>offshore</strong> <strong>wind</strong> farms will be based on voltage<br />
source converter (VSC) technology, in contrast to the classical, socalled<br />
line-commutated, HVDC systems that have been applied until<br />
now <strong>for</strong> the electrical interconnection between <strong>power</strong> systems.The<br />
HVDC VSC technology permits connection of a <strong>wind</strong> farm directly<br />
to the end of a line. Moreover, this technology enables a multiterminal<br />
configuration: a lay-out where several <strong>offshore</strong> <strong>wind</strong> farms<br />
could virtually be plugged into the line along the way.There<strong>for</strong>e,<br />
HVDC VSC is the enabling technology <strong>for</strong> the development of any<br />
marine grid that is to contain <strong>offshore</strong> nodes.<br />
<strong>offshore</strong> <strong>grids</strong><br />
The value of an <strong>offshore</strong> grid in the North Sea lies mainly in its<br />
role as a facilitator <strong>for</strong> <strong>power</strong> exchange and trade between regions<br />
and <strong>power</strong> systems. As such it can introduce additional flexibility to<br />
the <strong>power</strong> system. Moreover, an <strong>offshore</strong> grid allows the aggregation<br />
and dispatch of <strong>power</strong> from <strong>offshore</strong> <strong>wind</strong> farms from different<br />
regions, resulting in <strong>power</strong> generation profiles of low variability.<br />
In the present study, an <strong>offshore</strong> grid topology is proposed (Figure 1)<br />
that is driven by two distinguished policy drivers: the need <strong>for</strong><br />
connectivity between countries and <strong>power</strong> market regions and the<br />
demand <strong>for</strong> an economically efficient connection of <strong>offshore</strong> <strong>wind</strong><br />
farms. While connectivity is considered the main driver today, the<br />
connection of <strong>offshore</strong> <strong>wind</strong> farms will gain importance in the<br />
future, when <strong>offshore</strong> converter stations <strong>for</strong> HVDC will be required<br />
<strong>for</strong> the connection of <strong>wind</strong> farms far from shore.<br />
The required converter stations will be on the open North Sea and<br />
with an additional investment they can be connected to each other<br />
or to another shore.This would allow the allocation of the spare<br />
capacity of the line to the <strong>power</strong> market, while it is not used by<br />
<strong>wind</strong> <strong>power</strong>. For arbitrage between market regions, the possibility to<br />
make use of an extended <strong>wind</strong> farm grid connection is a cheaper<br />
alternative to the development of separate cables. Since the<br />
prolongation of lines from <strong>offshore</strong> <strong>wind</strong> farm converter stations is<br />
economically beneficial as long as there is opportunity <strong>for</strong><br />
arbitrage, an <strong>offshore</strong> grid will probably emerge in such a way.<br />
All lines together of the proposed <strong>offshore</strong> grid have a total single line<br />
length of 6200 km. Assuming that, in an initial phase, all transmission<br />
lines have a capacity of 1 GW, the proposed <strong>offshore</strong> grid would cost<br />
15-20 billion Euros.The amount indicated would be needed to develop<br />
the proposed <strong>offshore</strong> grid from scratch with 1 GW capacity <strong>for</strong> each<br />
line, as it may be useful <strong>for</strong> the purpose of trade only. For increasing<br />
transmission capacities, costs increase at a slightly less than linear rate.<br />
4
GLOBAL ENERGY [R]EVOLUTION<br />
A NORTH SEA ELECTRICITY GRID [R]EVOLUTION<br />
results<br />
Over the year, the installed <strong>offshore</strong> <strong>wind</strong> <strong>power</strong> generation capacity<br />
of 68.4 GW would generate 247 TWh of electricity.The average<br />
capacity factor is 41.2%.<br />
Over the year, a single <strong>offshore</strong> <strong>wind</strong> farm will experience significant<br />
periods during which the farm is running at full <strong>power</strong>. Nontheless,<br />
a single <strong>wind</strong> farm will also experience periods of very low load.<br />
When adding up <strong>power</strong> generation over the whole North Sea, the<br />
periods of very low and very high <strong>power</strong> generation are negligible.<br />
Eighty percent of the time the <strong>power</strong> output is more than 15.5% of<br />
the total installed capacity (Figure 2).<br />
Accumulating the <strong>power</strong> generation from <strong>wind</strong> farms over larger<br />
regions can reduce the periods of full load and very low load. In<br />
conclusion, the spatial spread of <strong>wind</strong> farms over the North Sea leads<br />
to a larger fraction of time during which medium level <strong>power</strong> is<br />
generated in exchange <strong>for</strong> a reduction of periods of full load.<br />
Situations of full and no load occur during a negligible fraction of time.<br />
With regard to unit commitment and dispatch of the <strong>power</strong> system,<br />
this means that the target should not be to operate <strong>offshore</strong> <strong>wind</strong><br />
<strong>power</strong> in the North Sea as a classical base load plant. Wind <strong>power</strong><br />
should rather be seen as a part of a <strong>power</strong> generation portfolio<br />
that, as a whole, has to be managed in order to supply the variable<br />
demand. For such portfolio management, flexibility is needed in<br />
supply, demand, import and export. Day-ahead and intra-day<br />
<strong>for</strong>ecasting of the <strong>wind</strong> <strong>power</strong> generation is required <strong>for</strong> optimal<br />
dispatch decisions and minimization of reserve requirements.<br />
figure 2: <strong>power</strong> output of <strong>offshore</strong> <strong>wind</strong> <strong>power</strong><br />
over two days FOR ONE WIND FARM, ALL WIND FARMS OFF THE<br />
BRITISH EAST COAST AND ACCUMULATED FOR ALL OFFSHORE WIND<br />
FARMS IN THE NORTH SEA<br />
Power(MW)<br />
6<br />
1,000<br />
0<br />
22,238<br />
0<br />
68,400<br />
0<br />
a) London Array I-IV: 1000 MW<br />
b) All Offshore Wind Farms off the British East Coast: 22,238 MW<br />
c) All Offshore Wind Farms in the North Sea: 68.4 GW<br />
0hrs 12hrs 0hrs 12hrs 0hrs<br />
April 3-4, 2006<br />
The calculations <strong>for</strong> the North Sea show that large variations of<br />
aggregated <strong>wind</strong> <strong>power</strong> generation are not very frequent (Figure 3).<br />
For a single <strong>wind</strong> farm, 35% of all hourly variations are of less<br />
than ±1% of installed capacity. For all <strong>wind</strong> farms off the British<br />
east coast together, this is the case <strong>for</strong> 40% of all hourly samples.<br />
For the accumulated generation of all <strong>wind</strong> farms together in the<br />
North Sea, 42% of all hourly variations are of less than ±1%. In<br />
all cases, more than 50% of all variations are of less than ±2% of<br />
installed capacity.<br />
Variations larger than ±5% occur <strong>for</strong> 20% of all hourly samples<br />
<strong>for</strong> the single <strong>wind</strong> farm. For all <strong>wind</strong> farms off the British east<br />
coast together they occur only 10% of the time and <strong>for</strong> the entire<br />
North Sea only 6%.The occurrence of variations beyond ±10%<br />
appears to be negligible.<br />
figure 3: relative frequency of hourly variations<br />
in generation FOR ONE WIND FARM, ALL WIND FARMS OFF THE<br />
BRITISH EAST COAST AND ACCUMULATED FOR ALL OFFSHORE WIND<br />
FARMS IN THE NORTH SEA<br />
Relative Frequency [%]<br />
a) London Array I-IV: 1000 MW<br />
50<br />
40<br />
30<br />
20<br />
10<br />
0<br />
50<br />
40<br />
30<br />
20<br />
10<br />
0<br />
50<br />
40<br />
30<br />
20<br />
10<br />
0<br />
b) All Offshore Wind Farms off the British East Coast: 22,238 MW<br />
c) All Offshore Wind Farms in the North Sea: 68.4 GW<br />
-15 -10 -5 0 5 10 15<br />
Hourly Variation as % of Capacity<br />
Flexibility is the key requirement from a <strong>power</strong> system that is<br />
largely based on generation from variable renewable sources.<br />
Flexibility can be introduced by:<br />
• distributed generation and storage,<br />
• controllable demand,<br />
• centralized storage,<br />
• reservoir hydro <strong>power</strong>,<br />
• flexible thermal <strong>power</strong> stations.
image REPARATION WORK ON A<br />
WINDPARK OF THE COAST OF GERMANY.<br />
© LANGROCK/ZENIT/GP<br />
conclusion<br />
An <strong>offshore</strong> grid in the North Sea facilitates trade and it increases<br />
security of supply by offering increased connectivity. It allows<br />
dispatching <strong>power</strong> from <strong>offshore</strong> <strong>wind</strong> farms to different countries<br />
depending on the highest demand. By enabling the supply of<br />
aggregated generation profiles from different regions to one market,<br />
the <strong>offshore</strong> grid contributes to reducing the variability of <strong>wind</strong> <strong>power</strong><br />
generation in the range of hours. Moreover, an <strong>offshore</strong> grid in the<br />
North Sea allows the import of electricity from hydro <strong>power</strong> from<br />
Norway to the British and the UCTE system.This can replace thermal<br />
base load plants and increase the flexibility within a portfolio. In<br />
addition, increased liquidity and trading facilities on the European<br />
<strong>power</strong> markets will allow <strong>for</strong> a more efficient portfolio management.<br />
The value of an <strong>offshore</strong> grid in the North Sea lies in its<br />
contribution <strong>for</strong> increased security of supply, its function <strong>for</strong> the<br />
aggregation and dispatch of <strong>power</strong> from <strong>offshore</strong> <strong>wind</strong> farms, and<br />
in its role as a facilitator <strong>for</strong> <strong>power</strong> exchange and trade between<br />
regions and <strong>power</strong> systems. Integrating interconnectors with<br />
connection lines <strong>for</strong> <strong>wind</strong> farms far from shore can yield efficiency<br />
gains <strong>for</strong> the development of both <strong>wind</strong> <strong>power</strong> projects and<br />
commercial interconnectors.<br />
abbreviations<br />
AC Alternative Current<br />
BERR British Department <strong>for</strong> Business,<br />
Enterprise & Regulatory Re<strong>for</strong>m<br />
BSH German Federal Maritime and Hydrographical Agency<br />
(Bundesamt für Seeschifffahrt und Hydrographie)<br />
BWEA British Wind Energy Association<br />
CAES Compressed Air Energy Storage<br />
CCGT Combined Cycle Gas Turbine<br />
CE2030 Belgian Expert Commission on Energy 2030<br />
(Commissie Energie 2030)<br />
CHP Combined Heat and Power<br />
COD Concerted Action of Offshore Wind Energy Deployment<br />
DW Douglas Westwood<br />
DC Direct Current<br />
Dena German Energy Agency (Deutsche Energie-Agentur)<br />
DLR German Aerospace Center<br />
(Deutsches Zentrum für Luft- und Raumfahrt)<br />
EACI Executive Agency <strong>for</strong> Competitiveness and Innovation<br />
EEZ Exclusive Economic Zone<br />
EPC Equivalent Wind Power Curve<br />
ETSO European Transmission System Operators<br />
EWEA European Wind Energy Council<br />
EWIS European Wind Integration Study<br />
FNL Final Analysis<br />
GWEC Global Wind Energy Council<br />
HVDC High Voltage Direct Current<br />
HVAC High Voltage Alternative Current<br />
IGBT Insulated Gate Bi-Polar Transistor<br />
LCC Line Commutated Converter<br />
MW, GW megawatt, gigawatt (unit of <strong>power</strong>)<br />
MWh, GWh megawatt-hour, gigawatt-hour (unit of energy)<br />
NCEP United States’ National Center<br />
<strong>for</strong> Environmental Prediction<br />
NWP Numerical Weather Prediction<br />
OCGT Open Cycle Gas Turbine<br />
PAS Pumped hydro Accumulation Storage<br />
TEN-E Trans-European Energy Networks<br />
TSO Transmission System Operator<br />
UCTE Union <strong>for</strong> the Coordination of Transmission of Electricity<br />
VSC Voltage Source Converter<br />
WRF Weather Research and Forecasting Model<br />
7
GLOBAL ENERGY [R]EVOLUTION<br />
A NORTH SEA ELECTRICITY GRID [R]EVOLUTION<br />
introduction<br />
“OFFSHORE WIND ENERGY HAS THE CAPACITY TO GENERATE A SIGNIFICANT SHARE OF ELECTRICITY<br />
IN A FUTURE EUROPEAN ENERGY MIX BASED LARGELY ON RENEWABLE SOURCES.”<br />
1<br />
© GREENPEACE/KATE DAVISON<br />
image MAN USING METAL GRINDER ON PART OF A WIND TURBINE MAST IN THE VESTAS FACTORY, CAMBELTOWN, SCOTLAND, GREAT BRITAIN.<br />
WIND TURBINES ARE NOT ONLY A SOURCE OF RENEWABLE ENERGY BUT ALSO A SOURCE OF EMPLOYMENT.<br />
1.1 objectives<br />
Offshore <strong>wind</strong> energy has the capacity to generate a significant<br />
share of electricity in a future European energy mix based largely<br />
on renewable sources. Along with the investments in <strong>offshore</strong> <strong>wind</strong><br />
<strong>power</strong> <strong>for</strong> the next two decades, the interconnection of <strong>offshore</strong><br />
<strong>wind</strong> farms via a, possibly meshed, <strong>offshore</strong> grid has repeatedly<br />
been brought up by public bodies and private companies.<br />
The overall objectives of this study are to show how <strong>offshore</strong> <strong>wind</strong><br />
<strong>power</strong> is suited to supplying the demand <strong>for</strong> electricity and to<br />
developing perspectives <strong>for</strong> the interconnection of <strong>offshore</strong> <strong>wind</strong><br />
farms by an <strong>offshore</strong> grid.<br />
For decision makers, this report can serve <strong>for</strong> developing a vision<br />
on <strong>offshore</strong> <strong>wind</strong> <strong>power</strong> <strong>integration</strong> that is broad as well as<br />
technically well founded. It answers the following questions:<br />
• What is the <strong>power</strong> output that large-scale <strong>offshore</strong> <strong>wind</strong> energy<br />
in the North Sea can deliver over time?<br />
• In what way do techno-economic developments in the <strong>power</strong><br />
sector influence this output?<br />
• How is the development of an <strong>offshore</strong> grid influenced<br />
by political priorities?<br />
• What is the cost of interconnecting <strong>offshore</strong> <strong>wind</strong> energy generation?<br />
The study answers these questions in general terms. Costs <strong>for</strong><br />
<strong>offshore</strong> infrastructure are described by order of magnitude.<br />
Complementary measures in order to improve the economic<br />
efficiency of <strong>power</strong> systems with a high share of <strong>wind</strong> <strong>power</strong> are<br />
discussed; however, no quantitative analysis was carried out. An<br />
examination of such measures with regard to the <strong>integration</strong> of<br />
electricity from renewable sources would require a separate study.<br />
8
image SUBMARINE CABLE BEING<br />
CONNECTED TO A WINDFARM.<br />
© COURTESY OF ABB<br />
1.2 previous studies<br />
Regarding <strong>wind</strong> <strong>power</strong>, numerous policy studies about market<br />
development, energy generation potential and <strong>power</strong> system<br />
<strong>integration</strong> are available. <strong>Greenpeace</strong>, in cooperation with different<br />
partners, has published a series of studies on the <strong>wind</strong> <strong>power</strong><br />
potential in the North Sea as well as on the potential market<br />
development of renewables, and <strong>wind</strong> <strong>power</strong> in particular, world-wide.<br />
• Offshore Wind Energy in the North Sea (2000) [1]<br />
• Sea Wind Europe (2004) [2]<br />
• Offshore Wind - Implementing a new <strong>power</strong> house<br />
<strong>for</strong> Europe (2005) [3]<br />
• Wind Force 12 (2005) [4]<br />
• Global Wind Energy Outlook (2006) [5]<br />
• Energy Revolution: a sustainable pathway to a clean energy<br />
future <strong>for</strong> Europe [6], and<br />
• Energy [R]evolution [7].<br />
The first three reports ([1] - [3]) focus on <strong>offshore</strong> <strong>wind</strong> <strong>power</strong> in<br />
Europe. While Sea Wind Europe mainly estimates the resource<br />
potential, Offshore Wind - Implementing a new <strong>power</strong> house <strong>for</strong><br />
Europe in particular addresses issues of grid and <strong>power</strong> system<br />
<strong>integration</strong>.The study focuses mainly on questions of grid<br />
connection and infrastructure. It also contains a review of<br />
technologies <strong>for</strong> <strong>offshore</strong> <strong>power</strong> transmission. Aspects such as<br />
international cooperation and levelling of the <strong>wind</strong> <strong>power</strong> generation<br />
over the North Sea are not addressed.<br />
Wind Force 12 and the Global Wind Energy Outlook are published<br />
by <strong>Greenpeace</strong> in cooperation with the European Wind Energy<br />
Association (EWEA) and the Global Wind Energy Council<br />
(GWEC), respectively.They are feasibility studies identifying the<br />
economical and political needs to realize a significant contribution<br />
of <strong>wind</strong> <strong>power</strong> to the global electricity supply in the long term.<br />
Recently, EWEA published two updated scenarios <strong>for</strong> the European<br />
Union.The report “Delivering <strong>offshore</strong> <strong>wind</strong> <strong>power</strong> in Europe” [8],<br />
published in December 2007, provides policy recommendations in<br />
order to achieve an ambitious <strong>offshore</strong> <strong>wind</strong> <strong>power</strong> scenario of up<br />
to 40 GW installed by 2020.The report “Pure Power” [9],<br />
published in March 2008, provides updated targets up to 2030 <strong>for</strong><br />
installed capacity onshore and <strong>offshore</strong> in the European Union.<br />
“Pure Power” targets 35 GW of installed <strong>offshore</strong> <strong>wind</strong> <strong>power</strong> in<br />
the EU27 in 2020 and 120 GW in 2030.<br />
The “Energy Revolution” reports provide blueprints <strong>for</strong> a<br />
sustainable pathway to a clean energy future. While the 2005<br />
report [6] focuses on the European Union, the “Energy<br />
[R]evolution” scenario from 2007 [7] provides an alternative to the<br />
IEA’s World Energy Outlook. It demonstrates how to apply existing<br />
technologies to halve global CO2 emissions by 2050 whilst allowing<br />
<strong>for</strong> an increase in energy consumption.<br />
Other important studies covering grid-<strong>integration</strong> aspects of<br />
<strong>offshore</strong> <strong>wind</strong> <strong>power</strong> at the European level are<br />
• Sealegal: Enabling Offshore Wind Developments (2002) [10],<br />
• Concerted Action <strong>for</strong> Offshore Wind Energy Deployment, esp.<br />
report on Grid Issues (2005) [11],<br />
• EWEA – Integration of Wind Energy in the European Power<br />
Supply (2005) [12],<br />
• ETSO – European Wind Integration Study (EWIS),<br />
phase 1 (2007) [13],<br />
• IEA Wind Task 25: Design and operation of <strong>power</strong> systems<br />
with large amounts of <strong>wind</strong> <strong>power</strong> [14],<br />
• TradeWind (2008) [15].<br />
“Sealegal” is a policy study covering legal and siting issues <strong>for</strong> <strong>offshore</strong><br />
<strong>wind</strong> and providing best-practice guidelines <strong>for</strong> siting and permitting<br />
policy. As a follow up, the Concerted Action <strong>for</strong> Offshore Wind Energy<br />
Deployment (COD) inventoried a number of issues <strong>for</strong> <strong>offshore</strong> <strong>wind</strong><br />
energy that are not solely technical. Amongst other results, in 2005 the<br />
COD published a comprehensive inventory of <strong>power</strong> system and grid<br />
issues <strong>for</strong> <strong>offshore</strong> <strong>wind</strong> in the participating countries.With regard to<br />
<strong>offshore</strong> <strong>power</strong> transmission, the COD emphasized that “common<br />
<strong>offshore</strong> substations could become initial nodes of an international<br />
<strong>offshore</strong> grid.”The COD also stated that infrastructures were required<br />
<strong>for</strong> the transmission of <strong>wind</strong> <strong>power</strong> over wide distances in order to<br />
benefit from the existing spatial decorrelation of <strong>wind</strong> speed.<br />
Also in 2005, EWEA published its comprehensive report on the<br />
Integration of Wind Energy in the European Power Supply.The<br />
report can be seen as an inventory of <strong>power</strong> system <strong>integration</strong><br />
issues <strong>for</strong> <strong>wind</strong> energy and the state-of-the-art the <strong>wind</strong> <strong>power</strong><br />
industry had achieved at that time in order to tackle them.<br />
The European Wind Integration Study (EWIS), phase 1, was<br />
published in January 2007. EWIS is an initiative established by the<br />
association of European Transmission System Operators (ETSO).The<br />
scope of work in EWIS covers technical, operational, market and<br />
regulatory aspects related to the <strong>integration</strong> of <strong>wind</strong> <strong>power</strong> in Europe<br />
on a large scale. Currently, a second phase of EWIS is ongoing.<br />
The IEA Wind 1 Task 25 aims to “provide in<strong>for</strong>mation to facilitate the<br />
highest economically feasible <strong>wind</strong> energy penetration within<br />
electricity <strong>power</strong> systems worldwide.”The IEA Wind’s state-of-the-art<br />
report [16] is a summary of case studies addressing concerns about<br />
the impact of <strong>wind</strong> <strong>power</strong>’s variability and uncertainty on <strong>power</strong><br />
system reliability and costs. Moreover, it contains a clear classification<br />
of <strong>power</strong> system <strong>integration</strong> issues related to <strong>wind</strong> <strong>power</strong>.<br />
TradeWind is an ongoing research project <strong>for</strong> policy support, funded<br />
by the European Commission’s Executive Agency <strong>for</strong> Competitiveness<br />
and Innovation (EACI).TradeWind aims on further developing<br />
Europe’s <strong>power</strong> market <strong>for</strong> the large-scale <strong>integration</strong> of <strong>wind</strong> <strong>power</strong><br />
by recommending interconnector upgrade and market rules <strong>for</strong> <strong>power</strong><br />
exchange.The <strong>offshore</strong> <strong>wind</strong> <strong>power</strong> scenario applied to the North Sea<br />
in the present study has been developed in close cooperation with the<br />
TradeWind project.<br />
footnote<br />
1 INTERNATIONAL ENERGY AGENCY (IEA) IMPLEMENTING AGREEMENT FOR CO-OPERATION<br />
IN THE RESEARCH, DEVELOPMENT, AND DEPLOYMENT OF WIND ENERGY SYSTEMS - IEA WIND<br />
9
GLOBAL ENERGY [R]EVOLUTION<br />
A NORTH SEA ELECTRICITY GRID [R]EVOLUTION<br />
With the present study, <strong>Greenpeace</strong> wants to go beyond the existing<br />
studies.This study shows the potential <strong>for</strong> energy supply from<br />
<strong>offshore</strong> <strong>wind</strong> <strong>power</strong> and how it is suited to meeting the demand of<br />
electricity. It focuses on the availability of <strong>wind</strong> <strong>power</strong> generation<br />
over time and its variability.The results are based on a detailed<br />
analysis of the <strong>wind</strong> <strong>power</strong> generation profile on the North Sea as a<br />
function of time. In view of the outcomes of this analysis,<br />
complementary measures are explored <strong>for</strong> an economically efficient<br />
<strong>integration</strong> of <strong>offshore</strong> <strong>wind</strong> <strong>power</strong> in Northern Europe. Special<br />
attention is paid to the benefit an <strong>offshore</strong> grid in the North Sea<br />
would bring <strong>for</strong> this purpose.<br />
1.3 approach<br />
The study is based on time series of <strong>wind</strong> speed over the North Sea.<br />
Hourly values of <strong>wind</strong> speed over three years have been calculated<br />
<strong>for</strong> the coordinates of the <strong>wind</strong> farms anticipated in the North Sea,<br />
based on historical data.<br />
Wind farm sites and installed capacities were assumed by 3E.The<br />
assumptions are based on national targets and scenarios, on<br />
granted domain concessions, and on in<strong>for</strong>mation from national<br />
experts.The envisioned total installed capacity amounts to 68.4<br />
GW, a figure in between the 2020 and 2030 EWEA <strong>offshore</strong><br />
targets <strong>for</strong> all European seas (respectively 40GW and 120 GW).<br />
In contrast to previous studies by <strong>Greenpeace</strong> and others, the<br />
present study is not a development roadmap towards or even a<br />
<strong>for</strong>ecast of installed capacity.The applied <strong>offshore</strong> <strong>wind</strong> <strong>power</strong><br />
scenario mainly serves as a boundary condition <strong>for</strong> the technical<br />
study. It is important to note that <strong>for</strong> this reason no time frame has<br />
been assigned to the installed capacity scenario.<br />
For the identified <strong>wind</strong> farm sites, <strong>wind</strong> <strong>power</strong> output is calculated<br />
by means of a regional <strong>power</strong> curve <strong>for</strong> <strong>wind</strong> turbine types as they<br />
may be anticipated <strong>for</strong> 2030, i.e., cut-out happening smoothly at<br />
<strong>wind</strong> speeds above 30 m/s only.<br />
A conceptual <strong>offshore</strong> grid design is introduced based on <strong>offshore</strong><br />
interconnectors in operation or planning and those having been<br />
proposed or discussed in the public domain. In order to assess the<br />
general principles rather than entering into planning and siting issues,<br />
the <strong>offshore</strong> grid has been reduced to its essential nodes and branches.<br />
Technically, the analysis is based on the statistics of the available<br />
<strong>power</strong> <strong>for</strong> each node and its variation. In practical terms, this<br />
means that the availability of <strong>power</strong> and the variability of the <strong>wind</strong><br />
<strong>power</strong> output are assessed per node and country in order to answer<br />
the following questions:<br />
• What amount of <strong>power</strong> is usually available in which countries?<br />
• For what fraction of time is this <strong>power</strong> available?<br />
• How greatly does it vary over time?<br />
• To what extent can an <strong>offshore</strong> grid facilitate <strong>power</strong> system<br />
operation with large-scale <strong>offshore</strong> <strong>wind</strong> <strong>power</strong>?<br />
• What complementary measures should be considered?<br />
In the following section the meaning of variability and limited<br />
availability of <strong>power</strong> from <strong>offshore</strong> <strong>wind</strong> farms is explored with<br />
regard to the operation of <strong>power</strong> systems.The aspects are set in<br />
relation to the <strong>power</strong> generation mix and the responsiveness of the<br />
<strong>power</strong> system as a whole.<br />
The methodology <strong>for</strong> the quantitative analysis is described in<br />
Section 3.There, the underlying assumptions and the applied longterm<br />
scenario <strong>for</strong> the installed <strong>offshore</strong> <strong>wind</strong> <strong>power</strong> capacity are<br />
explained. Finally, the meteorological data base and the assumed<br />
<strong>wind</strong> farm <strong>power</strong> curves are referenced.<br />
Section 4 focuses on <strong>offshore</strong> <strong>power</strong> transmission. After a review of<br />
published concepts <strong>for</strong> <strong>offshore</strong> and overlay transmission <strong>grids</strong>, the<br />
required technology of high-voltage DC transmission with voltage<br />
source converters is introduced. An <strong>offshore</strong> grid scenario is<br />
developed based on a qualitative assessment of the possible effect<br />
of different policy drivers on the development of an <strong>offshore</strong><br />
transmission grid. Finally, this section contains an estimate of the<br />
costs of such <strong>offshore</strong> transmission infrastructure.<br />
Quantitative results regarding the <strong>power</strong> generation of <strong>offshore</strong><br />
<strong>wind</strong> farms are presented and analyzed in Section 5.The<br />
parameters investigated are expected annual generation, variation<br />
of output <strong>power</strong> over time, and the statistical properties of the<br />
available output <strong>power</strong> and its variability over time.The results are<br />
compared <strong>for</strong> single <strong>wind</strong> farms, <strong>for</strong> the accumulated <strong>power</strong> output<br />
<strong>for</strong> different countries and <strong>for</strong> the entire North Sea.<br />
In Section 6 the results are discussed and related to the operation of<br />
<strong>power</strong> systems as a whole.The influence of variable generation on a<br />
<strong>power</strong> generation and demand portfolio is discussed.This is done <strong>for</strong><br />
conventional thermally dominated generation portfolios as well as <strong>for</strong><br />
a sustainable portfolio largely based on renewables and cogeneration<br />
plants.The importance of flexibility in future <strong>power</strong> systems is<br />
discussed <strong>for</strong> an efficient <strong>integration</strong> of variable <strong>power</strong> generation and<br />
demand. Finally, development perspectives <strong>for</strong> an <strong>offshore</strong> grid are<br />
discussed in view of the results from Sections 4 and 5.<br />
1.4 guide to the reader<br />
10
<strong>wind</strong> <strong>power</strong> in the <strong>power</strong> system: availability & variability<br />
“THE ELECTRICITY GENERATED FROM WIND ENERGY OVER THE YEARS CAN BE ESTIMATED WITH HIGH PRECISION.”<br />
2<br />
© GREENPEACE<br />
image WINDPARK CONSTRUCTION OFF THE COAST OF GERMANY.<br />
Although dependent on meteorological variations, the electricity<br />
generated from <strong>wind</strong> energy over the years can be estimated with<br />
high precision. Wind energy, there<strong>for</strong>e, is a reliable source <strong>for</strong><br />
electricity generation. While investment costs <strong>for</strong> <strong>wind</strong> <strong>power</strong> are<br />
relatively high, the marginal cost <strong>for</strong> <strong>power</strong> generation from <strong>wind</strong> is<br />
negligible.There<strong>for</strong>e, <strong>wind</strong> <strong>power</strong> plants are considered must-run<br />
units with variable output. Every megawatt-hour generated from<br />
<strong>wind</strong> substitutes the megawatt-hour with the highest marginal cost<br />
in the generation mix of a <strong>power</strong> system. In Europe today, this<br />
would mostly first substitute energy from combined cycle gas<br />
turbines (CCGTs) or coal-fired plant, depending on the national<br />
generation mix and the price of CO2 emission allowances. In both<br />
cases, <strong>wind</strong> energy substitutes largely imported fossil fuel and the<br />
corresponding CO2 emissions.<br />
A significant amount of <strong>wind</strong> <strong>power</strong> in the <strong>power</strong> system can have<br />
different effects.The IEA Task 25 classifies these effects according<br />
to their time scale and affected area (Figure 4). In this<br />
terminology, the present study is mainly related to adequacy of<br />
<strong>power</strong> and hydro/thermal efficiency.<br />
figure 4: impacts of <strong>wind</strong> <strong>power</strong> on <strong>power</strong> systems,<br />
divided into different time scales and width of area<br />
AS COVERED BY THE IEA WIND TASK 25 (FROM [16],<br />
BY COURTESY OF H. HOLTTINEN, VTT, FINLAND)<br />
Area relevant <strong>for</strong> impact studies<br />
System wide<br />
1,000-5,000 km<br />
Regional<br />
100-1,000 km<br />
Local<br />
10-50 km<br />
grid<br />
stability<br />
voltage<br />
management<br />
<strong>power</strong> quality<br />
ms...s<br />
primary<br />
reserve<br />
s...min<br />
secondary<br />
reserve<br />
transmission<br />
efficiency<br />
min...h<br />
congestion<br />
management<br />
distribution<br />
efficiency<br />
reduced<br />
emissions<br />
hydro/thermal<br />
efficiency<br />
1...24h<br />
Task 25<br />
adequacy<br />
of <strong>power</strong><br />
adequacy<br />
of grid<br />
years<br />
Time scale relevant <strong>for</strong> impact studies<br />
11
GLOBAL ENERGY [R]EVOLUTION<br />
A NORTH SEA ELECTRICITY GRID [R]EVOLUTION<br />
With increasing amounts of <strong>wind</strong> <strong>power</strong> in today’s <strong>power</strong> systems,<br />
<strong>wind</strong> <strong>power</strong> affects the dispatch of conventional <strong>power</strong> plants.Two<br />
main effects, which affect the overall efficiency of the <strong>power</strong><br />
system, are explored here: the availability and the variability of<br />
<strong>power</strong>.The limited availability of <strong>wind</strong> <strong>power</strong> over the year is put in<br />
relation to other generation units and demand.The variability of<br />
<strong>wind</strong> <strong>power</strong> generation over the days requires a more flexible<br />
dispatch of different types of <strong>power</strong> plants than exists today.<br />
Generation adequacy is a static measure <strong>for</strong> the capability of the<br />
system to supply the peak <strong>power</strong> demand when required, with<br />
sufficient margin of safety (or low risk).Today, in practice, <strong>power</strong><br />
during periods of low <strong>wind</strong> and high demand is provided by thermal<br />
<strong>power</strong> plants and by other renewable energy sources, the latter<br />
being mainly large hydro plants. In future, other marine renewables,<br />
solar <strong>power</strong> and <strong>power</strong> generation from biomass could further<br />
complement the generation mix.<br />
Above a certain level of <strong>wind</strong> <strong>power</strong> penetration in the system,<br />
situations arise in which <strong>wind</strong> <strong>power</strong> together with the minimum<br />
generation of the other plants exceed the <strong>power</strong> demand. In practice,<br />
this surplus generation of <strong>wind</strong> <strong>power</strong> during times of low load<br />
appears to have more serious effects on the <strong>power</strong> system than the<br />
potentially low generation during peak load [17][18]. In this case<br />
curtailment of <strong>wind</strong> <strong>power</strong> is usually sought. Curtailment of <strong>wind</strong><br />
<strong>power</strong> can be avoided by using a larger spatial spread of <strong>wind</strong> <strong>power</strong><br />
generation and demand and by replacing must-run base load units by<br />
more flexible generation units. Finally, energy storage may contribute<br />
to an increased overall efficiency of <strong>power</strong> supply [17][19].<br />
With large installed capacities, the variability of must-run <strong>wind</strong><br />
<strong>power</strong> can be significant compared to variations in overall supply<br />
and demand.The shorter the characteristic variation in supply and<br />
demand, the greater the need <strong>for</strong> fast adaptations of flexible units<br />
and flexible demand becomes.Today, variations are mainly absorbed<br />
at the supply-side, with electricity from conventional <strong>power</strong> plants.<br />
While a combined cycle gas turbine (CCGT) can be started within<br />
an hour, starting up a coal-fired plant takes six to ten hours, with<br />
decreased efficiency compared to nominal operation. Present<br />
nuclear <strong>power</strong> plants are not suited <strong>for</strong> complementing variable<br />
generation <strong>for</strong> economic and technical reasons. In response to very<br />
short variations, reservoir hydro <strong>power</strong> plants or open cycle gas<br />
turbines (OCGTs) are mostly used.<br />
Not only <strong>wind</strong> and solar <strong>power</strong> generation, but also demand depend<br />
on the passage of weather systems.There<strong>for</strong>e, the correlation of<br />
<strong>wind</strong> speed and solar irradiance over wide areas is low. In order to<br />
benefit from this decorrelation effect a European transmission<br />
system with sufficiently high transport capacity is required.<br />
Moreover, the <strong>power</strong> systems in Europe differ in generation mix and<br />
also in flexibility.The large capacities of reservoir hydro <strong>power</strong> in<br />
Norway and the north of Sweden in particular could complement<br />
the nuclear and fossil fuel-based generation mix in Great Britain,<br />
Ireland and many countries in continental Europe.Thus, sufficient<br />
transmission capacity between countries is essential <strong>for</strong> enabling an<br />
efficient grid <strong>integration</strong> of large-scale <strong>wind</strong> <strong>power</strong> in Europe.<br />
In conclusion, the ability to meet demand at any time must be<br />
considered <strong>for</strong> a <strong>power</strong> system as a whole, taking into account the<br />
demand, the flexibility of available conventional <strong>power</strong> plants, and<br />
complementary renewable sources. In <strong>power</strong> systems with a low<br />
fraction of <strong>wind</strong> <strong>power</strong> generation, the effect of <strong>wind</strong> <strong>power</strong> on<br />
these parameters may be neglected. However, in view of the<br />
significant role to play by renewable energy and the ambitious<br />
targets of the EU Member States, the industry-driven scenarios of<br />
EWEA, and the recent blueprints <strong>for</strong> a sustainable energy supply by<br />
<strong>Greenpeace</strong>, this will not be the case in the <strong>for</strong>eseeable future.<br />
The following means can facilitate the transition to an efficient<br />
<strong>power</strong> system to be based on sustainable sources:<br />
• Increased transmission capacity between <strong>power</strong> systems<br />
and synchronous zones,<br />
• Use of solar <strong>power</strong> and marine renewables being uncorrelated<br />
to <strong>wind</strong> <strong>power</strong>,<br />
• Demand-side management, e.g., by introduction of demand<br />
elasticity on the <strong>power</strong> market,<br />
• Energy storage, distributed and centralized.<br />
12
methodology<br />
“A SITUATION WHICH IS LIKELY TO BE ACHIEVED, UNDER FAVOURABLE CONDITIONS, AND WHICH WILL HAVE A SIGNIFICANT IMPACT<br />
ON NECESSARY GRID DEVELOPMENTS.”<br />
3<br />
© PAUL LANGROCK/ZENIT/GREENPEACE<br />
image VESTAS WIND SYSTEMS A/S IN RINGKOBING, DENMARK, PRODUCING WIND MILLS/ROTORS FOR OFFSHORE WIND ENERGY.<br />
3.1 installed <strong>wind</strong> <strong>power</strong> scenario<br />
The <strong>wind</strong> <strong>power</strong> scenario used in this study is developed in close<br />
cooperation with the European project TradeWind [15].<br />
Geographically, the scenario is limited to the North Sea.The total<br />
installed capacity envisioned amounts to 68408 MW (Table 2).This<br />
figure lies in between the 2020 and 2030 EWEA <strong>offshore</strong> targets<br />
<strong>for</strong> all Europe being 40 GW and 120 GW, respectively. In practice<br />
the capacities in Table 1 may be exceeded in some countries while<br />
in other countries the installed capacities may be lower due to<br />
projects not being realized that are anticipated here. In this<br />
context, the authors consider the proposed scenario as a best guess<br />
<strong>for</strong> the long term. It represents a situation which is likely to be<br />
achieved, under favourable conditions, and which will have a<br />
significant impact on necessary grid developments.<br />
It is important to note that in this study no time frame is indicated,<br />
since the objective is not to present an installed capacity <strong>for</strong>ecast,<br />
but rather to serve as input <strong>for</strong> an impact analysis.The <strong>offshore</strong><br />
<strong>wind</strong> <strong>power</strong> capacity in the North Sea as finally available in 2030<br />
could very well be considerably higher. Furthermore, the study does<br />
not account <strong>for</strong> emerging technology solutions like floating <strong>wind</strong><br />
turbines on the open sea, wave <strong>power</strong> and tidal stream <strong>power</strong><br />
generation.There<strong>for</strong>e, in terms of these emerging technologies, the<br />
scenario is conservative.<br />
Besides country-specific data, the scenario is based on the database<br />
of Douglas Westwood (DW) [20] and on the TradeWind scenario’s<br />
developed in work package 2 [21]. A bottom-up approach starting<br />
from lists of projects is combined with a top-down approach based<br />
on the national and international targets. For each country the<br />
resulting list is verified by the <strong>Greenpeace</strong> national divisions and<br />
partly by the national <strong>wind</strong> energy associations. A situation of the<br />
scenario in line with the current national and international targets<br />
is given below.The gathered data include the name of the project or<br />
location, the projected installed capacity and the geographical<br />
coordinates. A list of the projects and installed capacity per country<br />
can be found in Annex A.<br />
13
GLOBAL ENERGY [R]EVOLUTION<br />
A NORTH SEA ELECTRICITY GRID [R]EVOLUTION<br />
table 2: capacity scenario <strong>for</strong> <strong>offshore</strong> <strong>wind</strong> per country<br />
(NORTH SEA ONLY)<br />
COUNTRY<br />
Belgium<br />
Denmark<br />
France<br />
Germany<br />
Great Britain<br />
Netherlands<br />
Norway<br />
Total<br />
INSTALLED CAPACITY [MW]<br />
3,846<br />
1,577<br />
1,000<br />
26,418<br />
22,238<br />
12,039<br />
1,290<br />
68,408<br />
belgium<br />
The installed capacity in the Belgian scenario totals 3846 MW.This<br />
installed capacity includes the three projects that have currently<br />
been granted concession (around 0.8 GW), and 6 more sites of 500<br />
MW each which are equally divided over the zone designated <strong>for</strong><br />
<strong>offshore</strong> <strong>wind</strong> energy. It corresponds with the TradeWind 2030 high<br />
scenario [21][22], and is in line with the figures in the report<br />
Optimal <strong>offshore</strong> <strong>wind</strong> energy developments in Belgium [23] and<br />
with the upper limit in the present concession area as stated in the<br />
CE2030 report [24].<br />
denmark<br />
The contemplated installed capacity of <strong>offshore</strong> <strong>wind</strong> in the Danish<br />
North Sea is based on the report “50% Wind Power in Denmark in<br />
2025” [25]. Further advice has been given by the Danish Wind<br />
Energy Association. It consists of 1577 MW, of which 377 MW are<br />
currently realized and planned projects.The locations <strong>for</strong> the<br />
remaining 1200 MW are based on the recommendations in the<br />
report from the Danish Energy Authority “Future Offshore Wind<br />
Power Sites – 2025” [26].<br />
france<br />
The main <strong>offshore</strong> <strong>wind</strong> <strong>power</strong> development in Northern France will<br />
not be in the North Sea but rather in the English Channel.To assess<br />
some capacity in France, the scenario assumes 1000 MW of<br />
<strong>offshore</strong> <strong>wind</strong> <strong>power</strong> near Calais and Dunkirk.<br />
great britain<br />
In December 2007, the British Department <strong>for</strong> Business Enterprise<br />
& Regulatory Re<strong>for</strong>m (BERR) announced a proposal to open up its<br />
seas to up to 33 GW of <strong>offshore</strong> <strong>wind</strong> <strong>power</strong> by 2020. In addition<br />
to the currently realized and planned projects of Round 1 and<br />
Round 2 (about 10 GW of which 7.24 GW in the North Sea), there<br />
will be a Round 3 phase with projects totalling up to 23 GW.<br />
Leaving out of discussion how and when this will be possible, the<br />
presented scenario assumes <strong>for</strong> the North Sea 22238 MW of<br />
<strong>offshore</strong> <strong>wind</strong> capacity. Besides the known Round 1 and Round 2<br />
projects this includes 15 locations of 1000 MW each <strong>for</strong> 2/3 of the<br />
projected Round 3 capacity. Based on graphs of water depth and<br />
<strong>wind</strong> speed on the British continental shelf [28][29], most of these<br />
locations are placed on the Dogger Bank. Opinion of the British<br />
Wind Energy Association (BWEA) has been taken into account in<br />
the approximate locating of the (not yet identified nor decided)<br />
Round 3 projects.<br />
the netherlands<br />
The scenario <strong>for</strong> the Netherlands is based on the DW database, on<br />
the list of current initiatives available from the Ministry of Public<br />
Works and Water Management (Rijkwaterstaat) [30] and on a<br />
study of the Dutch Ministry of Economic Affairs [31].The official<br />
target in the Netherlands is to develop 6 GW of <strong>offshore</strong> <strong>wind</strong> by<br />
2020. Given the very high potential and the fact that in the present<br />
study no time frame is indicated, the scenario assumes an installed<br />
capacity of 12039 MW.The selection of projects has been made<br />
based on <strong>wind</strong> farm clusters [31] and with further advice from<br />
experts in the Netherlands. Care has been taken to avoid<br />
geographical overlap of different initiatives.<br />
norway<br />
The Norwegian scenario is based on input from TradeWind,<br />
provided by SINTEF Energy Research. In the North Sea, SINTEF<br />
Energy Research distinguishes two potential projects with an<br />
estimated total potential of 1290 MW. Since this scenario<br />
considers only the North Sea, the potential in the large <strong>wind</strong><br />
resources further north along the Norwegian Atlantic coast is not<br />
taken into account.<br />
germany<br />
The database of Douglas Westwood <strong>for</strong> Germany lists <strong>offshore</strong><br />
projects with a total capacity of 61.8 GW. Since this exceeds by far<br />
any official scenario, a selection is made by comparison with<br />
in<strong>for</strong>mation available from the German Energy Agency (Dena) and the<br />
German Federal Maritime and Hydrographical Agency (BSH) [27].<br />
The resulting list contains projects with a total capacity of 26417<br />
MW, which is in line with the TradeWind high scenario <strong>for</strong> 2030.<br />
14
image CONSTRUCTION OF OFFSHORE<br />
WIND TURBINES, GERMANY.<br />
© LANGROCK/ZENIT/GP<br />
3.2 time series or <strong>wind</strong> speed and <strong>power</strong><br />
For the <strong>wind</strong> farm locations defined in section 3.1, hourly time series<br />
of historical <strong>wind</strong> speed and <strong>power</strong> have been calculated <strong>for</strong> a period<br />
of three years (2004-2006).The <strong>wind</strong> speed time series are based on<br />
6-hourly global analysis data (Final Analysis, FNL) from the United<br />
States’ National Center <strong>for</strong> Environmental Prediction (NCEP).The<br />
calculations are done with the Weather Research and Forecasting<br />
Model (WRF [32]), which is a mesoscale numerical weather<br />
prediction model with the ability to simulate the atmospheric<br />
conditions over a wide range of horizontal resolutions from 100 km<br />
to 1 km.These simulations are used to downscale dynamically the<br />
FNL data from six-hourly resolution on a grid 2 of 1° by 1° to hourly<br />
data on a 9x9 km² grid.The model has been validated with <strong>wind</strong><br />
speed measurements at different hub heights from the German<br />
<strong>offshore</strong> plat<strong>for</strong>m FINO-1 [33][34]. In the present study the <strong>wind</strong><br />
speed time series are calculated <strong>for</strong> a hub height of 90m.<br />
The next step comprises the conversion of <strong>wind</strong> speed to <strong>wind</strong><br />
<strong>power</strong>.This depends on the <strong>wind</strong> turbine characteristics represented<br />
by the <strong>power</strong> curve. A <strong>power</strong> curve is always given <strong>for</strong> a single <strong>wind</strong><br />
turbine. In order to model large <strong>wind</strong> farms distributed over a<br />
region, an aggregated <strong>power</strong> curve is needed. In the present study<br />
an equivalent <strong>wind</strong> <strong>power</strong> curve (EPC) is used that was developed<br />
by the company Garrad Hassan <strong>for</strong> the TradeWind project [35]. In<br />
this <strong>power</strong> curve, array losses in large <strong>offshore</strong> <strong>wind</strong> farms are<br />
taken into account as they are caused by wake effects.The<br />
equivalent <strong>power</strong> curve also accounts <strong>for</strong> 3% of electrical losses. In<br />
addition, an availability of 92% is assumed. Finally, the applied<br />
equivalent <strong>power</strong> curves anticipate possible future improvements in<br />
<strong>wind</strong> turbine efficiency and increased hub hights. Figure 5 shows a<br />
comparison of a possible future single <strong>wind</strong> turbine <strong>power</strong> curve<br />
with the equivalent <strong>power</strong> curve used. Due to the losses that are<br />
taken into consideration, a <strong>wind</strong> farm in the model can generate at<br />
best 89% of its installed capacity.<br />
figure 5: <strong>power</strong> curve – conversion of <strong>wind</strong> speed<br />
into <strong>power</strong> (EPC VS. SINGLE TURBINE)<br />
120%<br />
Power (% of rated)<br />
100%<br />
80%<br />
60%<br />
40%<br />
20%<br />
0%<br />
0 2 4 6 8 10 12 14 16 18 20 22 24 26 28 30 32 34<br />
Wind speed (m/s)<br />
Offshore EPC future<br />
Offshore single turbine future<br />
footnote<br />
2 IN GEOGRAPHICAL COORDINATES, 1° CORRESPONDS APPROXIMATELY TO 250-300 KM.<br />
15
GLOBAL ENERGY [R]EVOLUTION<br />
A NORTH SEA ELECTRICITY GRID [R]EVOLUTION<br />
<strong>offshore</strong> <strong>grids</strong> <strong>for</strong> <strong>wind</strong> <strong>power</strong> <strong>integration</strong><br />
“THE COMBINATION OF OFFSHORE POWER GENERATION AND INTERCONNECTION ALLOWS DISPATCHING POWER<br />
TO AREAS OF HIGH DEMAND AND PRICE.”<br />
4<br />
© COURTESY OF ABB<br />
image THE TROLL A OFFSHORE PLATFORM IN THE NORTH SEA WITH THE HVDC LIGHT MODULE IN PLACE.<br />
4.1 existing <strong>offshore</strong> grid concepts<br />
The proposal in this study is not the first concept of an <strong>offshore</strong> grid.While<br />
Watson [36] looks at a limited grid in the Irish Sea, Airtricity [37][38],<br />
Czisch [39] and DLR [40] envision more ambitious trans-European meta<br />
<strong>grids</strong>. A vision on meshed <strong>offshore</strong> transmission infrastructure that would<br />
integrate <strong>offshore</strong> <strong>wind</strong> <strong>power</strong> and oil and gas extraction plat<strong>for</strong>ms has<br />
been proposed by the NorwegianTSO Statnett [41].<br />
The Irish <strong>wind</strong> energy project developer Airtricity proposes an <strong>offshore</strong><br />
meta grid structure to collect energy from <strong>offshore</strong> <strong>wind</strong> farms, making<br />
use of high <strong>wind</strong> resources and spatial smoothing. Czisch has taken this a<br />
step further and developed a vision of an HVDC overlay grid connecting<br />
Northern Africa, Europe and the Middle East, to transfer solar and <strong>wind</strong><br />
energy towards Europe. In [40], DLR develops a similar scenario with a<br />
focus on the transfer of solar electricity from the sunbelt regions towards<br />
Europe.The <strong>grids</strong> of Czisch and DLR are largely land-based.<br />
Currently,TradeWind is developing an EU-wide <strong>power</strong> flow scenario<br />
including various <strong>offshore</strong> grid configurations. Activities on<br />
transmission infrastructure within the European Commission<br />
including a review of possible <strong>offshore</strong> grid topologies are also<br />
coordinated by the European co-ordinator <strong>for</strong> the connection of<br />
<strong>offshore</strong> <strong>wind</strong> farms in Northern Europe.<br />
4.2 technology<br />
high-voltage AC and DC <strong>power</strong> transmission<br />
All <strong>offshore</strong> <strong>wind</strong> farms in operation today are connected to the<br />
onshore <strong>power</strong> system with high-voltage AC (HVAC) transmission<br />
cables. Due to the high capacitance of shielded <strong>power</strong> cables, the<br />
length of such AC cables <strong>for</strong> practical use is technically limited by<br />
the required charge current of the cable.There<strong>for</strong>e the length of<br />
undersea AC cables is limited.This problem can be overcome by<br />
using high-voltage DC (HVDC) cables, as they require no reactive<br />
<strong>power</strong>.The HVDC technology can be used to transmit electricity<br />
over long distances or to interconnect different <strong>power</strong> systems<br />
whose grid frequencies are not synchronized. In Germany, HVDC<br />
technology will be used <strong>for</strong> connecting the <strong>offshore</strong> <strong>wind</strong> farms in<br />
the German Bight to the onshore transmission grid.<br />
classical HVDC and HVDC with voltage<br />
source converters<br />
Two types of HVDC transmission systems exist: classical HVDC and<br />
HVDC with voltage source converters (VSC).This section briefly<br />
explains the differences between these technologies and shows how<br />
they affect <strong>wind</strong> energy development. A more into-depth analysis in<br />
relation to <strong>wind</strong> energy can be found in [3]. Classical HVDC is based<br />
on line commutated converters (LCC) using thyristors as the switching<br />
16
image LOADING SUBMARINE<br />
SEA CABLES.<br />
© COURTESY OF ABB<br />
element.The technology has been used <strong>for</strong> bulk <strong>power</strong> transmission <strong>for</strong><br />
many decades, e.g., <strong>for</strong> the interconnector between Great Britain and<br />
France. However, classical HVDC can only transfer <strong>power</strong> between two<br />
operating <strong>power</strong> systems with a stable grid voltage. For <strong>offshore</strong> <strong>wind</strong><br />
farms, an auxiliary start-up system would be necessary to provide the<br />
reference voltage and enable the operation of the LCC [42]. Moreover,<br />
converter stations <strong>for</strong> classical HVDC transmission are large and<br />
expensive.There<strong>for</strong>e, this technology is not used <strong>for</strong> connecting to<br />
<strong>offshore</strong> <strong>wind</strong> farms, gas or oil extracting plat<strong>for</strong>ms [43].<br />
HVDC transmission based on voltage source converters (VSCs) is a<br />
relatively new technology, since it was developed after the evolution of<br />
Insulated Gate BipolarTransistors (IGBTs) [44].Today two manufacturers<br />
offer these systems, ABB (HVDC light) and Siemens (HVDC plus).<br />
In spite of having high energy losses (4÷5 %), HVDC VSC has some<br />
significant advantages compared to classical HVDC [43][44], which make<br />
this technology favourable <strong>for</strong> <strong>offshore</strong> <strong>wind</strong> farms that are far from shore.<br />
HVDC VSC represents a major breakthrough <strong>for</strong> multi-terminal<br />
configurations and thus plug-and-operate <strong>offshore</strong> <strong>grids</strong>, which will have<br />
important implications <strong>for</strong> <strong>offshore</strong> <strong>wind</strong> energy. In addition, the required<br />
VSC stations are more compact than conventional converter stations.Today,<br />
HVDC VSC systems are offered <strong>for</strong> up to 1200 MW and ±320 kV [45].<br />
Figure 6 illustrates a simple HVDC connection <strong>for</strong> a <strong>wind</strong> farm to<br />
the onshore grid, while Figure 7 gives an indication of how the<br />
equipment on an <strong>offshore</strong> VSC station could look like.<br />
cost consideration<br />
The cost of an HVDC transmission system depends on many factors<br />
like <strong>power</strong> capacity to be transmitted, voltage levels, technical<br />
concept, construction and environmental conditions.<br />
Compared to HVAC technology, HVDC technology requires static<br />
inverters at both sending and receiving stations.They are expensive<br />
and have limited overload capacity. With short transmission<br />
distances the losses in the static inverters may be higher than in an<br />
AC transmission line.The cost of the inverters may not be offset by<br />
reductions in line construction cost and lower line losses.This leads<br />
to a break-even point <strong>for</strong> the choice between an AC and a DC<br />
cable. HVAC cable systems are favourable <strong>for</strong> transmission distance<br />
up to 50 - 90 km (Figure 8).<br />
figure 8: break-even point of AC and HVDC VSC<br />
systems happens at some distance<br />
Investment cost<br />
Break even point<br />
50-90km<br />
figure 6: connection of an <strong>offshore</strong> <strong>wind</strong> farm<br />
to the mainland grid via an HVDC transmission line<br />
Length<br />
<strong>wind</strong><br />
farm<br />
converter<br />
~<br />
=<br />
HVDC<br />
converter<br />
=<br />
~<br />
ac<br />
grid<br />
HVAC<br />
HVDC<br />
figure 7: artificial view of the HVDC light equipment<br />
on the troll <strong>offshore</strong> plat<strong>for</strong>m (BY COURTESY OF ABB)<br />
To estimate quickly the investment cost of an HVDC system, some<br />
appropriate equations are found in the literature.<br />
The cost of an HVDC VSC system mainly consists of the investment<br />
costs and installation costs of two components: the inverter station<br />
and the cable pair 3 .The costs can be estimated as [44]:<br />
• The investment cost and installation costs of a converter station:<br />
The price of a converter station <strong>for</strong> HVDC VSC technology<br />
(including valves, trans<strong>for</strong>mers, filters etc) is about 0.11 M€/MW.<br />
• The investment cost of the cable pair:Table 3 shows the specific<br />
cost (cost per km) of three types of cable pairs with a rated<br />
capacity of respectively 220, 350 and 500 MW at a rated<br />
voltage of 150 kV.<br />
table 3: cost per cable pair with rated capacity<br />
Cable Rated <strong>power</strong> (MW)<br />
Cost per cable pair (M€/km)<br />
220<br />
0.30377<br />
350<br />
0.4453<br />
500<br />
0.6086<br />
footnote<br />
3 THE HVDC VSC TECHNOLOGY IS A BIPOLAR TRANSMISSION TECHNOLOGY. THIS MEANS,<br />
IT MAKES USE OF A PAIR OF CONDUCTORS, IN OPPOSITE POLARITY. HENCE, FOR A<br />
SINGLE TRANSMISSION LINE, A PAIR OF CABLES IS NEEDED.<br />
17
GLOBAL ENERGY [R]EVOLUTION<br />
A NORTH SEA ELECTRICITY GRID [R]EVOLUTION<br />
These values are calculated using the following <strong>for</strong>mula of the<br />
specific investment cost of the cable per km proposed by<br />
Lundberg (also <strong>for</strong> 150 kV cables) [44][46]:<br />
C = 1.0887 P + 64.26 (1000 €/km),(2)<br />
where P is the rated <strong>power</strong> of the system in MW.<br />
Until summer 2008, no HVDC VSC line with more than 500 MW<br />
has been completed.There<strong>for</strong>e, actual prices <strong>for</strong> capacities of up<br />
to 1000 MW are not available.<br />
• The installation costs of the cable pair:The cost <strong>for</strong> installing<br />
each cable is set to 100,000 €/km.The assumption is made that<br />
only one cable can be installed at a time thus <strong>for</strong> the cable pair<br />
the installation cost is set to 200,000 €/km.<br />
The total investment cost of an HVDC VSC system can thus<br />
be calculated as:<br />
Total costHVDC VSC = 2 stations * Converter Station Cost +<br />
Length of cable * (Cost cable pair + Installation Cost)<br />
example: To connect 1000 MW of <strong>offshore</strong> <strong>wind</strong> <strong>power</strong> with a<br />
distance to the onshore substation of 100 km at a voltage 150 kV,<br />
two pairs of 500 MW cables are used (Table 3).The total<br />
investment cost of the transmission can be then approximated as:<br />
Total cost = 2 stations * 1000 MW * 0.11 M€/MW + 100 km * 2<br />
pairs * (0.6086 + 0.2) M€/km<br />
= 381.72 M€<br />
It is important to note that this number only provides the investment<br />
cost.To make a full economical analysis of a high-voltage<br />
interconnector, other in<strong>for</strong>mation must be taken into consideration<br />
like operation and maintenance costs, energy losses, etc.<br />
The final decision on whether to choose HVAC or HVDC systems<br />
depends mainly on the distance to the nearest onshore station and<br />
on the desired transfer capacity. However, <strong>for</strong> the development of an<br />
<strong>offshore</strong> grid, HVDC VSC systems are the most favourable option:<br />
they create possibilities <strong>for</strong> multi-terminal configurations, and are<br />
compact and economically competitive.<br />
4.3 drivers <strong>for</strong> <strong>offshore</strong> grid development<br />
policy drivers<br />
Two policy drivers <strong>for</strong> the development of an <strong>offshore</strong> grid<br />
can be distinguished:<br />
• Connectivity between countries and electricity market regions<br />
Interconnector capacity between the different countries in Europe<br />
allows <strong>for</strong> international support actions in case of un<strong>for</strong>eseen grid<br />
faults (contingencies) and black-outs. Moreover, interconnector<br />
capacity between the different market regions in Europe enables<br />
market access among regions, resulting in liquidity and a lower<br />
consumer price through adequate competition. Historically,<br />
submarine transmission lines have been installed in order to<br />
interconnect the electrical system of continental Europe with<br />
Scandinavia and the British Isles.Today, onshore grid<br />
rein<strong>for</strong>cement often is difficult or impossible due to<br />
environmental concerns or matters of right of way. Offshore<br />
transmission can provide an alternative to a lengthy permit and<br />
planning procedure required <strong>for</strong> onshore rein<strong>for</strong>cement.<br />
• An economically efficient connection of <strong>offshore</strong> <strong>wind</strong> farms<br />
When <strong>offshore</strong> <strong>wind</strong> farms are installed far from shore, they need to<br />
be connected to shore by means of high-voltage DC lines. In this<br />
case, it is economically most efficient to cluster the <strong>wind</strong> farms in an<br />
area and connect them to shore via a bundle of HVDC lines. By<br />
connecting <strong>offshore</strong> converter stations to a second shore or to<br />
another converter station, additional interconnector capacity between<br />
the countries is created at much lower cost than that of a dedicated<br />
interconnector from coast to coast.The unused capacity of the<br />
interconnector is then available <strong>for</strong> trade.The combination of<br />
<strong>offshore</strong> <strong>power</strong> generation and interconnection allows dispatching<br />
<strong>power</strong> to areas of high demand and price. In addition, the overall<br />
utilization time of the <strong>wind</strong> farm grid connection is increased.<br />
The topology of an <strong>offshore</strong> grid will result from these drivers and<br />
will there<strong>for</strong>e heavily depend on the relative importance assigned to<br />
each in political and economic decision making. When looking at<br />
the existing concepts <strong>for</strong> <strong>offshore</strong> and trans- or intercontinental<br />
overlay <strong>grids</strong>, all aspects of the above policy drivers are mentioned;<br />
however, some of them with more or less weight. Be<strong>for</strong>e unfolding<br />
the <strong>offshore</strong> grid topology proposal in the next section, the weight<br />
of the different drivers today and in the future is briefly discussed.<br />
current priorities<br />
Today, the installed capacity of most <strong>offshore</strong> <strong>wind</strong> farms is still<br />
lower than the potential economic capacity of typical HVDC<br />
interconnector cables and converter stations. Also, distances to<br />
shore are still relatively short. Offshore converter stations <strong>for</strong> <strong>wind</strong><br />
<strong>power</strong> have not yet been built.<br />
A number of new submarine interconnectors are in the planning or<br />
completion stage.The development of these lines is driven by the<br />
need <strong>for</strong> connectivity. Plugging in <strong>offshore</strong> <strong>wind</strong> <strong>power</strong> has in part<br />
been discussed, but rather as an add-on. Consequently, these<br />
projects use, or will use, classical HVDC technology where no <strong>wind</strong><br />
farms can be connected along the way.<br />
At the same time, the development of HVDC VSC systems <strong>for</strong> the<br />
grid connection of <strong>offshore</strong> <strong>wind</strong> farms is just beginning. Currently,<br />
the first HVDC connection <strong>for</strong> <strong>offshore</strong> <strong>wind</strong> energy is being<br />
developed: in 2009 the NordE.ON 1 cable will connect the <strong>wind</strong> farm<br />
Bard Offshore 1 in the German Bight to the German transmission<br />
system.The length of this connection will be 203 km of which 75 km<br />
onshore underground and 128 km at sea [45]. Most other <strong>wind</strong><br />
farms in the German Bight will be clustered at HVDC converter<br />
stations at sea and then connected to shore via HVDC VSC as well.<br />
future priorities<br />
Long-term scenarios (2020 to 2030) <strong>for</strong> <strong>offshore</strong> <strong>wind</strong> <strong>power</strong> in the<br />
North Sea envision a total of 40 to 100 GW of installed generation<br />
capacity, without taking into account other marine <strong>power</strong> generation.<br />
These <strong>wind</strong> farms will have to be connected to the onshore transmission<br />
grid.Wind farms close to shore will then still be connected via highvoltage<br />
AC cables. However, all <strong>wind</strong> farms that are more than 50 to<br />
90 km away from shore will use an HVDC connection.This will be the<br />
case <strong>for</strong> the assumed 15 GW of the British Round 3 projects situated<br />
mainly on the Dogger Bank and also <strong>for</strong> most of the 26.4 GW in the<br />
German Bight. Consequently, HVDC lines and <strong>offshore</strong> converter<br />
18
image SUBMARINE CABLES BEING<br />
LAYED OUT IN THE BELGIUM NORTH SEA.<br />
© C-POWER<br />
stations with the same total capacity will be installed in the German<br />
Bight and off the east coast of Britain. If the price of HVDC VSC<br />
technology decreases, also the larger of the envisioned Belgian, Dutch<br />
and Norwegian <strong>wind</strong> farms may be connected by HVDC.<br />
At the same time, the need <strong>for</strong> connectivity between countries will<br />
increase. It will be driven by the demand <strong>for</strong> flexibility in the<br />
national <strong>power</strong> systems, which generate opportunities <strong>for</strong> arbitrage<br />
between <strong>power</strong> market regions.There will be an economic case <strong>for</strong><br />
the commercial exploitation of interconnectors as long as there is<br />
opportunity <strong>for</strong> arbitrage.<br />
In this future situation, priorities will have changed. Unlike today,<br />
<strong>offshore</strong> <strong>wind</strong> <strong>power</strong> will then be the main driving <strong>for</strong>ce <strong>for</strong> the<br />
development of subsea cables and <strong>offshore</strong> converter stations <strong>for</strong><br />
HVDC.The total installed capacities of <strong>offshore</strong> HVDC stations in<br />
some countries will be 10 to 30 GW, equal to the capacity needed to<br />
transport the <strong>wind</strong> <strong>power</strong> to shore. For example, the 15 GW envisioned<br />
<strong>for</strong> the Dogger Bank and also most of the 26.4 GW envisioned <strong>for</strong> the<br />
German Bight will be connected by HVDC. In practice, different<br />
<strong>offshore</strong> converter stations may be constructed close to the different<br />
clusters of <strong>wind</strong> farms.The corresponding onshore converter stations<br />
may be situated at different connection points to the onshore<br />
transmission grid. Nevertheless, the total installed capacity of converter<br />
stations <strong>for</strong> each shore and exclusive economic zone (EEZ) will equal<br />
the installed <strong>wind</strong> <strong>power</strong> capacity. Consequently, by then, the required<br />
capacities <strong>for</strong> the connection of <strong>offshore</strong> <strong>wind</strong> farms are 5 to 10 times<br />
as high as the typical capacity of an interconnector only used <strong>for</strong> trade.<br />
The required converter stations will be on the open North Sea and, with<br />
an additional investment, they can be connected to each other or to<br />
another shore.This would allow the allocation of the spare capacity of<br />
the line to the <strong>power</strong> market, while it is not used by <strong>wind</strong> <strong>power</strong>. For<br />
trade, the possibility to make use of an extended <strong>wind</strong> farm grid<br />
connection is a cheaper alternative to the development of separate cables<br />
[38]. Since the prolongation of lines from <strong>offshore</strong> <strong>wind</strong> farm converter<br />
stations is economically beneficial as long as there is opportunity <strong>for</strong><br />
arbitrage, an <strong>offshore</strong> grid will probably emerge in such a way.<br />
Moreover, such interconnectors can improve the load duration, i.e., the<br />
utilization of the <strong>wind</strong> farm cabling over the year. In order to foster such<br />
a scheme, <strong>wind</strong> <strong>power</strong> would need priority dispatch on the<br />
interconnector.The interconnector would then more than 60% of the<br />
time be available <strong>for</strong> import to the EEZ country in which the substation<br />
is situated. For export it would be available 100% of the time. 4<br />
Hence, in the future, <strong>offshore</strong> <strong>wind</strong> <strong>power</strong> development may surpass the<br />
demand <strong>for</strong> trade as the main driver <strong>for</strong> the development of an <strong>offshore</strong><br />
grid. Grid infrastructures <strong>for</strong> <strong>offshore</strong> <strong>wind</strong> <strong>power</strong> will then be offered to<br />
the <strong>power</strong> market. For this purpose, the <strong>wind</strong> farm grid connection would<br />
be extended from the <strong>offshore</strong> <strong>wind</strong> farm converter station to another<br />
converter station or to shore.The <strong>power</strong> market can then make use of<br />
spare capacity as a substitute <strong>for</strong> a separate interconnector <strong>for</strong> trade.<br />
footnotes<br />
4 AS DESCRIBED ABOVE,THE TRANSMISSION CAPACITY FROM THE CABLES FROM THE<br />
SUBSTATION TO THE SHORE WILL BE SIGNIFICANTLY HIGHER THAN THE CAPACITY OF THE<br />
INTERCONNECTOR FROM THE SUBSTATION TO THE OTHER COUNTRY. A WIND POWER CAPACITY<br />
FACTOR OF AROUND 40% MEANS THAT ON AVERAGE ONLY 40% OF THE CABLE CAPACITY IS<br />
USED OVER THE YEAR. MOREOVER,THE LOAD DURATION CURVES IN PARAGRAPH 5.3 SHOW<br />
THAT FULL POWER IS SELDOM REACHED, SO THAT MOST OF THE TIME THE CABLES FROM THE<br />
SUBSTATION TO THE SHORE WILL HAVE SPARE CAPACITY EQUAL TO OR LARGER THAN THE<br />
INTERCONNECTOR CAPACITY.THIS CAPACITY WILL BE AVAILABLE FOR TRADING. FROM THIS<br />
4.4 <strong>offshore</strong> grid proposal<br />
<strong>offshore</strong> <strong>wind</strong> clusters and connection<br />
The possible nodes of an <strong>offshore</strong> transmission grid can be determined<br />
by spatially clustering the envisioned <strong>wind</strong> farms and assigning one<br />
node to each cluster.This will result in from one up to a few <strong>offshore</strong><br />
<strong>wind</strong> clusters per country. In physical terms these clusters are like<br />
<strong>offshore</strong> distribution <strong>grids</strong>, collecting <strong>power</strong> from the <strong>wind</strong> farms within<br />
the cluster and trans<strong>for</strong>ming it into high voltage <strong>for</strong> transmission 5 .<br />
If <strong>offshore</strong> <strong>wind</strong> clusters are not too far from the mainland, they<br />
are connected to shore with an AC transmission line of sufficient<br />
capacity <strong>for</strong> their rated <strong>power</strong>.They are then assumed to be<br />
connected to the nearest onshore node within the country, i.e., the<br />
end point of an <strong>offshore</strong> interconnector (see Figure 9).<br />
Offshore <strong>wind</strong> farms on the open North Sea may be connected to<br />
shore via an HVDC converter station at sea (Figure 10) 6 .This is the<br />
case <strong>for</strong> the most ambitious projects anticipated <strong>for</strong> the long term<br />
(British Round 3 projects on the Dogger Bank and farshore in the<br />
Greater Wash, most projects in the German Bight).<br />
figure 9: connection of <strong>offshore</strong> <strong>wind</strong> farm cluster to<br />
shore <strong>for</strong> short distances (AC)<br />
AC<br />
<strong>wind</strong> farm cluster<br />
interconnector DC<br />
figure 10: connection of offhore <strong>wind</strong> farm cluster far<br />
from shore (DC)<br />
<strong>wind</strong> farm cluster<br />
DC<br />
interconnector DC<br />
REASONING, IT FOLLOWS THAT IMPORT OF POWER WILL BE POSSIBLE MORE THAN 60% OF THE<br />
TIME, AND EXPORT WILL BE POSSIBLE AT ALL TIMES (IF THE INTERCONNECTOR IS<br />
CONNECTED DIRECTLY TO AN ONSHORE SUBSTATION IN THE OTHER INTERCONNECTED<br />
COUNTRY. IF IT IS CONNECTED TO ANOTHER OFFSHORE SUBSTATION,THIS WILL BE DIFFERENT.)<br />
5 THE OFFSHORE WIND CLUSTERS ARE NOT INDICATED ON THE MAP IN FIGURE 11.<br />
6 THE OFFSHORE WIND CLUSTER IS THEN ASSIGNED TO AN OFFSHORE TRANSMISSION<br />
GRID NODE (OFFSHORE SUBSTATION). FOR REASONS OF SIMPLICITY THE MAP IN FIGURE<br />
11 ONLY SHOWS THREE OFFSHORE SUBSTATIONS.<br />
19
GLOBAL ENERGY [R]EVOLUTION<br />
A NORTH SEA ELECTRICITY GRID [R]EVOLUTION<br />
<strong>offshore</strong> transmission lines<br />
For interconnecting different countries with <strong>offshore</strong> transmission<br />
lines, different configurations are possible:<br />
• The interconnector is drawn between two onshore substations<br />
(Figure 11).This is the configuration of all interconnectors<br />
currently in operation or in planning (eg. NorNed from Norway<br />
to the Netherlands, Skagerrak interconnectors<br />
from Norway to Denmark).<br />
• When two countries have an <strong>offshore</strong> converter station far from<br />
shore, it may be convenient to link these stations with an<br />
interconnector (Figure 12).This way, the length of the extra<br />
interconnector cable can sometimes be limited. Moreover, the load<br />
duration of the cables transmitting the <strong>wind</strong> <strong>power</strong> from each<br />
substation to the shore can be greatly improved.<br />
• In some cases, connecting an <strong>offshore</strong> <strong>wind</strong> farm cluster to two<br />
different countries can be economically more efficient than a<br />
single connection to the EEZ country in which the <strong>offshore</strong> <strong>wind</strong><br />
farm cluster is located.The grid connection can then be used as<br />
an interconnector at the same time, while the investment cost<br />
remains similar (Figure 13).<br />
The locations of the projected <strong>offshore</strong> transmission lines in the<br />
present study are based on several sources (mainly in<strong>for</strong>mation and<br />
projects of the national TSO’s, a recent study from Econnect (UK)<br />
[29], the Dutch study “Connect 6000MW” [31], the German Dena<br />
grid study [47] and the “Nordic Grid Master Plan 2008” [48] 7 ).<br />
A number of these projects (interconnectors) are currently either:<br />
• in operation or planning (e.g. UK-France, NorNed, BritNed) or<br />
• proposed or discussed in the public domain<br />
(possible, e.g. UK-Norway).<br />
It is assumed that projects in operation or planning are available<br />
<strong>for</strong> trade; however, without the possibility of <strong>offshore</strong> plug-in <strong>for</strong><br />
<strong>wind</strong> farms.This means that their end points on shore will <strong>for</strong>m<br />
nodes of the <strong>offshore</strong> grid.<br />
For interconnectors being in the feasibility or earlier phase, it is<br />
assumed that they will be integrated with the grid connections of<br />
<strong>offshore</strong> <strong>wind</strong> farms.<br />
figure 11: interconnector between onshore substations<br />
AC or DC<br />
interconnector DC<br />
AC or DC<br />
figure 12: interconnector drawn between two <strong>offshore</strong><br />
converter stations<br />
DC<br />
interconnector DC<br />
figure 13: split connection to shore with interconnector<br />
created at the same time<br />
DC<br />
connection to shore<br />
= interconnector<br />
DC<br />
connection to shore<br />
= interconnector<br />
footnote<br />
7 PRECISE SITING AND CAPACITY ALLOCATION OF OFFSHORE CABLES IS NOT THE<br />
INTENTION OF THIS STUDY.<br />
20
image LOADING SUBMARINE<br />
SEA CABLES.<br />
© COURTESY OF ABB<br />
other <strong>offshore</strong> <strong>power</strong> generators and loads<br />
Other marine <strong>power</strong> generation technologies like tidal stream turbines<br />
and wave <strong>power</strong> generators will probably be installed at locations<br />
away from <strong>offshore</strong> <strong>wind</strong> <strong>power</strong>. Furthermore, the oil and gas industry<br />
considers the supply of <strong>offshore</strong> plat<strong>for</strong>ms with <strong>power</strong> from shore as<br />
a substitute <strong>for</strong> in-situ electricity generation with oil and gas.<br />
These potential developments will lead to additional sites of<br />
generation and load in the North Sea and, consequently, to additional<br />
nodes of an <strong>offshore</strong> grid, being situated more towards the central and<br />
northern part of the North Sea.The final design of a future <strong>offshore</strong><br />
grid could then differ from the proposal in Figure 14. Nevertheless, the<br />
rationale <strong>for</strong> the selection of sites as <strong>offshore</strong> nodes with a possible<br />
double use <strong>for</strong> grid connection and trade would remain the same.<br />
For the present <strong>offshore</strong> grid proposal, these potential<br />
developments have not been taken into account any further.<br />
resulting <strong>offshore</strong> grid proposal<br />
The resulting topology (Figure 14) shows the completed and<br />
planned interconnectors. Also, possible transmission lines are<br />
drawn, as proposed in [29] and [48]. Furthermore, an<br />
interconnector is assumed along the coast of continental Europe<br />
from the North of France to the German Bight.This would be<br />
connected to the transmission system of the different countries<br />
along the track. Another interconnector is assumed between the<br />
Shetland Islands and Norway as suggested in [29], being available<br />
<strong>for</strong> trade and to balance <strong>wind</strong> and possible marine technologies<br />
with hydro <strong>power</strong> from Norway. All these interconnectors are direct<br />
lines between two onshore substations as shown in Figure 8.<br />
Three <strong>offshore</strong> substations are drawn: one to avoid excessive<br />
cabling in an environmental sensitive and busy shipping lane area<br />
(Humber Estuary, see [29]), one to collect the Round 3 <strong>wind</strong><br />
energy (both based on Econnect [29]), and one <strong>for</strong> the German<br />
farshore <strong>wind</strong> farms. Moreover, an interconnector is assumed as an<br />
extension of the Round 3 transmission line to the German <strong>offshore</strong><br />
substation. Another interconnector is drawn between the<br />
Netherlands and Denmark.This is based on [48], but with a plug-in<br />
at the German <strong>offshore</strong> substation.This connection will enable<br />
international trade and will in this way provide great improvements<br />
to the load duration of the cables.These interconnectors are<br />
configured as in Figure 12 and in Figure 13.<br />
The <strong>offshore</strong> grid topology proposed in this study is shown in Figure<br />
14. It shows the <strong>offshore</strong> <strong>wind</strong> <strong>power</strong> scenario and the projected<br />
transmission system. It is important to note that all of the<br />
transmission lines in Figure 14 can represent more than one cable<br />
of 500 to 1000 MW, each. Moreover, the study does not describe<br />
concrete ways of implementation like precise <strong>offshore</strong> siting, cable<br />
capacities or precise onshore connection points. For most <strong>wind</strong><br />
farm sites and cable routes no environmental impact assessments<br />
have been carried out yet.This would be part of a step-wise<br />
development undertaken by public bodies, technology providers,<br />
developers, transmission system operators and regulators.<br />
To <strong>for</strong>m an idea of the cost of this <strong>offshore</strong> grid topology, an<br />
estimate has been calculated <strong>for</strong> the whole <strong>offshore</strong> grid based on<br />
the figures from Table 3. All lines together as shown in Figure 14<br />
have a total single line length of 6200 km. Assuming that, in an<br />
initial phase, all transmission lines have a capacity of 1 GW, each<br />
line on the map would represent two cable pairs of 500 MW<br />
capacity, each, that is, four cables.The total cost of the system<br />
would then be of the order of magnitude of 15-20 billion Euros.<br />
This amount would be needed to develop the proposed <strong>offshore</strong> grid<br />
from scratch with 1 GW capacity <strong>for</strong> each line, as it may be useful<br />
<strong>for</strong> the purpose of trade only. For increasing transmission<br />
capacities, i.e., increasing number of cables and size of voltage<br />
source converters, costs increase at a slightly less than linear rate.<br />
For comparison, the overall investment <strong>for</strong> the NorNed project, a<br />
classical HVDC cable connecting Norway and the Netherlands with<br />
a capacity of 700 MW, was 600 million Euros [49]. During its first<br />
two months of operation, this interconnector has generated<br />
revenues of 50 million Euros, which is more than 800,000 Euros<br />
per day [50]. By extending the HVDC grid connections of <strong>offshore</strong><br />
<strong>wind</strong> farms to other <strong>power</strong> market regions, <strong>wind</strong> <strong>power</strong> can offer<br />
transmission capacity <strong>for</strong> commercial use at much lower investment<br />
costs than <strong>for</strong> a single interconnector while providing similar<br />
benefits to the market.<br />
21
esults and analysis<br />
“THE TOTAL AGGREGATED CAPACITY FACTOR OF THE OFFSHORE WIND POWER SCENARIO IN THE PRESENT STUDY IS EQUAL TO 41.2%.”<br />
5<br />
© COURTESY OF ABB<br />
image LAYING SUBMARINE CABLE<br />
5.1 <strong>offshore</strong> <strong>power</strong> generation<br />
Over the year, the installed <strong>offshore</strong> <strong>wind</strong> <strong>power</strong> capacity of 68.4<br />
GW would generate 247 TWh of electricity.The estimated annual<br />
<strong>offshore</strong> <strong>wind</strong> electricity generation per country is shown in Table 4,<br />
alongside the total electricity consumption in 2006 <strong>for</strong> comparison.<br />
The capacity factor in Table 3 represents the fraction of time<br />
during which the installed <strong>wind</strong> farms would have generated the<br />
same amount of energy when always running at full <strong>power</strong>.The total<br />
aggregated capacity factor of the <strong>offshore</strong> <strong>wind</strong> <strong>power</strong> scenario in<br />
the present study is equal to 41.2%. For comparison: the<br />
aggregated capacity factor of the present installed <strong>wind</strong> <strong>power</strong><br />
capacity in Europe (of which the major part is onshore) is 23%.<br />
table 4: electricity production and associated capacity<br />
factors <strong>for</strong> <strong>offshore</strong> <strong>wind</strong> <strong>power</strong> and electricity<br />
consumption (WIND POWER IN THE NORTH SEA ONLY, CONSUMPTION<br />
DATA FROM [51][52][53])<br />
COUNTRY<br />
Belgium<br />
Denmark<br />
France<br />
Germany<br />
Great Britain<br />
Netherlands<br />
Norway<br />
Total<br />
ELECTRICITY<br />
/ YEAR [TWH]<br />
13.1<br />
5.6<br />
3.4<br />
97.5<br />
80.8<br />
41.7<br />
4.9<br />
247.0<br />
AVERAGE<br />
CAPACITY<br />
FACTOR [%]<br />
38.9<br />
40.5<br />
38.8<br />
42.1<br />
41.5<br />
39.6<br />
43.7<br />
41.2<br />
TOTAL ELECTRICITY<br />
CONSUMPTION<br />
2006 [TWH]<br />
89.9<br />
36.4<br />
478.4<br />
559.0<br />
405.8<br />
116.2<br />
122.6<br />
1,808.3<br />
23
GLOBAL ENERGY [R]EVOLUTION<br />
A NORTH SEA ELECTRICITY GRID [R]EVOLUTION<br />
In the following sections, the characteristics of the <strong>wind</strong> <strong>power</strong><br />
generation as a function of time are explored in depth.The<br />
presentation of the results focuses on Germany, Great Britain and<br />
Belgium. For the other countries the results are in principle similar<br />
(see Annex B).<br />
The results presented <strong>for</strong> single <strong>wind</strong> farms are based on the triannual<br />
<strong>wind</strong> speed time series <strong>for</strong> the coordinates of the projects<br />
envisioned and the equivalent <strong>power</strong> curve in Figure 2.They do not<br />
take into account project-specific data of the envisioned projects.<br />
There<strong>for</strong>e, the results presented do not precisely reflect the long-term<br />
energy yield of the projects but rather provide and estimate of<br />
availability and variability of <strong>power</strong> generation at the particular sites.<br />
5.2 <strong>wind</strong> <strong>power</strong> output over time<br />
Figure 15a) shows an exemplary <strong>power</strong> output profile <strong>for</strong> the<br />
coordinates of one of the envisioned large <strong>offshore</strong> <strong>wind</strong> farms in<br />
the German EEZ.The profile is representative <strong>for</strong> <strong>offshore</strong> <strong>wind</strong><br />
farms experiencing periods of very low and very high <strong>wind</strong> speeds<br />
within a few days.They reflect the passage of meteorological<br />
pressure systems with their associated fronts usually taking a few<br />
hours to several days.<br />
When adding up all <strong>power</strong> generation in the German part of the<br />
North Sea, i.e., the German Bight, the picture remains largely the<br />
same, although, somewhat smoother than <strong>for</strong> a single <strong>wind</strong> farm<br />
(Figure 15b). In contrast, the accumulated <strong>power</strong> generation of all<br />
North Sea <strong>wind</strong> farms in the same period varies slowly between 30<br />
and 45 GW (Figure 15c).<br />
Compared to the German <strong>wind</strong> farms, the British <strong>wind</strong> farms are<br />
distributed over several regions off the east coast and they cover a<br />
wider geographic spread (see Figure 14). Consequently, and in<br />
contrast to the German case, the accumulated output of these <strong>wind</strong><br />
farms is much smoother than that of a single <strong>wind</strong> farm (Figure 16).<br />
For Belgium (Figure 17), due to the small area of the zone<br />
designated <strong>for</strong> <strong>offshore</strong> <strong>wind</strong> energy, there is still less spatial<br />
smoothing than over the German Bight.The accumulated <strong>power</strong><br />
output profile of all <strong>wind</strong> farms in the Belgian EEZ is close to that<br />
of a single <strong>wind</strong> farm; however, over time both are complementary<br />
to <strong>offshore</strong> <strong>wind</strong> <strong>power</strong> generation in the German Bight.<br />
The figures below are exemplary, randomly chosen from the data<br />
set <strong>for</strong> a two-day period.They show how the hourly variation of a<br />
single <strong>wind</strong> farm’s <strong>power</strong> generation can be smoothed out by<br />
combining the output of <strong>wind</strong> farms that are distributed over the<br />
North Sea. However, regarding availability and variability of <strong>wind</strong><br />
<strong>power</strong>, they do not allow <strong>for</strong> general conclusions. For this purpose,<br />
in the following section the statistical properties of the time series<br />
of <strong>power</strong> generation are analyzed.<br />
figure 15: <strong>power</strong> output of <strong>offshore</strong> <strong>wind</strong> <strong>power</strong> over<br />
two days FOR ONE WIND FARM, ALL WIND FARMS IN THE GERMAN<br />
BIGHT AND ACCUMULATED FOR ALL OFFSHORE WIND FARMS IN THE<br />
NORTH SEA<br />
Power(MW)<br />
1,600<br />
0<br />
26,418<br />
0<br />
68,400<br />
a) Bard I+II: 1,600 MW<br />
b) All <strong>offshore</strong> <strong>wind</strong> farms in the German Bight: 26,418 MW<br />
c) All <strong>offshore</strong> <strong>wind</strong> farms in the North Sea: 68.4 GW<br />
0<br />
0hrs<br />
12hrs 0hrs 12hrs 0hrs<br />
April 3-4, 2006<br />
figure 16: <strong>power</strong> output of <strong>offshore</strong> <strong>wind</strong> <strong>power</strong> over<br />
two days FOR ONE WIND FARM, ALL WIND FARMS OFF THE BRITISH<br />
EAST COAST AND ACCUMULATED FOR ALL OFFSHORE WIND FARMS IN THE<br />
NORTH SEA<br />
Power(MW)<br />
1,000<br />
0<br />
22,238<br />
0<br />
68,400<br />
a) London Array I-IV: 1000 MW<br />
b) All <strong>offshore</strong> <strong>wind</strong> farms off the British East Coast: 22,238 MW<br />
c) All <strong>offshore</strong> <strong>wind</strong> farms in the North Sea: 68.4 GW<br />
0<br />
0hrs 12hrs 0hrs 12hrs 0hrs<br />
April 3-4, 2006<br />
24
image OFFSHORE WINDFARM,<br />
MIDDELGRUNDEN,<br />
COPENHAGEN, DENMARK.<br />
© LANGROCK/ZENIT/GP<br />
figure 17: <strong>power</strong> output of <strong>offshore</strong> <strong>wind</strong> <strong>power</strong> over<br />
two days FOR ONE WIND FARM, ALL WIND FARMS IN THE BELGIAN EEZ<br />
AND ACCUMULATED FOR ALL OFFSHORE WIND FARMS IN THE NORTH SEA<br />
Power(MW)<br />
300<br />
0<br />
3,846<br />
0<br />
68,400<br />
a) Single <strong>wind</strong> farm Belgium: 300 MW<br />
b) All <strong>offshore</strong> <strong>wind</strong> farms in Belgium: 3,846 MW<br />
c) All <strong>offshore</strong> <strong>wind</strong> farms in the North Sea: 68.4 GW<br />
For the <strong>wind</strong> farms in British waters (Figure 19), the load duration<br />
curves confirm the spatial smoothing effect that was already<br />
observed in the time series above.There is a clear reduction of<br />
hours with full <strong>power</strong> generation and of hours with no generation.<br />
More precisely, full <strong>power</strong> is available during approximately one<br />
percent of the time while more than 2% of installed capacity is<br />
available during 98% of the time.<br />
Also the results <strong>for</strong> Belgium (Figure 20) confirm the effect<br />
suggested by the time series above. For a single <strong>wind</strong> farm, both full<br />
load and very low load each occur roughly 10% of the time. All<br />
<strong>wind</strong> farms in the Belgian EEZ together (Figure 20b) exhibit only<br />
little difference from the load duration of a single <strong>wind</strong> farm.<br />
Unlike <strong>for</strong> low and high <strong>power</strong> generation, in the medium range of<br />
the duration curve, between 3000 and 6000 hrs, the shape <strong>for</strong> the<br />
entire North Sea is not fundamentally different from that of a<br />
single <strong>wind</strong> farm. In conclusion, the spatial spread of <strong>wind</strong> farms<br />
over the North Sea leads to a larger fraction of time during which<br />
medium level <strong>power</strong> is generated in exchange <strong>for</strong> a reduction of<br />
periods of full load.The fraction of time during which situations of<br />
full and no load occur is negligible.<br />
0<br />
0hrs 12hrs 0hrs 12hrs 0hrs<br />
April 3-4, 2006<br />
5.3 availability of <strong>wind</strong> <strong>power</strong> generation<br />
load duration<br />
The cumulative frequency distribution of the output <strong>power</strong> of a<br />
generator is described by its load duration curve.The load duration<br />
curve is derived from the annual time series by sorting the hourly<br />
<strong>power</strong> values in descending order. It shows during which fraction of<br />
the year’s 8760 hours the <strong>power</strong> output was above a specified level.<br />
The example <strong>for</strong> Germany (Figure 18) shows that<br />
• the <strong>wind</strong> farm in the example runs at full <strong>power</strong> <strong>for</strong> 1120 hrs<br />
or 12.8% of the time;<br />
• the <strong>wind</strong> farm generates more than 2% of its installed capacity<br />
over 8050 hrs or 91.9% of the time;<br />
• the spatial distribution of <strong>wind</strong> farms over the region leads to a<br />
somewhat lower fraction of time with full <strong>power</strong> generation as<br />
compared to the single <strong>wind</strong> farm; however, the generation<br />
profiles over time of different <strong>wind</strong> farms in the German Bight<br />
would be largely similar to each other.<br />
The load duration curve <strong>for</strong> the total installed capacity in the North<br />
Sea (Figure 18c) is shaped very differently. When adding up <strong>power</strong><br />
generation over the whole North Sea<br />
• full <strong>power</strong> is generated very rarely, namely, <strong>for</strong> approximately<br />
30 hrs, which is less than half a percent of the time;<br />
• the output is more than 2% of installed capacity or 1.37 GW<br />
over 99.7% of the time;<br />
• <strong>for</strong> 80% of the time the <strong>power</strong> output is more than 15.5%<br />
of installed capacity.<br />
exchange capacity from <strong>offshore</strong> interconnection<br />
An <strong>offshore</strong> grid providing interconnector capacity between <strong>offshore</strong><br />
<strong>wind</strong> farm clusters and onshore nodes in different countries is<br />
beneficial <strong>for</strong> the availability of <strong>offshore</strong> <strong>wind</strong> <strong>power</strong>. In a very<br />
simplified view, <strong>power</strong> from <strong>offshore</strong> <strong>wind</strong> farms can be aggregated<br />
and delivered to the country with the highest electricity price at any<br />
moment, via the <strong>offshore</strong> grid. In this view, the load duration curve<br />
<strong>for</strong> all aggregated <strong>wind</strong> farms in the North Sea (Figure 18c)<br />
reflects the ideal case of unconstrained transmission capacity.<br />
However in practice, <strong>wind</strong> <strong>power</strong> generation is part of the generation<br />
mix within a portfolio of generation and demand. In this respect,<br />
interconnectors serve <strong>for</strong> import and export as one means of<br />
portfolio management. More precisely, they can introduce flexibility<br />
into a portfolio.The capacity available <strong>for</strong> <strong>power</strong> exchange between<br />
countries can be used to complement periods of electricity surplus or<br />
shortage within the national <strong>power</strong> system.The value of<br />
interconnector capacity is high when the interconnected <strong>power</strong><br />
systems have a complementary generation mix and demand profile.<br />
This is largely the case with Norway compared to Great Britain and<br />
parts of continental Europe. In Norway large reservoir hydro <strong>power</strong><br />
plants are available, with an installed hydro <strong>power</strong> capacity of 28<br />
GW, an annual inflow of 136 TWh and a reservoir capacity<br />
equivalent to 82 TWh of electricity [54].They can be ramped up and<br />
down very fast and complement the nuclear and coal <strong>power</strong> plants<br />
that are largely used in continental Europe and Great Britain. As a<br />
consequence of the time shift and of differences in industry and<br />
regional habits, the demand profiles of continental Europe, Great<br />
Britain and Scandinavia are also partly complementary.<br />
The dashed horizontal lines in Figure 18b, Figure 19b and Figure 20b<br />
indicate the capacity margins that would be introduced with additional<br />
subsea cable links corresponding to the <strong>offshore</strong> grid in Figure 14.<br />
Assuming <strong>for</strong> each interconnector in Figure 14 a transmission capacity<br />
of 1 GW could very roughly reflect a first development stage of the<br />
25
GLOBAL ENERGY [R]EVOLUTION<br />
A NORTH SEA ELECTRICITY GRID [R]EVOLUTION<br />
<strong>offshore</strong> grid with, on average, one or two HVDC cable pairs <strong>for</strong> each<br />
interconnector 8 . In the long run, much higher capacities may be<br />
conceived as long as the market requires interconnector capacity <strong>for</strong><br />
trade during a sufficiently high fraction of time (<strong>for</strong> discussion see<br />
Section 4.3 on Drivers <strong>for</strong> Offshore Grid Development).<br />
figure 19: load duration curves of <strong>offshore</strong> <strong>wind</strong> <strong>power</strong><br />
FOR ONE WIND FARM, ALL WIND FARMS OFF THE BRITISH EAST COAST AND<br />
ACCUMULATED FOR ALL OFFSHORE WIND FARMS IN THE NORTH SEA;<br />
DATA FOR 2004-2006<br />
For Germany and Belgium, 3 GW of <strong>offshore</strong> interconnector<br />
capacity is assumed. For the British east coast, 6000 MW is<br />
assumed. In Figure 18b) the capacity margin introduced by 3 GW<br />
of additional interconnector capacity is set in relation to the load<br />
duration curve of 26.4 GW of <strong>offshore</strong> <strong>wind</strong> <strong>power</strong> capacity in the<br />
German Bight. If required, this capacity is available to the market<br />
<strong>for</strong> levelling out <strong>power</strong> shortages as indicated in the figure but also<br />
<strong>for</strong> exporting surplus generation when prices are higher abroad.<br />
1,000<br />
0<br />
22,238<br />
a) London Array I-IV: 1000 MW<br />
b) All <strong>offshore</strong> <strong>wind</strong> farms off the British East Coast: 22,238 MW<br />
Figure 19b) illustrates the same relationship <strong>for</strong> the <strong>wind</strong> farms<br />
and interconnectors at the British east coast where the assumed<br />
interconnector capacity could introduce additional flexibility <strong>for</strong><br />
more than a quarter of the envisioned <strong>wind</strong> <strong>power</strong> capacity. In<br />
Belgium (Figure 20b), with the assumption of coastal<br />
interconnectors to the Netherlands and France, the available<br />
interconnector capacity at sea would be of the order of magnitude<br />
of the envisioned <strong>offshore</strong> <strong>wind</strong> <strong>power</strong> generation capacity.<br />
Power(MW)<br />
0<br />
68,400<br />
Exchange capacity from <strong>offshore</strong> interconnection<br />
c) All <strong>offshore</strong> <strong>wind</strong> farms in the North Sea: 68.4 GW<br />
0<br />
0 1,000 2,000 3,000 4,000 5,000 6,000 7,000 8,000<br />
Availability of Power [hours/year]<br />
figure 18: load duration curves of <strong>offshore</strong> <strong>wind</strong> <strong>power</strong><br />
FOR ONE WIND FARM, ALL WIND FARMS IN THE GERMAN BIGHT AND<br />
ACCUMULATED FOR ALL OFFSHORE WIND FARMS IN THE NORTH SEA;<br />
DATA FOR 2004-2006<br />
figure 20: load duration curves of <strong>offshore</strong> <strong>wind</strong> <strong>power</strong><br />
FOR ONE WIND FARM, ALL WIND FARMS IN THE BELGIAN EEZ AND<br />
ACCUMULATED FOR ALL OFFSHORE WIND FARMS IN THE NORTH SEA;<br />
DATA FOR 2004-2006<br />
1,600<br />
a) Bard I+II: 1,600 MW<br />
300<br />
a) Single <strong>wind</strong> farm Belgium: 300 MW<br />
0<br />
0<br />
26,418<br />
b) All <strong>offshore</strong> <strong>wind</strong> farms in the German Bight: 26,418 MW<br />
3,846<br />
b) All <strong>offshore</strong> <strong>wind</strong> farms in Belgium: 3,846 MW<br />
Power(MW)<br />
0<br />
Exchange capacity from <strong>offshore</strong> interconnection<br />
Power(MW)<br />
0<br />
Exchange capacity from<br />
<strong>offshore</strong> interconnection<br />
68,400<br />
c) All <strong>offshore</strong> <strong>wind</strong> farms in the North Sea: 68.4 GW<br />
68,400<br />
c) All <strong>offshore</strong> <strong>wind</strong> farms in the North Sea: 68.4 GW<br />
0<br />
0 1,000 2,000 3,000 4,000 5,000 6,000 7,000 8,000<br />
0<br />
0 1,000 2,000 3,000 4,000 5,000 6,000 7,000 8,000<br />
Availability of Power [hours/year]<br />
Availability of Power [hours/year]<br />
footnote<br />
8 IN PRACTICE, SOME OF THE EXISTING HVDC LINKS HAVE A HIGHER CAPACITY<br />
ALREADY, WHILE THE FIRST UPCOMING HVDC PROJECTS WITH VSC ARE BEING PLANNED<br />
FOR LESS THAN 1000 MW.<br />
26
image WINDTURBINES AND<br />
ELECTRICITY CABLES.<br />
© LANGROCK/ZENIT/GP<br />
5.4 variability of <strong>wind</strong> <strong>power</strong> generation<br />
Variability can be described by the <strong>power</strong> variation, that is, the<br />
difference of the generated <strong>power</strong> at two successive time steps. In<br />
order to assess the statistics of the <strong>power</strong> variations, time series of<br />
the variation between two time steps have been calculated.They can<br />
serve <strong>for</strong> the statistical analysis of <strong>wind</strong> <strong>power</strong> variations.<br />
Figure 21 shows the distributions of relative frequency of hourly<br />
variations <strong>for</strong> the example of Great Britain.The figure illustrates<br />
that most <strong>power</strong> variations are small. Large variations occur rarely.<br />
For a single <strong>wind</strong> farm, 35% of all hourly variations are less than<br />
±1% of installed capacity (Figure 21a). For all <strong>wind</strong> farms off the<br />
British east coast together, this is the case <strong>for</strong> 40% of all hourly<br />
samples (Figure 21b). For the accumulated generation of all <strong>wind</strong><br />
farms together in the North Sea, 42% of all hourly variations are<br />
of less than ±1% (Figure 21c). In all cases, more than 50% of all<br />
variations are less than ±2% of installed capacity.<br />
Variations larger than ±5% occur <strong>for</strong> 20% of all hourly samples<br />
<strong>for</strong> the single <strong>wind</strong> farm. For all <strong>wind</strong> farms off the British east<br />
coast together they occur only 10% of the time and <strong>for</strong> the entire<br />
North Sea only 6% of the time.The occurrence of variations<br />
beyond ±10% appears to be negligible.<br />
figure 21: relative frequency of hourly variations<br />
in generation FOR ONE WIND FARM, ALL WIND FARMS OFF THE<br />
BRITISH EAST COAST AND ACCUMULATED FOR ALL OFFSHORE WIND<br />
FARMS IN THE NORTH SEA<br />
Relative Frequency [%]<br />
a) London Array I-IV: 1000 MW<br />
50<br />
40<br />
30<br />
20<br />
10<br />
0<br />
50<br />
40<br />
30<br />
20<br />
10<br />
0<br />
50<br />
40<br />
30<br />
20<br />
10<br />
0<br />
b) All <strong>offshore</strong> <strong>wind</strong> farms off the British East Coast: 22,238 MW<br />
c) All <strong>offshore</strong> <strong>wind</strong> farms in the North Sea: 68.4 GW<br />
-15 -10 -5 0 5 10 15<br />
In the following paragraphs, the occurrence of larger variations and<br />
variations over a longer period is analyzed in greater depth by<br />
means of cumulative frequency distribution curves.They are derived<br />
in analogy with the creation of the load duration curves <strong>for</strong> <strong>power</strong><br />
generation, by ordering the time series of the variation between two<br />
time steps in descending order.The resulting cumulative frequency<br />
curves show the probability of a <strong>power</strong> variation to be larger than<br />
the value on the ordinate. Different distributions have been drawn<br />
<strong>for</strong> different time lags. A positive <strong>power</strong> variation represents an<br />
increase in <strong>power</strong> and a negative one a decrease.<br />
For the example of the German Bight, variations from hour to hour<br />
are rare but <strong>for</strong> longer time lags variations occur regularly. From<br />
Figure 22a), the following can be observed:<br />
• the maximum hourly step sizes of a single <strong>wind</strong> farm are ±44%<br />
of installed capacity;<br />
• approximately 8.6% of all hourly <strong>power</strong> variations exceed, in any<br />
direction, 10% of the installed capacity;<br />
• <strong>for</strong> the 3-hourly variation this is 32% and <strong>for</strong> the 9-hourly one<br />
it is 54%;<br />
• <strong>for</strong> much longer step sizes, the <strong>power</strong> variation becomes<br />
distributed at random.<br />
For the sum of all <strong>wind</strong> farms in the German Bight (Figure 22b),<br />
the following can be observed:<br />
• the maximum hourly step sizes are reduced to +28% and -37%<br />
of installed capacity;<br />
• 3.4% of all hourly <strong>power</strong> variations exceed, in any direction,<br />
10% of the installed capacity;<br />
• <strong>for</strong> the 3-hourly variation this is 26.6% and <strong>for</strong> the 9-hourly one<br />
it is 55.1%;<br />
In conclusion, by accumulating the <strong>power</strong> generation <strong>for</strong> the<br />
German Bight, the overall variability is clearly reduced <strong>for</strong> hourly<br />
time steps and to some extent <strong>for</strong> 3-hourly steps. For 9-hourly time<br />
steps little smoothing effect is visible in the German Bight.<br />
For the accumulated generation of the <strong>wind</strong> farms off the British<br />
east coast, as <strong>for</strong> the German Bight, a smoothing effect is observed<br />
(Figure 23). However, <strong>for</strong> the British <strong>wind</strong> farms, being spread over<br />
a wider area, 3-hourly variation is reduced much more than <strong>for</strong> the<br />
German Bight and 9-hourly variation is reduced as well. For the<br />
accumulated generation off the British east coast:<br />
• the maximum hourly step sizes are reduced to +26% and -22%<br />
of installed capacity;<br />
• 1.1% of all hourly <strong>power</strong> variations exceed, in any direction,<br />
10% of the installed capacity;<br />
• <strong>for</strong> the 3-hourly variation this is 18.7% and <strong>for</strong> the 9-hourly one<br />
it is 49.5%.<br />
The accumulated generation <strong>for</strong> the Belgian EEZ exhibits a<br />
distribution of variations comparable to that from the German Bight<br />
but with larger hourly variability due to the limited area of the<br />
designated zone <strong>for</strong> <strong>offshore</strong> <strong>wind</strong> <strong>power</strong> in Belgium (Figure 24b).<br />
Hourly Variation as % of Capacity<br />
27
GLOBAL ENERGY [R]EVOLUTION<br />
A NORTH SEA ELECTRICITY GRID [R]EVOLUTION<br />
In contrast, the <strong>wind</strong> <strong>power</strong> generation <strong>for</strong> the whole North Sea is very<br />
smooth. From the distributions in Figure 24c), we can observe that:<br />
• the maximum hourly step sizes are ±19% of installed capacity;<br />
• only 0.43% of all hourly <strong>power</strong> variations exceed in any direction<br />
10% of the installed capacity;<br />
• <strong>for</strong> the 3-hourly variation this is 13.5% and <strong>for</strong> the 9-hourly one<br />
it is 44.8%;<br />
• again, <strong>for</strong> longer step sizes, the <strong>power</strong> variation becomes<br />
distributed at random.<br />
In order to summarize the overall statistics of <strong>power</strong> variations <strong>for</strong><br />
the three countries, P5 and P95 percentiles are given in Annex C.<br />
In conclusion, the characteristic period <strong>for</strong> which spatial<br />
decorrelation of <strong>wind</strong> speed can lead to a smooth generation profile<br />
depends strongly on the size of the area over which <strong>wind</strong> farms are<br />
distributed. In the German Bight, variability is clearly reduced <strong>for</strong><br />
hourly time steps and fairly well <strong>for</strong> 3-hourly steps. For the <strong>wind</strong><br />
farms off the British east coast, variability is clearly reduced <strong>for</strong><br />
hourly and 3-hourly time steps. Very long variations occur at<br />
random in all regions.<br />
figure 23: cumulative frequency of variations<br />
in hourly generation FOR ONE WIND FARM, ALL WIND FARMS OFF<br />
THE BRITISH EAST COAST AND ACCUMULATED FOR ALL OFFSHORE WIND<br />
FARMS IN THE NORTH SEA; LEGEND: TIME LAG<br />
Power Variation (%)<br />
100<br />
50<br />
0<br />
-50<br />
-100<br />
100<br />
50<br />
0<br />
-50<br />
-100<br />
100<br />
50<br />
0<br />
-50<br />
-100<br />
a) London Array I-IV: 1,000 MW<br />
b) All <strong>offshore</strong> <strong>wind</strong> farms off the British coast: 22,238 MW<br />
c) All <strong>offshore</strong> <strong>wind</strong> farms in the North Sea: 68.4 GW<br />
0 10 20 30 40 50 60 70 80 90 100<br />
Cumulative Frequency of Power Variations (%)<br />
1 h 3 h 9 h 27 h<br />
figure 22: cumulative frequency of variations<br />
in hourly generation FOR ONE WIND FARM, ALL WIND FARMS IN<br />
THE GERMAN BIGHT AND ACCUMULATED FOR ALL OFFSHORE WIND FARMS<br />
IN THE NORTH SEA; LEGEND: TIME LAG<br />
figure 24: cumulative frequency of variations<br />
in hourly generation FOR ONE WIND FARM, ALL WIND FARMS IN<br />
THE BELGIAN EEZ AND ACCUMULATED FOR ALL OFFSHORE WIND FARMS<br />
IN THE NORTH SEA; LEGEND: TIME LAG<br />
100<br />
50<br />
0<br />
-50<br />
-100<br />
a) Bard I+II: 1,600 MW<br />
100<br />
50<br />
0<br />
-50<br />
-100<br />
a) Single <strong>wind</strong> farm Belgium: 300 MW<br />
Power Variation (%)<br />
100<br />
50<br />
0<br />
-50<br />
-100<br />
b) All <strong>offshore</strong> <strong>wind</strong> farms in the German Bight: 26,418 MW<br />
Power Variation (%)<br />
100<br />
50<br />
0<br />
-50<br />
-100<br />
b) All <strong>offshore</strong> <strong>wind</strong> farms in the Belgium: 3,846 MW<br />
100<br />
50<br />
0<br />
-50<br />
-100<br />
c) All <strong>offshore</strong> <strong>wind</strong> farms in the North Sea: 68.4 GW<br />
0 10 20 30 40 50 60 70 80 90 100<br />
100<br />
50<br />
0<br />
-50<br />
-100<br />
c) All <strong>offshore</strong> <strong>wind</strong> farms in the North Sea: 68.4 GW<br />
0 10 20 30 40 50 60 70 80 90 100<br />
Cumulative Frequency of Power Variations (%)<br />
Cumulative Frequency of Power Variations (%)<br />
1 h 3 h 9 h 27 h<br />
1 h 3 h 9 h 27 h<br />
28
discussion and conclusions<br />
“ADDING UP THE POWER GENERATION FROM WIND FARMS OVER LARGER REGIONS CAN REDUCE THE PERIODS OF VERY LOW LOAD.”<br />
6<br />
© GREENPEACE/GILLBERG<br />
image AN OFFSHORE WIND FARM OUTSIDE COPENHAGEN, DENMARK.<br />
6.1 availability and variability<br />
characteristics of <strong>offshore</strong> <strong>wind</strong> <strong>power</strong> generation<br />
The availability of <strong>power</strong> from <strong>offshore</strong> <strong>wind</strong> farms can be<br />
characterized by the duration curve of <strong>wind</strong> <strong>power</strong> generation.The<br />
shape of the load duration curve depends on the local <strong>wind</strong> climate.<br />
On the one hand, <strong>for</strong> a single <strong>offshore</strong> <strong>wind</strong> farm there is typically a<br />
significant period during which it is generating at its maximum<br />
(rated) capacity (here set to 89% of installed capacity). In the<br />
cases under examination this is approximately during 10% of the<br />
time. On the other hand, a single <strong>wind</strong> farm will experience periods<br />
of very low load, in the North Sea up to another 10% of the time.<br />
Adding up the <strong>power</strong> generation from <strong>wind</strong> farms over larger<br />
regions can reduce the periods of very low load. When the<br />
geographical area of the North Sea is considered there is always<br />
some <strong>power</strong> generated. Adding up the generation from <strong>offshore</strong><br />
<strong>wind</strong> farms over large regions also leads to a larger amount of<br />
<strong>power</strong> generated at medium and low <strong>power</strong> levels in exchange <strong>for</strong> a<br />
reduction of periods of full and very low load.<br />
The variability of the <strong>offshore</strong> <strong>wind</strong> <strong>power</strong> generation can be<br />
characterized by means of histograms or cumulative frequency<br />
distributions of the <strong>power</strong> variation. Hourly <strong>power</strong> variations from a<br />
single <strong>wind</strong> farm mostly do not exceed ±2% of installed capacity.<br />
The occurrence of variations beyond 10% is negligible.<br />
With regard to unit commitment and dispatch of the <strong>power</strong> system,<br />
this means that the target should not be entirely smoothing out the<br />
variability of <strong>offshore</strong> <strong>wind</strong> <strong>power</strong> in the North Sea alone. Wind<br />
<strong>power</strong> should rather be seen as one source within a <strong>power</strong> generation<br />
portfolio that, as a whole, has to be managed in order to supply the<br />
variable demand.Today, <strong>wind</strong> <strong>power</strong> is well complemented by<br />
generation from reservoir hydro <strong>power</strong> plants and CCGT. In the<br />
future, other renewables and demand-side management may fulfil<br />
part of this task as well. Day-ahead and intra-day <strong>for</strong>ecasting of the<br />
<strong>wind</strong> <strong>power</strong> generation is required <strong>for</strong> optimal dispatch decisions and<br />
minimization of reserve requirements.<br />
29
GLOBAL ENERGY [R]EVOLUTION<br />
A NORTH SEA ELECTRICITY GRID [R]EVOLUTION<br />
portfolio management with centralized<br />
thermal <strong>power</strong> plants<br />
The variability of <strong>wind</strong> <strong>power</strong>, and especially its characteristic time<br />
scales, determine the feasibility of complementing large amounts of<br />
<strong>wind</strong> <strong>power</strong> in a portfolio that is historically dominated by thermal<br />
generation units.<br />
Hourly variations of <strong>wind</strong> <strong>power</strong> generation are very small even <strong>for</strong><br />
<strong>wind</strong> farms concentrated in a small area as the Belgian designated<br />
zone <strong>for</strong> <strong>offshore</strong> <strong>wind</strong> <strong>power</strong>. Variations over a few hours are<br />
significant when <strong>wind</strong> farms are concentrated in a small area. When<br />
the <strong>wind</strong> <strong>power</strong> generation from <strong>wind</strong> farms distributed over a larger<br />
area can be aggregated, variations over a few hours are levelled out.<br />
When large areas are considered, as <strong>for</strong> example the entire North<br />
Sea, variations over longer periods are levelled out to a limited extent.<br />
In a portfolio dominated by centralized thermal generation, the few<br />
short variations would be complemented by open cycle gas turbines<br />
(OCGT) <strong>for</strong> as far as no reservoir hydro <strong>power</strong> is available.The<br />
remaining deviations from demand would be complemented by<br />
thermal bulk generation plants, namely, CCGT <strong>for</strong> the time range of<br />
one to a few hours and also coal-fired units <strong>for</strong> the longer and less<br />
severe ones. A precise day-ahead <strong>for</strong>ecast <strong>for</strong> <strong>wind</strong> <strong>power</strong><br />
generation and demand is essential in order to optimize the<br />
commitment of these units. Due to their must-run status, nuclear<br />
<strong>power</strong> plants cannot complement deviations between supply and<br />
demand.There<strong>for</strong>e, in <strong>power</strong> systems with a high share of nuclear<br />
generation, the penetration level at which regular overproduction of<br />
<strong>wind</strong> <strong>power</strong> would occur is reached earlier than in a <strong>power</strong> system<br />
fully based on fossil fuel.<br />
portfolio management with renewables and<br />
distributed generation<br />
A sustainable <strong>power</strong> system in the future will consist of different<br />
types of generation from variable renewable sources: <strong>wind</strong> <strong>power</strong>,<br />
run river hydro <strong>power</strong>, solar <strong>power</strong>, and possibly <strong>power</strong> from waves<br />
and tidal streams. Power generation from distributed, heat demanddriven,<br />
CHP plants may also be considered variable.These sources<br />
are partly uncorrelated and partly complementary to each other. In<br />
order to further complement such portfolios and match supply with<br />
demand, demand side management and flexible generation units are<br />
required.These would be thermal units based on biomass or biogas,<br />
or natural gas-fired units. Reservoir hydro <strong>power</strong> would be the<br />
prefered choice, where available.<br />
6.2 flexibility<br />
Flexibility is the key requirement from a <strong>power</strong> system that is largely<br />
based on generation from variable renewable sources like <strong>offshore</strong><br />
<strong>wind</strong> energy. Flexibility can be introduced, amongst others, by:<br />
• distributed generation and storage,<br />
• controllable demand,<br />
• centralized storage,<br />
• reservoir hydro <strong>power</strong>,<br />
• flexible thermal <strong>power</strong> stations.<br />
30<br />
distributed generation and storage<br />
Distributed generation refers to <strong>power</strong> generation at distribution<br />
level or at the customer side of the meter. In practice distributed<br />
generation originates from photovoltaics, small <strong>wind</strong> farms and<br />
CHP heating systems. A priori, these generators do not introduce<br />
flexibility into the system but rather they increase the need <strong>for</strong><br />
flexibility. However, with incentives <strong>for</strong> demand control in place,<br />
these technologies provide additional opportunities <strong>for</strong> integrating<br />
local generation and demand into the management of large <strong>power</strong><br />
generation and supply portfolios. Some opportunities include:<br />
• shifting heat demand and storing heat in order to adapt the<br />
<strong>power</strong> generation profile of CHP production [17][19],<br />
• using the batteries of plugged-in hybrid vehicles as distributed<br />
storage devices, which could charge at periods of electricity<br />
surplus and discharge to supply electricity to the system when<br />
needed [55].<br />
These and other ways of using distributed resources in order to<br />
introduce flexibility to the <strong>power</strong> system could be motivated along<br />
with measures <strong>for</strong> demand control.<br />
controllable demand<br />
Historically, electricity demand has been considered a given quantity<br />
that could not be controlled. Recently, various approaches and<br />
demonstration projects have been carried out in order to make<br />
demand controllable.The concept is based on reducing demand<br />
during periods of scarcity (high demand and limited available<br />
generation capacity, high prices) and shifting it to periods of<br />
abundance (low demand and surplus generation capacity, low prices).<br />
The main advantage of demand control, compared to storage, is the<br />
limited investment cost. While storage requires hardware<br />
investments proportional to the required storage capacities and<br />
<strong>power</strong> levels, the investment <strong>for</strong> demand control is largely limited to<br />
software and communication equipment. In so-called smart<br />
distribution <strong>grids</strong>, demand control decisions could be taken<br />
automatically in order to maximize the benefit <strong>for</strong> the electricity<br />
consumer. Demand control actions could be initiated by a central<br />
dispatch centre depending on the condition of the <strong>power</strong> system.<br />
This practice is already applied today in many countries <strong>for</strong><br />
industrial customers. Alternatively, demand control actions could be<br />
taken on a local level motivated by price signals.Technically, this is<br />
possible with the current technology.<br />
centralized storage<br />
Today, pumped hydro accumulation storage (PAS) plants exist in<br />
different countries. As an alternative, compressed air energy storage<br />
(CAES) can be applied.The technology has been tested over many<br />
years and it is commercially available at costs which are in the<br />
same order of magnitude as those of pumped-storage plants<br />
[19][56][57]. With the current penetration rates of <strong>wind</strong> <strong>power</strong>, no<br />
centralized storage is required <strong>for</strong> <strong>wind</strong> <strong>power</strong> specifically; however,<br />
again it may be applied <strong>for</strong> the economic optimization of dispatch<br />
within a portfolio [19][57].<br />
Recently, in the Netherlands, the so-called Energy Island has been<br />
proposed.The Energy Island would be an artificial island at sea<br />
consisting of a ring of dikes that serves as a water reservoir <strong>for</strong>
image WINDTURBINE CONSTRUCTION<br />
YARD, GERMANY.<br />
© LANGROCK/ZENIT/GP<br />
pumped hydro accumulation storage [58]. Underground pumped<br />
hydro storage has also recently been examined in the Netherlands<br />
[19]. With 10 GW of installed <strong>offshore</strong> <strong>wind</strong> <strong>power</strong> capacity, these<br />
storage options can contribute to reducing the amount of <strong>wind</strong><br />
energy to be curtailed at situations of overproduction of <strong>wind</strong> <strong>power</strong><br />
at low load. However; from the proposed centralized storage<br />
systems, only CAES would be economically beneficial unlike the<br />
Energy Island and underground hydro accumulation storage [19].<br />
reservoir hydro <strong>power</strong><br />
Reservoir hydro <strong>power</strong> plants combine the functions of flexible<br />
generation and storage in one plant. In Europe the potential <strong>for</strong><br />
reservoir hydro <strong>power</strong> has already been exploited to a very large<br />
extent.The largest hydro <strong>power</strong> resources are available in Norway<br />
with a reservoir capacity equivalent to 82 TWh of electricity, an<br />
annual inflow of 136 TWh and an installed capacity of 28 GW.<br />
Other significant resources <strong>for</strong> reservoir hydro <strong>power</strong> are available<br />
in Sweden, in the Alpine countries and to some extent in the<br />
Spanish Pyrenees [54].<br />
Since hydro <strong>power</strong> is generated at no marginal costs, there is strong<br />
interest in the Baltic and North Sea region to export hydro <strong>power</strong><br />
from Scandinavia to Great Britain and continental Europe where the<br />
<strong>power</strong> systems are dominated by fossil fuel plants.The interconnectors<br />
from these countries to Norway as they are currently envisioned and<br />
depicted in Figure 14 are mainly driven by this objective. In the future<br />
these interconnectors may be used to adapt the import and export<br />
with Norway as a function of variable generation from <strong>wind</strong> <strong>power</strong> in<br />
the southern part of the North Sea and onshore.<br />
thermal <strong>power</strong> stations<br />
Flexible thermal <strong>power</strong> stations facilitate the portfolio management<br />
with large amounts of <strong>wind</strong> <strong>power</strong> in the short term. Combinedcycle<br />
gas turbines and open cycle gas turbines have high partial<br />
load efficiency and short start-up times.They are characterized by<br />
low investment costs and high fuel costs, which makes them suited<br />
<strong>for</strong> complementing variable generation when required.<br />
6.3 perspectives <strong>for</strong> an <strong>offshore</strong> grid<br />
The main drivers <strong>for</strong> the development of an <strong>offshore</strong> grid have been<br />
listed in Section 4.The design of the <strong>offshore</strong> grid as shown in<br />
Figure 11 is influenced by the drivers connectivity between<br />
countries and electricity market regions and an economically<br />
efficient connection of <strong>offshore</strong> <strong>wind</strong> farms. Its topology results<br />
from a process dominated:<br />
• in the past by the need of interconnectors <strong>for</strong> security of supply<br />
and long-term trade,<br />
• today by the demand <strong>for</strong> trade and the subsequent requirement<br />
<strong>for</strong> commercial interconnectors,<br />
• in the future by the need <strong>for</strong> grid connection of multi-gigawatt<br />
<strong>wind</strong> farm clusters far from shore.<br />
The capacity of <strong>offshore</strong> interconnectors will always strive towards<br />
values as required <strong>for</strong> arbitrage between market regions, possibly in<br />
the range of several gigawatts.There would be a strong interest in<br />
interconnection to Norway, in order to be able to import electricity<br />
from hydro <strong>power</strong> to the UCTE system and Great Britain.<br />
Norwegian hydro <strong>power</strong> could then also serve in order to<br />
compensate <strong>for</strong> <strong>wind</strong> <strong>power</strong> variations.<br />
Offshore <strong>wind</strong> farms will still firstly be connected to a full-sized<br />
grid connection to the country of the EEZ in which they are<br />
situated. In order to serve <strong>wind</strong> farm clusters far from shore, highvoltage<br />
DC grid connections will be required. Where opportunities<br />
<strong>for</strong> arbitrage exist, several of the required <strong>offshore</strong> HVDC converter<br />
stations may be equipped with a prolongation to another country in<br />
order to upgrade the grid connection to a commercial<br />
interconnector.The capacity of the prolongation will be determined<br />
by the expected opportunity <strong>for</strong> arbitrage between the market<br />
regions. It may be less than that of the <strong>wind</strong> farm grid connection.<br />
The first candidates <strong>for</strong> such shared infrastructures are the British<br />
<strong>wind</strong> farms at the Dogger Bank and those in the German Bight.<br />
By upgrading grid connections to interconnectors, <strong>wind</strong> <strong>power</strong> can<br />
offer to the <strong>power</strong> market the opportunity to make use of its grid<br />
connection lines whenever capacity is available. In most cases, such<br />
continued interconnectors will be much less expensive than a shoreto-shore<br />
interconnector. Moreover, they allow increasing the overall<br />
utilization time of the <strong>wind</strong> farms’ grid connection lines.<br />
In all cases, <strong>offshore</strong> <strong>wind</strong> farms being connected to<br />
interconnectors need to enjoy priority dispatch on these<br />
interconnectors. Only the remaining available interconnector<br />
transfer capacity must be allocated to the market. If this principle<br />
is not obeyed, <strong>offshore</strong> <strong>wind</strong> farms would regularly have to curtail<br />
their output while interconnectors are used <strong>for</strong> trade.<br />
In conclusion, an <strong>offshore</strong> grid in the North Sea facilitates trade<br />
and it increases security of supply by offering increased<br />
connectivity. It allows dispatching <strong>power</strong> from <strong>offshore</strong> <strong>wind</strong> farms<br />
to different countries depending on the highest demand. By enabling<br />
the supply of aggregated generation profiles from different regions<br />
to one market, the <strong>offshore</strong> grid contributes to reducing the<br />
variability of <strong>wind</strong> <strong>power</strong> generation in the range of hours.<br />
Moreover, an <strong>offshore</strong> grid in the North Sea allows the import of<br />
electricity from hydro <strong>power</strong> from Norway to the British and the<br />
UCTE system.This can replace thermal base load plants and<br />
increase the flexibility within a portfolio. In addition, increased<br />
liquidity and trading facilities on the European <strong>power</strong> markets will<br />
allow <strong>for</strong> a more efficient portfolio management.<br />
The value of an <strong>offshore</strong> grid in the North Sea lies in its<br />
contribution <strong>for</strong> increased security of supply, its function <strong>for</strong> the<br />
aggregation and dispatch of <strong>power</strong> from <strong>offshore</strong> <strong>wind</strong> farms, and<br />
in its role as a facilitator <strong>for</strong> <strong>power</strong> exchange and trade between<br />
regions and <strong>power</strong> systems. Integrating interconnectors with<br />
connection lines <strong>for</strong> <strong>wind</strong> farms far from shore can yield efficiency<br />
gains <strong>for</strong> the development of both <strong>wind</strong> <strong>power</strong> projects and<br />
commercial interconnectors.<br />
Finally, in regions where low electricity demand is concentrated at the<br />
coast, rein<strong>for</strong>cement of the onshore transmission system is as<br />
important as the development of an <strong>offshore</strong> grid in order to facilitate<br />
<strong>power</strong> transmission from the coasts to the centres of demand.<br />
31
GLOBAL ENERGY [R]EVOLUTION<br />
A NORTH SEA ELECTRICITY GRID [R]EVOLUTION<br />
references<br />
1 H. SÖKER, K. REHFELDT, F. SANTJER, M. STRACK, M. SCHREIBER. OFFSHORE WIND<br />
ENERGY IN THE NORTH SEA, TECHNICAL POSSIBILITIES AND ECOLOGICAL<br />
CONSIDERATIONS – A STUDY FOR GREENPEACE. DEWI, OCTOBER 2000.<br />
2 H. SNODIN. SEA WIND EUROPE. GARRAD HASSAN AND PARTNERS FOR GREENPEACE,<br />
FEBRUARY 2004.<br />
3 G. GERDES, A. JANSEN, K. REHFELDT. OFFSHORE WIND - IMPLEMENTING A NEW<br />
POWER HOUSE FOR EUROPE. DEUTSCHE WINDGUARD FOR GREENPEACE<br />
INTERNATIONAL, APRIL 2005.<br />
4 WINDFORCE 12, A BLUEPRINT TO ACHIEVE 12% OF THE WORLD'S ELECTRICITY<br />
FROM WIND POWER BY 2020. GREENPEACE AND EWEA, JUNE 2005.<br />
5 GLOBAL WIND ENERGY OUTLOOK 2006. GREENPEACE AND GWEC, SEPTEMBER 2006.<br />
6 S. TESKE. ENERGY REVOLUTION: A SUSTAINABLE PATHWAY TO A CLEAN ENERGY<br />
FUTURE FOR EUROPE. DLR FOR GREENPEACE INTERNATIONAL, SEPTEMBER 2005.<br />
7 S. TESKE, A. ZERVOS, O. SCHÄFER. ENERGY [R]EVOLUTION. DLR AND ECOFYS FOR<br />
GREENPEACE INTERNATIONAL AND EREC. JANUARY 2007.<br />
8 DELIVERING OFFSHORE WIND POWER IN EUROPE. EWEA, DECEMBER 2007.<br />
9 PURE POWER, WIND ENERGY SCENARIOS UP TO 2030. EWEA, MARCH 2008.<br />
10 S. SHAW, M.J. CREMERS, G. PALMERS. ENABLING OFFSHORE WIND DEVELOPMENTS<br />
– SEALEGAL, BRUSSELS 2002.<br />
11 A. WOYTE, P. GARDNER, AND H. SNODIN. CONCERTED ACTION FOR OFFSHORE WIND<br />
ENERGY DEPLOYMENT, WORK PACKAGE 8: GRID ISSUES, OFFSHORE WIND ENERGY<br />
EUROPE, COD, OCTOBER 2005. HTTP://WWW.OFFSHOREWINDENERGY.ORG/COD/,<br />
ACCESSED 14/15/2008.<br />
12 F. VAN HULLE. LARGE SCALE INTEGRATION OF WIND ENERGY IN THE EUROPEAN<br />
POWER SUPPLY: ANALYSIS, ISSUES AND RECOMMENDATIONS. EWEA, BRUSSELS,<br />
BELGIUM, DECEMBER 2005.<br />
13 EUROPEAN TRANSMISSION SYSTEM OPERATORS. EUROPEAN WIND INTEGRATION<br />
STUDY (EWIS) – TOWARDS A SUCCESSFUL INTEGRATION OF WIND POWER INTO<br />
EUROPEAN ELECTRICITY GRIDS. FINAL REPORT PHASE 1, JANUARY 2007.<br />
14 IEA ANNEX 25 HOMEPAGE, DESIGN AND OPERATION OF POWER SYSTEMS WITH<br />
LARGE AMOUNTS OF WIND POWER. HTTP://WWW.IEAWIND.ORG/ANNEXXXV.HTML,<br />
ACCESSED 5/06/2008.<br />
15 TRADEWIND – WIND POWER INTEGRATION AND EXCHANGE IN THE TRANS-<br />
EUROPEAN POWER MARKET. PROJECT WEBSITE. HTTP://WWW.TRADE-WIND.EU/,<br />
ACCESSED 5/06/2008.<br />
16 H. HOLTTINEN ET AL. DESIGN AND OPERATION OF POWER SYSTEMS WITH LARGE<br />
AMOUNTS OF WIND POWER, STATE-OF-THE-ART REPORT. IEA WIND TASK 25, VTT<br />
WORKING PAPERS 82, FINLAND, OCTOBER 2007.<br />
HTTP://WWW.IEAWIND.ORG/ANNEXXXV.HTML, ACCESSED 5/06/2008.<br />
17 P. NØRGAARD, H. LUND, B.V. MATHIESEN. MIX OF POWER SYSTEM FLEXIBILITY<br />
MEANS PROVIDING 50% WIND POWER PENETRATION IN THE DANISH POWER<br />
SYSTEM IN 2030. PROC. 7TH INTERNATIONAL WORKSHOP ON LARGE SCALE<br />
INTEGRATION OF WIND POWER AND ON TRANSMISSION NETWORKS FOR OFFSHORE<br />
WIND FARMS, MADRID, SPAIN, MAY 2008, PP. 162-166.<br />
18 B.C. UMMELS, M. GIBESCU, E. PELGRUM, W. KLING, A. BRANDT. IMPACTS OF WIND<br />
POWER ON THERMAL GENERATION UNIT COMMITMENT AND DISPATCH. IEEE<br />
TRANSACTIONS ON ENERGY CONVERSION, 22(1), MARCH 2007, PP. 44-51.<br />
19 B.C. UMMELS, E. PELGRUM, W. KLING. INTEGRATION OF LARGE-SCALE WIND POWER<br />
AND USE OF ENERGY STORAGE IN THE NETHERLANDS’ ELECTRICITY SUPPLY. IET<br />
RENEWABLE POWER GENERATION, 2(1), MARCH 2008, PP. 26-33.<br />
20 POWER TRANSNATIONAL SUPPLY CHAIN STUDY: APPENDICES, DOUGLAS<br />
WESTWOOD, 05/2006.<br />
21 G. VAN DER TOORN, WIND POWER CAPACITY DATA COLLECTION. GARRAD HASSAN<br />
AND PARTNERS FOR TRADEWIND, D2.1, APRIL 2007. HTTP://WWW.TRADE-WIND.EU/,<br />
ACCESSED 18/04/2008.<br />
22 F. VAN HULLE, J. DE DECKER, A. WOYTE. OFFSHORE GRID SCENARIOS: MAPPING<br />
OFFSHORE WIND POWER CAPACITY FOR TRADEWIND GRID SCENARIOS. TRADEWIND,<br />
DRAFT D6.2, MAY 2008.TO BE PUBLISHED ON HTTP://WWW.TRADE-WIND.EU/.<br />
23 F. VAN HULLE, S. LE BOT, Y. CABOOTER, J. SOENS, V. VAN LANCKER, S. DELEU, J.P.<br />
HENRIET, G. PALMERS, L. DEWILDE J. DRIESEN, P. VAN ROY, R. BELMANS. OPTIMAL<br />
OFF-SHORE WIND ENERGY DEVELOPMENTS IN BELGIUM, SPSD II, FINAL REPORT<br />
CP/21. 3E FOR BELGIAN SCIENCE POLICY, BRUSSELS, BELGIUM, MAY 2004.<br />
24 J. DE RUYCK, MAXIMUM POTENTIALS FOR RENEWABLE ENERGIES, SUPPORTING<br />
DOCUMENTS FOR COMMISSION ON ENERGY 2030, JUNE 2007.<br />
25 50% WIND POWER IN DENMARK IN 2025, EA ENERGY ANALYSES, JULY 2007.<br />
26 FUTURE OFFSHORE WIND POWER SITES – 2025, DANISH ENERGY AUTHORITY –<br />
COMMITTEE FOR FUTURE OFFSHORE WIND POWER SITES, APRIL 2007.<br />
27 WWW.OFFSHORE-WIND.DE, DEUTSCHE ENERGIEAGENTUR (DENA).<br />
HTTP://WWW.OFFSHORE-WIND.DE/, ACCESSED 24/03/2008.<br />
28 UK DEPARTMENT FOR BUSINESS, ENTERPRISE AND REGULATORY REFORM (BERR),<br />
HTTP://WWW.BERR.GOV.UK, ACCESSED 04/2008.<br />
29 EAST COAST TRANSMISSION NETWORK: TECHNICAL FEASIBILITY STUDY. ECONNECT<br />
FOR THE CROWN ESTATE, JANUARY 2008.<br />
30 RIJKSWATERSTAAT NOORDZEE, HTTP://WWW.NOORDZEELOKET.NL, ACCESSED 03/2008.<br />
31 CONNECT 6000 MW, MINISTERIE VAN ECONOMISCHE ZAKEN, DEN HAAG, JULY 2004<br />
32<br />
32 WEATHER AND RESEARCH FORECAST MODEL (WRF).<br />
HTTP://WWW.WRF-MODEL.ORG, ACCESSED 14/03/2008.<br />
33 A. SOOD, K. SUSELJ, D. HEINEMANN, WIND RESOURCE AND SITE ASSESSMENT IN<br />
THE GERMAN BIGHT; EXTREME WINDS AT MESO- TO MICROSCALE, PROC. EUROPEAN<br />
WIND ENERGY CONFERENCE EWEC 2007, MILAN, ITALY, MAY 2007.<br />
34 A. SOOD, K. SUSELJ, D. HEINEMANN. HIGH RESOLUTION NWP NORTH SEA WIND<br />
FORECASTS IN THE MARINE ATMOSPHERIC BOUNDARY LAYER, PROC. EUROPEAN<br />
WIND ENERGY CONFERENCE EWEC 2007, MILAN, ITALY, MAY 2007.<br />
35 J.R. MCLEAN, EQUIVALENT WIND POWER CURVES, GARRAD HASSAN AND PARTNERS<br />
FOR TRADEWIND, D2.4, APRIL 2007, HTTP://WWW.TRADE-WIND.EU/,<br />
ACCESSED 13/02/2008.<br />
36 R. WATSON. AN UNDERSEA TRANSMISSION GRID TO OFFLOAD OFFSHORE WIND FARMS<br />
IN THE IRISH SEA. PROC. 3RD INTERNATIONAL WORKSHOP ON TRANSMISSION<br />
NETWORKS FOR OFFSHORE WIND FARMS, STOCKHOLM, SWEDEN, APRIL 2002.<br />
37 AIRTRICITY, SUPERGRID,<br />
HTTP://WWW.AIRTRICITY.COM/INTERNATIONAL/WIND_FARMS/SUPERGRID/,<br />
ACCESSED 06/2008.<br />
38 C. VEAL, C. BYRNE, S. KELLY. THE COST-BENEFIT OF INTEGRATING OFFSHORE WIND<br />
FARM CONNECTIONS AND SUBSEA INTERCONNECTORS IN THE NORTH SEA. PROC.<br />
EUROPEAN OFFSHORE WIND CONFERENCE & EXHIBITION, BERLIN, GERMANY,<br />
DECEMBER 2007.<br />
39 G. CZISCH, SZENARIEN ZUR ZUKÜNFTIGEN STROMVERSORGUNG BEI OPTIMALER<br />
NUTZUNG VON FUSIONSKRAFTWERKEN UND REGENERATIVEN ENERGIEN, PHD.<br />
THESIS, UNIV. KASSEL 2005.<br />
40 F. TRIEB, TRANS-CSP TRANS MEDITERRANEAN INTERCONNECTION<br />
FOR CONCENTRATING SOLAR POWER. FINAL REPORT, DLR,<br />
HTTP://WWW.DLR.DE/TT/TRANS-CSP/, ACCESSED 2/06/2008.<br />
41 K. HAUGLUM. NORWEGIAN VISION ON THE NORTH SEA OFFSHORE GRID.<br />
PRESENTATION BY STATNETT, BRUSSELS, BELGIUM, JUNE 12, 2008.<br />
42 T. ACKERMANN. TRANSMISSION SYSTEMS FOR OFFSHORE WIND FARMS,<br />
CHAPTER IN WIND POWER IN POWER SYSTEMS, EDITOR T. ACKERMANN, WILEY, 2005.<br />
43 M. DE ALEGRÍA, J. L. MARTÍN, I. KORTABARRIA, J. ANDREU AND P. I. EREÑO.<br />
TRANSMISSION ALTERNATIVES FOR OFFSHORE ELECTRICAL POWER. RENEWABLE<br />
AND SUSTAINABLE ENERGY REVIEWS, AVAILABLE ONLINE 22 APRIL 2008.<br />
44 L.P. LAZARIDIS. ECONOMIC COMPARISON OF HVAC AND HVDC SOLUTIONS FOR<br />
LARGE OFFSHORE WIND FARMS UNDER SPECIAL CONSIDERATION OF RELIABILITY.<br />
MASTER’S THESIS. ROYAL INSTITUTE OF TECHNOLOGY, STOCKHOLM, 2005.<br />
45 ABB, HVDC AND HVDC LIGHT. HTTP://WWW.ABB.COM/HVDC, ACCESSED 13/06/2008.<br />
46 S. LUNDBERG. CONFIGURATION STUDY OF LARGE WIND PARKS. MASTER’S THESIS.<br />
CHALMERS, UNIVERSITY OF TECHNOLOGY, GÖTEBORG, SWEDEN, 2003.<br />
47 ENERGIEWIRTSCHAFTLICHE PLANUNG FÜR DIE NETZINTEGRATION VON<br />
WINDENERGIE IN DEUTSCHLAND AN LAND UND OFFSHORE BIS ZUM JAHR 2020.<br />
ENDBERICHT. ENERGIEWIRTSCHAFTLICHES INSTITUT AN DER UNIVERSITÄT ZU<br />
KÖLN (EWI), DEUTSCHESWINDENERGIE-INSTITUT (DEWI), E.ON NETZ GMBH, RWE<br />
TRANSPORTNETZ STROM GMBH, VATTENFALL EUROPE TRANSMISSION GMBH. STUDY<br />
COMMISSIONED BY DEUTSCHE ENERGIE-AGENTUR GMBH (DENA), KÖLN, GERMANY,<br />
24 FEBRUARY 2005.<br />
48 NORDIC GRID MASTER PLAN 2008, NORDEL, MARCH 2008, HTTP://WWW.NORDEL.ORG,<br />
ACCESSED 5/06/2006.<br />
49 TENNET HOMEPAGE, PROJECTS, NORNED, PROJECT DESCRIPTION.<br />
HTTP://WWW.TENET.ORG, ACCESSED 16/07/2008.<br />
50 NORNED AUCTION - HOMEPAGE, CAPACITY & RESULTS, EXPORT DATA.<br />
HTTP://WWW.NORNED-AUCTION.ORG/, ACCESSED 16/07/2008.<br />
51 ENERGY CONSUMPTION IN THE UNITED KINGDOM, DEPARTMENT OF TRADE AND<br />
INDUSTRY (DTI) & NATIONAL STATISTICS, JULY 2002,TABLES UPDATED IN JULY 2007,<br />
AVAILABLE ON HTTP://WWW.BERR.GOV.UK/FILES/FILE11250.PDF, ACCESSED 03/07/2008<br />
52 NORDEL ANNUAL STATISTICS 2006, NORDEL, AVAILABLE ON WWW.NORDEL.ORG,<br />
ACCESSED 03/07/2008<br />
53 STATISTICAL YEARBOOK 2006, UCTE, SEPTEMBER 2007,<br />
HTTP://WWW.UCTE.ORG/PUBLICATIONS/STATSYEARBOOK, ACCESSED 03/07/2008<br />
54 M. KORPÅS, L. WARLAND, J.O.G. TANDE, K. UHLEN, K. PURCHALA, S. WAGEMANS. GRID<br />
MODELLING AND POWER SYSTEM DATA. TRADEWIND, D3.2, DECEMBER 2007.<br />
HTTP://WWW.TRADE-WIND.EU/, ACCESSED 19/01/2008.<br />
55 P. DENHOLM, W. SHORT. AN EVALUATION OF UTILITY SYSTEM IMPACTS AND<br />
BENEFITS OF OPTIMALLY DISPATCHED PLUG-IN HYBRID ELECTRIC VEHICLES.<br />
TECHNICAL REPORT NREL/TP-620-40293, OCTOBER 2006.<br />
56 S. ZUNFT, C. JAKIEL, M. KOLLER, C. BULLOUGH. ADIABATIC COMPRESSED AIR<br />
STORAGE FOR THE GRID INTEGRATION OF WIND POWER. PROC. 6TH INTERNATIONAL<br />
WORKSHOP ON LARGE SCALE INTEGRATION OF WIND POWER AND ON<br />
TRANSMISSION NETWORKS FOR OFFSHORE WIND FARMS, DELFT, NETHERLANDS,<br />
OCTOBER 2006, PP. 346-351.<br />
57 P. SIEMES, H.-J. HAUBRICH, H. VENNEGEERTS, S. OHREM. CONCEPTS FOR THE<br />
IMPROVED INTEGRATION OF WIND POWER INTO THE GERMAN INTERCONNECTED<br />
SYSTEM. IET RENEWABLE POWER GENERATION, 2(1), MARCH 2008, PP. 26-33.<br />
58 W.W. DE BOER, F.J. VERHEIJ, D. ZWEMMER AND R. DAS. THE ENERGY ISLAND –<br />
AN INVERSE PUMP ACCUMULATION STATION. PROC. EUROPEAN WIND ENERGY<br />
CONFERENCE EWEC 2007, MILAN, ITALY, MAY 2007.
image AERIAL VIEW OF SUBMARINE<br />
CABLES BEING LAYED OUT IN THE<br />
BELGIUM NORTH SEA.<br />
annex a<br />
© C-POWER<br />
table 5: <strong>wind</strong> farm sites & installed capacity data<br />
PROJECT NAME<br />
COUNTRY<br />
P INSTALLED [MW]<br />
PROJECT NAME<br />
COUNTRY<br />
P INSTALLED [MW]<br />
Unnamed I<br />
Unnamed II<br />
Bligh Bank<br />
Unnamed III<br />
Bank zonder naam<br />
Unnamed IV<br />
Thornton Bank I<br />
Thornton Bank II<br />
Unnamed VI<br />
Unnamed V<br />
Rønland<br />
Horns Rev I<br />
Horns Rev II<br />
A - Horns Rev<br />
B - Horns Rev<br />
C - Horns Rev<br />
K - Jammerbugt<br />
L - Jammerbugt<br />
M - Jammerbugt<br />
Unnamed 1<br />
North Sea Wind<strong>power</strong> I+II<br />
Gode<strong>wind</strong> I+II<br />
DanTysk I+II<br />
BARD Offshore 1 I+II<br />
Sandbank 24 I+II<br />
Austerngrund<br />
Deutsche Bucht<br />
Hochsee Windpark Nordsee I+II<br />
Nördlicher Grund I+II<br />
Nordsee Ost I+II<br />
Butendiek<br />
He Dreiht<br />
Borkum Riffgrund I+II<br />
Globaltech 1 I+II<br />
Amrumbank West<br />
Uthland<br />
Ventotec Nord 1 I+II<br />
Ventotec Nord 2 I+II<br />
Borkum Riffgrund West I+II<br />
Borkum Riffgat<br />
Nordergründe<br />
Borkum West I+II<br />
Meer<strong>wind</strong> I+II<br />
Teeside/Redcar<br />
Blyth Offshore<br />
Inner Dowsing<br />
Lynne<br />
Cromer<br />
Scroby Sands<br />
Gunfleet Sands I<br />
Gunfleet Sands II<br />
Kentish flats<br />
Westermost Rough<br />
Humber Gateway<br />
Lincs<br />
Docking Shoal<br />
Race ranck<br />
Triton Knoll<br />
Sheringham Shoal<br />
Dudgeon East<br />
London Array I - IV<br />
Greater Gabbard I+II<br />
Thanet<br />
Beatrice<br />
Aberdeen Harbour<br />
Round3 - 1<br />
Round3 - 2<br />
Round3 - 3<br />
Round3 - 4<br />
Round3 - 5<br />
Round3 - 6<br />
Round3 - 7<br />
Round3 - 8<br />
Round3 - 9<br />
Round3 - 10<br />
Round3 - 11<br />
Round3 - 12<br />
Round3 - 13<br />
Round3 - 14<br />
Round3 - 15<br />
Belgium<br />
Belgium<br />
Belgium<br />
Belgium<br />
Belgium<br />
Belgium<br />
Belgium<br />
Belgium<br />
Belgium<br />
Belgium<br />
Denmark<br />
Denmark<br />
Denmark<br />
Denmark<br />
Denmark<br />
Denmark<br />
Denmark<br />
Denmark<br />
Denmark<br />
France<br />
Germany<br />
Germany<br />
Germany<br />
Germany<br />
Germany<br />
Germany<br />
Germany<br />
Germany<br />
Germany<br />
Germany<br />
Germany<br />
Germany<br />
Germany<br />
Germany<br />
Germany<br />
Germany<br />
Germany<br />
Germany<br />
Germany<br />
Germany<br />
Germany<br />
Germany<br />
Germany<br />
Great Britain<br />
Great Britain<br />
Great Britain<br />
Great Britain<br />
Great Britain<br />
Great Britain<br />
Great Britain<br />
Great Britain<br />
Great Britain<br />
Great Britain<br />
Great Britain<br />
Great Britain<br />
Great Britain<br />
Great Britain<br />
Great Britain<br />
Great Britain<br />
Great Britain<br />
Great Britain<br />
Great Britain<br />
Great Britain<br />
Great Britain<br />
Great Britain<br />
Great Britain<br />
Great Britain<br />
Great Britain<br />
Great Britain<br />
Great Britain<br />
Great Britain<br />
Great Britain<br />
Great Britain<br />
Great Britain<br />
Great Britain<br />
Great Britain<br />
Great Britain<br />
Great Britain<br />
Great Britain<br />
Great Britain<br />
500<br />
500<br />
330<br />
500<br />
216<br />
500<br />
120<br />
180<br />
500<br />
500<br />
17.2<br />
160<br />
200<br />
200<br />
200<br />
200<br />
200<br />
200<br />
200<br />
1000<br />
1226<br />
1120<br />
1500<br />
1600<br />
4900<br />
400<br />
400<br />
2555<br />
2010<br />
1250<br />
240<br />
535.5<br />
746<br />
1600<br />
400<br />
400<br />
600<br />
600<br />
1800<br />
220<br />
125<br />
1040<br />
1150<br />
90<br />
4<br />
97.2<br />
97.2<br />
108<br />
60<br />
108<br />
64<br />
90<br />
240<br />
300<br />
250<br />
500<br />
500<br />
1200<br />
315<br />
300<br />
1000<br />
500<br />
300<br />
1000<br />
115<br />
1000<br />
1000<br />
1000<br />
1000<br />
1000<br />
1000<br />
1000<br />
1000<br />
1000<br />
1000<br />
1000<br />
1000<br />
1000<br />
1000<br />
1000<br />
Ijmuiden<br />
Den Helder Noord<br />
Helmveld<br />
Breeveertien<br />
Brown Ridge Oost<br />
Den Helder I<br />
Den Helder II<br />
IJmuiden 1<br />
Den Helder<br />
Okeanos Noord<br />
Favorius<br />
Wijk aan Zee<br />
Callantsoog-Noord<br />
Q7-West<br />
Riffgrond<br />
Oost Friesland<br />
Osters Bank 1<br />
Osters Bank 3<br />
BARD Offshore NL1<br />
GWS Offshore NL1<br />
Den Haag II<br />
P15-WP<br />
Katwijk Buiten<br />
Eurogeul Noord<br />
Hopper<br />
Maas West Buiten<br />
Den Haag Noord<br />
Noord Hinder 1<br />
West Rijn<br />
Rijnveld Noord<br />
Rijnveld West<br />
WindNed Noord<br />
Hoek van Holland 3<br />
Scheveningen 3<br />
Q10<br />
Schaar<br />
Utsira<br />
Sørlige Nordsjøen<br />
Total<br />
Netherlands<br />
Netherlands<br />
Netherlands<br />
Netherlands<br />
Netherlands<br />
Netherlands<br />
Netherlands<br />
Netherlands<br />
Netherlands<br />
Netherlands<br />
Netherlands<br />
Netherlands<br />
Netherlands<br />
Netherlands<br />
Netherlands<br />
Netherlands<br />
Netherlands<br />
Netherlands<br />
Netherlands<br />
Netherlands<br />
Netherlands<br />
Netherlands<br />
Netherlands<br />
Netherlands<br />
Netherlands<br />
Netherlands<br />
Netherlands<br />
Netherlands<br />
Netherlands<br />
Netherlands<br />
Netherlands<br />
Netherlands<br />
Netherlands<br />
Netherlands<br />
Netherlands<br />
Netherlands<br />
Norway<br />
Norway<br />
246<br />
450<br />
425<br />
210<br />
270<br />
650<br />
650<br />
500<br />
500<br />
38<br />
129<br />
200<br />
328<br />
245<br />
400<br />
500<br />
500<br />
500<br />
280<br />
280<br />
480<br />
219<br />
325<br />
275<br />
400<br />
175<br />
285<br />
560<br />
180<br />
60<br />
144<br />
156<br />
500<br />
500<br />
151<br />
328<br />
300<br />
990<br />
68408.1<br />
33
GLOBAL ENERGY [R]EVOLUTION<br />
A NORTH SEA ELECTRICITY GRID [R]EVOLUTION<br />
annex b<br />
figure 25: <strong>power</strong> output of <strong>offshore</strong> <strong>wind</strong> <strong>power</strong><br />
over three days FOR ONE WIND FARM, ALL WIND FARMS IN THE<br />
DANISH EEZ (NORTH SEA ONLY) AND ACCUMULATED FOR ALL OFFSHORE<br />
WIND FARMS IN THE NORTH SEA<br />
figure 27: <strong>power</strong> output of <strong>offshore</strong> <strong>wind</strong> <strong>power</strong><br />
over three days FOR ONE WIND FARM, ALL WIND FARMS IN THE<br />
DUTCH EEZ (NORTH SEA ONLY) AND ACCUMULATED FOR ALL OFFSHORE<br />
WIND FARMS IN THE NORTH SEA<br />
360<br />
a) Horns Rev I+II: 360 MW<br />
246<br />
a) Ilmuiden: 246 MW<br />
0<br />
0<br />
1,577<br />
b) All <strong>offshore</strong> <strong>wind</strong> farms in the Danish North Sea: 1,577 MW<br />
12,039<br />
b) All <strong>offshore</strong> <strong>wind</strong> farms in the Netherlands: 12,039 MW<br />
Power(MW)<br />
0<br />
Power(MW)<br />
0<br />
68,400<br />
c) All <strong>offshore</strong> <strong>wind</strong> farms in the North Sea: 68.4 GW<br />
68,400<br />
c) All <strong>offshore</strong> <strong>wind</strong> farms in the North Sea: 68.4 GW<br />
0<br />
0hrs 12hrs 0hrs 12hrs 0hrs<br />
0<br />
0hrs 12hrs 0hrs 12hrs 0hrs<br />
April 3-4, 2006<br />
April 3-4, 2006<br />
figure 26: <strong>power</strong> output of <strong>offshore</strong> <strong>wind</strong> <strong>power</strong><br />
over three days FOR ONE WIND FARM, ALL WIND FARMS IN THE<br />
FRENCH EEZ (NORTH SEA ONLY) AND ACCUMULATED FOR ALL OFFSHORE<br />
WIND FARMS IN THE NORTH SEA<br />
figure 28: <strong>power</strong> output of <strong>offshore</strong> <strong>wind</strong> <strong>power</strong><br />
over three days FOR ONE WIND FARM, ALL WIND FARMS IN THE<br />
NORWEGIAN EEZ (NORTH SEA ONLY) AND ACCUMULATED FOR ALL<br />
OFFSHORE WIND FARMS IN THE NORTH SEA<br />
1,000<br />
a) France: 1,000 MW<br />
300<br />
a) Utsira: 300 MW<br />
0<br />
0<br />
1,000<br />
b) All <strong>offshore</strong> <strong>wind</strong> farms in the French North Sea: 1,000 MW<br />
1,290<br />
b) All <strong>offshore</strong> <strong>wind</strong> farms in the Norwegian North Sea: 1,290 MW<br />
Power(MW)<br />
0<br />
Power(MW)<br />
0<br />
68,400<br />
c) All <strong>offshore</strong> <strong>wind</strong> farms in the North Sea: 68.4 GW<br />
68,400<br />
c) All <strong>offshore</strong> <strong>wind</strong> farms in the North Sea: 68.4 GW<br />
0<br />
0hrs 12hrs 0hrs 12hrs 0hrs<br />
0<br />
0hrs 12hrs 0hrs 12hrs 0hrs<br />
April 3-4, 2006<br />
April 3-4, 2006<br />
34
image WINDTURBINES BEING<br />
CONSTRUCTED, GERMANY.<br />
© LANGROCK/ZENIT/GP<br />
annex b<br />
figure 29: load duration of <strong>offshore</strong> <strong>wind</strong> <strong>power</strong><br />
FOR ONE WIND FARM, ALL WIND FARMS IN THE DANISH EEZ (NORTH SEA<br />
ONLY) AND ACCUMULATED FOR ALL OFFSHORE WIND FARMS IN THE NORTH<br />
SEA; DATA FOR 2004-2006<br />
figure 31: load duration of <strong>offshore</strong> <strong>wind</strong> <strong>power</strong><br />
FOR ONE WIND FARM, ALL WIND FARMS IN THE DUTCH EEZ (NORTH SEA<br />
ONLY) AND ACCUMULATED FOR ALL OFFSHORE WIND FARMS IN THE NORTH<br />
SEA; DATA FOR 2004-2006<br />
360<br />
a) Horns Rev I+II: 360 MW<br />
246<br />
a) Ijmuiden: 246 MW<br />
0<br />
0<br />
1,577<br />
b) All <strong>offshore</strong> <strong>wind</strong> farms in the Danish North Sea: 1,577 MW<br />
12,039<br />
b) All <strong>offshore</strong> <strong>wind</strong> farms in the Netherlands: 12,039 MW<br />
Power(MW)<br />
0<br />
Power(MW)<br />
0<br />
68,400<br />
c) All <strong>offshore</strong> <strong>wind</strong> farms in the North Sea: 68.4 GW<br />
68,400<br />
c) All <strong>offshore</strong> <strong>wind</strong> farms in the North Sea: 68.4 GW<br />
0<br />
0 1,000 2,000 3,000 4,000 5,000 6,000 7,000 8,000<br />
0<br />
0 1,000 2,000 3,000 4,000 5,000 6,000 7,000 8,000<br />
Availability of Power [hours/year]<br />
Availability of Power [hours/year]<br />
figure 30: load duration of <strong>offshore</strong> <strong>wind</strong> <strong>power</strong><br />
FOR ONE WIND FARM, ALL WIND FARMS IN THE FRENCH EEZ (NORTH SEA<br />
ONLY) AND ACCUMULATED FOR ALL OFFSHORE WIND FARMS IN THE NORTH;<br />
DATA FOR 2004-2006<br />
figure 32: load duration of <strong>offshore</strong> <strong>wind</strong> <strong>power</strong><br />
FOR ONE WIND FARM, ALL WIND FARMS IN THE NORWEGIAN EEZ (NORTH SEA<br />
ONLY) AND ACCUMULATED FOR ALL OFFSHORE WIND FARMS IN THE NORTH SEA;<br />
DATA FOR 2004-2006<br />
1,000<br />
a) France: 1,000 MW<br />
300<br />
a) Utsira: 300 MW<br />
0<br />
0<br />
1,000<br />
b) All <strong>offshore</strong> <strong>wind</strong> farms in the French North Sea: 1,000 MW<br />
1,290<br />
b) All <strong>offshore</strong> <strong>wind</strong> farms in the Norwegian North Sea: 1,290 MW<br />
Power(MW)<br />
0<br />
Power(MW)<br />
0<br />
68,400<br />
c) All <strong>offshore</strong> <strong>wind</strong> farms in the North Sea: 68.4 GW<br />
68,400<br />
c) All <strong>offshore</strong> <strong>wind</strong> farms in the North Sea: 68.4 GW<br />
0<br />
0 1,000 2,000 3,000 4,000 5,000 6,000 7,000 8,000<br />
0<br />
0 1,000 2,000 3,000 4,000 5,000 6,000 7,000 8,000<br />
Availability of Power [hours/year]<br />
Availability of Power [hours/year]<br />
35
GLOBAL ENERGY [R]EVOLUTION<br />
A NORTH SEA ELECTRICITY GRID [R]EVOLUTION<br />
annex b<br />
figure 33: cumulative frequency of variations<br />
in hourly generation FOR ONE WIND FARM, ALL WIND FARMS IN<br />
THE DANISH EEZ AND ACCUMULATED FOR ALL OFFSHORE WIND FARMS IN<br />
THE NORTH SEA; LEGEND: TIME LAG<br />
figure 35: cumulative frequency of variations<br />
in hourly generation FOR ONE WIND FARM, ALL WIND FARMS IN<br />
THE DUTCH EEZ AND ACCUMULATED FOR ALL OFFSHORE WIND FARMS IN<br />
THE NORTH SEA; LEGEND: TIME LAG<br />
100<br />
50<br />
0<br />
-50<br />
-100<br />
a) Horns Rev I+II: 360 MW<br />
100<br />
50<br />
0<br />
-50<br />
-100<br />
a) Ijmuiden: 246 MW<br />
Power Variation (%)<br />
100<br />
50<br />
0<br />
-50<br />
-100<br />
b) All <strong>offshore</strong> <strong>wind</strong> farms in the Danish North Sea: 1,577 MW<br />
Power Variation (%)<br />
100<br />
50<br />
0<br />
-50<br />
-100<br />
b) All <strong>offshore</strong> <strong>wind</strong> farms in the Netherlands: 12,039 MW<br />
100<br />
50<br />
0<br />
-50<br />
-100<br />
c) All <strong>offshore</strong> <strong>wind</strong> farms in the North Sea: 68.4 GW<br />
0 10 20 30 40 50 60 70 80 90 100<br />
100<br />
50<br />
0<br />
-50<br />
-100<br />
c) All <strong>offshore</strong> <strong>wind</strong> farms in the North Sea: 68.4 GW<br />
0 10 20 30 40 50 60 70 80 90 100<br />
Cumulative Frequency of Power Variations (%)<br />
Cumulative Frequency of Power Variations (%)<br />
1 h 3 h 9 h 27 h<br />
1 h 3 h 9 h 27 h<br />
figure 34: cumulative frequency of variations<br />
in hourly generation FOR ONE WIND FARM, ALL WIND FARMS IN<br />
THE BELGIAN EEZ AND ACCUMULATED FOR ALL OFFSHORE WIND FARMS<br />
IN THE NORTH SEA; LEGEND: TIME LAG<br />
figure 36: cumulative frequency of variations<br />
in hourly generation FOR ONE WIND FARM, ALL WIND FARMS IN<br />
THE NORWEGIAN EEZ AND ACCUMULATED FOR ALL OFFSHORE WIND<br />
FARMS IN THE NORTH SEA; LEGEND: TIME LAG<br />
100<br />
50<br />
0<br />
-50<br />
-100<br />
a) France: 1,000 MW<br />
100<br />
50<br />
0<br />
-50<br />
-100<br />
a) Utsira: 300 MW<br />
Power Variation (%)<br />
100<br />
50<br />
0<br />
-50<br />
-100<br />
b) All <strong>offshore</strong> <strong>wind</strong> farms in the French North Sea: 1,000 MW<br />
Power Variation (%)<br />
100<br />
50<br />
0<br />
-50<br />
-100<br />
b) All <strong>offshore</strong> <strong>wind</strong> farms in the Norwegian North Sea: 1,290 MW<br />
100<br />
50<br />
0<br />
-50<br />
-100<br />
c) All <strong>offshore</strong> <strong>wind</strong> farms in the North Sea: 68.4 GW<br />
0 10 20 30 40 50 60 70 80 90 100<br />
100<br />
50<br />
0<br />
-50<br />
-100<br />
c) All <strong>offshore</strong> <strong>wind</strong> farms in the North Sea: 68.4 GW<br />
0 10 20 30 40 50 60 70 80 90 100<br />
Cumulative Frequency of Power Variations (%)<br />
Cumulative Frequency of Power Variations (%)<br />
1 h 3 h 9 h 27 h<br />
1 h 3 h 9 h 27 h<br />
36
image WINDFARM.<br />
© LANGROCK/ZENIT/GP<br />
annex c<br />
table 6: statistics of <strong>power</strong> variations in the different countries<br />
THE TABLE SHOWS THE MAXIMUM UPWARD AND DOWNWARD STEP SIZE OF THE ACCUMULATED POWER GENERATION<br />
THAT ALTOGETHER IS EXCEEDED IN 10% OF THE CASES. THE INDICATED VALUES ARE PERCENTILES P5 AND P95.<br />
POWER INCREASE EXCEEDED IN 5% OF THE CASES<br />
Power as % of installed capacity<br />
P5 value<br />
POWER DECREASE EXCEEDED IN 5% OF THE CASES<br />
P95 value<br />
Case A: Selected <strong>wind</strong> farms<br />
1h<br />
3h<br />
9h<br />
27h<br />
BE<br />
8.9%<br />
22.4%<br />
44.3%<br />
62.3%<br />
DE<br />
9.5%<br />
22.9%<br />
46.0%<br />
64.1%<br />
GB<br />
7.8%<br />
20.2%<br />
41.5%<br />
59.7%<br />
1h<br />
3h<br />
9h<br />
27h<br />
BE<br />
-8.5%<br />
-21.4%<br />
-42.7%<br />
-62.1%<br />
DE<br />
-9.1%<br />
-22.6%<br />
-44.7%<br />
-64.9%<br />
GB<br />
-7.2%<br />
-18.7%<br />
-39.7%<br />
-58.2%<br />
Case B: Accumulated generation per country<br />
1h<br />
3h<br />
9h<br />
27h<br />
BE<br />
8.5%<br />
22.2%<br />
44.7%<br />
62.9%<br />
DE<br />
6.9%<br />
18.5%<br />
40.3%<br />
60.3%<br />
GB<br />
5.1%<br />
14.2%<br />
33.1%<br />
53.2%<br />
1h<br />
3h<br />
9h<br />
27h<br />
BE<br />
-8.2%<br />
-20.9%<br />
-42.6%<br />
-62.3%<br />
DE<br />
-6.5%<br />
-17.9%<br />
-38.9%<br />
-60.1%<br />
GB<br />
-4.9%<br />
-13.7%<br />
-31.3%<br />
-52.1%<br />
Case C: Accumulated output of all <strong>wind</strong> farms in the North Sea<br />
ALL WIND FARMS<br />
1h<br />
4.1%<br />
3h<br />
11.5%<br />
9h<br />
26.9%<br />
27h<br />
46.2%<br />
1h<br />
3h<br />
9h<br />
27h<br />
ALL WIND FARMS<br />
-4.0%<br />
-11.1%<br />
-26.2%<br />
-45.5%<br />
37
GLOBAL ENERGY [R]EVOLUTION<br />
A NORTH SEA ELECTRICITY GRID [R]EVOLUTION<br />
38
© GP/SOLNESS<br />
image THE TROLL A OFFSHORE PLATFORM IN THE NORTH SEA WITH THE HVDC LIGHT MODULE IN PLACE.<br />
39
a north sea electricity grid<br />
[r]evolution<br />
© C-POWER<br />
<strong>Greenpeace</strong> is a global organisation that uses non-violent direct<br />
action to tackle the most crucial threats to our planet’s biodiversity<br />
and environment. <strong>Greenpeace</strong> is a non-profit organisation, present<br />
in 40 countries across Europe, the Americas, Asia and the Pacific.<br />
It speaks <strong>for</strong> 2.8 million supporters worldwide, and inspires many<br />
millions more to take action every day.To maintain its<br />
independence, <strong>Greenpeace</strong> does not accept donations from<br />
governments or corporations but relies on contributions from<br />
individual supporters and foundation grants.<br />
<strong>Greenpeace</strong> has been campaigning against environmental<br />
degradation since 1971 when a small boat of volunteers and<br />
journalists sailed into Amchitka, an area west of Alaska, where the<br />
US Government was conducting underground nuclear tests.This<br />
tradition of ‘bearing witness’ in a non-violent manner continues<br />
today, and ships are an important part of all its campaign work.<br />
greenpeace belgium<br />
Haachtsesteenweg 159, chaussée de Haecht<br />
1030 Brussels, Belgium<br />
t +32 2 274 0200 f +32 2 274 0230<br />
info@be.greenpeace.org<br />
www.greenpeace.org/belgium<br />
3E is an independent expert company specialized in renewable<br />
energy and energy efficiency.<br />
3E was established in 1999 as a spin-off company of the photovoltaics<br />
RD&D unit of IMEC - Europe’s leading research centre in the fields<br />
of micro- and nanoelectronics, and nanotechnology - and broadened<br />
its horizon thanks to the association of experts from the <strong>wind</strong> energy<br />
RD&D group of the Vrije Universiteit Brussels (Belgium). 3E has<br />
continued to attract highly qualified junior and senior experts from<br />
industry, public bodies and leading RD&D groups.They represent<br />
the foundation <strong>for</strong> its dynamic development.<br />
With a team of 50 experts and hundreds of references in over 25<br />
countries, 3E is recognised as a leading independent authority in<br />
renewable energy, energy efficiency and energy strategy. Its clients<br />
include major technology manufacturers, project developers, energy<br />
utilities, architectural offices, construction companies and maintenance<br />
teams, as well as regional and international public authorities.<br />
The company’s drive to invest in expertise and cultivate creativity<br />
<strong>power</strong>s its aspiration: Not facing but shaping the changes.<br />
3E<br />
Brussels, Paris,Toulouse, Beijing<br />
Rue du Canal 61 Vaartstraat, B-1000 Brussels, Belgium<br />
t +32 2 217 5868 f+32 2 219 7989<br />
info@3E.eu www.3E.eu<br />
image A WIND TURBINE BEING ASSEMBLED AT SEA.