MVP Evaluation Report Year 2 - Griffith University
MVP Evaluation Report Year 2 - Griffith University
MVP Evaluation Report Year 2 - Griffith University

Create successful ePaper yourself
Turn your PDF publications into a flip-book with our unique Google optimized e-Paper software.
2000 – 2 0 0 1 M V P E v a l u a t i o n R e p o r t<br />
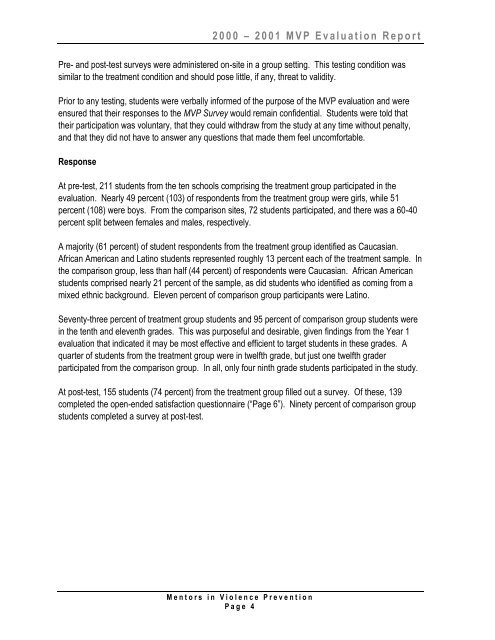
Pre- and post-test surveys were administered on-site in a group setting. This testing condition was<br />
similar to the treatment condition and should pose little, if any, threat to validity.<br />
Prior to any testing, students were verbally informed of the purpose of the <strong>MVP</strong> evaluation and were<br />
ensured that their responses to the <strong>MVP</strong> Survey would remain confidential. Students were told that<br />
their participation was voluntary, that they could withdraw from the study at any time without penalty,<br />
and that they did not have to answer any questions that made them feel uncomfortable.<br />
Response<br />
At pre-test, 211 students from the ten schools comprising the treatment group participated in the<br />
evaluation. Nearly 49 percent (103) of respondents from the treatment group were girls, while 51<br />
percent (108) were boys. From the comparison sites, 72 students participated, and there was a 60-40<br />
percent split between females and males, respectively.<br />
A majority (61 percent) of student respondents from the treatment group identified as Caucasian.<br />
African American and Latino students represented roughly 13 percent each of the treatment sample. In<br />
the comparison group, less than half (44 percent) of respondents were Caucasian. African American<br />
students comprised nearly 21 percent of the sample, as did students who identified as coming from a<br />
mixed ethnic background. Eleven percent of comparison group participants were Latino.<br />
Seventy-three percent of treatment group students and 95 percent of comparison group students were<br />
in the tenth and eleventh grades. This was purposeful and desirable, given findings from the <strong>Year</strong> 1<br />
evaluation that indicated it may be most effective and efficient to target students in these grades. A<br />
quarter of students from the treatment group were in twelfth grade, but just one twelfth grader<br />
participated from the comparison group. In all, only four ninth grade students participated in the study.<br />
At post-test, 155 students (74 percent) from the treatment group filled out a survey. Of these, 139<br />
completed the open-ended satisfaction questionnaire (“Page 6”). Ninety percent of comparison group<br />
students completed a survey at post-test.<br />
M e n t o r s i n V i o l e n c e P r e v e n t i o n<br />
P a g e 4