Read a PDF Sample of The Essential P/E - Harriman House
Read a PDF Sample of The Essential P/E - Harriman House
Read a PDF Sample of The Essential P/E - Harriman House
Create successful ePaper yourself
Turn your PDF publications into a flip-book with our unique Google optimized e-Paper software.
Index<br />
1
• • • • <strong>Sample</strong> • • • •
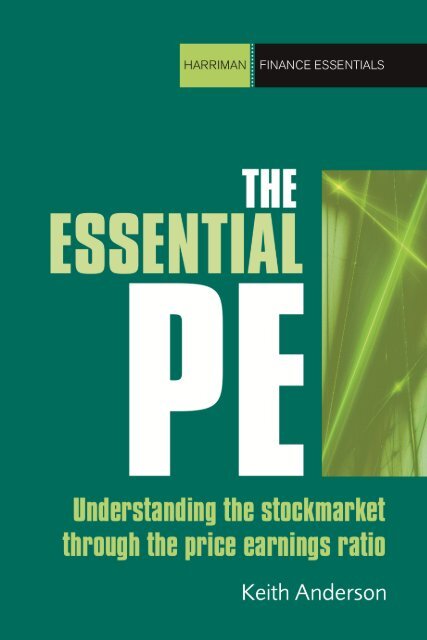
<strong>The</strong> <strong>Essential</strong> P/E<br />
Understanding the stock market through<br />
the price-earnings ratio<br />
by Keith Anderson<br />
Hh
HARRIMAN HOUSE LTD<br />
3A Penns Road<br />
Petersfield<br />
Hampshire<br />
GU32 2EW<br />
GREAT BRITAIN<br />
Tel: +44 (0)1730 233870<br />
Fax: +44 (0)1730 233880<br />
Email: enquiries@harriman-house.com<br />
Website: www.harriman-house.com<br />
First published in Great Britain in 2012<br />
Copyright © <strong>Harriman</strong> <strong>House</strong> Ltd<br />
<strong>The</strong> right <strong>of</strong> Keith Anderson to be identified as the author has been asserted in accordance with<br />
the Copyright, Designs and Patents Act 1988.<br />
978-0-85719-080-2<br />
British Library Cataloguing in Publication Data<br />
A CIP catalogue record for this book can be obtained from the British Library.<br />
All rights reserved; no part <strong>of</strong> this publication may be reproduced, stored in a retrieval system, or<br />
transmitted in any form or by any means, electronic, mechanical, photocopying, recording, or<br />
otherwise without the prior written permission <strong>of</strong> the Publisher. This book may not be lent, resold,<br />
hired out or otherwise disposed <strong>of</strong> by way <strong>of</strong> trade in any form <strong>of</strong> binding or cover other than<br />
that in which it is published without the prior written consent <strong>of</strong> the Publisher.<br />
Printed and bound in Great Britain by CPI, Antony Rowe.<br />
No responsibility for loss occasioned to any person or corporate body acting or refraining to act<br />
as a result <strong>of</strong> reading material in this book can be accepted by the Publisher, by the Author, or by<br />
the employer <strong>of</strong> the Author.<br />
Hh<br />
<strong>Harriman</strong> <strong>House</strong>
Contents<br />
Acknowledgements<br />
About the Author<br />
Foreword: Werner De Bondt<br />
Preface<br />
Introduction<br />
v<br />
vii<br />
ix<br />
xiii<br />
xv<br />
PART I: <strong>The</strong> P/E Calculation 1<br />
Chapter 1. History <strong>of</strong> the P/E 5<br />
Chapter 2. Earnings 11<br />
Chapter 3. <strong>The</strong> Price-Earnings Ratio (P/E) 19<br />
Chapter 4. Practical Calculation <strong>of</strong> EPS and the P/E from<br />
Company Accounts 27<br />
PART II: <strong>The</strong> Value Premium and the P/E 33<br />
Chapter 5. Value Investing 37<br />
Chapter 6. Efficient Markets and the CAPM 51<br />
Chapter 7. Accepting Reality: <strong>The</strong> Fama and French 3-Factor Model 63<br />
Chapter 8. Value Investors Fight Back 69<br />
PART III: Improving the P/E 75<br />
Chapter 9. Developing the P/E 79<br />
Chapter 10. <strong>The</strong> PEG Ratio 85<br />
Chapter 11. <strong>The</strong> Long-Term P/E 95<br />
Chapter 12. Decomposing the P/E 105<br />
Chapter 13. A Cautionary Tale: <strong>The</strong> Naked P/E 119<br />
Chapter 14. Have We Rescued the P/E? 129<br />
iii
<strong>The</strong> <strong>Essential</strong> P/E Keith Anderson<br />
PART IV: Beyond the P/E 133<br />
Chapter 15. Ben Graham: <strong>The</strong> P/E and the Margin <strong>of</strong> Safety 137<br />
Chapter 16. Joel Greenblatt: <strong>The</strong> P/E and Return on Capital 143<br />
Chapter 17. Joseph Piotroski: <strong>The</strong> P/E and the Fscore 149<br />
Conclusion 165<br />
Appendices 171<br />
FTSE 100 EPSs and P/Es 173<br />
Glossary 177<br />
References 187<br />
Index 191<br />
iv
Acknowledgements<br />
I would like to thank Richard Beddard for the huge contribution he made to earlier<br />
drafts <strong>of</strong> this book, and Stephen Eckett and Suzanne Anderson at <strong>Harriman</strong> <strong>House</strong><br />
for the original suggestion, their support and patience. Thanks also to Werner<br />
DeBondt for agreeing to write the foreword. Along with Ben Graham’s <strong>The</strong> Intelligent<br />
Investor and David Dreman’s books, his 1985 paper with Richard Thaler Does the<br />
Stock Market Overreact? convinced me early on that misvaluation can be rife, even<br />
in a mostly efficient market.<br />
v
About the Author<br />
After completing his BSc in Mathematical Statistics and Operational Research at<br />
Exeter, Keith Anderson worked for some years as a systems developer, most recently<br />
at Deutsche Bank in Frankfurt. He then did an MSc in Investment Analysis at<br />
Stirling, where he won the Morley Prize as the top academically in his year. For his<br />
PhD at the ICMA Centre, <strong>Read</strong>ing University, Keith showed that different ways <strong>of</strong><br />
calculating the price–earnings ratio could significantly improve investor returns.<br />
He worked as a lecturer at Durham University Business School for two years before<br />
moving to York in 2008.<br />
vii
Foreword: Werner De Bondt<br />
Hardly any topic in finance has been explored as much as the relationship between<br />
value and price. One way is to examine the ratio <strong>of</strong> the share price <strong>of</strong> a company to<br />
its annual earnings per share, called the P/E ratio. Data from several markets indicate<br />
that stocks with low P/E ratios (so-called value firms) earn significantly higher<br />
returns than high P/E stocks (i.e., growth or glamour companies). This book joins<br />
the discussion about why this happens.<br />
Many observers would agree that every so <strong>of</strong>ten investors go mad and that asset<br />
prices overshoot. Stock prices are regularly either too high or too low relative to what<br />
can be justified by business fundamentals (say, the company's earning power). <strong>The</strong><br />
breakdown occurs both at the market level and at the level <strong>of</strong> individual securities.<br />
<strong>The</strong> experience <strong>of</strong> the last few years leaves no doubt that speculative bubbles in<br />
equity, debt, real estate, and other markets may cause immense harm to the world<br />
economy. Irrational exuberance has proven to be extremely disruptive. Nonetheless,<br />
routine everyday mis-pricing in the cross-section <strong>of</strong> securities also <strong>of</strong>fers interesting<br />
pr<strong>of</strong>it opportunities for stock market investors.<br />
In this volume, Dr. Keith Anderson presents an expert summary <strong>of</strong> past research on<br />
P/E ratios and investment strategy. He also contributes to the existing literature in<br />
behavioral asset pricing with an array <strong>of</strong> statistical analyses that employ U.K. data.<br />
What’s more, Anderson’s book has practical use. He explains how traders can execute<br />
a winning P/E strategy.<br />
In my view, there is no reason to worry that the success <strong>of</strong> P/E investing will diminish<br />
over time. Still, traditional P/E ratios do have limits. Anderson makes clear how one<br />
can adjust P/E ratios and turn them into even more powerful predictors <strong>of</strong> future<br />
returns, while controlling for risk. I am certain that many readers will benefit from<br />
this insightful book. I admire what the author has accomplished.<br />
Anderson’s empirical analysis and practical advice extend a line <strong>of</strong> scientific<br />
investigation stretching back 80 years. For decades, it was thought that movements<br />
in stock prices are random. Paradoxically, most researchers interpreted the<br />
unpredictability <strong>of</strong> returns as pro<strong>of</strong> <strong>of</strong> the rationality <strong>of</strong> Wall Street. In an efficient<br />
market, prices must reflect all information quickly and accurately. If the hypothesis<br />
ix
<strong>The</strong> <strong>Essential</strong> P/E Keith Anderson<br />
is true, only news that takes people by surprise – and that is as likely to be positive<br />
as negative – can have an impact on prices.<br />
Even so, most amateur and pr<strong>of</strong>essional investors continued to study financial<br />
reports and relied on trading rules in hopes <strong>of</strong> attaining superior portfolio<br />
performance. Security Analysis, the investors’ bible co-authored by Benjamin<br />
Graham and David Dodd in 1934, spelled out some <strong>of</strong> the specific methods that<br />
could be used, including P/E ratios. Security Analysis sold nearly a million copies.<br />
Later, in 1949, Graham also published <strong>The</strong> Intelligent Investor, a more concise book<br />
that is still in print today and that reviews basic investment principles in a form<br />
suitable for laymen. It was <strong>The</strong> Intelligent Investor that introduced the P/E ratio to<br />
the public at large.<br />
For a long time, Graham and his followers were unable to convince the academic<br />
world to abandon its efficient markets dogma and rational worldview. 1 Since the late<br />
1970s, however, new statistical studies, meticulously executed, have found that there<br />
are definite patterns in stock prices and that price and value may drift apart. So, the<br />
efforts <strong>of</strong> investors do not have to be futile, as predicted by the theory <strong>of</strong> efficient<br />
markets. For instance, there are trends in equity returns after earnings<br />
announcements. Surely, the most prominent behavioral anomaly relative to the<br />
classical theory <strong>of</strong> finance is the P/E effect discussed here.<br />
<strong>The</strong> predictability in returns is connected to the remarkable volatility <strong>of</strong> market<br />
prices, itself linked to rapid surges and sudden stops in trading volume. Major<br />
fluctuations in stock prices usually go together with broadly anticipated changes in<br />
corporate earnings that may or may not be realized a few years later. Thus, P/Es are<br />
indicators <strong>of</strong> expected future earnings growth. Alas, too many people wrongly<br />
1 <strong>The</strong>re are some noteworthy exceptions. John Burr Williams argued in <strong>The</strong> <strong>The</strong>ory <strong>of</strong> Investment Value<br />
that security prices are based “too much on current earning power, too little on long-run dividend paying<br />
power” (1938, p. 19). Also with the boom <strong>of</strong> the 1920s and the later crash in mind, John Maynard Keynes<br />
noted in <strong>The</strong> General <strong>The</strong>ory that “day-to-day fluctuations in the pr<strong>of</strong>its <strong>of</strong> existing investments, which<br />
are obviously <strong>of</strong> an ephemeral and non-significant character, tend to have an altogether excessive, and<br />
even an absurd, influence on the market” (1936, pp. 153-154). Even earlier, William Stanley Jevons said<br />
that “as a general rule, it is foolish to do just what other people are doing, because there are almost sure<br />
to be too many people doing the same thing.”<br />
x
Foreword<br />
assume short-term events to be <strong>of</strong> great consequence for the long-term outlook <strong>of</strong><br />
individual firms and the economy as a whole. (Hence, the earnings forecasts <strong>of</strong><br />
financial analysts tend to be too extreme.) This extrapolative bias is perhaps the main<br />
cause <strong>of</strong> market overreaction. Regardless <strong>of</strong> their objective lack <strong>of</strong> information about<br />
what will happen tomorrow, traders have strong views just the same. In addition,<br />
investor sentiment and risk perception are closely tied to recent price movements.<br />
Thus, many traders fall into the trap <strong>of</strong> buying at market high-points (an observation<br />
that suggests overconfidence and recklessness) and selling at market low-points (an<br />
observation that suggests panic).<br />
When do exaggerated price movements reach their inevitable turning points? We<br />
do not know. Precise, well-timed forecasts are simply unattainable. Indeed, the<br />
upward or downward price momentum that is typically associated with growth and<br />
value stocks may well continue for some time. However, we do know that, once false<br />
beliefs about earnings, risk or the attitudes <strong>of</strong> other traders take hold, it usually takes<br />
a great deal <strong>of</strong> opposing news, unfolding over many months (say, a brutal string <strong>of</strong><br />
earnings surprises), to defeat crowd sentiment. Still, in the end, more <strong>of</strong>ten than not,<br />
prices do turn around, and diversified portfolios <strong>of</strong> low P/E stocks earn higher<br />
returns and expose investors to less risk than portfolios <strong>of</strong> high P/E stocks.<br />
It is a great challenge to try to improve one’s investment performance, and it is<br />
especially stressful to go against majority opinion, to be a contrarian investor – even<br />
if it pays to be contrary! This book <strong>of</strong>fers essential scientific reassurance, as well as<br />
practical tools, to triumph over misconceptions and behavioral errors that distort<br />
stock market prices. I recommend it to readers with great enthusiasm.<br />
Werner De Bondt<br />
Pr<strong>of</strong>essor and Director<br />
Richard H. Driehaus Center for Behavioral Finance<br />
DePaul University<br />
Chicago, Illinois<br />
U.S.A.<br />
xi
Preface<br />
Who is this book for?<br />
<strong>The</strong> book is primarily aimed at investors who already know something about investing<br />
in shares, but is also suitable for market pr<strong>of</strong>essionals and academics. Quite simply,<br />
readers should already know what a price–earnings ratio (P/E) is.<br />
If you are a private investor, rest assured that the book assumes no prior knowledge<br />
<strong>of</strong> any particular accounting or finance terms. Everything covered is defined at the<br />
time. For more detail, many terms, in particular accounting terms, are explained in<br />
the Glossary at the back. <strong>The</strong>re are however many new ideas presented, and beyond<br />
Part I even seasoned stock market investors will need to think hard.<br />
<strong>The</strong> book is also suitable for investment analysts, fund managers or finance<br />
academics. If you have a finance MSc or MBA then you may find some <strong>of</strong> the<br />
explanations over-simplified, but you will also learn much that is new. Using the P/E<br />
to get the best investment results is far from a simple task once you get into the<br />
details, and you should also find much <strong>of</strong> interest here.<br />
What does the book cover?<br />
<strong>The</strong> book starts with the basics: the fundamentals <strong>of</strong> share prices and how earnings<br />
and P/Es are calculated in the UK. I then look at the value premium, which is the<br />
whole basis <strong>of</strong> using the P/E as an investment tool: low P/E shares, on average,<br />
outperform the market. I cover some <strong>of</strong> the models that believers in efficient markets<br />
have come up with to try to explain this inconvenient fact, and why those who<br />
believe in pervasive mispricing remain unconvinced. This group <strong>of</strong> value investors<br />
includes such illustrious figures as Warren Buffett – as well as your author.<br />
<strong>The</strong> second half <strong>of</strong> the book gets into the details <strong>of</strong> the P/E: developments that have<br />
tried to improve it, and how some famous value investors have combined it with<br />
other measures. <strong>The</strong> P/E can be made into a powerful tool. But as with most<br />
powerful tools it can run amok if you don’t control it properly, check what it is telling<br />
you by looking at other statistics, and apply a liberal amount <strong>of</strong> common sense.<br />
xiii
<strong>The</strong> <strong>Essential</strong> P/E Keith Anderson<br />
Structure <strong>of</strong> the book<br />
Part I introduces the surprisingly short history <strong>of</strong> the P/E. <strong>The</strong>n, for the benefit <strong>of</strong><br />
the majority <strong>of</strong> readers who have not done an MSc in Investment Analysis, I go<br />
through in detail how earnings and then P/Es are calculated. I use motor manual<br />
publisher Haynes as the practical example throughout the book. <strong>The</strong>y are small<br />
enough to have reasonably straightforward accounts yet most readers should have<br />
heard <strong>of</strong> them.<br />
Part II covers the value premium and some famous investors who use it. I also look<br />
at efficient market theorists’ models <strong>of</strong> how returns on stocks can be explained, some<br />
<strong>of</strong> the objections to them, and the half-way house <strong>of</strong> the popular Fama and French<br />
three-factor model.<br />
Part III looks at some existing developments <strong>of</strong> the P/E such as the PEG ratio. I then<br />
go on to some <strong>of</strong> my PhD thesis work, since published as peer-reviewed academic<br />
papers and expanded and updated for this book. <strong>The</strong> P/E can be made into a much<br />
more powerful weapon in any investor’s armoury by applying a few relatively simple<br />
adjustments. However, the flawed results from the Naked P/E show the importance<br />
<strong>of</strong> taking into account other statistics beyond the P/E.<br />
This is demonstrated in Part IV, where I cover two famous value investors and how<br />
they have put the P/E to work with other statistics, so as to identify value shares <strong>of</strong><br />
reliable companies. <strong>The</strong> last chapter is some more original work, showing how you<br />
can combine the P/E with an as yet little known measure <strong>of</strong> a company’s financial<br />
stability to get outstanding and reliable investment results.<br />
xiv
Introduction<br />
Who needs a book on the P/E?<br />
In recent decades the P/E has been the most important and best-known investment<br />
ratio. Indeed, apart from the share price, it is the only investment statistic that is<br />
published in print every day. Every share quoted in London has its P/E printed daily<br />
in the Companies section <strong>of</strong> the Financial Times. <strong>The</strong> P/E also has a strong intuitive<br />
meaning: it tells you how many years’ worth <strong>of</strong> future earnings you are paying in<br />
order to buy the share now.<br />
One might ask why there hasn’t been a book before on the P/E.<br />
On the other hand, if you are a fund manager, the P/E or something based on it will<br />
be just one <strong>of</strong> the battery <strong>of</strong> ratios you use. You will have a filter <strong>of</strong> many different<br />
investment ratios that all <strong>of</strong> your investment universe must pass. <strong>The</strong> computer does<br />
the filtering for you, and presents you with a list <strong>of</strong> all the stocks that are interesting<br />
enough to be worth investigating further. <strong>The</strong> P/E is an integral but probably minor<br />
part <strong>of</strong> that process, and you would no more expect a book on the P/E than on ROCE<br />
or EBITDA.<br />
While the value to investors <strong>of</strong> being familiar with this widely used statistic is clear,<br />
pr<strong>of</strong>essionals in financial markets may find it a more surprising subject, possibly<br />
never having stopped to think how or why it is calculated that way. Such<br />
pr<strong>of</strong>essionals may well be surprised by how easily the P/E could be improved if things<br />
were done slightly differently.<br />
What’s interesting about the P/E?<br />
<strong>The</strong> P/E tells you how many years <strong>of</strong> future earnings you are willing to pay to own<br />
a company’s shares now.<br />
What more is there to tell?<br />
I first became interested in investing my own money in the stock market over ten<br />
years ago. Bored by a comfortable but limited existence at Deutsche Bank, I took a<br />
year out to do an MSc in Investment Analysis. While I was looking round for a<br />
xv
<strong>The</strong> <strong>Essential</strong> P/E Keith Anderson<br />
dissertation topic I read Graham and Dodd’s 1934 classic Security Analysis. One <strong>of</strong><br />
their suggestions was that you should not judge a company’s earnings potential over<br />
just the last year, but take a longer term view <strong>of</strong> 7-10 years to allow for fluctuations<br />
in the economy as a whole. This seemed such a common-sense suggestion, and yet<br />
after searching through dozens <strong>of</strong> academic papers, as far as I could tell no-one had<br />
thought to test Graham and Dodd’s assertion in the 70 years since. Being a new idea<br />
to the academic world the idea took a bit <strong>of</strong> explaining to my supervisor, but the<br />
results from the limited tests I was then able to do were promising.<br />
Since then I have gone on to do a PhD in how to improve the P/E ratio as a predictor<br />
<strong>of</strong> investor returns, some <strong>of</strong> which is updated and summarised here.<br />
<strong>The</strong> long-term P/E and decomposing the P/E are, I feel, surprisingly rich and<br />
complex stories. I have also taught much <strong>of</strong> this book’s contents to some thousands<br />
<strong>of</strong> undergraduate and Masters students at Durham University and the University <strong>of</strong><br />
York, a few <strong>of</strong> whom I hope have shared my enthusiasm.<br />
But the story <strong>of</strong> the P/E is not a dry academic investigation. It is a practical guide to<br />
how any stock market investor can put an improved P/E to use.<br />
<strong>The</strong> faults <strong>of</strong> the P/E<br />
Even a novice private investor should know that the P/E has some glaring faults. A<br />
low P/E may mean a company that has been marked down for no readily apparent<br />
reason, and thus an attractive value investment for those with the patience to wait<br />
while the market re-values it. However, the P/E is a backward-looking measure,<br />
based on one large number (sales last year) minus another large number (total costs<br />
last year). Just because the company earned £1 per share last year doesn’t necessarily<br />
mean it will earn anything like that for the foreseeable future. A low P/E can also<br />
easily mean a company that is deservedly cheap because it is in financial difficulty,<br />
and that it is likely to become cheaper yet or even go into administration.<br />
From a different point <strong>of</strong> view, in the world <strong>of</strong> academic finance the P/E has been<br />
largely forgotten as an investment ratio for researchers since the early 1990s. Its<br />
power to identify cheap shares that will perform was first shown in 1960, but in the<br />
last 15 years few papers have been written on it. <strong>The</strong> P/E has simply shown itself not<br />
to be as powerful an indicator <strong>of</strong> a value share as several other similar measures<br />
xvi
Introduction<br />
available. In particular the P/E was left out <strong>of</strong> Fama and French’s three-factor model<br />
<strong>of</strong> stock returns (which I cover in Part II). This model has, in the academic world at<br />
least, become the most popular way <strong>of</strong> explaining the returns that can be expected<br />
from holding the shares <strong>of</strong> various types <strong>of</strong> company.<br />
Putting right the faults in the P/E<br />
It is these failings that I seek to put right in Parts III and IV. Comparing a company’s<br />
share price to its earnings is still a major basis <strong>of</strong> analysis for many value investors,<br />
but the pitfalls are numerous. This book explains how the P/E’s weaknesses can be<br />
overcome.<br />
<strong>The</strong> short-term bias <strong>of</strong> the traditional P/E is easily overcome. <strong>The</strong> fact that the P/E<br />
is largely conditioned by the overall market P/E, the company’s size and the sector<br />
in which it operates, takes some rather more complicated adjustment but can still<br />
be done using freely available information. <strong>The</strong>se adjustments put in your hands a<br />
tool that is much more finely tuned to revealing shares that are good value.<br />
<strong>The</strong> other important thing the P/E does not tell you is whether a company is in<br />
trouble. As the history <strong>of</strong> the Naked P/E (explained later in the book) attests, building<br />
your portfolio on the basis <strong>of</strong> one statistic, however clever it may be, can lead to<br />
catastrophe during a market crash. Luckily, most <strong>of</strong> this risk can be avoided if you<br />
are prepared to step outside the P/E and use complementary statistics that steer you<br />
clear <strong>of</strong> the riskiest stocks. Combining the improved P/E with a measure <strong>of</strong> a<br />
company’s current financial strength provides a simple yet powerful filter. <strong>The</strong> final<br />
result is a set <strong>of</strong> stocks that are both underpriced in terms <strong>of</strong> their earnings power,<br />
and also solvent and likely to remain so.<br />
xvii
PART I<br />
<strong>The</strong> P/E Calculation
This Part starts with the story <strong>of</strong> how investors came to use the P/E. It has been in<br />
use for less than a century, but during that time it has become the most important<br />
investment ratio as far as practical investors are concerned.<br />
Chapter 2 looks at the more complicated component <strong>of</strong> the P/E: earnings. How the<br />
market decides share prices minute-by-minute is extremely complicated, but viewed<br />
from the level <strong>of</strong> the P/E calculation, the price used is quite straightforward.<br />
Earnings, however, are much more complex. <strong>The</strong>re are many possible definitions <strong>of</strong><br />
which parts <strong>of</strong> the pr<strong>of</strong>it and loss account are really ‘last year’s earnings’, and I cover<br />
them in detail here.<br />
Having defined earnings, the share price and then the price–earnings ratio itself are<br />
covered in the following chapter. As with earnings, there are several different ways<br />
<strong>of</strong> calculating the P/E.<br />
All the theory is brought to life in this Part’s final chapter, with a detailed example<br />
<strong>of</strong> how the P/E works in practice using Haynes Publishing’s annual report.<br />
3
Chapter 1<br />
History <strong>of</strong> the P/E<br />
<strong>The</strong> P/E ratio is today the most commonly used valuation metric in the world.<br />
Pr<strong>of</strong>. Janette Rutterford, Open University, 2004
<strong>The</strong> P/E has a long history, but it has not always been the most popular way to value<br />
shares. Since the invention <strong>of</strong> stock markets up until less than 100 years ago, the<br />
dividend yield (DY) was the main figure every investor was interested in. <strong>The</strong> asset<br />
backing behind a company was also important. <strong>The</strong> P/E is, compared to these two,<br />
a relatively recent invention. Even the phrase ‘price–earnings ratio’ only became<br />
popular in the 1920s in the US. In the UK dividends were still what mattered up<br />
until the mid-1960s.<br />
<strong>The</strong> world <strong>of</strong> investment to 1914: dividend yield is king<br />
For centuries, at least since the time <strong>of</strong> the South Sea Bubble in 1720, dividend yield<br />
(DY) was the main ratio investors used to value their stocks. This is simply the ratio<br />
<strong>of</strong> the dividends paid out last year to the price <strong>of</strong> the stock. So if a stock costing £1<br />
paid out 5p in dividends last year, the dividend yield <strong>of</strong> 5% compares favourably to<br />
the return available from a deposit account (in 2011), but <strong>of</strong> course involving the<br />
risk <strong>of</strong> capital loss should the share price fall.<br />
In the US, bond issues during the 1800s and early 1900s outweighed stock issues<br />
three to one. <strong>The</strong> stock market consisted largely <strong>of</strong> railway stocks, with utilities and<br />
then industrials only becoming more important by 1900. In these circumstances it<br />
is hardly surprising that dividend yield was the favoured method <strong>of</strong> deciding whether<br />
a stock was cheap or expensive, because dividend yield could be directly compared<br />
to the yield on a bond.<br />
In the UK, the stock market was more developed, even though the railway boom<br />
was equally active. One feature was how internationalised the stock market was: the<br />
majority <strong>of</strong> new issues was <strong>of</strong> foreign stocks and bonds. Another feature strange to<br />
a modern investor was the preponderance <strong>of</strong> debenture and preferred stocks. In a<br />
new issue from an established investment-grade company, these were <strong>of</strong>ten the only<br />
type <strong>of</strong> stock an investor could buy. <strong>The</strong> founders would keep control <strong>of</strong> the ordinary<br />
stock. It was speculative companies that issued ordinary shares.<br />
Even in the UK though, DY was the main statistic that investors were interested in.<br />
This could have been due to the limited information published in what we now call<br />
an IPO (Initial Public Offering) (this term is itself only about twenty years old). <strong>The</strong><br />
only information a purchaser <strong>of</strong> a new issue would likely get would be pr<strong>of</strong>its<br />
7
<strong>The</strong> <strong>Essential</strong> P/E Keith Anderson<br />
averaged over several years (to even out the ups and downs), money available to pay<br />
the ordinary dividend after paying the preferred shareholders, and the balance sheet.<br />
Given the limited information made public in those days, it is not surprising that a<br />
more sophisticated analysis <strong>of</strong> company earnings was not yet possible.<br />
<strong>The</strong> US in the 1920s: enter the P/E<br />
DY in the US maintained its hold until the mid-1920s. <strong>The</strong> P/E only really became<br />
popular during the boom years <strong>of</strong> the late 1920s. Earnings themselves had boomed<br />
since the Great War. People were more interested in earnings growing at 10% or 25%<br />
annually than dividends growing at 5%. Everyone believed that this long-term<br />
growth could be kept up indefinitely due to rapid technological change. US company<br />
accounts were also generally more informative than in the UK, so that investors in<br />
US companies could see what was happening to retained earnings. <strong>The</strong>y could<br />
appreciate the fact that the effect <strong>of</strong> compound interest on a company’s growing<br />
reserves would mean higher dividends and hence higher share prices in the future.<br />
Ben Graham and David Dodd could already comment in their 1934 classic Security<br />
Analysis:<br />
Common stocks have come to depend exclusively on the earnings exhibit.<br />
Catching up with the US<br />
Meanwhile, DY remained for decades the main valuation ratio in the UK. Earnings<br />
were overwhelmingly paid out as dividends, whereas in the US a significant<br />
proportion was held back as undistributed pr<strong>of</strong>its. UK corporate earnings had<br />
themselves not shown the long-term rapid growth that US companies had<br />
experienced, so the gap between the two valuation methods was not as marked.<br />
Relatively uninformative UK company accounts did not help: consolidated accounts<br />
(reporting the group’s overall position rather than individual companies within the<br />
group) were not compulsory until 1948, and even something as basic as turnover<br />
did not legally have to be disclosed until 1976. As a result you could find analysts in<br />
the same research note covering US stocks in an industry by looking mainly at their<br />
P/E, but the UK stocks in the same industry by mainly considering their DY.<br />
8
History <strong>of</strong> the P/E Chapter 1<br />
It was not until 1965 that UK investors really caught up with the US in their use <strong>of</strong><br />
valuation ratios. <strong>The</strong> introduction <strong>of</strong> corporation tax in that year meant that<br />
companies and individual shareholders were finally treated as separate taxable<br />
entities. Until then, companies had paid income tax on behalf <strong>of</strong> their investors, who<br />
might have to pay further tax depending on their level <strong>of</strong> income. Thus it was<br />
difficult to estimate company income after company taxes but before personal taxes.<br />
By 1966 <strong>The</strong> Economist was already valuing many UK companies using their P/Es.<br />
<strong>The</strong> P/E today<br />
Amongst practical investors the P/E has maintained its popularity since then.<br />
However, there are two areas in which the P/E has been eclipsed in recent years.<br />
Interest in it from finance academics has been limited since Eugene Fama and Ken<br />
French decided in the early 1990s that price-to-book value was a better indicator <strong>of</strong><br />
value stocks and dropped the P/E from their now widely popular three factor model.<br />
(See Chapter 7.)<br />
<strong>The</strong> other time the P/E has become little used has been during stock market bubbles.<br />
This is ironic considering that the P/E itself only came to prominence during the<br />
1920s’ boom in the US. Some extraordinary P/E ratios occurred during the dot.com<br />
mania: America Online reached a P/E <strong>of</strong> 275 and Yahoo a P/E <strong>of</strong> 1900.<br />
Extraordinary P/Es in the hundreds or thousands are telling investors that they are<br />
building castles in the sky, but during bubbles that is precisely the message that<br />
investors don’t want to hear.<br />
9
Chapter 2<br />
Earnings
Before we can cover the P/E itself, we should first define its more complicated<br />
component: earnings. This chapter covers the basics <strong>of</strong> the different ways in which<br />
earnings and then earnings per share (EPS) can be defined. I move downwards<br />
through the pr<strong>of</strong>it and loss account and discuss the different figures as more and<br />
more costs are deducted from pr<strong>of</strong>its. <strong>The</strong> discussion is purposely kept general here;<br />
for a practical example, see the later chapter on Haynes. I do not intend to give a<br />
detailed explanation <strong>of</strong> company accounts, as many other books do this; I cover only<br />
the components <strong>of</strong> the earnings calculation.<br />
From sales to operating pr<strong>of</strong>it<br />
<strong>The</strong> basics need little explanation.<br />
A company produces goods or services and sells them; the amount the company<br />
receives here is termed the sales (or turnover, or revenue). From this figure <strong>of</strong> sales<br />
we need first <strong>of</strong> all to deduct the cost <strong>of</strong> the items sold to calculate the gross pr<strong>of</strong>it.<br />
However, we have not yet reached the first figure that counts as earnings, because<br />
many expenses must be taken into account on top <strong>of</strong> raw materials, such as staff<br />
costs, IT, rent and so on. Other notional expenses, such as depreciation and<br />
amortisation, are also deducted. <strong>The</strong>se are not necessarily items that have caused us<br />
to actually spend any cash this year, but they need to be deducted regularly from<br />
gross pr<strong>of</strong>it in any case. Declared pr<strong>of</strong>its would be excessively variable if large<br />
occasional expenditures on capital items were recorded as they happened. <strong>The</strong>re is<br />
anyway a separate Consolidated Cash Flow statement.<br />
‘Earnings’ as a word on its own is in fact a rather ill-defined catch-all term for any<br />
<strong>of</strong> the pr<strong>of</strong>it figures we now cover. <strong>The</strong> initial figure for earnings is the difference<br />
between revenue and the total <strong>of</strong> these costs – basically all the costs <strong>of</strong> the company<br />
excluding finance charges and tax. This initial earnings figure is called operating<br />
pr<strong>of</strong>it.<br />
13
<strong>The</strong> <strong>Essential</strong> P/E Keith Anderson<br />
Towards the P/E’s earnings figure<br />
Operating pr<strong>of</strong>it is the highest figure up the pr<strong>of</strong>it and loss account that is referred<br />
to as ‘earnings’. However, there are two unavoidable costs <strong>of</strong> running a business that<br />
still remain to be taken out: interest paid to service loans, and tax. Subtracting<br />
interest paid gives pr<strong>of</strong>it before tax. Finally subtracting tax paid gives pr<strong>of</strong>it from<br />
continuing operations. (Details <strong>of</strong> any discontinued operations will appear in a<br />
separate column in the pr<strong>of</strong>it and loss account.)<br />
Now all the necessary deductions have been made to the pr<strong>of</strong>it, a ‘clean’ figure is<br />
available to distribute to shareholders or into the company reserves. It is this pr<strong>of</strong>it<br />
from continuing operations that is used in EPS calculations.<br />
EBIT and EBITDA<br />
<strong>The</strong>se ungainly acronyms have become increasingly popular in recent years. EBIT<br />
stands for earnings before interest and tax, and EBITDA for earnings before interest,<br />
tax, depreciation and amortisation. <strong>The</strong>re are times when they may legitimately be<br />
used. For example, EBITDA is <strong>of</strong>ten used in loan covenants, partly because the<br />
bondholders are not concerned about tax payments – interest payments are made<br />
before a company’s tax liability is calculated.<br />
However, it is hard to avoid the impression that EBIT and EBITDA have become so<br />
widely quoted because they make every company’s earnings look better. It is always<br />
a bad sign to come across a company proudly quoting its EBITDA in the first few<br />
pages <strong>of</strong> graphics in its annual report, instead <strong>of</strong> pr<strong>of</strong>it figures from further down<br />
the pr<strong>of</strong>it and loss account. Often a few seconds with a calculator will show that the<br />
company has little or no chance <strong>of</strong> ever making a real pr<strong>of</strong>it, because its amortisation<br />
charges more than wipe out the operating pr<strong>of</strong>it each year.<br />
EBIT and EBITDA have been memorably if unkindly described as “look how much<br />
we could have earned if we didn’t have to pay our bills”. Interest on loans and tax are<br />
unavoidable costs <strong>of</strong> running a business and really should be taken account <strong>of</strong>. If the<br />
company sourced its capital from shareholders, instead <strong>of</strong> borrowing the money,<br />
then it would presumably have to pay dividends instead <strong>of</strong> loan interest. Tax is sadly<br />
unavoidable for us all, and does at least help provide a safe legal framework in which<br />
14
Earnings Chapter 2<br />
the company can operate. Depreciation and amortisation are even more basic<br />
expenses that have already been subtracted before the operating income is reported.<br />
As Warren Buffett asked: “Does management think the tooth fairy pays for capital<br />
expenditures?” I do not use EBIT or EBITDA further here.<br />
Basic, diluted and adjusted EPS<br />
Having calculated earnings with all necessary costs taken out, we can now move<br />
from the company level to the per-share level. EPS is calculated by dividing pr<strong>of</strong>it<br />
from continuing operations by the number <strong>of</strong> shares in issue. This is basic EPS.<br />
However, the company may well have options grants outstanding to executives, and<br />
sometimes to employees too, which will vest if certain targets are attained. <strong>The</strong>se<br />
give a higher number <strong>of</strong> possible shares in the future. Dividing pr<strong>of</strong>it by the number<br />
<strong>of</strong> all the shares that exist now or might possibly vest gives diluted EPS.<br />
<strong>The</strong> figure <strong>of</strong>ten quoted in the financial press is adjusted EPS (also known as<br />
headline EPS). This uses earnings with exceptional items excluded – large, one-<strong>of</strong>f<br />
costs such as the expense <strong>of</strong> closing down an unpr<strong>of</strong>itable division. Unfortunately,<br />
the exact definition <strong>of</strong> what is classified as ‘exceptional’ varies by company – the<br />
company’s accountants have wide latitude over the accounting figures.<br />
Historical, rolling and forecast EPS<br />
Another possible dimension to the stated EPS figure is whether it is historical or<br />
forecast. Historical EPS is the simplest and is what has been covered above, i.e. the<br />
earnings stated in the company’s most recent annual report.<br />
Rolling EPS is based on the latest available earnings information. In the UK, if the<br />
six-monthly interim report has come out, the earnings from the first half <strong>of</strong> the<br />
annual report drop out and are replaced by these most recent earnings. US<br />
companies, and many large companies that are quoted in the US such as BP, declare<br />
results quarterly, so for them the rolling figure is the most recent four quarters. <strong>The</strong>se<br />
six-monthly or quarterly announcements are unaudited, so unlike the figures in the<br />
annual report they are subject to review.<br />
15
<strong>The</strong> <strong>Essential</strong> P/E Keith Anderson<br />
Forecast EPS does not come from the company, although they may provide<br />
guidance. It is the average <strong>of</strong> the earnings expected to be declared for the current<br />
accounting period, as forecast by the analysts who cover the company. For a large<br />
company in the FTSE 100 this will mean a dozen or more analysts’ forecasts being<br />
available at any one time.<br />
Since we are interested in the returns to be had from the company in the future, not<br />
the recent past, why do we not always use forecast EPS and forget about historic<br />
EPS? <strong>The</strong> major problem here is that forecast EPS will usually be quoted only if three<br />
or more analysts follow the company. Forecast earnings are thus available only for<br />
the few hundred largest UK companies – effectively, members <strong>of</strong> the FTSE-350 Index<br />
plus a few others. Of the roughly 1,300 trading companies quoted in London, there<br />
are hundreds with a market capitalisation <strong>of</strong> less than £50m. <strong>The</strong>se are unlikely to<br />
have even three analysts covering them, particularly if they are quoted on AIM. Such<br />
companies have no forecast earnings and thus no prospective P/E figure.<br />
Because <strong>of</strong> this limited coverage <strong>of</strong>fered by forecast earnings, academic research to<br />
back-test particular trading rules invariably uses historical EPS, not forecast EPS.<br />
(<strong>The</strong> fact that you have to pay for a higher DataStream subscription level to get the<br />
analysts’ forecasts, and few universities can afford to do so, may also be relevant!)<br />
Problems with earnings figures<br />
<strong>The</strong>re is a significant problem near the top <strong>of</strong> the pr<strong>of</strong>it and loss account. Operating<br />
income, being one large number (sales) minus another large number (costs), may<br />
be highly variable. Depending on the industry and business model, perfectly healthy<br />
companies may nevertheless have wafer-thin pr<strong>of</strong>it margins.<br />
For example, Inchcape import and distribute thousands <strong>of</strong> cars every year. Given<br />
the huge volume <strong>of</strong> metal moving through their distribution channels, a 1% or 2%<br />
pr<strong>of</strong>it margin is very healthy. However a small percentage change in either sales or<br />
costs leads to a very large change in the operating income. Forecasting earnings<br />
figures for such companies is therefore a particularly error-prone business. Forecast<br />
earnings depend acutely on the assumptions made about how gross sales and total<br />
costs will change in the future.<br />
16
Earnings Chapter 2<br />
Another sticking point when calculating earnings is that sales in any one year, and<br />
hence earnings, are easily manipulated. It was mentioned above that what is classified<br />
as an exceptional cost, and thus to be excluded from adjusted EPS, is a matter <strong>of</strong><br />
opinion. <strong>The</strong> company’s managers are likely to take a more liberal view <strong>of</strong> what costs<br />
are exceptional than a potential investor. Some large companies seem to need to<br />
close down an unpr<strong>of</strong>itable division or operations in some particular country every<br />
year, but they still book it as exceptional. When this seems to happen year after year,<br />
one is entitled to ask how exceptional it really is.<br />
A whole branch <strong>of</strong> academic finance literature exists on the manipulation <strong>of</strong> earnings<br />
and how it may be identified. <strong>The</strong> dividing line between current managers wanting<br />
to present their actions in as positive a light as possible, and fraud, is not necessarily<br />
easy to draw. Any investor who follows the market for any length <strong>of</strong> time will have<br />
read about scandals <strong>of</strong> companies booking sales before they are absolutely definite,<br />
so as to enhance the apparent performance <strong>of</strong> the sales managers responsible and<br />
thus their bonuses. A recent well-publicised case is Findel, who run Kleeneze among<br />
other businesses. In 2010 their educational supplies division was found to have been<br />
making “unsubstantiated accounting entries”. Earnings had to be restated, the shares<br />
<strong>of</strong> the Group fell precipitately and have not yet recovered.<br />
One final problem is the practical indeterminacy <strong>of</strong> EPS figures. Trying to pin down<br />
the precise basis <strong>of</strong> any particular basic, diluted, adjusted, forecast, rolling or<br />
historical EPS figure <strong>of</strong>fered you is a real can <strong>of</strong> worms. Three different financial<br />
data sources, such as DataStream, the Financial Times and Hemmington Scott’s<br />
Company REFS will likely provide three different figures for EPS. However closely<br />
you read the online help files, unless you work as one <strong>of</strong> their data analysts and are<br />
able to read the computer code you will probably never know what exactly they<br />
include and exclude in their EPS figure. Even when I have sat down with a copy <strong>of</strong><br />
an annual report and tried to work out exactly where an EPS figure came from, I<br />
have usually been unsuccessful. However, as long as you are using the same<br />
definition for all the companies you are considering investing in, it is unlikely to be<br />
a decisive factor.<br />
17
<strong>The</strong> <strong>Essential</strong> P/E<br />
Understanding the stock market through<br />
the price-earnings ratio<br />
Keith Anderson<br />
Available direct from <strong>Harriman</strong> <strong>House</strong> and all good booksellers. To order<br />
a copy <strong>of</strong> the print or ebook edition go to:<br />
www.harriman-house.com/essentialpe<br />
Paperback: 9780857190802<br />
eBook: 9780857192448


