Alg. 2 Chapter 5.1 - Beau Chene High School Home Page
Alg. 2 Chapter 5.1 - Beau Chene High School Home Page
Alg. 2 Chapter 5.1 - Beau Chene High School Home Page

Create successful ePaper yourself
Turn your PDF publications into a flip-book with our unique Google optimized e-Paper software.
<strong>5.1</strong><br />
Graphing Quadratic Functions<br />
What you should learn<br />
GOAL 1<br />
GRAPHING A QUADRATIC FUNCTION<br />
GOAL 1 Graph quadratic<br />
functions.<br />
GOAL 2 Use quadratic<br />
functions to solve real-life<br />
problems, such as finding<br />
comfortable temperatures<br />
in Example 5.<br />
Why you should learn it<br />
To model real-life objects,<br />
such as the cables of the<br />
Golden Gate Bridge in<br />
Example 6.<br />
REAL<br />
LIFE<br />
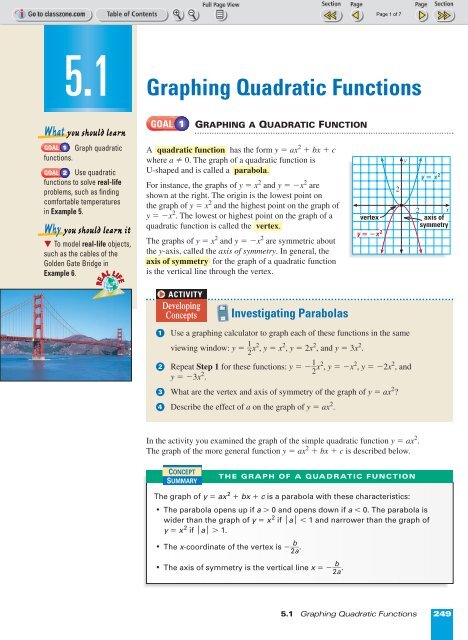
A quadratic function has the form y = ax 2 + bx + c<br />
where a ≠ 0. The graph of a quadratic function is<br />
U-shaped and is called a parabola.<br />
For instance, the graphs of y = x 2 and y = ºx 2 are<br />
shown at the right. The origin is the lowest point on<br />
the graph of y = x 2 and the highest point on the graph of<br />
y = ºx 2 . The lowest or highest point on the graph of a<br />
quadratic function is called the vertex.<br />
The graphs of y = x 2 and y = ºx 2 are symmetric about<br />
the y-axis, called the axis of symmetry. In general, the<br />
axis of symmetry for the graph of a quadratic function<br />
is the vertical line through the vertex.<br />
ACTIVITY<br />
Developing<br />
Concepts<br />
Investigating Parabolas<br />
vertex<br />
y x 2<br />
2<br />
y<br />
y x 2<br />
2 x<br />
axis of<br />
symmetry<br />
1<br />
2<br />
3<br />
4<br />
Use a graphing calculator to graph each of these functions in the same<br />
viewing window: y = 1 2 x2 , y = x 2 , y = 2x 2 , and y = 3x 2 .<br />
Repeat Step 1 for these functions: y = º 1 2 x2 , y = ºx 2 , y = º2x 2 , and<br />
y = º3x 2 .<br />
What are the vertex and axis of symmetry of the graph of y = ax 2 ?<br />
Describe the effect of a on the graph of y = ax 2 .<br />
In the activity you examined the graph of the simple quadratic function y = ax 2 .<br />
The graph of the more general function y = ax 2 + bx + c is described below.<br />
CONCEPT<br />
SUMMARY<br />
THE GRAPH OF A QUADRATIC FUNCTION<br />
The graph of y = ax 2 + bx + c is a parabola with these characteristics:<br />
• The parabola opens up if a > 0 and opens down if a < 0. The parabola is<br />
wider than the graph of y = x 2 if |a| < 1 and narrower than the graph of<br />
y = x 2 if |a| >1.<br />
• The x-coordinate of the vertex is º 2<br />
b<br />
a .<br />
• The axis of symmetry is the vertical line x = º 2<br />
b<br />
a .<br />
<strong>5.1</strong> Graphing Quadratic Functions 249
EXAMPLE 1<br />
Graphing a Quadratic Function<br />
Graph y = 2x 2 º 8x + 6.<br />
STUDENT HELP<br />
Skills Review<br />
For help with symmetry,<br />
see p. 919.<br />
SOLUTION<br />
Note that the coefficients for this function are a =2,<br />
b = º8, and c = 6. Since a > 0, the parabola opens up.<br />
Find and plot the vertex. The x-coordinate is:<br />
b<br />
x = º 2 a = º º 8<br />
= 2<br />
2(2)<br />
The y-coordinate is:<br />
y = 2(2) 2 º 8(2) + 6 = º2<br />
So, the vertex is (2, º2).<br />
Draw the axis of symmetry x =2.<br />
Plot two points on one side of the axis of symmetry, such as (1, 0) and (0, 6). Use<br />
symmetry to plot two more points, such as (3, 0) and (4, 6).<br />
Draw a parabola through the plotted points.<br />
. . . . . . . . . .<br />
y<br />
(0, 6) (4, 6)<br />
(1, 0)<br />
1<br />
(3, 0)<br />
(2, 2)<br />
x<br />
The quadratic function y = ax 2 + bx + c is written in<br />
useful forms for quadratic functions are given below.<br />
standard form.<br />
Two other<br />
VERTEX AND INTERCEPT FORMS OF A QUADRATIC FUNCTION<br />
FORM OF QUADRATIC FUNCTION<br />
CHARACTERISTICS OF GRAPH<br />
Vertex form: y = a(x º h) 2 + k The vertex is (h, k).<br />
The axis of symmetry is x = h.<br />
Intercept form: y = a(x º p)(x º q) The x-intercepts are p and q.<br />
The axis of symmetry is halfway<br />
between (p, 0) and (q, 0).<br />
For both forms, the graph opens up if a > 0 and opens down if a < 0.<br />
EXAMPLE 2<br />
Graphing a Quadratic Function in Vertex Form<br />
STUDENT HELP<br />
Look Back<br />
For help with graphing<br />
functions, see p. 123.<br />
Graph y = º 1 2 (x + 3)2 + 4.<br />
SOLUTION<br />
The function is in vertex form y = a(x º h) 2 + k<br />
(5, 2)<br />
(3, 4)<br />
4<br />
y<br />
(1, 2)<br />
where a = º 1 , h = º3, and k = 4. Since a < 0,<br />
2<br />
the parabola opens down. To graph the function, first plot<br />
the vertex (h, k) = (º3, 4). Draw the axis of symmetry<br />
x = º3 and plot two points on one side of it, such as<br />
(º1, 2) and (1, º4). Use symmetry to complete the graph.<br />
(7, 4)<br />
1 x<br />
(1, 4)<br />
250 <strong>Chapter</strong> 5 Quadratic Functions
EXAMPLE 3<br />
Graphing a Quadratic Function in Intercept Form<br />
Graph y = º(x + 2)(x º 4).<br />
SOLUTION<br />
The quadratic function is in intercept form<br />
y = a(x º p)(x º q) where a = º1, p = º2, and<br />
q = 4. The x-intercepts occur at (º2, 0) and (4, 0).<br />
The axis of symmetry lies halfway between these<br />
points, at x = 1. So, the x-coordinate of the vertex<br />
is x = 1 and the y-coordinate of the vertex is:<br />
y = º(1 + 2)(1 º 4) = 9<br />
The graph of the function is shown.<br />
. . . . . . . . . .<br />
y (1, 9)<br />
2<br />
1<br />
2<br />
4<br />
x<br />
STUDENT HELP<br />
Skills Review<br />
For help with multiplying<br />
algebraic expressions,<br />
see p. 937.<br />
You can change quadratic functions from intercept form or vertex form to standard<br />
form by multiplying algebraic expressions. One method for multiplying expressions<br />
containing two terms is FOIL. Using this method, you add the products of the First<br />
terms, the Outer terms, the Inner terms, and the Last terms. Here is an example:<br />
F O I L<br />
(x + 3)(x + 5) = x 2 + 5x + 3x + 15 = x 2 + 8x + 15<br />
Methods for changing from standard form to intercept form or vertex form will be<br />
discussed in Lessons 5.2 and 5.5.<br />
EXAMPLE 4<br />
Writing Quadratic Functions in Standard Form<br />
Write the quadratic function in standard form.<br />
a. y = º(x + 4)(x º9) b. y = 3(x º1) 2 + 8<br />
SOLUTION<br />
a. y = º(x + 4)(x º9) Write original function.<br />
= º(x 2 º9x + 4x º 36) Multiply using FOIL.<br />
= º(x 2 º5x º 36) Combine like terms.<br />
= ºx 2 +5x +36 Use distributive property.<br />
b. y = 3(x º1) 2 +8 Write original function.<br />
= 3(x º 1)(x º1)+8 Rewrite (x º 1) 2 .<br />
= 3(x 2 º x º x +1)+8 Multiply using FOIL.<br />
= 3(x 2 º2x +1)+8 Combine like terms.<br />
= 3x 2 º6x + 3 + 8 Use distributive property.<br />
= 3x 2 º6x + 11 Combine like terms.<br />
<strong>5.1</strong> Graphing Quadratic Functions 251
GOAL 2<br />
USING QUADRATIC FUNCTIONS IN REAL LIFE<br />
REAL<br />
LIFE<br />
EXAMPLE 5<br />
Using a Quadratic Model in Standard Form<br />
Temperature<br />
Researchers conducted an experiment to determine temperatures at which people feel<br />
comfortable. The percent y of test subjects who felt comfortable at temperature x<br />
(in degrees Fahrenheit) can be modeled by:<br />
y = º3.678x 2 + 527.3x º 18,807<br />
What temperature made the greatest percent of test subjects comfortable? At that<br />
temperature, what percent felt comfortable? Source: Design with Climate<br />
SOLUTION<br />
Since a = º3.678 is negative, the graph of the<br />
quadratic function opens down and the function has<br />
a maximum value. The maximum value occurs at:<br />
b<br />
x = º 2 a = º 527.3<br />
≈ 72<br />
2(º 3.678)<br />
The corresponding value of y is:<br />
y = º3.678(72) 2 + 527.3(72) º 18,807 ≈ 92<br />
The temperature that made the greatest percent of test subjects comfortable was<br />
about 72°F. At that temperature about 92% of the subjects felt comfortable.<br />
X=71.691489 Y=92.217379<br />
EXAMPLE 6<br />
Using a Quadratic Model in Vertex Form<br />
CIVIL ENGINEER<br />
Civil engineers<br />
design bridges, roads, buildings,<br />
and other structures.<br />
In 1996 civil engineers held<br />
about 196,000 jobs in the<br />
United States.<br />
CAREER LINK<br />
www.mcdougallittell.com<br />
REAL<br />
INTERNET<br />
LIFE<br />
FOCUS ON<br />
CAREERS<br />
CIVIL ENGINEERING The Golden Gate Bridge in San Francisco has two towers that<br />
rise 500 feet above the road and are connected by suspension cables as shown. Each<br />
cable forms a parabola with equation<br />
1<br />
y = (x º 2100) 89 60<br />
2 + 8<br />
where x and y are measured in feet.<br />
Source: Golden Gate Bridge, <strong>High</strong>way and<br />
Transportation District<br />
a. What is the distance d between<br />
the two towers?<br />
b. What is the height ¬ above the<br />
road of a cable at its lowest point?<br />
SOLUTION<br />
a. The vertex of the parabola is (2100, 8), so a cable’s lowest point is 2100 feet<br />
from the left tower shown above. Since the heights of the two towers are the<br />
same, the symmetry of the parabola implies that the vertex is also 2100 feet<br />
from the right tower. Therefore, the towers are d = 2(2100) = 4200 feet apart.<br />
b. The height ¬ above the road of a cable at its lowest point is the y-coordinate of<br />
the vertex. Since the vertex is (2100, 8), this height is ¬ = 8 feet.<br />
252 <strong>Chapter</strong> 5 Quadratic Functions
GUIDED PRACTICE<br />
Vocabulary Check ✓<br />
Concept Check ✓<br />
Skill Check ✓<br />
1. Complete this statement: The graph of a quadratic function is called a(n) ? .<br />
2. Does the graph of y = 3x 2 º x º 2 open up or down? Explain.<br />
3. Is y = º2(x º 5)(x º 8) in standard form, vertex form, or intercept form?<br />
Graph the quadratic function. Label the vertex and axis of symmetry.<br />
4. y = x 2 º4x +7 5. y = 2(x +1) 2 º4 6. y = º(x + 2)(x º1)<br />
7. y = º 1 3 x2 º2x º3 8. y = º 3 5 (x º4)2 +6 9. y = 5 x(x º3)<br />
2<br />
Write the quadratic function in standard form.<br />
10. y = (x + 1)(x +2) 11. y = º2(x + 4)(x º3) 12. y = 4(x º1) 2 +5<br />
13. y = º(x +2) 2 º7 14. y = º 1 2 (x º 6)(x º8) 15. y = 2 3 (x º9)2 º4<br />
16. SCIENCE CONNECTION The equation given in Example 5 is based on temperature<br />
preferences of both male and female test subjects. Researchers also analyzed data<br />
for males and females separately and obtained the equations below.<br />
Males: y = º4.290x 2 + 612.6x º 21,773<br />
Females: y = º6.224x 2 + 908.9x º 33,092<br />
What was the most comfortable temperature for the males? for the females?<br />
PRACTICE AND APPLICATIONS<br />
STUDENT HELP<br />
Extra Practice<br />
to help you master<br />
skills is on p. 945.<br />
MATCHING GRAPHS Match the quadratic function with its graph.<br />
17. y = (x + 2)(x º3) 18. y = º(x º3) 2 + 2 19. y = x 2 º6x +11<br />
A. y<br />
B. y<br />
C. y<br />
1<br />
1 x<br />
1<br />
3 x<br />
1<br />
1<br />
x<br />
STUDENT HELP<br />
HOMEWORK HELP<br />
Example 1: Exs. 17–25<br />
Example 2: Exs. 17–19,<br />
26–31<br />
Example 3: Exs. 17–19,<br />
32–37<br />
Example 4: Exs. 38–49<br />
Examples 5, 6: Exs. 51–54<br />
GRAPHING WITH STANDARD FORM Graph the quadratic function. Label the<br />
vertex and axis of symmetry.<br />
20. y = x 2 º2x º1 21. y = 2x 2 º12x + 19 22. y = ºx 2 +4x º2<br />
23. y = º3x 2 +5 24. y = 1 2 x2 +4x +5 25. y = º 1 6 x2 º x º3<br />
GRAPHING WITH VERTEX FORM Graph the quadratic function. Label the<br />
vertex and axis of symmetry.<br />
26. y = (x º1) 2 +2 27. y = º(x º2) 2 º1 28. y = º2(x +3) 2 º4<br />
29. y = 3(x +4) 2 +5 30. y = º 1 3 (x +1)2 +3 31. y = 5 (x º3)2<br />
4<br />
<strong>5.1</strong> Graphing Quadratic Functions 253
FOCUS ON<br />
APPLICATIONS<br />
GRAPHING WITH INTERCEPT FORM Graph the quadratic function. Label the<br />
vertex, axis of symmetry, and x-intercepts.<br />
32. y = (x º 2)(x º6) 33. y = 4(x + 1)(x º1) 34. y = º(x + 3)(x +5)<br />
35. y = 1 3 (x + 4)(x +1) 36. y = º1 (x º 3)(x +2) 37. y = º3x(x º2)<br />
2<br />
TORQUE, the focus<br />
of Ex. 51, is the<br />
“twisting force” produced<br />
by the crankshaft in a car’s<br />
engine. As torque increases,<br />
a car is able to accelerate<br />
more quickly.<br />
APPLICATION LINK<br />
www.mcdougallittell.com<br />
REAL<br />
INTERNET<br />
LIFE<br />
WRITING IN STANDARD FORM Write the quadratic function in standard form.<br />
38. y = (x + 5)(x +2) 39. y = º(x + 3)(x º4) 40. y = 2(x º 1)(x º6)<br />
41. y = º3(x º 7)(x +4) 42. y = (5x + 8)(4x + 1) 43. y = (x + 3) 2 + 2<br />
44. y = º(x º5) 2 + 11 45. y = º6(x º2) 2 º9 46. y = 8(x +7) 2 º20<br />
47. y = º(9x +2) 2 +4x 48. y = º 7 3 (x + 6)(x +3) 49. y = 1 2 (8x º1)2 º 2<br />
3 <br />
50. VISUAL THINKING In parts (a) and (b), use a graphing calculator to<br />
examine how b and c affect the graph of y = ax 2 + bx + c.<br />
a. Graph y = x 2 + c for c = º2, º1, 0, 1, and 2. Use the same viewing window<br />
for all the graphs. How do the graphs change as c increases?<br />
b. Graph y = x 2 + bx for b = º2, º1, 0, 1, and 2. Use the same viewing<br />
window for all the graphs. How do the graphs change as b increases?<br />
51. AUTOMOBILES The engine torque y (in foot-pounds) of one model<br />
of car is given by<br />
y = º3.75x 2 + 23.2x + 38.8<br />
where x is the speed of the engine (in thousands of revolutions per minute).<br />
Find the engine speed that maximizes torque. What is the maximum torque?<br />
52. SPORTS Although a football field appears to be flat, its surface is actually<br />
shaped like a parabola so that rain runs off to either side. The cross section of a<br />
field with synthetic turf can be modeled by<br />
y = º0.000234(x º 80) 2 +1.5<br />
where x and y are measured in feet. What is the<br />
field’s width? What is the maximum height of<br />
the field’s surface? Source: Boston College<br />
53. PHYSIOLOGY Scientists determined that the rate y (in calories per minute)<br />
at which you use energy while walking can be modeled by<br />
y = 0.00849(x º 90.2) 2 + 51.3,50 ≤ x ≤ 150<br />
where x is your walking speed (in meters per minute). Graph the function on the<br />
given domain. Describe how energy use changes as walking speed increases.<br />
What speed minimizes energy use? Source: Bioenergetics and Growth<br />
y<br />
surface of<br />
football field<br />
Not drawn to scale<br />
x<br />
STUDENT HELP<br />
HOMEWORK HELP<br />
Visit our Web site<br />
www.mcdougallittell.com<br />
for help with problem<br />
solving in Ex. 54.<br />
INTERNET<br />
54. BIOLOGY CONNECTION The woodland jumping<br />
mouse can hop surprisingly long distances given its<br />
small size. A relatively long hop can be modeled by<br />
y = º 2 x(x º6)<br />
9<br />
where x and y are measured in feet. How far can a<br />
woodland jumping mouse hop? How high can it hop?<br />
Source: University of Michigan Museum of Zoology<br />
y<br />
Not drawn to scale<br />
x<br />
254 <strong>Chapter</strong> 5 Quadratic Functions
Test<br />
Preparation<br />
★ Challenge<br />
EXTRA CHALLENGE<br />
www.mcdougallittell.com<br />
55. MULTI-STEP PROBLEM A kernel of popcorn contains water that expands<br />
when the kernel is heated, causing it to pop. The equations below give the<br />
“popping volume” y (in cubic centimeters per gram) of popcorn with moisture<br />
content x (as a percent of the popcorn’s weight). Source: Cereal Chemistry<br />
Hot-air popping: y = º0.761x 2 + 21.4x º 94.8<br />
Hot-oil popping: y = º0.652x 2 + 17.7x º 76.0<br />
a. For hot-air popping, what moisture content maximizes popping volume?<br />
What is the maximum volume?<br />
b. For hot-oil popping, what moisture content maximizes popping volume?<br />
What is the maximum volume?<br />
c. The moisture content of popcorn typically ranges from 8% to 18%. Graph<br />
the equations for hot-air and hot-oil popping on the interval 8 ≤ x ≤ 18.<br />
d. Writing Based on the graphs from part (c), what general statement can<br />
you make about the volume of popcorn produced from hot-air popping versus<br />
hot-oil popping for any moisture content in the interval 8 ≤ x ≤ 18?<br />
56. LOGICAL REASONING Write y = a(x º h) 2 + k and y = a(x º p)(x º q) in<br />
standard form. Knowing that the vertex of the graph of y = ax 2 + bx + c occurs<br />
at x = º 2<br />
ba , show that the vertex for y = a(x º h)2 + k occurs at x = h and that<br />
the vertex for y = a(x º p)(x º q) occurs at x = p + q<br />
.<br />
2<br />
MIXED REVIEW<br />
SOLVING LINEAR EQUATIONS Solve the equation. (Review 1.3 for 5.2)<br />
57. x º 2 = 0 58. 2x + 5 = 0 59. º4x º 7 = 21<br />
60. 3x + 9 = ºx + 1 61. 6(x + 8) = 18 62. 5(4x º 1) = 2(x + 3)<br />
63. 0.6x = 0.2x + 2.8 64. 7 x<br />
º 3 x<br />
= 1 1 5<br />
65. 1<br />
8 5 2<br />
x<br />
2<br />
+ 1 4 = x <br />
6<br />
º 2<br />
1 <br />
GRAPHING IN THREE DIMENSIONS Sketch the graph of the equation. Label<br />
the points where the graph crosses the x-, y-, and z-axes. (Review 3.5)<br />
66. x + y + z = 4 67. x + y +2z = 6 68. 3x +4y + z = 12<br />
69. 5x +5y +2z = 10 70. 2x + 7y + 3z = 42 71. x + 3y º3z = 9<br />
USING CRAMER’S RULE Use Cramer’s rule to solve the linear system.<br />
(Review 4.3)<br />
72. x + y = 1 73. 2x + y = 5 74. 7x º10y = º15<br />
º5x + y = 19 3x º4y = 2 x +2y = º9<br />
75. 5x +2y +2z = 4 76. x +3y + z = 5 77. 2x º3y º9z = 11<br />
3x + y º6z = º4 ºx + y + z = 7 6x + y º z = 45<br />
ºx º y º z = 1 2x º7y +5z = 28 9x º2y +4z = 56<br />
78. WEATHER In January, 1996, rain and melting snow caused the depth of the<br />
Susquehanna River in Pennsylvania to rise from 7 feet to 22 feet in 14 hours.<br />
Find the average rate of change in the depth during that time. (Review 2.2)<br />
<strong>5.1</strong> Graphing Quadratic Functions 255