Effects of Bio-Mos and Mycosorb feed supplementation on ... - IBNA
Effects of Bio-Mos and Mycosorb feed supplementation on ... - IBNA
Effects of Bio-Mos and Mycosorb feed supplementation on ... - IBNA

Create successful ePaper yourself
Turn your PDF publications into a flip-book with our unique Google optimized e-Paper software.
Haugh index was computed accorded to the formula which includes height <str<strong>on</strong>g>of</str<strong>on</strong>g> the<br />
dense albumen (h) <str<strong>on</strong>g>and</str<strong>on</strong>g> egg’s weight (G): U.H. = 100log (h-1,7 X G 0,37 + 7,57).<br />
Data c<strong>on</strong>cerning the entire amount <str<strong>on</strong>g>of</str<strong>on</strong>g> eggs produced the amount <str<strong>on</strong>g>of</str<strong>on</strong>g> broken,<br />
cracked, rough, pale or deformed eggs were recorded <strong>on</strong> a daily base.<br />
The experimental values were statistically processed <str<strong>on</strong>g>and</str<strong>on</strong>g> then the comparis<strong>on</strong>s<br />
between means were applied, using a single factor ANOVA algorithm, included<br />
within the MsExcel s<str<strong>on</strong>g>of</str<strong>on</strong>g>tware package.<br />
Results <str<strong>on</strong>g>and</str<strong>on</strong>g> discussi<strong>on</strong>s<br />
Producti<strong>on</strong> performances<br />
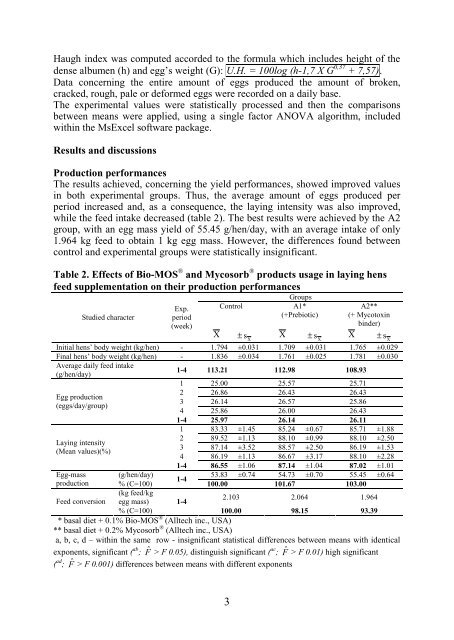
The results achieved, c<strong>on</strong>cerning the yield performances, showed improved values<br />
in both experimental groups. Thus, the average amount <str<strong>on</strong>g>of</str<strong>on</strong>g> eggs produced per<br />
period increased <str<strong>on</strong>g>and</str<strong>on</strong>g>, as a c<strong>on</strong>sequence, the laying intensity was also improved,<br />
while the <str<strong>on</strong>g>feed</str<strong>on</strong>g> intake decreased (table 2). The best results were achieved by the A2<br />
group, with an egg mass yield <str<strong>on</strong>g>of</str<strong>on</strong>g> 55.45 g/hen/day, with an average intake <str<strong>on</strong>g>of</str<strong>on</strong>g> <strong>on</strong>ly<br />
1.964 kg <str<strong>on</strong>g>feed</str<strong>on</strong>g> to obtain 1 kg egg mass. However, the differences found between<br />
c<strong>on</strong>trol <str<strong>on</strong>g>and</str<strong>on</strong>g> experimental groups were statistically insignificant.<br />
Table 2. <str<strong>on</strong>g>Effects</str<strong>on</strong>g> <str<strong>on</strong>g>of</str<strong>on</strong>g> <str<strong>on</strong>g>Bio</str<strong>on</strong>g>-MOS ® <str<strong>on</strong>g>and</str<strong>on</strong>g> <str<strong>on</strong>g>Mycosorb</str<strong>on</strong>g> ® products usage in laying hens<br />
<str<strong>on</strong>g>feed</str<strong>on</strong>g> <str<strong>on</strong>g>supplementati<strong>on</strong></str<strong>on</strong>g> <strong>on</strong> their producti<strong>on</strong> performances<br />
Studied character<br />
Exp.<br />
period<br />
(week)<br />
X<br />
C<strong>on</strong>trol<br />
Groups<br />
A1*<br />
(+Prebiotic)<br />
X<br />
A2**<br />
(+ Mycotoxin<br />
binder)<br />
X ± s X<br />
± s X<br />
± s X<br />
Initial hens’ body weight (kg/hen) - 1.794 ±0.031 1.709 ±0.031 1.765 ±0.029<br />
Final hens’ body weight (kg/hen) - 1.836 ±0.034 1.761 ±0.025 1.781 ±0.030<br />
Average daily <str<strong>on</strong>g>feed</str<strong>on</strong>g> intake<br />
(g/hen/day)<br />
Egg producti<strong>on</strong><br />
(eggs/day/group)<br />
Laying intensity<br />
(Mean values)(%)<br />
1-4 113.21 112.98 108.93<br />
1 25.00 25.57 25.71<br />
2 26.86 26.43 26.43<br />
3 26.14 26.57 25.86<br />
4 25.86 26.00 26.43<br />
1-4 25.97 26.14 26.11<br />
1 83.33 ±1.45 85.24 ±0.67 85.71 ±1.88<br />
2 89.52 ±1.13 88.10 ±0.99 88.10 ±2.50<br />
3 87.14 ±3.52 88.57 ±2.50 86.19 ±1.53<br />
4 86.19 ±1.13 86.67 ±3.17 88.10 ±2.28<br />
1-4 86.55 ±1.06 87.14 ±1.04 87.02 ±1.01<br />
Egg-mass (g/hen/day) 53.83 ±0.74 54.73 ±0.70 55.45 ±0.64<br />
1-4<br />
producti<strong>on</strong> % (C=100)<br />
100.00 101.67 103.00<br />
(kg <str<strong>on</strong>g>feed</str<strong>on</strong>g>/kg<br />
2.103 2.064 1.964<br />
Feed c<strong>on</strong>versi<strong>on</strong> egg mass) 1-4<br />
% (C=100)<br />
100.00 98.15 93.39<br />
* basal diet + 0.1% <str<strong>on</strong>g>Bio</str<strong>on</strong>g>-MOS ® (Alltech inc., USA)<br />
** basal diet + 0.2% <str<strong>on</strong>g>Mycosorb</str<strong>on</strong>g> ® (Alltech inc., USA)<br />
a, b, c, d – within the same row - insignificant statistical differences between means with identical<br />
exp<strong>on</strong>ents, significant ( ab ; Fˆ > F 0.05), distinguish significant ( ac ; Fˆ > F 0.01) high significant<br />
( ad ; Fˆ > F 0.001) differences between means with different exp<strong>on</strong>ents<br />
3
![( ) ( ) [ ] ( ) ( ) ( ) ( ) [ ]n ( ) ( ) [ ]n](https://img.yumpu.com/22443310/1/184x260/-n-n.jpg?quality=85)