The Digital Opportunity Index (DOI) - ITU
The Digital Opportunity Index (DOI) - ITU
The Digital Opportunity Index (DOI) - ITU

You also want an ePaper? Increase the reach of your titles
YUMPU automatically turns print PDFs into web optimized ePapers that Google loves.
Statistical Chapter Three Annex<br />
chapter three<br />
<strong>The</strong> <strong>Digital</strong><br />
<strong>Opportunity</strong> <strong>Index</strong><br />
(<strong>DOI</strong>)<br />
34
3.1 Using the <strong>Digital</strong><br />
<strong>Opportunity</strong> <strong>Index</strong> (<strong>DOI</strong>)<br />
<strong>The</strong> <strong>Digital</strong> <strong>Opportunity</strong> <strong>Index</strong> (<strong>DOI</strong>) has been<br />
designed to as a tool for tracking progress in<br />
bridging the digital divide and the implementation<br />
of the outcomes of the World Summit on the<br />
Information Society (WSIS). As such, it provides<br />
a powerful policy tool for exploring the global<br />
and regional trends in infrastructure, opportunity<br />
and usage that are shaping the Information<br />
Society. 1 As explained in Chapter one, the <strong>DOI</strong> is<br />
one of two tools adopted by WSIS as part of an<br />
agreed implementation methodology. It has a<br />
focus on the adoption of new technologies, such<br />
as broadband and mobile Internet. A time series<br />
has been developed to monitor implementation<br />
of WSIS targets since the first phase of WSIS and<br />
will continue until the WSIS review in 2015 (see<br />
Data Table 3). 2 <strong>The</strong> <strong>DOI</strong> thus complements the<br />
other WSIS-endorsed composite index—the ICT<br />
<strong>Opportunity</strong> <strong>Index</strong>—which has a stronger focus<br />
on traditional ICTs, such as fixed-lines and televisions,<br />
as well as on measures of literacy and educational<br />
achievement. 3<br />
This chapter explores key trends in the Information<br />
Society. Section 3.2 explains the structure of the<br />
<strong>DOI</strong> and indicators that are used to assess digital<br />
opportunity. Section 3.3 examines the latest<br />
<strong>DOI</strong> scores and rankings, for 2005/06. Section 3.4<br />
reviews trends in the <strong>DOI</strong> over time. Section 3.5<br />
uses the <strong>DOI</strong> to examine the key trends shaping<br />
the Information Society. It shows that many parts<br />
of the developing world are making strong gains<br />
in mobile telephony. By the end of 2008, over half<br />
the world’s population should have access to a<br />
mobile phone. Meanwhile, however, developed<br />
countries are forging ahead with new technologies<br />
and ever-faster access. As shown in Chapter<br />
two, the digital divide is changing from inequalities<br />
in basic availability of ICTs to differences in the<br />
quality of the user experience. Policy-makers need<br />
to adjust their policy responses to take account of<br />
“quality”, not just the “quantity” of access to ICTs.<br />
3.2 Structure of the <strong>DOI</strong><br />
<strong>The</strong> <strong>DOI</strong> is a composite index comprising eleven<br />
separate indicators, grouped in three clusters<br />
of <strong>Opportunity</strong>, Infrastructure and Utilization<br />
(Figure 3.1d). 4 <strong>The</strong> choice of indicators is notable, as:<br />
» <strong>The</strong> <strong>DOI</strong> includes price data for mobile<br />
telephony and Internet access relative to local<br />
incomes to reflect the affordability of ICTs and<br />
whether consumers can pay for mobile phone<br />
or Internet access in different countries. <strong>The</strong><br />
<strong>DOI</strong> is the only index to date that includes<br />
price data for 181 economies, which is vital in<br />
assessing effective market demand.<br />
» <strong>The</strong> <strong>DOI</strong> uses household penetrations (rather<br />
than per capita penetrations) for fixed lines,<br />
Personal Computers (PCs) and Internet access,<br />
as access to ICTs often begins in the home.<br />
Household penetration is appropriate for<br />
fixed lines, as they are provided on a household<br />
basis, while home access to the Internet<br />
is significant in many countries (Figure 3.7).<br />
Using household penetrations reflects more<br />
accurately the true state of access to ICTs in<br />
developing countries, where average family<br />
size is larger, so per capita penetrations<br />
appear artificially suppressed and are lower.<br />
» <strong>The</strong> <strong>DOI</strong> includes measures of more advanced<br />
technologies in broadband access (for both<br />
fixed broadband access and mobile broadband<br />
or 3G). This means that the <strong>DOI</strong> can<br />
reflect the startling growth in these markets.<br />
It can also be used to assess market maturity,<br />
in the proportion of Internet and mobile subscriptions<br />
that have migrated to high-speed<br />
broadband access (see Figure 3.4 on the “New<br />
Substitution”).<br />
Indicators in various data series are standardized<br />
on a scale of zero to one, by indexing relative to a<br />
reference value (data series and reference values<br />
are given in the Annex to this Chapter). For most<br />
indicators, this is 100 per cent, making the <strong>DOI</strong><br />
simple and straightforward to calculate (simply<br />
dividing the indicator value by 100). <strong>Index</strong> scores<br />
in the three clusters are then averaged by simple<br />
average to give the overall <strong>DOI</strong> score for a country,<br />
between zero and one (no country achieves the<br />
upper or lower limit scores). Scores are directly<br />
comparable between countries and between<br />
years.<br />
<strong>The</strong> results are remarkably straightforward and<br />
easy to use. Access to and the affordability of ICTs<br />
is condensed into a single index number between<br />
one and zero, permitting comparison of countries’<br />
scores in any one year, as well as over time. A time<br />
series has been established, stretching back to the<br />
start of the WSIS process in 2000/01. This Report<br />
presents the latest results for the <strong>DOI</strong> 2006 (Data<br />
Table 1 in the Statistical Annex). As explored in<br />
the next section, results for the <strong>DOI</strong> show strong<br />
gains in digital opportunity around the world.<br />
World Information Society Report 2007<br />
35
Statistical Chapter Three Annex<br />
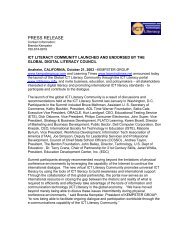
Figure 3.1a: <strong>Digital</strong> <strong>Opportunity</strong> <strong>Index</strong> 2005/06 – World<br />
Economy Rank <strong>DOI</strong> score<br />
Korea (Rep.)<br />
Japan<br />
Denmark<br />
Iceland<br />
Singapore<br />
Netherlands<br />
Taiwan, China<br />
Hong Kong, China<br />
Sweden<br />
United Kingdom<br />
Finland<br />
Norway<br />
Luxembourg<br />
Israel<br />
Macao, China<br />
Switzerland<br />
Canada<br />
Austria<br />
Germany<br />
United States<br />
Spain<br />
Australia<br />
Belgium<br />
Estonia<br />
New Zealand<br />
France<br />
Barbados<br />
Italy<br />
Bahamas<br />
Slovenia<br />
Ireland<br />
Portugal<br />
Lithuania<br />
Malta<br />
Bahrain<br />
Hungary<br />
United Arab Emirates<br />
Qatar<br />
Cyprus<br />
Antigua & Barbuda<br />
Chile<br />
Czech Republic<br />
Brunei Darussalam<br />
Slovak Republic<br />
St. Kitts & Nevis<br />
Latvia<br />
Bulgaria<br />
Croatia<br />
Greece<br />
Romania<br />
Russia<br />
Turkey<br />
Poland<br />
Argentina<br />
Jamaica<br />
Dominica<br />
Malaysia<br />
Mauritius<br />
Trinidad & Tobago<br />
Kuwait<br />
1<br />
2<br />
3<br />
4<br />
5<br />
6<br />
7<br />
8<br />
9<br />
10<br />
11<br />
12<br />
13<br />
14<br />
15<br />
16<br />
17<br />
18<br />
19<br />
20<br />
21<br />
22<br />
23<br />
24<br />
25<br />
26<br />
27<br />
28<br />
29<br />
30<br />
31<br />
32<br />
33<br />
34<br />
35<br />
36<br />
37<br />
38<br />
39<br />
40<br />
41<br />
42<br />
43<br />
44<br />
45<br />
46<br />
47<br />
48<br />
49<br />
50<br />
51<br />
52<br />
53<br />
54<br />
55<br />
56<br />
57<br />
58<br />
59<br />
60<br />
0.80<br />
0.77<br />
0.76<br />
0.74<br />
0.72<br />
0.71<br />
0.71<br />
0.70<br />
0.70<br />
0.69<br />
0.69<br />
0.69<br />
0.69<br />
0.69<br />
0.69<br />
0.69<br />
0.67<br />
0.67<br />
0.66<br />
0.66<br />
0.65<br />
0.65<br />
0.65<br />
0.65<br />
0.65<br />
0.64<br />
0.64<br />
0.63<br />
0.63<br />
0.62<br />
0.61<br />
0.61<br />
0.61<br />
0.60<br />
0.60<br />
0.59<br />
0.59<br />
0.58<br />
0.57<br />
0.57<br />
0.57<br />
0.57<br />
0.56<br />
0.55<br />
0.54<br />
0.54<br />
0.54<br />
0.53<br />
0.53<br />
0.52<br />
0.52<br />
0.52<br />
0.51<br />
0.51<br />
0.51<br />
0.51<br />
0.50<br />
0.50<br />
0.50<br />
0.50<br />
Notes: 1) Figures 3.1a, b and c use different scales. 2) Higher score means better digital opportunity.<br />
<strong>Opportunity</strong> Infrastructure Use<br />
Source: <strong>ITU</strong>/UNCTAD/KADO <strong>Digital</strong> <strong>Opportunity</strong> Platform.<br />
0 0.10 0.20 0.30 0.40 0.50 0.60 0.70 0.80 0.90<br />
36
Figure 3.1b: <strong>Digital</strong> <strong>Opportunity</strong> <strong>Index</strong> 2005/06 – World<br />
Economy Rank <strong>DOI</strong> score<br />
Montenegro<br />
Seychelles<br />
Uruguay<br />
Bosnia<br />
Brazil<br />
Mexico<br />
Macedonia<br />
Morocco<br />
St. Vincent<br />
Serbia<br />
Grenada<br />
Maldives<br />
St. Lucia<br />
Costa Rica<br />
Saudi Arabia<br />
Venezuela<br />
China<br />
Belarus<br />
Jordan<br />
Colombia<br />
Oman<br />
Thailand<br />
Algeria<br />
Belize<br />
Dominican Republic<br />
South Africa<br />
Tunisia<br />
Georgia<br />
Panama<br />
Ukraine<br />
Egypt<br />
Tonga<br />
Lebanon<br />
Kazakhstan<br />
El Salvador<br />
Peru<br />
Ecuador<br />
Palestine<br />
Fiji<br />
Botswana<br />
Azerbaijan<br />
Philippines<br />
Gabon<br />
Syria<br />
Iran<br />
Senegal<br />
Albania<br />
Guatemala<br />
Libya<br />
Suriname<br />
Moldova<br />
Paraguay<br />
Namibia<br />
Sri Lanka<br />
Cape Verde<br />
Indonesia<br />
Armenia<br />
Guyana<br />
Bolivia<br />
Swaziland<br />
61<br />
62<br />
63<br />
64<br />
65<br />
66<br />
67<br />
68<br />
69<br />
70<br />
71<br />
72<br />
73<br />
74<br />
75<br />
76<br />
77<br />
78<br />
79<br />
80<br />
81<br />
82<br />
83<br />
84<br />
85<br />
86<br />
87<br />
88<br />
89<br />
90<br />
91<br />
92<br />
93<br />
94<br />
95<br />
96<br />
97<br />
98<br />
99<br />
100<br />
101<br />
102<br />
103<br />
104<br />
105<br />
106<br />
107<br />
108<br />
109<br />
110<br />
111<br />
112<br />
113<br />
114<br />
115<br />
116<br />
117<br />
118<br />
119<br />
120<br />
0.49<br />
0.48<br />
0.48<br />
0.48<br />
0.48<br />
0.47<br />
0.47<br />
0.47<br />
0.47<br />
0.47<br />
0.47<br />
0.46<br />
0.46<br />
0.46<br />
0.46<br />
0.46<br />
0.45<br />
0.45<br />
0.45<br />
0.45<br />
0.44<br />
0.43<br />
0.42<br />
0.42<br />
0.42<br />
0.42<br />
0.41<br />
0.41<br />
0.41<br />
0.41<br />
0.41<br />
0.41<br />
0.40<br />
0.40<br />
0.40<br />
0.40<br />
0.40<br />
0.40<br />
0.39<br />
0.38<br />
0.38<br />
0.38<br />
0.37<br />
0.37<br />
0.37<br />
0.37<br />
0.37<br />
0.37<br />
0.36<br />
0.36<br />
0.35<br />
0.35<br />
0.35<br />
0.35<br />
0.34<br />
0.34<br />
0.33<br />
0.33<br />
0.33<br />
0.32<br />
0 0.10 0.20 0.30 0.40 0.50 0.60<br />
Notes: 1) Figures 3.1a, b and c use different scales. 2) Higher score means better digital opportunity.<br />
<strong>Opportunity</strong> Infrastructure Use<br />
Source: <strong>ITU</strong>/UNCTAD/KADO <strong>Digital</strong> <strong>Opportunity</strong> Platform.<br />
World Information Society Report 2007<br />
37
Statistical Chapter Three Annex<br />
Figure 3.1c: <strong>Digital</strong> <strong>Opportunity</strong> <strong>Index</strong> 2005/06 – World<br />
Economy Rank <strong>DOI</strong> score<br />
Mongolia<br />
Nicaragua<br />
Uzbekistan<br />
India<br />
Samoa<br />
Vietnam<br />
Pakistan<br />
Yemen<br />
Cuba<br />
Honduras<br />
Equatorial Guinea<br />
Djibouti<br />
Lesotho<br />
Bangladesh<br />
Kyrgyzstan<br />
Sudan<br />
Cameroon<br />
Angola<br />
Turkmenistan<br />
Bhutan<br />
Vanuatu<br />
Ghana<br />
Tajikistan<br />
Gambia<br />
Côte d'Ivoire<br />
Benin<br />
Nepal<br />
Papua New Guinea<br />
Cambodia<br />
Lao PDR<br />
Togo<br />
Congo<br />
Kenya<br />
Mauritania<br />
Nigeria<br />
Comoros<br />
Zimbabwe<br />
Uganda<br />
S. Tomé & Principe<br />
Haiti<br />
Guinea<br />
Tanzania<br />
Zambia<br />
Rwanda<br />
Burkina Faso<br />
Solomon Islands<br />
Madagascar<br />
Mozambique<br />
Mali<br />
Timor-Leste<br />
Sierra Leone<br />
Ethiopia<br />
Burundi<br />
Central African Rep.<br />
Malawi<br />
Congo, D.R.<br />
Eritrea<br />
Guinea-Bissau<br />
Myanmar<br />
Chad<br />
Niger<br />
121<br />
122<br />
123<br />
124<br />
125<br />
126<br />
127<br />
128<br />
129<br />
130<br />
131<br />
132<br />
133<br />
134<br />
135<br />
136<br />
137<br />
138<br />
139<br />
140<br />
141<br />
142<br />
143<br />
144<br />
145<br />
146<br />
147<br />
148<br />
149<br />
150<br />
151<br />
152<br />
153<br />
154<br />
155<br />
156<br />
157<br />
158<br />
159<br />
160<br />
161<br />
162<br />
163<br />
164<br />
165<br />
166<br />
167<br />
168<br />
169<br />
170<br />
171<br />
172<br />
173<br />
174<br />
175<br />
176<br />
177<br />
178<br />
179<br />
180<br />
181<br />
0.32<br />
0.31<br />
0.31<br />
0.31<br />
0.29<br />
0.29<br />
0.29<br />
0.28<br />
0.28<br />
0.27<br />
0.27<br />
0.26<br />
0.26<br />
0.25<br />
0.25<br />
0.24<br />
0.24<br />
0.23<br />
0.22<br />
0.22<br />
0.21<br />
0.21<br />
0.21<br />
0.21<br />
0.20<br />
0.19<br />
0.19<br />
0.19<br />
0.18<br />
0.18<br />
0.17<br />
0.17<br />
0.17<br />
0.17<br />
0.17<br />
0.17<br />
0.16<br />
0.16<br />
0.15<br />
0.15<br />
0.15<br />
0.15<br />
0.14<br />
0.14<br />
0.14<br />
0.13<br />
0.12<br />
0.12<br />
0.12<br />
0.11<br />
0.11<br />
0.10<br />
0.09<br />
0.09<br />
0.09<br />
0.08<br />
0.07<br />
0.04<br />
0.04<br />
0.04<br />
0.03<br />
Notes: 1) Figures 3.1a, b and c use different scales. 2) Higher score means better digital opportunity.<br />
<strong>Opportunity</strong> Infrastructure Use<br />
Source: <strong>ITU</strong>/UNCTAD/KADO <strong>Digital</strong> <strong>Opportunity</strong> Platform.<br />
0 0.05 0.10 0.15 0.20 0.25 0.30 0.35<br />
38
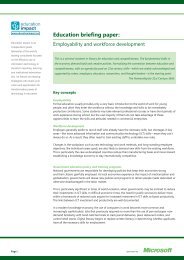
Figure 3.1d: How <strong>Digital</strong> <strong>Opportunity</strong> relates to national economic performance<br />
<strong>The</strong> chart shows the relationship between <strong>DOI</strong> and national wealth, as indicated by GDP per capita, using a logarithmic scale.<br />
1.0<br />
0.8<br />
0.6<br />
Estonia<br />
Lithuania<br />
Bulgaria Chile<br />
Korea (Rep.)<br />
Taiwan, China Singapore<br />
Japan<br />
Denmark<br />
Qatar<br />
<strong>Digital</strong> <strong>Opportunity</strong> <strong>Index</strong><br />
0.4<br />
Jamaica<br />
Kuwait<br />
Morocco<br />
Oman<br />
Senegal<br />
0.2<br />
Rwanda<br />
Timor-Leste<br />
Burundi<br />
Vietnam<br />
Cuba<br />
Pakistan<br />
Equatorial Guinea<br />
Vanuatu<br />
0.0<br />
Niger Chad<br />
2.5 3 3.5 4 4.5 5<br />
$100 $1,000 $10,000 $100,00<br />
0<br />
Log Gross Log National GDP per Income capita (logarithmic scale)<br />
Note: Economies shown above the line have a higher <strong>DOI</strong> score than would be predicted by their GDP per capita.<br />
Economies below the line have a lower <strong>DOI</strong> score than would be predicted by their GDP per capita.<br />
Source: <strong>ITU</strong>/UNCTAD/KADO <strong>Digital</strong> <strong>Opportunity</strong> Platform.<br />
World Information Society Report 2007<br />
39
Statistical Chapter Three Annex<br />
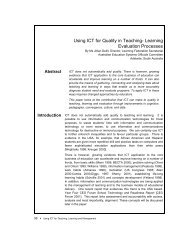
Figure 3.1e: Structure of the <strong>Digital</strong> <strong>Opportunity</strong> <strong>Index</strong><br />
1 Percentage of population covered by mobile cellular telephony<br />
2 Internet access tariffs as a percentage of per capita income<br />
3 Mobile cellular tariffs as a percentage of per capita income<br />
4 Proportion of households with a fixed line telephone<br />
5 Proportion of households with a computer<br />
6 Proportion of households with Internet access at home<br />
7 Mobile cellular subscribers per 100 inhabitants<br />
8 Mobile Internet subscribers per 100 inhabitants<br />
9 Proportion of individuals that used the Internet<br />
10 Ratio of fixed broadband subscribers to total Internet subscribers<br />
11 Ratio of mobile broadband subscribers to total mobile subscribers<br />
OPPORTUNITY<br />
INFRASTRUCTURE<br />
UTILIZATION<br />
DIGITAL OPPORTUNITY INDEX<br />
Note:<br />
<strong>The</strong> indicators are averaged within each category and categories are averaged to obtain the <strong>Digital</strong> <strong>Opportunity</strong><br />
<strong>Index</strong> value.<br />
Source: <strong>ITU</strong>/UNCTAD/KADO <strong>Digital</strong> <strong>Opportunity</strong> Platform.<br />
3.3 <strong>Digital</strong> <strong>Opportunity</strong><br />
around the world<br />
<strong>The</strong> average <strong>DOI</strong> score worldwide in 2005/2006 5<br />
was 0.40, up from 0.37 a year earlier (an increase<br />
of 8 per cent: See Data Table 3). However, there<br />
are big disparities, with low-income economies<br />
averaging less than half of this, at 0.18. In contrast,<br />
the average <strong>DOI</strong> score for high-income economies<br />
is more than three times the low-income score<br />
at 0.65 (Figure 3.2, left). Basic access to telecommunications<br />
and affordability are the main areas<br />
of achievement for most countries (the purple<br />
area in Figure 3.2, left), especially for low-income<br />
countries. High- and upper-middle income countries<br />
have made the strongest gains in digital<br />
opportunity since 2004, mainly through growth<br />
in high-speed broadband infrastructure and<br />
use of advanced technologies (Figure 3.2, right).<br />
However, small increases in average income have<br />
a much greater impact in raising digital opportunity<br />
at lower levels of income – a ‘logarithmic’<br />
relationship (Figure 3.1e). This is similar to the<br />
relationship observed with Internet user penetration<br />
and average income (Figure 2.8). <strong>The</strong> larger<br />
gains achieved by the higher income groupings 6<br />
since 2004 suggest that absolute inequality 7<br />
(measured in percentage points) in digital opportunity<br />
may be growing.<br />
<strong>DOI</strong> scores are also sharply differentiated according<br />
to region (Figure 3.3, left). Europe and the<br />
Americas have average <strong>DOI</strong> scores higher than<br />
the world average, Asia’s is equal to the world<br />
average, while Africa has an average <strong>DOI</strong> score of<br />
0.22, mainly due to limited utilization and fixed<br />
line infrastructure. Europe has achieved the largest<br />
overall gain in digital opportunity over the last<br />
two years, followed by the Americas, which made<br />
especially remarkable progress in 2006. Asia and<br />
Africa have witnessed smaller gains in digital<br />
opportunity (Figure 3.3, right). <strong>The</strong> implications<br />
for the digital divide are clear: digital opportunity<br />
is becoming more sharply divided by region, not<br />
less.<br />
3.3.1 Economies with High <strong>DOI</strong> scores<br />
(0.49+) – Surge in High-Speed Access<br />
Economies with high <strong>DOI</strong> scores are mostly developed<br />
economies in Europe, North America, East<br />
Asia and the Pacific. <strong>The</strong>y include all 30 OECD<br />
member states except Mexico. <strong>The</strong>se economies<br />
40
Figure 3.2: <strong>Digital</strong> <strong>Opportunity</strong> by income grouping<br />
Average <strong>DOI</strong> by income, 2006<br />
Growth in overall digital opportunity by income<br />
grouping, 2004-2006<br />
0.65<br />
0.49<br />
Utilization<br />
Infrastructure<br />
<strong>Opportunity</strong><br />
0.65<br />
0.59<br />
0.49<br />
2006<br />
2005<br />
2004<br />
0.40 0.38<br />
0.18<br />
0.42<br />
0.40 0.38<br />
0.35<br />
0.33<br />
0.18<br />
Gain in digital opportunity, 2004-6<br />
0.14<br />
+0.06 +0.07 +0.05 +0.05 +0.04<br />
High<br />
income<br />
Upper<br />
Middle<br />
World Lower<br />
middle<br />
Low<br />
income<br />
High<br />
income<br />
Upper<br />
Middle<br />
World<br />
Lower<br />
middle<br />
Low<br />
income<br />
Source: <strong>ITU</strong>/UNCTAD/KADO <strong>Digital</strong> <strong>Opportunity</strong> Platform.<br />
provide good digital opportunity for most of their<br />
inhabitants, with varied and extensive infrastructure,<br />
relatively low prices and widespread use of<br />
new technologies. Virtually all high-<strong>DOI</strong> economies<br />
have high <strong>Opportunity</strong>, in excess of 0.99,<br />
except for a few Caribbean island states (Antigua<br />
& Barbuda, St. Kitts & Nevis and Dominica, with<br />
somewhat lower mobile coverage). High-<strong>DOI</strong><br />
economies generally also have widely available<br />
infrastructure, with an average Infrastructure<br />
index of 0.54.<br />
<strong>The</strong> factor that continues to set this group of<br />
countries apart, however, is their high Utilization<br />
averaging 0.33 (up from 0.25 last year), due to<br />
their high Internet usage and broadband subscriber<br />
penetrations. <strong>The</strong> Rep. of Korea stands out<br />
with an overall <strong>DOI</strong> score of 0.80, ahead of Japan<br />
at 0.77 and Denmark at 0.75. Japan and Denmark<br />
have made strong gains in digital opportunity<br />
and, if their current growth rates continue, it is<br />
likely that they will overtake the Rep. of Korea in<br />
digital opportunity in 2006/07.<br />
Figure 3.3: <strong>Digital</strong> <strong>Opportunity</strong> worldwide<br />
Average <strong>DOI</strong> by region, 2006<br />
Growth in overall digital opportunity by region,<br />
2004-2006<br />
0.58<br />
0.45<br />
0.40 0.40<br />
Utilization<br />
Infrastructure<br />
<strong>Opportunity</strong><br />
0.58<br />
0.51<br />
0.45<br />
0.40 0.40<br />
2006<br />
2005<br />
2004<br />
0.22<br />
0.39<br />
0.36<br />
0.35<br />
0.22<br />
Europe Americas Asia World Africa<br />
0.18<br />
Gain in digital opportunity, 2004-6<br />
+0.07 +0.06 +0.04 +0.05 +0.04<br />
Europe Americas Asia World Africa<br />
Source: <strong>ITU</strong>/UNCTAD/KADO <strong>Digital</strong> <strong>Opportunity</strong> Platform.<br />
World Information Society Report 2007<br />
41
Statistical Chapter Three Annex<br />
Figure 3.4: <strong>The</strong> New Substitution<br />
Top economies by total number of Internet<br />
subscribers, in millions, 2005<br />
Type of Internet connections in the United Kingdom,<br />
total in millions, 2001-2006<br />
Taiwan, China<br />
Australia<br />
India<br />
Spain<br />
Netherlands<br />
Brazil<br />
Canada<br />
Italy<br />
Korea (Rep.)<br />
France<br />
United Kingdom<br />
Germany<br />
Japan<br />
China<br />
United States<br />
5.9<br />
6.0<br />
6.1<br />
6.2<br />
6.6<br />
7.2<br />
7.5<br />
11.0<br />
12.2<br />
13.3<br />
16.2<br />
24.0<br />
30.1<br />
Broadband<br />
15<br />
Narrowband<br />
11.9 12.0<br />
11.4<br />
Total number of Internet 10<br />
subscribers 9.3<br />
73.2<br />
83.1<br />
5<br />
0<br />
0.3<br />
1.4<br />
3.2<br />
6.2<br />
Dial-up<br />
Broadband<br />
2001 2002 2003 2004 2005 2006<br />
6.4<br />
10.0<br />
11.1<br />
6.0<br />
Source: <strong>ITU</strong>/UNCTAD/KADO <strong>Digital</strong> <strong>Opportunity</strong> Platform (left chart); OFCOM (UK), “<strong>The</strong> Communications Market<br />
2006”, at: www.ofcom.org.uk/research/cm/cm06/ (right chart). See also Table 10 in the Statistical Annex.<br />
<strong>The</strong> top 25 economies in the <strong>DOI</strong> have been<br />
remarkably stable over the period 2004-2006.<br />
Indeed, the only economy to drop out of the top<br />
twenty-five was Slovenia, replaced by Estonia<br />
(studied further in Chapter four, Section 4.2.2).<br />
Rankings within the top twenty-five are consistent<br />
(suggesting the index is robust), with generally<br />
changes of only a few places up or down – the<br />
only exceptions are the United Kingdom (which<br />
rose eight places due to strong gains in broadband,<br />
with subscribers renouncing their dial-up<br />
connection – see Figure 3.4, right chart), and<br />
Canada (which falls seven places, due to its relatively<br />
weak cellular mobile penetration). Mauritius<br />
is the highest-ranking African economy, at 59 th .<br />
Chile remains the highest-ranking Latin American<br />
country at 41 st , followed by Argentina at 54 th . <strong>The</strong><br />
Gulf States continue to do well (including Bahrain<br />
at 35 th place, the United Arab Emirates in 37 th rank<br />
and Qatar in 38 th rank), as do the Caribbean and<br />
other small island states.<br />
Evolution in Internet subscriptions depends on<br />
both growth in the total size of the market, as well<br />
as the speed (quality) of connections. 2005 was a<br />
year of startling Internet growth in many countries,<br />
thanks to the boost from broadband, although<br />
the United States still remains the largest Internet<br />
market in terms of number of subscribers (Figure<br />
3.4, left). Growth rates in Internet subscriptions are<br />
lower in high-<strong>DOI</strong> economies, but substitution is<br />
strong, with subscribers exchanging narrowband<br />
dial-up for a broadband connection. One example<br />
is the substitution of broadband for dial-up in the<br />
United Kingdom (Figure 3.4, right). In the United<br />
States, some 60 per cent of all Internet connections<br />
are now broadband, while in Japan and<br />
Spain, efforts by operators to encourage consumers<br />
towards broadband have resulted in threequarters<br />
of Internet subscribers now using broadband.<br />
In the Rep. of Korea and Canada, virtually all<br />
Internet users are already broadband subscribers<br />
and enjoy access to faster, advanced services such<br />
as video, teleconferencing, multiplayer gaming<br />
and triple play. Substitution of broadband for dialup<br />
has also been observed in Qatar, where broadband<br />
now accounts for two-thirds of all Internet<br />
accounts. 8<br />
3.3.2 Economies with Medium <strong>DOI</strong> scores<br />
(0.30-0.49) – Rounded growth<br />
<strong>The</strong> group with medium <strong>DOI</strong> scores comprises<br />
diverse economies from Latin America and the<br />
Caribbean, Asia and North Africa. Notably, it<br />
includes the developing country giants of China,<br />
Brazil, Egypt and Indonesia, as well as India, which<br />
joins the medium-<strong>DOI</strong> countries for the first time<br />
in this year’s release of the <strong>DOI</strong>. It also includes<br />
the upper-middle income African states of South<br />
Africa, Botswana and Gabon, as well as Namibia<br />
and Senegal (Box 3.1). Non-OECD European countries<br />
generally also have medium-<strong>DOI</strong> scores (e.g.,<br />
Albania, Belarus, Bosnia and Ukraine). China and<br />
the Maldives are the highest-ranked developing<br />
countries from Asia in the group. Medium-<strong>DOI</strong><br />
countries have high average <strong>Opportunity</strong> at around<br />
0.89, due to good mobile coverage and relatively<br />
low prices. What distinguishes this group from the<br />
low-<strong>DOI</strong> economies is their reasonable infrastruc-<br />
42
ture and growing use of advanced technologies,<br />
but only at levels around a third of those achieved<br />
by high-<strong>DOI</strong> economies. <strong>The</strong>y are also growing<br />
very fast - Brazil is now the tenth-largest Internet<br />
market in the world, while India appears in the top<br />
fifteen largest Internet markets for the first time.<br />
One interesting observation among the medium-<br />
<strong>DOI</strong> group is that there are a growing number<br />
of countries where Utilization scores exceed<br />
Infrastructure. Last year, Utilization exceeded<br />
Infrastructure scores in only six economies. 9 This<br />
year, Utilization exceeds Infrastructure scores<br />
in nineteen economies, thirteen of which are<br />
medium-<strong>DOI</strong> economies. <strong>The</strong> strong growth in<br />
broadband worldwide means that some economies<br />
are successfully leveraging their investments<br />
in infrastructure to yield more rounded growth<br />
and more advanced forms of usage across a broad<br />
Information Society. For example, in Morocco,<br />
broadband now accounts for 98 per cent of all<br />
Internet connections in 2006 due to an aggressive<br />
marketing campaign between operators fighting<br />
for market share, resulting in high utilization<br />
more than twice its infrastructure index (Box 3.2).<br />
This may represent a new form of technological<br />
‘leapfrogging’, where operators investing in<br />
Internet infrastructure are able to adopt the latest<br />
technologies.<br />
3.3.3 Economies with Low <strong>DOI</strong> scores<br />
(0.30 and less) – Mainly mobile<br />
<strong>Digital</strong> opportunity in low-<strong>DOI</strong> economies is still<br />
expressed in terms of potential access to the<br />
Information Society that has not yet been fully<br />
realized. Low-<strong>DOI</strong> economies include many lowerincome<br />
African and Asia-Pacific countries, with<br />
low levels of infrastructure, limited availability of<br />
the Internet and broadband and high prices as a<br />
proportion of local incomes. An hour’s Internet<br />
access per day exceeds the average daily income<br />
in most of these countries. In order for these countries<br />
to fully participate in the Information Society,<br />
prices must be reduced so that telecommunication<br />
services become more affordable.<br />
Box 3.1: Senegal – Reaping the Rewards of Early Reforms<br />
Senegal has succeeded in raising its <strong>DOI</strong> score from 0.22 in 2004 to 0.37 in 2006, whilst its ranking has risen 22<br />
places to 106th in 2006. This makes it the third-fastest rising economy worldwide in terms of increase in ranks<br />
(Table 3.3) and second-fastest in Africa. It is interesting to examine how Senegal has achieved this.<br />
<strong>The</strong> Government undertook early reforms in important areas. <strong>The</strong> incumbent operator, SONATEL, was partly<br />
privatized in 1997, the first African telecommunication operator to be listed on a stock exchange. In 2001, Senegal<br />
established the Telecommunications and Posts Regulatory Agency (ARTP). In 2004, the Ministry of Posts,<br />
Telecommunications and New Information Technologies was created. <strong>The</strong> Government aims to make ICTs a<br />
driver of economic growth and modernization. <strong>The</strong> Government issued a sector note on telecommunications<br />
in January 2005 which calls for an increase in telephone subscribers to 3 million by 2008. This target is likely<br />
to be achieved, with 2.5 million telephone subscribers by June 2006 already.<br />
Senegal was also connected to two submarine fiber optic cables, dramatically increasing its international connectivity.<br />
SONATEL doubled traffic bandwidth on Internet services in less than 2 years surpassing in September<br />
2006 the mark of 1.24 Gbit/s, according to SONATEL. By 2006, Senegal had 775 Mbit/s of international<br />
Internet bandwidth, one of the highest per capita capacities in Africa. Senegal hopes to leverage its abundant<br />
bandwidth by serving as a hub for western Africa. SONATEL has launched ADSL and, by the end of 2005, some<br />
89 per cent of all Internet connections were already broadband, suggesting a successful “technological leapfrogging”<br />
strategy.<br />
Despite these impressive accomplishments, Senegal needs to go further if it is to be successful at using ICTs<br />
for development. Although the growth of broadband subscribers has averaged 2’000 per cent over the last<br />
five years, Internet subscriber penetration is just 2.3 per 100 inhabitants, due to widespread use of community<br />
multimedia telecentres (Box 6.3 in Chapter six). <strong>The</strong> growth in Internet traffic reflects the boom in the number<br />
of users in Senegal in recent years. As broadband prices fall, more people are using the Internet, both at work<br />
and home. Standard broadband subscriptions cost EUR80 for installation and EUR40 per month for the service,<br />
although cheaper deals are becoming available. <strong>The</strong> real key to growth in Internet use has been the surge in<br />
popularity of cybercafés, which offer a high speed Internet line for as little as EUR0.45 per hour (Box 6.3).<br />
Source: UNCTAD, adapted from Agence de Régulation de Télécommunications (ART, Sénégal), “Le marche de<br />
l’Internet”, web page, at: www.artp-senegal.org/telecharger/Fiche_Internet_2005.pdf<br />
World Information Society Report 2007<br />
43
Statistical Chapter Three Annex<br />
For many developing countries, wireless communications<br />
are driving digital opportunity. Many<br />
low-<strong>DOI</strong> economies are in sub-Saharan Africa.<br />
As a region, Africa’s mobile market was the fastest-growing<br />
market over the last five years, with<br />
a 50 per cent annual average growth rate over<br />
2000-2005, more than twice the global average<br />
over the same period (24 per cent). Mobile<br />
phones now outnumber fixed phones by nearly<br />
five to one in Africa, with some 137.2 million<br />
mobile subscribers by the end of 2005. This ratio<br />
is even higher in Sub-Saharan Africa, where nine<br />
out of every ten subscribers are using a mobile.<br />
African mobile penetration doubled from 6.5 per<br />
100 inhabitants in 2003 to 13.1 per 100 inhabitants<br />
in 2005.<br />
<strong>The</strong> <strong>DOI</strong> can be used to compare the fixed and<br />
mobile sectors separately, allowing policymakers,<br />
especially in developing countries, to<br />
adapt national policies to their own national circumstances,<br />
as called for by Para 28 of the Geneva<br />
Plan of Action. 10 <strong>The</strong> economies where mobile<br />
components contribute the highest share towards<br />
the overall <strong>DOI</strong> score are mostly in Africa, where<br />
the mobile sector can account for as much as<br />
four-fifths of digital opportunity, although <strong>DOI</strong><br />
scores remain generally low overall at around<br />
0.22 (Figure 3.5). Prepaid has been a major driver<br />
in Africa’s mobile growth, with some 92 per cent<br />
of African subscribers using a prepaid package<br />
in 2005. Large African mobile strategic investors<br />
(such as Celtel, MTN and Vodacom) have<br />
emerged (Table 3.1), enjoying subscriber growth<br />
rates far greater those found in mature mobile<br />
markets. <strong>The</strong>se pan-African operators have been<br />
able to exploit the growing demand for mobile<br />
telephony across many countries to build largescale<br />
operations with significant economies<br />
of scale, negotiating group-wide purchases of<br />
equipment at lower costs.<br />
Figure 3.5 also implies that, for African countries<br />
with strong mobile sectors, cell phones could be<br />
leveraged to also provide Internet access. <strong>The</strong>re is<br />
substantial work within the industry to promote<br />
mobile Internet use beyond simple applications<br />
for chatting, email or simple browsing:<br />
“A cellphone, despite its small screen size, 12-<br />
digit keypad (in most cases), and potentially<br />
slower connection speed, has the ability to<br />
provide the most popular web-based services.<br />
According to Jupiter Research, the most popular<br />
online activities are sending and receiving<br />
e-mails, researching and purchasing products<br />
online, obtaining local news, listings, maps and<br />
traffic information, using instant messaging,<br />
Figure 3.5: <strong>The</strong> Mobile Information Society in Africa<br />
Strength in mobile is the main driver of digital opportunity in Africa, where the mobile sector (represented by<br />
the pale yellow area) accounts for over half of total digital opportunity (purple line) in the majority of African<br />
countries, 2005.<br />
%<br />
Fixed <strong>DOI</strong> Mobile <strong>DOI</strong> <strong>DOI</strong> score<br />
100<br />
80<br />
60<br />
40<br />
20<br />
0<br />
Niger<br />
Chad<br />
Guinea-Bissau<br />
Eritrea<br />
Congo, D.R.<br />
Malawi<br />
CAR<br />
Burundi<br />
Ethiopia<br />
Sierra Leone<br />
Mali<br />
Mozambique<br />
Madagascar<br />
Burkina Faso<br />
Rwanda<br />
Zambia<br />
Tanzania<br />
Guinea<br />
S. Tomé & Principe<br />
Uganda<br />
Zimbabwe<br />
Comoros<br />
Nigeria<br />
Mauritania<br />
Kenya<br />
Congo<br />
Togo<br />
Benin<br />
Côte d'Ivoire<br />
Gambia<br />
Ghana<br />
Angola<br />
Cameroon<br />
Sudan<br />
Lesotho<br />
Djibouti<br />
Equatorial Guinea<br />
Swaziland<br />
Cape Verde<br />
Namibia<br />
Libya<br />
Senegal<br />
Gabon<br />
Botswana<br />
Egypt<br />
Tunisia<br />
South Africa<br />
Algeria<br />
Morocco<br />
Seychelles<br />
Mauritius<br />
0.6<br />
0.5<br />
0.4<br />
0.3<br />
0.2<br />
0.1<br />
0<br />
Source: <strong>ITU</strong>/UNCTAD/KADO <strong>Digital</strong> <strong>Opportunity</strong> Platform.<br />
44
Table 3.1: Africa’s mobile strategic investors<br />
Strategic<br />
investor<br />
Subscribers<br />
(000s) 2006<br />
Subscribers<br />
(000s) 2005<br />
% change<br />
2005/06<br />
Revenue<br />
(m US$)<br />
2005<br />
%<br />
change<br />
2004/05<br />
Yearly<br />
ARPU<br />
(US$)*<br />
African Countries<br />
where the Investor has<br />
Operations<br />
MTN 24’300<br />
(Mar 2006)<br />
15’600<br />
(Mar 2005)<br />
56% $4’ 545<br />
(Mar<br />
2005)<br />
21% $291 Afghanistan, Benin,<br />
Cameroon, -, Congo,<br />
Ghana, Guinea,<br />
Guinea-Bissau, Liberia<br />
Nigeria, Rwanda, South<br />
Africa, Swaziland,<br />
Sudan, Syria, Uganda,<br />
Yemen.<br />
Vodacom 23’520<br />
(Mar 2006)<br />
15’483<br />
(Mar 2005)<br />
52% $5’328<br />
(Mar<br />
2006)<br />
25% $227 Congo (DR), Lesotho,<br />
Mozambique,<br />
Mauritius, South Africa,<br />
Tanzania<br />
Orascom 21’128<br />
Africa (total<br />
46’522)<br />
17’500<br />
(total<br />
30’383)<br />
53%<br />
(total)<br />
$3’216 -0.30% $69 Algeria, Egypt, Iraq,<br />
Pakistan, Tunisia,<br />
Zimbabwe.<br />
Celtel 15’270<br />
(Sept 2006)<br />
5’375<br />
(Sept 2005)<br />
184% $953 60% $62 Burkina Faso, Chad,<br />
Congo, Congo (DR),<br />
Gabon, Kenya, Niger,<br />
Nigeria, Madagascar,<br />
Malawi, Sierra Leone,<br />
Sudan, Tanzania,<br />
Uganda, Zambia.<br />
Orange n/a 5’188<br />
(Sept 2005)<br />
n/a n/a n/a n/a Botswana, Cameroon,<br />
Côte d’Ivoire, Egypt, Eq.<br />
Guinea, Madagascar,<br />
Mali, Mauritius,<br />
Reunion, Senegal.<br />
Millicom 12’800<br />
(Sept 2006)<br />
8’929<br />
(Sept 2005)<br />
43% $1’084 6% $85 Chad, Congo (DR),<br />
Ghana, Mauritius,<br />
Senegal, Sierra Leone,<br />
Tanzania.<br />
Etisalat n/a 4’534 n/a $3’512 +23% $775 Benin, Burkina Faso,<br />
Central African Rep.,<br />
Côte d’Ivoire, Gabon,<br />
Niger, Pakistan, Qatar,<br />
Saudi Arabia, Sudan,<br />
Tanzania, Togo, UAE.<br />
Total 97’018 72’609 n/a $18’638 18% $145<br />
Source: <strong>ITU</strong>, abridged from company reports.<br />
* Estimated by <strong>ITU</strong> – not operators’ official figures.<br />
utilizing search portals, banking and reading<br />
news. Most of these activities can be done fairly<br />
easily on the average cellphone with a data connection<br />
today. Cellphones do not require a consistent<br />
power supply, can be charged every few<br />
days, and can be carried securely in a pocket,<br />
an important feature in developing countries.<br />
Moreover, data and voice can be purchased in<br />
small increments.” 11<br />
Source: rcrnew.com<br />
World Information Society Report 2007<br />
45
Statistical Chapter Three Annex<br />
3.4 Growth in <strong>Digital</strong><br />
<strong>Opportunity</strong> over time<br />
As emphasized in Chapter one, the main purpose<br />
of the <strong>DOI</strong> is to track progress towards bridging the<br />
digital divide and meeting the WSIS targets. This<br />
release of the <strong>DOI</strong> includes a three-year time series<br />
for 181 economies from 2004-2006. As shown in<br />
Figure 3.2, scores in the <strong>Digital</strong> <strong>Opportunity</strong> <strong>Index</strong><br />
have been increasing steadily over the last couple<br />
of years. Virtually every economy has succeeded<br />
in improving access to ICTs in some way. It is only<br />
by making international comparisons that it is possible<br />
to identify those policies that have been the<br />
most effective resulting in above average growth.<br />
For this reason, an approach based on comparative<br />
rankings is more meaningful than one that<br />
uses absolute growth rates. 12<br />
Table 3.3 lists the top ten gainers in terms<br />
of increases in ranks (see also Data Table 3).<br />
Economies with lower ranks tend to exhibit<br />
more mobility in the index (both up and down).<br />
Analysis of changes in <strong>DOI</strong> scores over time shows<br />
that economies are gaining in strength in different<br />
areas. Five of the top ten gainers come from<br />
Africa (Table 3.2). Morocco has the greatest overall<br />
gain in rankings this year due to its remarkable<br />
improvements in Utilization (Box 3.2). Senegal has<br />
also made strong inroads in broadband access,<br />
with 89 per cent of all Internet subscribers subscribing<br />
to broadband in 2005 (Box 3.1), as well as<br />
widespread Internet access through multimedia<br />
telecentres (Box 6.3 in Chapter Six). 13 <strong>The</strong> other<br />
African economies in the top ten (Ghana, Gabon<br />
and Côte d’Ivoire) have witnessed increased<br />
mobile coverage and greater access to telecommunications<br />
at reduced prices.<br />
Other major gainers in the <strong>DOI</strong> include the Russian<br />
Federation and Romania, which have made strong<br />
gains in Utilization, mainly through growth in<br />
Internet usage and broadband access. Only the<br />
Russian Federation and Antigua and Barbuda<br />
have succeeded in boosting Infrastructure by an<br />
increase of more than 15 percentage points over<br />
the three-year period, suggesting that improved<br />
infrastructure is a longer-term goal for most economies.<br />
Overall, however, Table 3.2 suggests that<br />
improvements in the <strong>DOI</strong> are not limited to any<br />
particular region – varied countries with different<br />
profiles in the development of their Information<br />
Society have enjoyed gains in digital opportunity.<br />
In many countries, growth in digital opportunity is<br />
being driven by reductions in price of telecommunication<br />
services. <strong>ITU</strong> has measured the price of<br />
different telecommunication services since 2002<br />
notably for mobile, Internet and broadband services.<br />
Prices for mobile, Internet and broadband<br />
services have fallen since 2003 14 , due to grow-<br />
Table 3.2: Top Ten Gainers in the <strong>Digital</strong> <strong>Opportunity</strong> <strong>Index</strong>, 2004-2006<br />
Economy <strong>DOI</strong> 2004 <strong>DOI</strong> 2006 Rank 2004 Rank 2006 Δ ranks Drivers<br />
1 Morocco 0.33 0.47 104 68 +36 U<br />
2 Russian Federation 0.38 0.52 78 51 +27 I,U<br />
3 Senegal 0.22 0.37 128 106 +22 O,U<br />
4 Ghana 0.10 0.21 161 142 +19 O<br />
5 Antigua & Barbuda 0.44 0.57 58 40 +18 I,U<br />
6 Gabon 0.26 0.37 121 103 +18 O<br />
7 Belize 0.34 0.42 100 84 +16 U<br />
8 Bhutan 0.12 0.22 155 140 +15 O<br />
9 Cote d'Ivoire 0.12 0.20 158 145 +13 O<br />
10 Romania 0.42 0.52 63 50 +13 U<br />
Average (top 10) 0.27 0.39 113 93 + 20<br />
Average (world) 0.35 0.4<br />
Note: O = <strong>Opportunity</strong>; I = Infrastructure; U = Utilization sub-index. A driver is defined as a sub-index where there is an<br />
improvement of score of 0.15 or more over the period 2001-2006.<br />
Source: <strong>ITU</strong>/UNCTAD/KADO <strong>Digital</strong> <strong>Opportunity</strong> Platform.<br />
46
Box 3.2: Morocco – An African Success Story<br />
Morocco initiated market liberalization relatively early. In mobile communications, it became one of the first<br />
North African countries to introduce competition when it licensed a second mobile operator, Médi Telecom,<br />
in July 1999. A few months later in December 1999, the government sold 35 per cent of incumbent Maroc<br />
Telecom to Vivendi of France (see Box 4.2 in Chapter four). Intense competition between the two operators<br />
led to mobile phones overtaking fixed lines in August 2000, just six months after the second operator had<br />
launched its network. By June 2001, Médi had 755’000 customers and a population coverage of 70 per cent.<br />
Maroc Telecom responded by investing US$ 275 million in its network and innovating with its price strategy. It<br />
achieved a client base of one million customers in June 2000, two million in November 2000 and three million<br />
by May 2001. <strong>The</strong> recent growth in Morocco has significantly surpassed all its North African neighbours.<br />
Box Figure 3.1: Evolution in the speed of Internet access in Morocco<br />
Speed of Internet access, 2005 and 2006<br />
71%<br />
Proportion of Internet connections<br />
45%<br />
35%<br />
18%<br />
4%<br />
10%<br />
2005<br />
2006<br />
7%<br />
4%<br />
0%<br />
6%<br />
128 256 512 1024 2/4 Mbit/s<br />
Speed (kbit/s, unless stated)<br />
Source: Agence Nationale de Régulation des Télécommunications (ANRT).<br />
Now, some of the same dynamism is reaching the Moroccan Internet market. Helped by Morocco’s proximity<br />
to fibre networks in the Mediterranean, Maroc Telecom and the ISP Menara have launched a range of highspeed<br />
packages at comparatively low prices, including the highest speed broadband package in Africa at<br />
4 Mbit/s. Surveys of the residential market carried out by the regulator, the National Agency of Telecommunication<br />
Regulation (ANRT), show that broadband connections are moving to progressively higher speeds.<br />
With nearly 400,000 ADSL connections at the end of 2006, Morocco is the top country in Africa in terms of<br />
the total number of broadband subscribers, well ahead of South Africa (although Mauritius had the highest<br />
broadband penetration). At the end of 2006, ADSL accounted for 98 per cent of all Moroccan Internet connections<br />
(including dial-up and leased lines). Broadband connections increased by 58 per cent over 2005-2006,<br />
compared to dial-up, which lost ground with a 40 per cent drop. <strong>The</strong>se changes in the Sector all helped Morocco<br />
to take the position of “fastest gainer” in the <strong>DOI</strong> between 2004 and 2006.<br />
Source: Moroccan household survey 2006, Moroccan regulator, the Agence Nationale de Régulation des<br />
Télécommunications (ANRT), available in French from: www.anrt.net.ma/fr/.<br />
ing liberalization and more competitive markets.<br />
For example, in South Africa in February 2007,<br />
the operator MTN increased data capacity and<br />
reduced broadband prices by up to 20 per cent,<br />
seeking “to bring mobile data within reach of a<br />
larger proportion of our population”. 15 Broadband<br />
providers in South Africa are innovating with a<br />
greater range of packages, pay-as-you-go or contract<br />
options for broadband, extended contracts<br />
and ‘shaped’ or ‘unshaped’ offers (prioritizing<br />
traffic according to consumers’ specific needs) to<br />
attract customers. In some countries, reductions<br />
in prices for telecommunication services have<br />
directly resulted in a growing number of subscrib-<br />
World Information Society Report 2007<br />
47
Statistical Chapter Three Annex<br />
ers: the UAE incumbent Etisalat reports that after<br />
rates of its high-speed Internet service Al Shamil<br />
were reduced by 46 per cent in 2005, the number<br />
of subscribers grew by 140 per cent. 16 Greater<br />
choice of products, pricing and access platforms<br />
has fuelled growth in broadband in the UK. 17<br />
3.5 Key Trends in the Information<br />
Society<br />
3.5.1 Cutting the cord<br />
<strong>The</strong> <strong>DOI</strong> measures the proportion of households<br />
with access to fixed lines (widely available from<br />
surveys or by derivation, i.e., residential telephone<br />
lines per 100 households). Fixed lines have historically<br />
been important for voice, faxes, text and data<br />
communications. <strong>The</strong> <strong>DOI</strong> shows that fixed lines<br />
in homes are declining, mainly in response to the<br />
rise of mobile communications. This trend makes<br />
it likely that countries will never achieve 100 per<br />
cent fixed household penetration.<br />
A good example is Finland, which has seen a dramatic<br />
drop in the proportion of homes with fixed<br />
telephones from 94 per cent in 1990 to 64 per cent<br />
in 2003 (Figure 3.6) and an estimated 57 per cent<br />
by 2005. 18 Nearly all Finnish from homes that do<br />
not have a fixed line nevertheless own a mobile<br />
phone or have access to one. Remarkably, over 80<br />
per cent of Finnish homes with a fixed telephone<br />
line are connected to DSL broadband service -<br />
many Finns are keeping their fixed telephone line<br />
mainly for broadband access.<br />
Given the preference of many users for mobile<br />
rather than fixed telephony, this indicator could<br />
be adapted to measure the existence of a telephone<br />
in the household, regardless of whether it<br />
is fixed or mobile. However, the <strong>DOI</strong> already measures<br />
mobile penetration through a per capita subscription<br />
indicator, since mobile telephones are<br />
personal and are less likely to be shared. While<br />
mobile telephone networks are evolving in their<br />
ability to offer higher-speed Internet access, highspeed<br />
wireless networks have yet to be widely<br />
launched around the world. <strong>The</strong>re are, in general,<br />
only a small proportion of households that currently<br />
use high-speed mobile networks to access<br />
the Internet, although fixed usage of 3G wireless<br />
for broadband Internet service is increasing. One<br />
example is the Czech Republic, where more than<br />
a third of the one million broadband subscribers<br />
at the end of December 2006 were using fixed<br />
wireless broadband. 19 Despite this reduction in<br />
fixed lines in developed nations and lower rates<br />
of growth in developing ones, an indicator measuring<br />
the availability of telephony and potential<br />
home access to the Internet is vital for policy<br />
analysis.<br />
<strong>The</strong> growing use of Voice over Internet Protocol<br />
(VoIP) worldwide suggests that over time, fixed<br />
voice services will be provided over broadband<br />
Figure 3.6: Abandoning fixed lines<br />
Proportion of Finnish households with telephones<br />
Proportion of Finnish households with fixed lines,<br />
mobile phones and both, 2005<br />
100<br />
80<br />
60<br />
40<br />
20<br />
0<br />
1990 1995 1998 2001 2003<br />
Mobile<br />
only<br />
47%<br />
Fixed<br />
only 7% Both<br />
46%<br />
Fixed<br />
Mobile<br />
Source: Adapted from Statistics Finland (left) and Eurobarometer (right).<br />
48
connections. 20 In the future, it would be interesting<br />
to include subscriptions to connections capable<br />
of providing broadband access to the household.<br />
This would include not only fixed telephone lines,<br />
but also cable television and suitable equipped<br />
wireless connections, such as third generation<br />
mobile or fixed wireless access.<br />
3.5.2 Getting connected to the Internet<br />
<strong>The</strong> price of computers remains a major obstacle<br />
to wider household penetration, especially in<br />
developing nations. However, one would assume<br />
that, having bought a computer, most households<br />
would then want to connect it to the Internet. In<br />
developed economies, access to the Internet is<br />
more likely to be from home than from the workplace,<br />
with high household Internet and PC penetrations<br />
in all high-<strong>DOI</strong> economies (Figure 3.7, left).<br />
Iceland leads the world, with a household penetration<br />
of Internet access at 84 per cent and PCs at<br />
89 per cent. In many developing countries, home<br />
is not the main place of access for users. <strong>The</strong>re has<br />
been an explosive growth in public Internet facilities<br />
in many countries to cater to those without<br />
home Internet access (see the examples given in<br />
Chapter six). In fact, access from public facilities<br />
may be so successful that it may even be constraining<br />
growth in home Internet access in developing<br />
nations.<br />
However, intriguingly, not all home computers are<br />
connected to the Internet. <strong>The</strong> ratio of home computers<br />
with Internet access differs widely. <strong>The</strong> ratio<br />
of home computers connected to the Internet<br />
ranges from 95 per cent in Estonia to 20 per cent<br />
in Lebanon (Figure 3.7, right). In the Baltic nations,<br />
Estonia and Latvia have computer to Internet<br />
ratios of some 95 per cent, yet in Lithuania, only<br />
50 per cent of computers are connected to the<br />
Internet. Average income in Lithuania is lower<br />
than the other two countries, but Internet tariffs<br />
are cheaper and access is more affordable (See<br />
Data Table 9 in the Statistical Annex). <strong>The</strong>refore, it<br />
is unclear why Lithuania has such a lower ratio of<br />
computers with Internet access. In Latvia, the ratio<br />
was just below 100 per cent in 2005 and exceeded<br />
it in 2006. <strong>The</strong> national statistical office reported<br />
that many households were accessing the Internet<br />
through mobile phones.<br />
Japan has a high proportion of households with<br />
PCs without Internet (Figure 3.7, left) – partly<br />
due to the popularity of mobile Internet access<br />
in Japan. Mobile Internet access could result in<br />
relatively limited functionality in the passive web<br />
experience of cell phones, instead of positive participation<br />
in online web intelligence. <strong>The</strong>se different<br />
patterns of Internet usage could result in<br />
the development of different skill sets and could<br />
shape the Information Society differently, according<br />
to the type, speed and capacity of Internet<br />
access available.<br />
Figure 3.7: Household Internet Access<br />
Household Internet and PC penetration for the<br />
economies with highest household penetrations,<br />
2005<br />
Ratio of household computers with Internet access,<br />
selected economies by region,<br />
2005<br />
% households with Internet % households with PCs<br />
%<br />
Iceland<br />
Denmark<br />
Japan<br />
Sweden<br />
Korea (Rep.)<br />
Netherlands<br />
Taiwan, China<br />
Macao, China<br />
Luxembourg<br />
Switzerland<br />
Singapore<br />
Norway<br />
New Zealand<br />
Hong Kong, China<br />
Germany<br />
Canada<br />
Australia<br />
74<br />
74<br />
75<br />
75<br />
7678<br />
67 70<br />
70<br />
70 7274<br />
818489%<br />
7980<br />
0 100%<br />
100<br />
90<br />
80<br />
70<br />
60<br />
50<br />
40<br />
30<br />
20<br />
10<br />
0<br />
Lebanon<br />
Jordan<br />
Palestine<br />
Paraguay<br />
Mexico<br />
Brazil<br />
Lithuania<br />
Latvia<br />
Estonia<br />
Source: <strong>ITU</strong>/UNCTAD/KADO <strong>Digital</strong> <strong>Opportunity</strong> Platform, adapted from national statistical office data and <strong>ITU</strong><br />
World Telecommunication Indicators Database.<br />
World Information Society Report 2007<br />
49
Statistical Chapter Three Annex<br />
Figure 3.8: Internet access, at home and elsewhere, in Mexico<br />
Proportion of homes with Internet connection,<br />
2002-2006<br />
Distribution of Internet users by location of use,<br />
2002-2006<br />
100<br />
6.1<br />
7.4<br />
8.7 9.0<br />
10.1<br />
80<br />
60<br />
40<br />
54.7 63.5 61.5 68.3 66.4<br />
20<br />
2002<br />
2003<br />
2004<br />
2005<br />
2006<br />
0<br />
2002<br />
2003<br />
2004<br />
2005<br />
2006<br />
Home<br />
Outside the home<br />
Source: Adapted from INEGI.<br />
In Latin America, Brazil and Mexico had the same<br />
household computer penetration of 18 per cent<br />
in 2005, yet in Brazil, 74 per cent of computers<br />
were connected to the Internet. In Mexico, only<br />
9.4 per cent of homes had Internet access. In<br />
terms of affordability, Mexico’s per capita income<br />
is twice as large as in Brazil and Internet costs consume<br />
a smaller proportion of income in Mexico.<br />
Furthermore, the home Internet penetration rate<br />
in Mexico grew only very slowly from 2002-2006<br />
(Figure 3.8). Further, most new Internet users in<br />
Mexico access the Internet from outside the home.<br />
While home and outside-home use was roughly<br />
equal in 2001, two-thirds of all Mexican Internet<br />
users now access the Internet from public facilities<br />
(i.e., Internet cafes and schools). Mexico has<br />
flat-rate local call pricing, whereas in Brazil, local<br />
calls are charged on a timed usage basis. From<br />
an economic perspective, there should be more<br />
Mexican households connected to the Internet<br />
Figure 3.9: Growth of broadband<br />
Number of economies with commercial broadband<br />
at speeds of 256 kbit/s or more, 2002-March 2007<br />
Growth in maximum broadband speeds in Africa,<br />
2003-2006<br />
81<br />
113<br />
133<br />
145<br />
166 170<br />
Number of countries<br />
12<br />
10<br />
8<br />
6<br />
4<br />
2<br />
2005<br />
2006<br />
2003<br />
2004<br />
2005<br />
2006<br />
2002 2003 2004 2005 2006 start<br />
2007<br />
0<br />
256<br />
512<br />
1'024<br />
2'048<br />
4'096<br />
Speed (kbps)<br />
Note (right chart): Maximum advertised broadband speeds may not be always available, depending on network congestion,<br />
latency, routing of data etc.<br />
Source: <strong>ITU</strong>/UNCTAD/KADO <strong>Digital</strong> <strong>Opportunity</strong> Platform.<br />
50
than Brazilian ones, but this is not the case. More<br />
research is needed on the reasons why people<br />
living in households with computers may not connect<br />
to the Internet.<br />
While the explosion of public facilities offering<br />
Internet access is admirable (see Chapter six),<br />
policy-makers should focus on the benefits of each<br />
household having its own, regular Internet access.<br />
3.5.3 <strong>The</strong> death of dial-up?<br />
<strong>The</strong> <strong>Digital</strong> <strong>Opportunity</strong> <strong>Index</strong> tracks access to<br />
new and advanced technologies, including fixed<br />
and wireless broadband. <strong>The</strong> telecommunication<br />
industry reached a key milestone in 2005, when<br />
broadband subscribers exceeded dial-up for the<br />
first time as the primary way of accessing the<br />
Internet. By the end of 2005, there were nearly 218<br />
million broadband subscribers around the world,<br />
accounting for 53 per cent of all Internet subscriptions.<br />
At current rates of growth, the vast majority<br />
of Internet subscriptions should be at broadband<br />
speeds (equal to or greater than 256 kbit/s) by the<br />
end of this decade.<br />
<strong>The</strong>re is a widespread perception that broadband<br />
is less relevant for developing countries, but this is<br />
not the case. Broadband is increasingly available in<br />
developing countries. By the start of 2007, ADSL at<br />
speeds of 256 kbit/s and above was available in 170<br />
economies (Figure 3.9, left). DSL was rolled out in<br />
Ghana 21 and Libya 22 during 2006. In 2007, Telecom<br />
Lesotho will introduce ADSL to improve Internet<br />
services and has submitted its proposed tariffs to<br />
the Lesotho Telecommunications Authority, which<br />
launched a Public Consultation on ADSL tariffs 23 ,<br />
with a pilot project to be launched in Maseru. 24 As<br />
long ago as December 2003, Macedonia became<br />
the last unserved European country to introduce<br />
broadband, with an ADSL service. However, due<br />
to Maktel’s monopoly over access to Internet<br />
bandwidth, Macedonia is focusing on wireless<br />
broadband, for example, for USAID’s school connectivity<br />
project to connect 461 schools. 25<br />
Meanwhile, the speed and choice of services<br />
available are growing. Maroc Telecom launched<br />
Internet Protocol Television (IPTV) over DSL in<br />
May 2006 26 and has recently launched the first<br />
four Mbit/s broadband package in Africa 27 (Figure<br />
3.9, right). Qtel (Qatar) is one of the first telecommunication<br />
operators in the Middle East to have<br />
introduced a triple play offering over ADSL. 28<br />
Meanwhile, for many developing countries, wireless<br />
broadband offers an attractive way of reaching<br />
greater number subscribers at reduced costs.<br />
In 2006, Africa Online Uganda introduced broadband<br />
wireless with a wider coverage, designed<br />
to suit both business and home users. Wireless<br />
broadband can be much cheaper compared to<br />
leased lines, as bills are based on usage, rather<br />
than fixed monthly payments. 29<br />
Figure 3.10: Ratio of broadband to total Internet subscribers, Hong Kong, SAR<br />
%<br />
70<br />
Proportion of total subscribers<br />
60<br />
50<br />
40<br />
30<br />
20<br />
10<br />
0<br />
02/2000<br />
06/2000<br />
10/2000<br />
02/2001<br />
06/2001<br />
10/2001<br />
02/2002<br />
06/2002<br />
10/2002<br />
02/2003<br />
06/2003<br />
10/2003<br />
02/2004<br />
06/2004<br />
10/2004<br />
02/2005<br />
06/2005<br />
10/2005<br />
Source: Adapted from Office of the Telecommunications Authority (OFTA), Hong Kong, SAR.<br />
World Information Society Report 2007<br />
51
Statistical Chapter Three Annex<br />
Some economies are taking longer to convert their<br />
Internet subscriber base to broadband, however,<br />
especially where there is a competitive market<br />
and tariffs are relatively low. In Hong Kong SAR,<br />
the broadband market boomed after 2000 with<br />
the ratio of broadband to total Internet subscribers<br />
increasing by around one per cent a month<br />
(Figure 3.10). 30 However, broadband growth has<br />
stagnated recently and the ratio of broadband to<br />
total Internet subscribers only increased by four<br />
per cent in 2005 to 63 per cent.<br />
What explains this resistance to broadband? 31 One<br />
factor is that even though broadband prices have<br />
dropped dramatically and bandwidth has risen,<br />
dial-up is still often cheaper in many economies,<br />
particularly those, such as Hong Kong SAR, that do<br />
not charge for local calls. Also, some users do not<br />
like the always-on feature of broadband, fearing it<br />
makes them more vulnerable to cyber-intrusion<br />
(an issue examined in Chapter five). Some users<br />
simply do not need broadband since they use<br />
mostly low-bandwidth applications such as email.<br />
Finally, there are users who do not have access<br />
to broadband because they live in remote areas,<br />
outside of the range of DSL or cable. This group<br />
of users is increasingly important as one focus of<br />
debates over universal service.<br />
3.5.4 Growth in 3G mobile<br />
<strong>The</strong>re is strong growth in third generation (3G)<br />
mobile services, particularly in Asia and Europe,<br />
where nearly all the top ten largest markets are<br />
situated (Figure 3.11, left). Mobile broadband has<br />
grown in speed and by the first quarter of 2006,<br />
operators were advertising commercially available<br />
download velocities of between 384 kbit/s – 1.4<br />
Mbit/s. <strong>The</strong> industry promises even higher speeds<br />
in the future. For example, Telstra, a mobile operator<br />
in Australia claims that it will soon be providing<br />
peak network speeds of 14.4 Mbit/s over its High<br />
Speed Download Packet Access (HSDPA) network.<br />
Mobile broadband (3G) services are now offered<br />
in many developing countries throughout central<br />
and eastern Asia, Latin America and the Caribbean<br />
(Figure 3.10, right). Wideband CDMA networks<br />
were operational in 49 countries by the start of<br />
2007, with 24 HSDPA networks. Twelve economies<br />
had separate networks supporting both W-CDMA<br />
and CDMA 2000 1x in 2006. 32<br />
As operators introduce these advanced mobile<br />
services, they are now deriving a greater proportion<br />
of their revenues from data services. In Africa,<br />
data revenues are small, but growing. Vodacom<br />
Figure 3.11: Expansion of mobile broadband and 3G mobile<br />
Top ten 3G mobile markets, 2005<br />
Number of economies with mobile broadband<br />
technologies, 2001-2006<br />
Australia<br />
Portugal<br />
Spain<br />
France<br />
Germany<br />
USA<br />
UK<br />
Italy<br />
Korea (Rep.)<br />
Japan<br />
CDMA 1x EV-DO<br />
W-CDMA<br />
0 5 10 15 20<br />
79<br />
61<br />
CDMA 1x EV-DO<br />
30<br />
W-CDMA only<br />
W-CDMA+HSDPA<br />
42 20<br />
11<br />
25<br />
Total<br />
32<br />
12 26<br />
2 2 7<br />
24<br />
5 9<br />
2001 2002 2003 2004 2005 2006<br />
Source: <strong>ITU</strong>/UNCTAD/KADO <strong>Digital</strong> <strong>Opportunity</strong> Platform and <strong>ITU</strong> Internet Report 2006: digital.life.<br />
52
eports data revenues of 2 billion Rand for 2006<br />
(USD 0.3 bn), up 52 per cent from 1.3 bn Rand in<br />
2005 (USD 0.2 bn). Data revenues constituted 7<br />
per cent of total service revenues for Vodacom<br />
Group in 2006, up from 5.6 per cent in 2005. 33<br />
Vodacom considers that it is in an excellent position<br />
to take advantage of growth opportunities<br />
in the cellular and converged communications<br />
industry and recently launched “mobile TV on the<br />
move” over its HSDPA network. Vodacom plans to<br />
continue to grow mobile data revenues by mobilizing<br />
office tools and software applications such<br />
as 3G, HSDPA, Vodafone Mobile Connect Cards<br />
and live TV-streaming Blackberry at acceptable<br />
prices. 34 Data revenues represent a much higher<br />
proportion of total revenues in the mature markets<br />
of Asia-Pacific, where consumers are at ease<br />
with using their mobile for mobile gaming, m-<br />
commerce and access to news and sports alerts.<br />
However, there are some concerns that in the<br />
development of the global Information Society<br />
continues to be uneven. Although the developing<br />
world is making strong gains in mobile telephony<br />
and, to a lesser extent, Internet access, Europe<br />
and Asia are gaining ground in the adoption of<br />
new technologies such as broadband and mobile<br />
Internet. This suggests that discrepancies in access<br />
to ICTs between countries are not only measured<br />
in terms of basic penetration and access, but are<br />
taking on new dimensions in speed, mobility and<br />
capacity of access. Through its measurement of<br />
mobile/fixed components and new technologies,<br />
the <strong>DOI</strong> can measure all these trends and can be<br />
used to improve and enrich policy-making. Speed<br />
and quality of access considerations must be taken<br />
into account in future assessments of the digital<br />
divide, as well as in the broader debate over provision<br />
of universal service.<br />
3.6 Conclusions<br />
This chapter has tracked progress in WSIS implementation,<br />
with regards to the three clusters<br />
of the digital opportunity index (<strong>DOI</strong>) namely<br />
<strong>Opportunity</strong>, Infrastructure and Utilization. It has<br />
shown that the Information Society has grown<br />
steadily since the start of the WSIS process in 2003.<br />
Notes for Chapter Three<br />
1 More information on the <strong>Digital</strong> <strong>Opportunity</strong> <strong>Index</strong> is available from: www.itu.int/doi.<br />
2 A time series has been calculated for the full set of 181 economies since 2004 and for sixty-two economies since<br />
2001.<br />
3 <strong>The</strong> use of the ICT <strong>Opportunity</strong> <strong>Index</strong> is explored in greater detail in a separate <strong>ITU</strong> publication, published in<br />
February 2007: “Measuring the Information Society”, available at: www.itu.int/<strong>ITU</strong>-D/ict/publications/ict-oi/2007/<br />
index.html.<br />
4 For more practical information on how the <strong>DOI</strong> is constructed, see the <strong>DOI</strong> user guide at: www.itu.int/osg/spu/statistics/<strong>DOI</strong>/doi-guide.pdf<br />
and the methodology report “Measuring digital opportunity” (November 2005), at www.itu.<br />
int/osg/spu/statistics/<strong>DOI</strong>/linkeddocs/Measuring_<strong>Digital</strong>_Opp_Revised_23_Nov_2005%20(2).pdf.<br />
5 <strong>The</strong> <strong>DOI</strong> scores for each country have a mix of infrastructure indicators (valid for year end 2005) and tariff and<br />
coverage measures (valid for 2006). For that reason, the <strong>DOI</strong> scores presented here are classified as 2005/06 but, for<br />
convenience when making time-series analysis, they may be simply referred to as “ 2006”.<br />
6 Income classifications are updated each year, based on Gross National Income. This comparison of digital opportunity<br />
uses the 2005/2006 income classification, applied to the <strong>DOI</strong> scores for 2004-2006.<br />
7 As measured by the range in digital opportunity (high income – low income) and dispersion around world average.<br />
8 “Qatar Internet and Datacomm Landscape”, report by the Arab Advisors Group, 21 February 2007, available from:<br />
www.arabadvisors.com.<br />
World Information Society Report 2007<br />
53
Statistical Chapter Three Annex<br />
9 Namely: Maldives, Morocco, Peru, Myanmar, Senegal and Venezuela; all of these were medium-<strong>DOI</strong> economies.<br />
10 <strong>The</strong> Geneva Plan of Action can be downloaded from: www.itu.int/wsis/documents/doc_multi.<br />
asp?lang=en&id=1160|0.<br />
11 www.rcrnews.com/apps/pbcs.dll/article?AID=/20070326/FREE/70322019/1026/FREE.<br />
12 P. 51, Chapter 4, World Telecommunication Development Report (2002), <strong>ITU</strong>, Geneva, available from www.itu.<br />
int/publications/<br />
13 Agence de Régulation de Télécommunications (ART, Sénégal), “Le marche de l’Internet”, web page, available at:<br />
www.artp-senegal.org/telecharger/Fiche_Internet_2005.pdf.<br />
14 <strong>The</strong> 2006 World Information Society report noted that “In mobile telephony, worldwide, prices have been falling by<br />
an average of 10 per cent per year. Internet access has fallen by a similar amount and in 2005, cost only three-quarters<br />
of its price in 2003. As a more recent technology, broadband Internet access is the most expensive, but it has also<br />
fallen the most – broadband has enjoyed a 40 per cent reduction in price since 2003 due to growing competition<br />
and changes towards flat-rate, unmetered pricing packages”.<br />
15 Press Release, 21 February 2007, available from MTN Press Release, at: www.mtn.co.za/?pid=9522&fullstory=382<br />
16 Page 4, Etisalat Annual Report 2005, available from: www.etisalat.ae/assets/CCD/<strong>Digital</strong>%20Press%20Office/<br />
Financial%20Informaiton/Etisalat%20E%20AR05.pdf.<br />
17 P. 109, Chap. 3: Telecommunications, <strong>The</strong> Communications Market 2006, available from: www.ofcom.org.uk/<br />
research/cm/cm06/. In relation to the UK broadband market, Chapter 3 notes that “in addition to widespread availability,<br />
consumers now have an increased choice of broadband service providers… Together with the cable operators<br />
and the fast-growing wireless broadband sector, consumers have never had more choice of broadband products,<br />
pricing packages and access platforms. This in turn has fuelled the growth of broadband take-up and consumption”,<br />
page 109.<br />
18 <strong>The</strong> first two figures are from Statistics Finland Household Budget Surveys (www.stat.fi/tk/el/kulutustutkimus/<br />
kulutust_t4_1.html), while the latter is from the following report commissioned by the European Commission:<br />
Eurobarometer, E-Communications Household Survey, July 2006.<br />
19 For more detail, see the OECD’s December 2006 broadband subscriber estimates at: www.oecd.org/document/7/<br />
0,2340,en_2649_34223_38446855_1_1_1_1,00.html.<br />
20 See for example, “Status of VoIP worldwide, 2006”, Background Paper prepared for the <strong>ITU</strong> workshop, “<strong>The</strong> Future of<br />
Voice”, 15-16 January 2007, available at: www.itu.int/osg/spu/ni/voice/papers/FoV-VoIP-Biggs-Draft.pdf.<br />
21 www.ghanatelecom.com.gh/gt_aboutus/newsdetails.asp?pnum=3&id=228&catid=0.<br />
22 www.lttnet.com/english/coming.php and www.lttnet.com/english/sr_libyadsl.php.<br />
23 www.lta.org.ls/Consultations/Tariffs/29012007_TL_ADSL.html<br />
24 Telecom Lesotho submission to LTA, Page 1, www.lta.org.ls/20070126082548627.pdf<br />
25 www.dot-com-alliance.org/newsletter/article.php?article_id=127<br />
26 See Maroc Telecom press release, 31 May 2006, available from: www.iam.ma/details.aspx?id=101 and www.iam.<br />
ma/fichiers/Maroc-Telecom-Communique-TVADSL-31mai06-VF(2).pdf.<br />
27 <strong>The</strong> Moroccan regulator, the Agence Nationale de Régulation des Télécommunications (ANRT), available in French<br />
from: www.anrt.net.ma/fr/and Balancing Act Africa, www.balancingact-africa.com/news/back/balancing-act_340.<br />
html.<br />
28 Annual report 2006, p.30, available atwww.qtel.com.qa/documents/ar/ANNUAL%20REPORT%20ENGLISH%202006.<br />
pdf.<br />
29 www.africaonline.com/country.news.php?mode=getitem&itemno=115&cid=12<br />
30 <strong>ITU</strong>, “Broadband as commodity: Hong Kong, China Internet case study”, April 2003, available at: www.itu.int/.<br />
31 “<strong>The</strong> slow death of dial-up”, <strong>The</strong> Economist, 8 March 2007, available at: www.economist.com/search/displaystory.<br />
cfm?story_id=E1_RSGGDSP.<br />
32 Australia, Israel, Japan, the Republic of Korea and the United States, Czech Republoc, New Zealand, Romania and<br />
Taiwan (China).<br />
33 Page 11, Vodacom Annual report 2006, available from the Vodacom Group website at: www.vodacom.com/vodacom/investor_relations/docs/Vodacom%202006%20AR%20Full.pdf.<br />
33 P. 12, Vodacom Annual report 2006, available from the Vodacom Group website at: www.vodacom.com/vodacom/<br />
investor_relations/docs/Vodacom%202006%20AR%20Full.pdf.<br />
54
Annex: Methodological Note on <strong>Digital</strong> <strong>Opportunity</strong> <strong>Index</strong><br />
<strong>The</strong> definitions of the core indicators used to compile the <strong>Digital</strong> <strong>Opportunity</strong> <strong>Index</strong> (<strong>DOI</strong>) are available from the Partnership<br />
for Measuring ICT for Development. <strong>The</strong> latest available data (year-end 2005) was used, except where noted otherwise.<br />
Where 2005 data were not available, later data was used for tariffs while for other indicators, earlier data was used or an<br />
estimate was made. This section identifies the methodology used to compile the indicators for this version of the <strong>DOI</strong>,<br />
including the time period of the data, and where necessary, the estimation technique.<br />
Indicator<br />
Percentage of population<br />
covered by mobile<br />
cellular telephony<br />
Internet access tariffs (20<br />
hours per month) as a<br />
percentage of per capita<br />
income<br />
Mobile cellular tariffs as a<br />
percentage of per capita<br />
income<br />
Proportion of households<br />
with a fixed line<br />
telephone<br />
Proportion of households<br />
with a computer<br />
Proportion of households<br />
with Internet access at<br />
home<br />
Mobile cellular<br />
subscribers per 100<br />
inhabitants<br />
Core<br />
code<br />
A-7<br />
A-8<br />
A-9<br />
HH-<br />
3<br />
HH-<br />
5<br />
HH-<br />
7<br />
A-2<br />
Mobile Internet<br />
subscribers A-<br />
4†<br />
Proportion of individuals<br />
that used the Internet<br />
Proportion of fixed<br />
broadband subscribers to<br />
total Internet subscribers<br />
Proportion of mobile<br />
broadband subscribers to<br />
total mobile subscribers<br />
HH-<br />
8<br />
A-<br />
5†<br />
A-<br />
5†<br />
Note<br />
<strong>The</strong> base year is 2005. This data is generally available from many mobile network operators.<br />
If national data are not available from an official source, the figure for the largest operator is<br />
used. In rare instances, this may understate actual coverage since different operators could<br />
cover different sections of the country. In the absence of data for a few countries, the percentage<br />
of the urban population is used on the assumption that it is less costly to install infrastructure<br />
in those areas and they have a greater number of potential clients that can afford<br />
service.<br />
<strong>The</strong> base year is 2006 since this is the latest year for which a complete set of comparable data<br />
is available. Data are based on the cheapest available package for 20 hours of use per month<br />
and do not include telephone line rental. <strong>The</strong> basket is divided by 2004 Gross National Income<br />
per capita (from the World Bank).<br />
<strong>The</strong> base year is 2005, since this is the latest year for which a complete set of comparable data<br />
is available. A monthly charge is compiled based on a basket of peak and off-peak and on-net,<br />
off-net and fixed calls. <strong>The</strong> basket is divided by 2004 Gross National Income per capita (from<br />
the World Bank).<br />
This indicator, which is based on 2005 data, should ideally be compiled from a household<br />
survey. If not available, administrative records can be used for the number of residential telephone<br />
lines divided by the number of households.<br />
This indicator, which is based on 2005 data, should be compiled from a household survey. If<br />
not available, data on the number of computers in the country could be used, adjusted for the<br />
estimated amount in homes. If that data is not available, then the data are estimated based on<br />
the per capita income of regional peers.<br />
This indicator, which is based on 2005 data, should be compiled from a household survey. I not<br />
available, data on the number of Internet subscriptions, adjusted for the estimated amount in<br />
homes, can be used. If that data is not available, then the data are estimated based on the per<br />
capita income of regional peers.<br />
<strong>The</strong> base year is 2005. Data are universally available for this indicator.<br />
<strong>The</strong> base year is 2005. Since mobile Internet access is relatively recent, many countries either<br />
do not report data on the number of subscribers or definitions vary.. <strong>The</strong>re are a variety of indicators<br />
used to reflect mobile Internet use. Some operators report the number of high-speed<br />
subscriptions and others report the number of subscriptions to their mobile portal services.<br />
Some users utilize mobile cellular networks to access the Internet using laptop computers.<br />
<strong>The</strong>re is little consensus as to whether these types of users should be considered fixed Internet<br />
subscribers or mobile Internet subscribers. Finally, the concept of Internet access is seriously<br />
challenged when including mobile, since the users’ experience is entirely different and<br />
many so-called mobile Internet users are not actually surfing websites per se but downloading<br />
logos and ring tones or sending picture messages. In general, either the number of Wireless<br />
Access Protocol (WAP), General Packet Radio Service (GPRS) or mobile portal subscribers<br />
is used. In the absence of data, estimates are based on the number of post-paid subscribers,<br />
the availability of mobile data networks (e.g., GPRS, EDGE, CDMA2000 or WCDMA) and regional<br />
trends.<br />
<strong>The</strong> base year is 2005. A growing number of countries have carried out surveys. In the absence<br />
of survey data, national estimates are used. If these are lacking, then estimates are derived<br />
from the number of subscribers.<br />
<strong>The</strong> base year is 2005. <strong>The</strong>re is a growing consensus that a service should be considered<br />
broadband only if it offers speeds of at least 256 kbit/s in at least one direction. Note that this<br />
indicator refers to ‘fixed‘ type of broadband access such as DSL, cable modem, Ethernet LAN,<br />
fibre optic and Fixed Wireless Access. This data set is generally complete for most countries<br />
that have broadband service.<br />
<strong>The</strong> base year is 2005. Mobile broadband subscribers refer to users of mobile networks providing<br />
speeds of at least 256 kbit/s in at least one direction. This data set is generally complete for<br />
countries that have mobile broadband service.<br />
Source: <strong>ITU</strong>/UNCTAD/KADO <strong>Digital</strong> <strong>Opportunity</strong> Platform.<br />
† = Derivation of core indicator<br />
World Information Society Report 2007<br />
55