800 Series Power Analyzer PowerVision⢠Instruction Manual
800 Series Power Analyzer PowerVision⢠Instruction Manual
800 Series Power Analyzer PowerVision⢠Instruction Manual

Create successful ePaper yourself
Turn your PDF publications into a flip-book with our unique Google optimized e-Paper software.
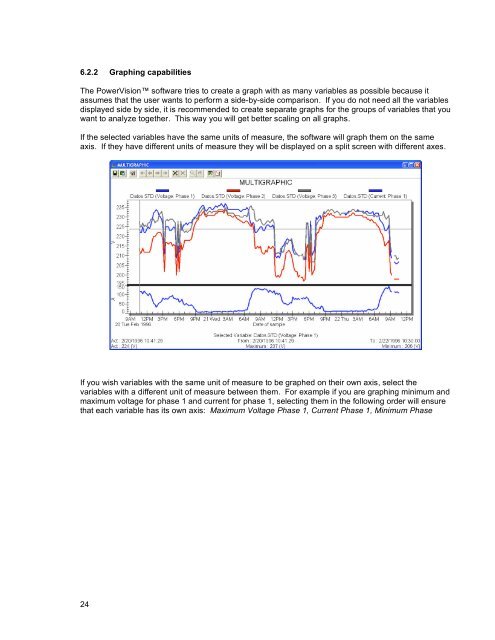
6.2.2 Graphing capabilities<br />
The <strong>Power</strong>Vision software tries to create a graph with as many variables as possible because it<br />
assumes that the user wants to perform a side-by-side comparison. If you do not need all the variables<br />
displayed side by side, it is recommended to create separate graphs for the groups of variables that you<br />
want to analyze together. This way you will get better scaling on all graphs.<br />
If the selected variables have the same units of measure, the software will graph them on the same<br />
axis. If they have different units of measure they will be displayed on a split screen with different axes.<br />
If you wish variables with the same unit of measure to be graphed on their own axis, select the<br />
variables with a different unit of measure between them. For example if you are graphing minimum and<br />
maximum voltage for phase 1 and current for phase 1, selecting them in the following order will ensure<br />
that each variable has its own axis: Maximum Voltage Phase 1, Current Phase 1, Minimum Phase<br />
24