TABLE OF CONTENTS List of Figures - IEA
TABLE OF CONTENTS List of Figures - IEA
TABLE OF CONTENTS List of Figures - IEA
You also want an ePaper? Increase the reach of your titles
YUMPU automatically turns print PDFs into web optimized ePapers that Google loves.
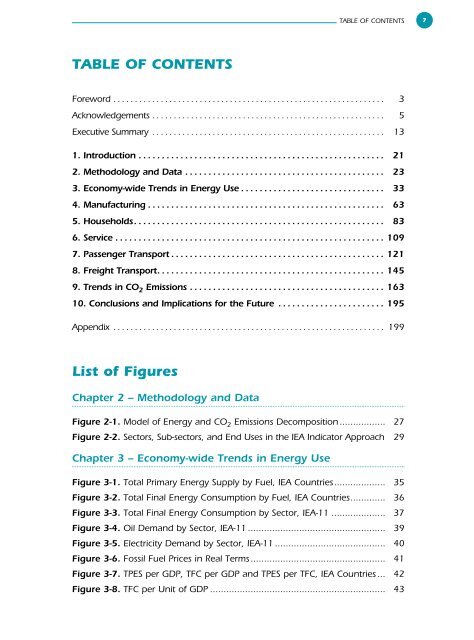
<strong>TABLE</strong> <strong>OF</strong> <strong>CONTENTS</strong> 7<br />
<strong>TABLE</strong> <strong>OF</strong> <strong>CONTENTS</strong><br />
Foreword ............................................................... 3<br />
Acknowledgements ...................................................... 5<br />
Executive Summary ...................................................... 13<br />
1. Introduction ..................................................... 21<br />
2. Methodology and Data ........................................... 23<br />
3. Economy-wide Trends in Energy Use ............................... 33<br />
4. Manufacturing ................................................... 63<br />
5. Households...................................................... 83<br />
6. Service .......................................................... 109<br />
7. Passenger Transport .............................................. 121<br />
8. Freight Transport................................................. 145<br />
9. Trends in CO 2 Emissions .......................................... 163<br />
10. Conclusions and Implications for the Future ....................... 195<br />
Appendix ............................................................... 199<br />
<strong>List</strong> <strong>of</strong> <strong>Figures</strong><br />
Chapter 2 – Methodology and Data<br />
Figure 2-1. Model <strong>of</strong> Energy and CO 2 Emissions Decomposition ................. 27<br />
Figure 2-2. Sectors, Sub-sectors, and End Uses in the <strong>IEA</strong> Indicator Approach 29<br />
Chapter 3 – Economy-wide Trends in Energy Use<br />
Figure 3-1. Total Primary Energy Supply by Fuel, <strong>IEA</strong> Countries................... 35<br />
Figure 3-2. Total Final Energy Consumption by Fuel, <strong>IEA</strong> Countries............. 36<br />
Figure 3-3. Total Final Energy Consumption by Sector, <strong>IEA</strong>-11 .................... 37<br />
Figure 3-4. Oil Demand by Sector, <strong>IEA</strong>-11 ................................................... 39<br />
Figure 3-5. Electricity Demand by Sector, <strong>IEA</strong>-11 ......................................... 40<br />
Figure 3-6. Fossil Fuel Prices in Real Terms.................................................. 41<br />
Figure 3-7. TPES per GDP, TFC per GDP and TPES per TFC, <strong>IEA</strong> Countries ... 42<br />
Figure 3-8. TFC per Unit <strong>of</strong> GDP ................................................................. 43
8 <strong>TABLE</strong> <strong>OF</strong> <strong>CONTENTS</strong><br />
Figure 3-9. Minimum and Maximum versus <strong>IEA</strong> -13 Average Values<br />
for Key Factors Affecting Energy Use......................................... 44<br />
Figure 3-10. Changes in TFC/GDP Decomposed into Changes in<br />
Energy Services/GDP and Intensity Effect ................................ 46<br />
Figure 3-11. Changes in TFC, GDP, Energy Service Demand and<br />
Intensities, <strong>IEA</strong>-11.................................................................... 48<br />
Figure 3-12. TFC per GDP, and Impacts from Changes in Energy Services<br />
per GDP and Energy Intensities, <strong>IEA</strong>-11................................... 49<br />
Figure 3-13. Changes in TFC, GDP, TFC/GDP, Energy Services/GDP,<br />
and Intensity Effect, 1994-1998 .............................................. 50<br />
Figure 3-14. Changes in the Ratio <strong>of</strong> Key Sub-sectoral Activity Levels to GDP 51<br />
Figure 3-15. Sector Intensities and Total Economy Effect, <strong>IEA</strong>-11................. 53<br />
Figure 3-16. Actual Energy Use and Hypothetical Energy Use<br />
without Intensity Reductions, <strong>IEA</strong>-11 ....................................... 54<br />
Figure 3-17. Actual Energy Use in 1990 and 1998 and Two Hypothetical<br />
Energy Savings Cases, <strong>IEA</strong>-11.................................................. 55<br />
Figure 3-18. Changes in Economy-Wide Energy Intensity Effect .................. 57<br />
Figure 3-19. Changes in Energy Service Demand, Intensity Effect<br />
and Actual Energy Use ........................................................... 58<br />
Figure 3-20. Actual Energy Use and Energy Savings ................................... 60<br />
Figure 3-21. Contribution to Energy Savings from Sectors and End Uses..... 61<br />
Chapter 4 – Manufacturing<br />
Figure 4-1. Manufacturing Energy Use by Fuel, <strong>IEA</strong> Countries..................... 65<br />
Figure 4-2. Energy Use by Manufacturing Sub-Sector, <strong>IEA</strong>-11 ...................... 66<br />
Figure 4-3. Manufacturing Output, Shares <strong>of</strong> Manufacturing in GDP<br />
and <strong>of</strong> Raw Materials in Manufacturing Output, <strong>IEA</strong>-11 ............. 67<br />
Figure 4-4. Shares <strong>of</strong> Manufacturing Value-added in Total GDP<br />
and Raw Materials in Total Manufacturing Value-added ............ 68<br />
Figure 4-5. Energy Use per Unit <strong>of</strong> Manufacturing Value-added.................. 69<br />
Figure 4-6. Sub-sector Energy Intensities, Value-added and Energy Shares,<br />
<strong>IEA</strong>-11....................................................................................... 70<br />
Figure 4-7. Decomposition <strong>of</strong> Changes in Manufacturing Energy Use,<br />
1973 - 1998.............................................................................. 71<br />
Figure 4-8. Decomposition <strong>of</strong> Changes in Manufacturing Energy Use, <strong>IEA</strong>-11 72<br />
Figure 4-9. Decomposition <strong>of</strong> Changes in Manufacturing Energy Use,<br />
1994-1998................................................................................ 73<br />
Figure 4-10. Manufacturing Energy Intensity Adjusted for Structural Changes 75
<strong>TABLE</strong> <strong>OF</strong> <strong>CONTENTS</strong> 9<br />
Figure 4-11. Evolution <strong>of</strong> Sub-sector Energy Intensities, <strong>IEA</strong>-11.................... 76<br />
Figure 4-12. Reduction in Energy Use from Changes in Structure and<br />
Intensities, <strong>IEA</strong>-11.................................................................... 77<br />
Figure 4-13. Real Prices for Industrial Light Fuel Oil .................................... 78<br />
Figure 4-14. Share <strong>of</strong> Energy Expenditures in Sub-sector Intermediate<br />
Product Costs.......................................................................... 79<br />
Figure 4-15. Decomposition <strong>of</strong> Energy Costs per Value-added for<br />
Primary Metals Production....................................................... 81<br />
Chapter 5 – Households<br />
Figure 5-1. Residential Energy Use by Fuel, <strong>IEA</strong>-11...................................... 86<br />
Figure 5-2. Residential Energy Use by End Use, <strong>IEA</strong>-11 ............................... 87<br />
Figure 5-3. Energy Use per Capita by End Use, Actual versus<br />
Normalised to Common Climate................................................ 88<br />
Figure 5-4. Space Heating Energy Use per Capita, Actual versus<br />
Normalised to Common Climate................................................ 90<br />
Figure 5-5. House Area per Capita and Personal Consumption<br />
Expenditures, 1970-1998.......................................................... 92<br />
Figure 5-6. Share <strong>of</strong> Space Heating by Fuel................................................. 95<br />
Figure 5-7. Ratio <strong>of</strong> Final Energy to Useful Energy for Space Heating.......... 96<br />
Figure 5-8. Useful Space Heating Intensity .................................................. 97<br />
Figure 5-9. Decomposition <strong>of</strong> Changes in per Capita Space Heating,<br />
1973-1998................................................................................ 98<br />
Figure 5-10. Residential Electricity Demand by End Use, <strong>IEA</strong>-11 .................. 99<br />
Figure 5-11. Share <strong>of</strong> Total Electricity Use for Miscellaneous Appliances ...... 101<br />
Figure 5-12. Decomposition <strong>of</strong> Changes in Total Residential Energy Use,<br />
<strong>IEA</strong>-11..................................................................................... 102<br />
Figure 5-13. Actual Climate-Corrected Energy Use and Hypothetical<br />
Energy Use without Intensity Reductions, <strong>IEA</strong>-11..................... 103<br />
Figure 5-14. Residential Electricity Prices in Real Terms, Including Taxes ...... 104<br />
Figure 5-15. Electricity Prices and Fuel-weighted Price per Unit <strong>of</strong><br />
Useful Space Heat, 1998......................................................... 105<br />
Figure 5-16. Shares <strong>of</strong> Residential Energy Expenditures by End Use............ 106<br />
Figure 5-17. Share <strong>of</strong> Residential Energy Expenditures in Total Personal<br />
Consumption Expenditures ..................................................... 107<br />
Figure 5-18. Decomposition <strong>of</strong> Changes in Residential Energy<br />
Expenditures per Unit <strong>of</strong> Income............................................. 108
10 <strong>TABLE</strong> <strong>OF</strong> <strong>CONTENTS</strong><br />
Chapter 6 – Service<br />
Figure 6-1. Energy Use in Service Sector by Fuel, <strong>IEA</strong>-11 ............................. 111<br />
Figure 6-2. Share <strong>of</strong> Service Sector in Total GDP.......................................... 112<br />
Figure 6-3. Service Sector Floor Area per Capita and Value-added<br />
per Capita, 1970-1999.............................................................. 113<br />
Figure 6-4. Service Sector Electricity Use per Capita and Value-added<br />
per Capita, 1970-1999.............................................................. 114<br />
Figure 6-5. Energy Use per Service Sector Value-Added .............................. 115<br />
Figure 6-6. Electricity and Fuel Use per Unit <strong>of</strong> Floor Area .......................... 116<br />
Figure 6-7. Decomposition <strong>of</strong> Changes in Service Sector Energy Use, <strong>IEA</strong>-11 . 117<br />
Figure 6-8. Actual Energy Use and Hypothetical Energy Use without<br />
Intensity Reductions, <strong>IEA</strong>-11 ...................................................... 118<br />
Figure 6-9. Service Sector Energy Expenditures Relative to Value-Added ..... 119<br />
Chapter 7 – Passenger Transport<br />
Figure 7-1. Energy Use in Passenger Transport by Mode, <strong>IEA</strong>-11................. 123<br />
Figure 7-2. Passenger Travel per Capita, all Modes...................................... 124<br />
Figure 7-3. Passenger Travel by Mode (Passenger-km/Capita)...................... 126<br />
Figure 7-4. Modal Share <strong>of</strong> Passenger Travel (Passenger-km) ....................... 127<br />
Figure 7-5. Energy per Passenger-kilometre by Mode, <strong>IEA</strong>-11 ...................... 128<br />
Figure 7-6. Car Ownership (Cars per Capita) ............................................... 130<br />
Figure 7-7. Car Ownership per Capita and Personal Consumption<br />
Expenditures, 1970 - 2000........................................................ 131<br />
Figure 7-8. Car-kilometres per Capita and Personal Consumption<br />
Expenditures, 1970 – 2000....................................................... 132<br />
Figure 7-9. Annual kilometres per Vehicle ................................................... 133<br />
Figure 7-10. Car Stock-average Fuel Intensity.............................................. 134<br />
Figure 7-11. Trends in New Car Fuel Intensity ............................................ 135<br />
Figure 7-12. Trends in Retail Gasoline Prices in Real Terms, Including Taxes 137<br />
Figure 7-13. Fuel Cost per Vehicle-km for Cars (Real Terms, Including Taxes) 138<br />
Figure 7-14. Car Fuel Use per Capita versus Average Fuel Price, 1998 ........ 139<br />
Figure 7-15. Passenger Car Travel per Capita and Car Fuel Intensity<br />
versus Average Fuel Price, 1998 ............................................. 140<br />
Figure 7-16. Decomposition <strong>of</strong> Changes in Car Energy Use per Capita,<br />
1973-1998.............................................................................. 141<br />
Figure 7-17. Decomposition <strong>of</strong> Changes in Passenger Transport<br />
Energy Use, <strong>IEA</strong>-11 ................................................................. 142
<strong>TABLE</strong> <strong>OF</strong> <strong>CONTENTS</strong> 11<br />
Figure 7-18. Decomposition <strong>of</strong> Changes in Passenger Transport<br />
Energy Use, 1973-1998 .......................................................... 143<br />
Figure 7-19. Actual Energy Use and Hypothetical Energy Use without<br />
Intensity Reductions, <strong>IEA</strong>-11 .................................................... 144<br />
Chapter 8 – Freight Transport<br />
Figure 8-1. Energy Use in Freight Transport by Mode, <strong>IEA</strong>-11 ..................... 147<br />
Figure 8-2. Freight Transport Tonne-kilometres per Capita and by Mode..... 148<br />
Figure 8-3. Freight Transport Tonne-kilometres per Unit <strong>of</strong> GDP and by Mode 149<br />
Figure 8-4. Freight Transport Energy per Tonne-kilometre Aggregated<br />
for all Modes............................................................................. 150<br />
Figure 8-5. Freight Transport Energy per Tonne-kilometre by Mode, 1998 .. 151<br />
Figure 8-6. Truck Freight Tonne-kilometres per GDP.................................... 153<br />
Figure 8-7. Truck Freight Tonne-kilometres per Capita versus GDP<br />
per Capita, 1973-2000.............................................................. 154<br />
Figure 8-8. Energy Intensity for Trucks ........................................................ 155<br />
Figure 8-9. Truck Average Load per Vehicle ................................................ 156<br />
Figure 8-10. Decomposition <strong>of</strong> Changes in Truck Energy Use, 1973-1998 .. 157<br />
Figure 8-11. Decomposition <strong>of</strong> Changes in Truck Energy Intensity, 1973-1998 . 158<br />
Figure 8-12. Decomposition <strong>of</strong> Changes in Freight Energy Use, all Modes,<br />
<strong>IEA</strong>-11..................................................................................... 159<br />
Figure 8-13. Decomposition <strong>of</strong> Changes in Freight Energy Use, 1973-1998. 160<br />
Figure 8-14. Actual Energy Use and Hypothetical Energy Use<br />
without Intensity Reductions, <strong>IEA</strong>-11 ....................................... 161<br />
Chapter 9 - Trends in CO 2 Emissions<br />
Figure 9-1. Global CO 2 Emissions................................................................ 165<br />
Figure 9-2. CO 2 Emissions per Capita ......................................................... 166<br />
Figure 9-3. CO 2 Emissions per GDP ............................................................ 167<br />
Figure 9-4. CO 2 Emissions per GDP and Sector, 1998 ................................. 168<br />
Figure 9-5. Average Annual Change in CO 2 Emissions per GDP, Historical<br />
and as Implied by the Kyoto Targets ......................................... 171<br />
Figure 9-6. Decomposition <strong>of</strong> Changes in CO 2 Emissions per GDP, <strong>IEA</strong>-11 .. 172<br />
Figure 9-7. Decomposition <strong>of</strong> Changes in CO 2 Emissions, <strong>IEA</strong>-11 ................ 174<br />
Figure 9-8. Changes in CO 2 Emissions by Sector and Emission Shares<br />
by Sector, <strong>IEA</strong>-11....................................................................... 176<br />
Figure 9-9. CO 2 Emissions per Total Manufacturing Value-added ................ 177
12 <strong>TABLE</strong> <strong>OF</strong> <strong>CONTENTS</strong><br />
Figure 9-10. Decomposition <strong>of</strong> Changes in Manufacturing CO 2 Emissions,<br />
<strong>IEA</strong>-11..................................................................................... 178<br />
Figure 9-11. Service Sector CO 2 Emissions per Value-added ........................ 180<br />
Figure 9-12. Decomposition <strong>of</strong> Changes in Service Sector CO 2 Emissions,<br />
<strong>IEA</strong>-11..................................................................................... 181<br />
Figure 9-13. Residential CO 2 Emissions per Capita ...................................... 183<br />
Figure 9-14. Decomposition <strong>of</strong> Changes in Residential CO 2 Emissions, <strong>IEA</strong>-11. 184<br />
Figure 9-15. Passenger Transport CO 2 Emissions per Capita........................ 186<br />
Figure 9-16. Decomposition <strong>of</strong> Changes in Passenger Transport<br />
CO 2 Emissions, <strong>IEA</strong>-11............................................................. 187<br />
Figure 9-17. Freight CO 2 Emissions per GDP .............................................. 189<br />
Figure 9-18. Decomposition <strong>of</strong> Changes in Freight CO 2 Emissions, <strong>IEA</strong>-11 .. 190<br />
Figure 9-19. Actual CO 2 Emissions versus Emissions without CO 2 Intensity<br />
Reductions, <strong>IEA</strong>-11 .................................................................. 192<br />
Figure 9-20. Actual CO 2 Emissions versus Emissions without CO 2 Intensity<br />
Reductions, 1998.................................................................... 193<br />
<strong>List</strong> <strong>of</strong> Tables<br />
Table 2-1. Summary <strong>of</strong> Variables Used in the <strong>IEA</strong> Energy Decomposition<br />
Methodology.............................................................................. 24<br />
Table 5-1. Trends in Dwelling Area and Occupancy, 1973-1998 ................. 93<br />
Table 5-2. Ownership and Unit Energy Consumption <strong>of</strong> Refrigerators<br />
and Refrigerator/freezers ............................................................ 100<br />
Table 9-1. Changes in CO 2 Emissions from Fuel Combustion and<br />
Kyoto Targets ............................................................................. 170<br />
Table 9-2. Decomposition <strong>of</strong> Changes in CO 2 Emissions per GDP................ 173<br />
Table 9-3. Decomposition <strong>of</strong> Changes in CO 2 Emissions.............................. 175<br />
Table 9-4. Decomposition <strong>of</strong> Changes in Manufacturing CO 2 Emissions ...... 179<br />
Table 9-5. Decomposition <strong>of</strong> Changes in Service Sector CO 2 Emissions........ 182<br />
Table 9-6. Decomposition <strong>of</strong> Changes in Residential CO 2 Emissions ............ 185<br />
Table 9-7. Decomposition <strong>of</strong> Changes in Passenger Transport CO 2 Emissions 188<br />
Table 9-8. Decomposition <strong>of</strong> Changes in Freight CO 2 Emissions.................. 191


