Farm Level and Environmental Impacts of Farmer Field Schools in ...
Farm Level and Environmental Impacts of Farmer Field Schools in ...
Farm Level and Environmental Impacts of Farmer Field Schools in ...
You also want an ePaper? Increase the reach of your titles
YUMPU automatically turns print PDFs into web optimized ePapers that Google loves.
Work<strong>in</strong>g Paper 2006 No. 7<br />
Development <strong>and</strong> Agricultural Economics<br />
Faculty <strong>of</strong> Economics <strong>and</strong> Management<br />
University <strong>of</strong> Hannover, Germany<br />
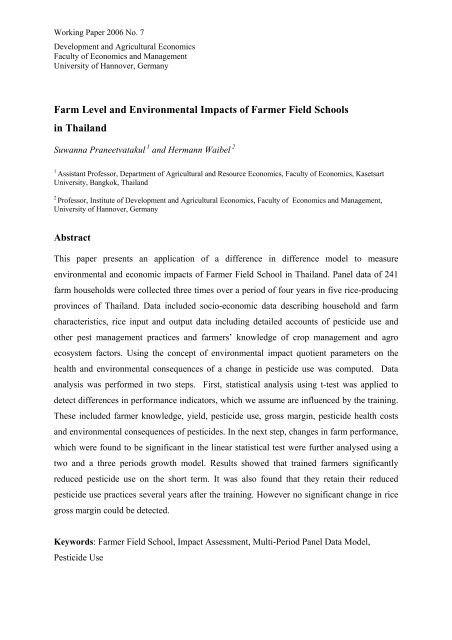
<strong>Farm</strong> <strong>Level</strong> <strong>and</strong> <strong>Environmental</strong> <strong>Impacts</strong> <strong>of</strong> <strong>Farm</strong>er <strong>Field</strong> <strong>Schools</strong><br />
<strong>in</strong> Thail<strong>and</strong><br />
Suwanna Praneetvatakul 1 <strong>and</strong> Hermann Waibel 2<br />
1<br />
Assistant Pr<strong>of</strong>essor, Department <strong>of</strong> Agricultural <strong>and</strong> Resource Economics, Faculty <strong>of</strong> Economics, Kasetsart<br />
University, Bangkok, Thail<strong>and</strong><br />
2<br />
Pr<strong>of</strong>essor, Institute <strong>of</strong> Development <strong>and</strong> Agricultural Economics, Faculty <strong>of</strong> Economics <strong>and</strong> Management,<br />
University <strong>of</strong> Hannover, Germany<br />
Abstract<br />
This paper presents an application <strong>of</strong> a difference <strong>in</strong> difference model to measure<br />
environmental <strong>and</strong> economic impacts <strong>of</strong> <strong>Farm</strong>er <strong>Field</strong> School <strong>in</strong> Thail<strong>and</strong>. Panel data <strong>of</strong> 241<br />
farm households were collected three times over a period <strong>of</strong> four years <strong>in</strong> five rice-produc<strong>in</strong>g<br />
prov<strong>in</strong>ces <strong>of</strong> Thail<strong>and</strong>. Data <strong>in</strong>cluded socio-economic data describ<strong>in</strong>g household <strong>and</strong> farm<br />
characteristics, rice <strong>in</strong>put <strong>and</strong> output data <strong>in</strong>clud<strong>in</strong>g detailed accounts <strong>of</strong> pesticide use <strong>and</strong><br />
other pest management practices <strong>and</strong> farmers’ knowledge <strong>of</strong> crop management <strong>and</strong> agro<br />
ecosystem factors. Us<strong>in</strong>g the concept <strong>of</strong> environmental impact quotient parameters on the<br />
health <strong>and</strong> environmental consequences <strong>of</strong> a change <strong>in</strong> pesticide use was computed. Data<br />
analysis was performed <strong>in</strong> two steps. First, statistical analysis us<strong>in</strong>g t-test was applied to<br />
detect differences <strong>in</strong> performance <strong>in</strong>dicators, which we assume are <strong>in</strong>fluenced by the tra<strong>in</strong><strong>in</strong>g.<br />
These <strong>in</strong>cluded farmer knowledge, yield, pesticide use, gross marg<strong>in</strong>, pesticide health costs<br />
<strong>and</strong> environmental consequences <strong>of</strong> pesticides. In the next step, changes <strong>in</strong> farm performance,<br />
which were found to be significant <strong>in</strong> the l<strong>in</strong>ear statistical test were further analysed us<strong>in</strong>g a<br />
two <strong>and</strong> a three periods growth model. Results showed that tra<strong>in</strong>ed farmers significantly<br />
reduced pesticide use on the short term. It was also found that they reta<strong>in</strong> their reduced<br />
pesticide use practices several years after the tra<strong>in</strong><strong>in</strong>g. However no significant change <strong>in</strong> rice<br />
gross marg<strong>in</strong> could be detected.<br />
Keywords: <strong>Farm</strong>er <strong>Field</strong> School, Impact Assessment, Multi-Period Panel Data Model,<br />
Pesticide Use
1. Introduction<br />
Projects on farmer tra<strong>in</strong><strong>in</strong>g <strong>in</strong> Integrated Pest Management (IPM) <strong>in</strong> develop<strong>in</strong>g countries<br />
us<strong>in</strong>g the <strong>Farm</strong>er <strong>Field</strong> School (FFS) approach are still widely implemented by donor<br />
organizations <strong>in</strong>clud<strong>in</strong>g for example the World Bank. This is <strong>in</strong> spite <strong>of</strong> criticism that such<br />
projects are fiscally unsusta<strong>in</strong>able (Quizon et al 2001) <strong>and</strong> are not always effective <strong>in</strong><br />
chang<strong>in</strong>g pest management practices or <strong>in</strong> improv<strong>in</strong>g farm performance (Feder et al 2003) <strong>and</strong><br />
have only limited diffusion effects (Rola et al 2002, Feder et al 2004, Tripp et al 2005). On<br />
the other h<strong>and</strong> it was shown that FFS can improve farmer knowledge <strong>in</strong> pest identification<br />
<strong>and</strong> improve their ecosystems underst<strong>and</strong><strong>in</strong>g (Godtl<strong>and</strong> et al 2004, van den Berg 2004, Tripp<br />
et al 2005). Also it was found that public <strong>in</strong>vestments <strong>in</strong> <strong>in</strong>tegrated pest management<br />
programs on cotton <strong>in</strong> several Asia countries showed good rates <strong>of</strong> return (Erickson 2003, Ooi<br />
et al 2005) Moreover, <strong>in</strong> Ch<strong>in</strong>a, where bollworm-resistant transgenic cotton varieties have<br />
been widely <strong>in</strong>troduced, FFS was found to be effective <strong>in</strong> help<strong>in</strong>g to realize the potential <strong>of</strong><br />
pesticide reduction that Bt varieties <strong>of</strong>fer (Yang et al 2005).<br />
A common facet <strong>of</strong> past impact analyses <strong>of</strong> <strong>Farm</strong>er <strong>Field</strong> School projects is that data were<br />
be<strong>in</strong>g used that did not allow the def<strong>in</strong>ition <strong>of</strong> good counterfactual scenarios because no<br />
control area was available or only <strong>in</strong>sufficient basel<strong>in</strong>e data existed. Also comparisons were<br />
based on only two observation po<strong>in</strong>ts before <strong>and</strong> after the tra<strong>in</strong><strong>in</strong>g. In addition, most <strong>of</strong> these<br />
studies concentrated on simple performance parameters like knowledge, pesticide use <strong>and</strong><br />
yield but did not <strong>in</strong>clude for example impact on the environment. In this paper we use a set <strong>of</strong><br />
panel data that were collected over a period <strong>of</strong> four years cover<strong>in</strong>g at maximum <strong>of</strong> 10 ricegrow<strong>in</strong>g<br />
seasons from three groups <strong>of</strong> farmers. The analysis presented here is an advancement<br />
<strong>of</strong> an earlier study that looked at the short-term impact <strong>of</strong> FFS <strong>in</strong> Thail<strong>and</strong> (Praneetvatakul<br />
<strong>and</strong> Waibel 2003).<br />
2. Data <strong>and</strong> impact <strong>in</strong>dicators<br />
Data were collected <strong>in</strong> five pilot sites on <strong>Farm</strong>er <strong>Field</strong> <strong>Schools</strong> <strong>of</strong> the Department <strong>of</strong><br />
Agricultural Extension (DOAE) <strong>in</strong> Thail<strong>and</strong>. The sample <strong>in</strong>cluded 241 farmers <strong>and</strong> was<br />
composed <strong>of</strong> three groups <strong>of</strong> farmers: (1) tra<strong>in</strong><strong>in</strong>g participants (FFS farmers), on average 20<br />
farmers per FFS; (2) 15 exposed farmers, per FFS village (non FFS) ; (3) 15 unexposed<br />
farmers, r<strong>and</strong>omly selected from a control village located near-by a FFS village (control<br />
farmers). The control villages had similar socio-economic <strong>and</strong> natural production conditions<br />
but only a m<strong>in</strong>imal possibility <strong>of</strong> <strong>in</strong>formation exchange with the respective FFS village<br />
Development <strong>and</strong> Agricultural Economics - Work<strong>in</strong>g Paper 2006 /07 1
existed 1 . The farmers were <strong>in</strong>terviewed at three different po<strong>in</strong>ts <strong>of</strong> time: (1) <strong>in</strong> February 2000<br />
at the end <strong>of</strong> the wet rice-cropp<strong>in</strong>g season, which was before the tra<strong>in</strong><strong>in</strong>g had started (2) <strong>in</strong><br />
February 2001, <strong>in</strong> the rice grow<strong>in</strong>g the season after the tra<strong>in</strong><strong>in</strong>g, i.e. where farmers could<br />
apply their new knowledge for the first time <strong>and</strong> (3) <strong>in</strong> February 2003, two years after the<br />
second survey. Thus, tra<strong>in</strong>ed farmers had the opportunity to apply their new knowledge <strong>in</strong><br />
four to eight rice grow<strong>in</strong>g seasons after the tra<strong>in</strong><strong>in</strong>g, depend<strong>in</strong>g on the <strong>in</strong>tensity <strong>of</strong> rice<br />
production, which varied <strong>in</strong> the five pilot villages. Unfortunately for the third survey the<br />
sample size had to be reduced because <strong>of</strong> heavy flood<strong>in</strong>g <strong>in</strong> two FFS villages..<br />
The questionnaire <strong>in</strong>cluded <strong>in</strong>formation on farm household characteristics, farmer<br />
knowledge on rice pest management, data on rice production <strong>in</strong>puts <strong>and</strong> outputs, <strong>and</strong><br />
questions on health issues related to pesticide use. Particular emphasis was given to a detailed<br />
account <strong>of</strong> pesticide use regard<strong>in</strong>g quantity, common <strong>and</strong> br<strong>and</strong> name, active <strong>in</strong>gredients <strong>and</strong><br />
formulation.<br />
To assess impact <strong>of</strong> FFS we def<strong>in</strong>ed several impact <strong>in</strong>dicators. First, we measured<br />
farmers’ knowledge <strong>of</strong> rice <strong>and</strong> pest management. A score was constructed from a set <strong>of</strong><br />
knowledge questions developed <strong>in</strong> cooperation with national IPM experts. Second, total rice<br />
yields per farm <strong>in</strong>clud<strong>in</strong>g sales <strong>and</strong> home consumption were based on farmers’ estimates <strong>and</strong><br />
divided by the respective area planted to rice. Third, the amount spent on pesticides <strong>in</strong>clud<strong>in</strong>g<br />
<strong>in</strong>secticides, molluscisides (chemicals used to kill snails), fungicides <strong>and</strong> herbicides were<br />
calculated <strong>in</strong> $ per ha. Fourth, the gross marg<strong>in</strong> <strong>of</strong> rice production <strong>in</strong> $ per ha, measured as<br />
total revenue above total variable costs exclud<strong>in</strong>g the value <strong>of</strong> family labor. Fifth, as a<br />
measure <strong>of</strong> net farm benefit we deducted health costs from chemical pesticide use from the<br />
gross marg<strong>in</strong>. . For health costs were accounted for by us<strong>in</strong>g a ratio <strong>of</strong> pesticide costs to health<br />
costs <strong>of</strong> 1:1 based on the results <strong>of</strong> study <strong>of</strong> Rola <strong>and</strong> P<strong>in</strong>gali (1993). F<strong>in</strong>ally, the<br />
<strong>Environmental</strong> Impact Quotient (EIQ) was calculated to quantify the environmental <strong>and</strong><br />
health impacts <strong>of</strong> pesticides by means <strong>of</strong> an <strong>in</strong>dex (Kovach, et al 1992). The EIQ <strong>in</strong>dex<br />
provides a measure <strong>of</strong> the side effects <strong>of</strong> pesticides by differentiates accord<strong>in</strong>g to crop type,<br />
pesticide type, quantity <strong>and</strong> toxicity to pesticide applicators, toxicity to consumer <strong>and</strong> toxicity<br />
to the ecological environment. The <strong>in</strong>dex sums up all pesticides used by a farmer hence a<br />
higher EIQ number <strong>in</strong>dicates a higher risk to health <strong>and</strong> environment.<br />
1 The control villages had for example different market places than the FFS villages<br />
Development <strong>and</strong> Agricultural Economics - Work<strong>in</strong>g Paper 2006 /07 2
3. The Model<br />
The analysis applies a difference <strong>in</strong> difference (DD) model (Greene, 2000). DD models can be<br />
used to analyse changes <strong>in</strong> farm performance such as pesticide use, yield <strong>and</strong> pr<strong>of</strong>it. In our<br />
analysis we proceeded <strong>in</strong> two steps. First we <strong>in</strong>vestigated l<strong>in</strong>ear shifts <strong>in</strong> performance <strong>and</strong><br />
second we measured change as a growth process. The l<strong>in</strong>ear shift implies a one-<strong>of</strong>f<br />
performance change at the observation po<strong>in</strong>t relative to the basel<strong>in</strong>e period. The change <strong>in</strong> the<br />
growth rate takes account <strong>of</strong> the fact that the development process <strong>in</strong>fluences performance <strong>and</strong><br />
thus assumes an exponential path <strong>in</strong> the rate <strong>of</strong> change for tra<strong>in</strong>ed <strong>and</strong> untra<strong>in</strong>ed farmers.<br />
Hence the model accounts for the fact that change is tak<strong>in</strong>g place even without the FFS<br />
tra<strong>in</strong><strong>in</strong>g. The l<strong>in</strong>ear shift was measured by apply<strong>in</strong>g a paired t-test (Anderson, Sweeney <strong>and</strong><br />
Williams, 2002), to test for the differences between before <strong>and</strong> after tra<strong>in</strong><strong>in</strong>g for FFS, non-<br />
FFS <strong>and</strong> control farmers. For those performance <strong>in</strong>dicators where we f<strong>in</strong>d a significant l<strong>in</strong>ear<br />
shift we proceed with the two <strong>and</strong> three periods growth model. The rationale for this<br />
procedure is that we do not expect significant results as we <strong>in</strong>crease the degree <strong>of</strong> rigor <strong>in</strong> the<br />
test<strong>in</strong>g procedure, i.e. if we do not get a significant difference <strong>in</strong> the t-test, we cannot expect a<br />
significant coefficient <strong>in</strong> an econometric growth model. S<strong>in</strong>ce we have three observation<br />
po<strong>in</strong>ts over time we can apply two alternative models: a two period <strong>and</strong> a three period panel<br />
data model. With the three period model a simultaneous estimation <strong>of</strong> the time period effects<br />
is achieved us<strong>in</strong>g a larger sample.<br />
In apply<strong>in</strong>g this model we draw upon <strong>and</strong> exp<strong>and</strong> the procedure developed by Feder et al<br />
(2003) used to measur<strong>in</strong>g impact <strong>of</strong> IPM <strong>in</strong> Indonesia. Accord<strong>in</strong>gly the change <strong>in</strong> farmers’<br />
performance (e.g. yield) through tra<strong>in</strong><strong>in</strong>g can be modeled as an exponential growth process.<br />
This is displayed <strong>in</strong> equation 1:<br />
{ α + βDnffs<br />
+ μD<br />
ffs + γΔX<br />
+ δΔZ<br />
}<br />
Y1 = Y0<br />
⋅e<br />
(1)<br />
where:<br />
Y 1<br />
Y 0<br />
α<br />
μ<br />
rice yield after the tra<strong>in</strong><strong>in</strong>g,<br />
rice yield before the tra<strong>in</strong><strong>in</strong>g,<br />
coefficient for yield growth before the tra<strong>in</strong><strong>in</strong>g,<br />
rate <strong>of</strong> yield growth <strong>of</strong> FFS farmers after the tra<strong>in</strong><strong>in</strong>g,<br />
β<br />
D ffs<br />
D nffs<br />
rate <strong>of</strong> yield growth rate for the non-FFS farmers after tra<strong>in</strong><strong>in</strong>g,<br />
dummy variable for FFS farmers, for FFS = 1 <strong>and</strong> zero = otherwise,<br />
dummy variable for non-FFS farmers, for non FFS = 1 <strong>and</strong> zero = FFS <strong>and</strong><br />
control,<br />
Development <strong>and</strong> Agricultural Economics - Work<strong>in</strong>g Paper 2006 /07 3
X<br />
Z<br />
γ <strong>and</strong> δ<br />
Δ<br />
℮<br />
vector <strong>of</strong> farmer characteristics,<br />
vector <strong>of</strong> village characteristics,<br />
correspond<strong>in</strong>g coefficients <strong>of</strong> these vectors,<br />
the differenc<strong>in</strong>g operator between before <strong>and</strong> after the tra<strong>in</strong><strong>in</strong>g,<br />
the exponential operator.<br />
The specification for an empirical estimation <strong>of</strong> the model can be obta<strong>in</strong>ed by tak<strong>in</strong>g the<br />
natural log <strong>of</strong> equation (1) <strong>and</strong> rearrang<strong>in</strong>g it accord<strong>in</strong>gly:<br />
( Y ) = α + βD<br />
+ μD<br />
+ γΔX<br />
+ δΔZ<br />
Δ ln (2)<br />
nffs<br />
where: Δ ( lnY<br />
) = ( lnY<br />
− Y )<br />
ffs<br />
1<br />
ln<br />
0<br />
Unlike <strong>in</strong> models that are based on cross sectional data, panel data allow for the unobserved<br />
effects, a i , to be correlated with the explanatory variables (Wooldridge, 2000) This is because<br />
a i is assumed to be constant over time, hence one can compute the difference <strong>in</strong> the observed<br />
parameters over the two years.<br />
The equations for period 2 (eq 3) <strong>and</strong> period 1 (eq 4) are as follows:<br />
Y δ +<br />
(3)<br />
i 2<br />
= (<br />
0<br />
+ α ) + γ<br />
2<br />
X<br />
i 2<br />
+ a<br />
i<br />
u<br />
i 2<br />
Y = δ + γ X + a + u<br />
(4)<br />
i1 0 1 i1<br />
i i1<br />
Subtract<strong>in</strong>g the equation (4) from equation (3) results:<br />
ΔY<br />
i<br />
= α + γΔX<br />
+ Δu<br />
(5)<br />
i<br />
i<br />
where:<br />
Δ denotes the change from period 1 (t=1) to period 2 (t=2), Y i is the dependent variable,<br />
X i are <strong>in</strong>dependent variables <strong>and</strong> U i is the error term. The unobserved effect, a i , does not<br />
appear s<strong>in</strong>ce it has been differenced away. The result<strong>in</strong>g <strong>in</strong>tercept (α ) denotes the change <strong>in</strong><br />
the <strong>in</strong>tercept between the two periods.<br />
Extend<strong>in</strong>g the analysis to three periods (t= 1,2, <strong>and</strong> 3), the procedure is analogous as<br />
shown <strong>in</strong> equation (6):<br />
Y = δ ... γ +<br />
it<br />
1<br />
+ δ<br />
2d<br />
2t<br />
+ δ<br />
3d3t<br />
+ γ<br />
1X<br />
it1<br />
+ +<br />
k<br />
X<br />
itk<br />
+ ai<br />
uit<br />
(6)<br />
Equation (6) <strong>in</strong>cludes dummies for two periods, d2 <strong>and</strong> d3. The <strong>in</strong>tercept for the first period is<br />
δ<br />
1<br />
for the second period it is<br />
1<br />
δ<br />
2<br />
δ + . For period three the def<strong>in</strong>ition <strong>of</strong> <strong>in</strong>tercept is<br />
analogous. In the t=3 case, time period one is subtracted from time period two <strong>and</strong> time period<br />
two from time period three result<strong>in</strong>g <strong>in</strong> Eq 7:<br />
ΔY<br />
it<br />
= δ<br />
2<br />
Δd<br />
+ ... + γ ΔX<br />
+ Δu<br />
(7)<br />
2t<br />
+ δ<br />
3Δd3t<br />
+ γ<br />
1ΔX<br />
it1<br />
k<br />
itk<br />
it<br />
Development <strong>and</strong> Agricultural Economics - Work<strong>in</strong>g Paper 2006 /07 4
for t=2 <strong>and</strong> t=3. Equation (7) conta<strong>in</strong>s the differences <strong>in</strong> the time period dummies, d2 t <strong>and</strong> d3 t ;<br />
i.e. for t=2, Δd2 t = 1 <strong>and</strong> Δd3 t = 0; for t=3, Δd2 t = -1 <strong>and</strong> Δd3 t = 1. Re-writ<strong>in</strong>g equation (7)<br />
displays the <strong>in</strong>tercept <strong>of</strong> the equation, which is a measure <strong>of</strong> the growth <strong>in</strong> performance <strong>of</strong> the<br />
control group:<br />
ΔY<br />
it<br />
= α<br />
0<br />
+ α<br />
3d<br />
+ ... + γ ΔX<br />
+ Δu<br />
(8)<br />
3t<br />
+ γ<br />
1DG<br />
+ γ<br />
2DN<br />
+ γ<br />
3ΔX<br />
it3<br />
for t=2 <strong>and</strong> t=3, the estimates <strong>of</strong> the γ<br />
j<br />
are identical <strong>in</strong> both equation (7) <strong>and</strong> (8).<br />
Apply<strong>in</strong>g these growth models to those performance parameters, which have passed the test<br />
<strong>of</strong> the l<strong>in</strong>ear model, <strong>in</strong>troduces a more rigorous test on the impact <strong>of</strong> FFS tra<strong>in</strong><strong>in</strong>g.<br />
k<br />
itk<br />
it<br />
4. Results<br />
4.1. L<strong>in</strong>ear shift effects from the FFS tra<strong>in</strong><strong>in</strong>g<br />
Table 1 summarizes the results <strong>of</strong> the t-test compar<strong>in</strong>g before <strong>and</strong> after differences for the<br />
three groups <strong>of</strong> farmers. For the FFS farmers significant shifts were observed <strong>in</strong> all<br />
parameters except the gross marg<strong>in</strong> from rice production. FFS farmers significantly reduced<br />
their pesticide use <strong>in</strong> gram active <strong>in</strong>gredient by 41.7 % after the tra<strong>in</strong><strong>in</strong>g while no significant<br />
reduction was observed between the two other groups. Due to the pesticide reduction the two<br />
other parameters l<strong>in</strong>ked to pesticide use, i.e. farmer net benefit <strong>and</strong> EIQ also showed<br />
significant differences. The difference <strong>in</strong> the EIQ however is also <strong>in</strong>fluenced by a change <strong>in</strong><br />
the type <strong>of</strong> pesticide used, i.e. FFS farmers after the tra<strong>in</strong><strong>in</strong>g opted for less toxic pesticides.<br />
Results for rice yields were less conclusive as they <strong>in</strong>creased among all three groups <strong>of</strong><br />
farmers. It must be recognized however that FFS tra<strong>in</strong><strong>in</strong>g gives emphasis on the pest<br />
management aspects <strong>of</strong> rice production so that yield effects are difficult to attribute as several<br />
confound<strong>in</strong>g factors such as promotion <strong>of</strong> new varieties can come <strong>in</strong>to play. This problem is<br />
compounded <strong>in</strong> gross marg<strong>in</strong> differences where changes <strong>in</strong> the use <strong>of</strong> other <strong>in</strong>puts can take<br />
place.<br />
Development <strong>and</strong> Agricultural Economics - Work<strong>in</strong>g Paper 2006 /07 5
Table 1: Summary <strong>of</strong> short-term l<strong>in</strong>ear shift effects from FFS tra<strong>in</strong><strong>in</strong>g<br />
<strong>Farm</strong>er<br />
group<br />
Total knowledge<br />
<strong>in</strong> rice & pest<br />
management<br />
Yield<br />
Pesticide<br />
use<br />
(gr a.i./ha)<br />
Gross<br />
marg<strong>in</strong><br />
<strong>Farm</strong>er<br />
net<br />
benefit<br />
Environment<br />
impact<br />
[score] [kg/ha] [$/ha] [$/ha] [$/ha] [score]<br />
FFS ** * *** n.s. ** ***<br />
Exposed ns * n.s. n.s. n.s. n.s.<br />
Control ns ** n.s. n.s. n.s. n.s.<br />
Note: *, **, *** <strong>in</strong>dicates the difference <strong>of</strong> before <strong>and</strong> after tra<strong>in</strong><strong>in</strong>g at 0.10, 0.05 <strong>and</strong> 0.01<br />
4.2. Two periods growth model<br />
Based on the methodology outl<strong>in</strong>ed above the analysis was proceeded by test<strong>in</strong>g for change <strong>in</strong><br />
performance <strong>in</strong> the growth rates <strong>of</strong> impact parameters. Here we <strong>in</strong>cluded just two impact<br />
measures, namely quantity <strong>of</strong> pesticide use <strong>and</strong> EIQ. We discarded the gross marg<strong>in</strong> because<br />
t-test results were non significant. Likewise we did not <strong>in</strong>clude yield because the somewhat<br />
ambiguous t-test results. We also ignored the net benefits because the results strongly depend<br />
on pesticide reduction, which was <strong>in</strong>cluded.<br />
The results <strong>of</strong> the two period growth model us<strong>in</strong>g the change <strong>in</strong> pesticide expenditures as<br />
the dependent variable show that FFS tra<strong>in</strong><strong>in</strong>g has a significant effect on reduc<strong>in</strong>g farmers’<br />
pesticide use (see table 2). This result is supported by the significant coefficient for rice <strong>and</strong><br />
pest management knowledge. The positive sign <strong>of</strong> the constant term <strong>in</strong>dicates that pesticide<br />
use is likely to cont<strong>in</strong>ue to grow without FFS. S<strong>in</strong>ce the dummy variable for non-FFS is nonsignificant<br />
there is no change <strong>in</strong> the trend <strong>of</strong> pesticide use among exposed farmers. The results<br />
questions whether FFS tra<strong>in</strong><strong>in</strong>g has <strong>in</strong>deed a diffusion effect <strong>and</strong> thus confirms the results<br />
found by Feder et al (2004) from Indonesia. Summariz<strong>in</strong>g the hypotheses tests <strong>in</strong> the lower<br />
panel <strong>of</strong> the table show that a change <strong>in</strong> the positive trend <strong>in</strong> pesticide use is attributable to<br />
FFS. FFS farmers have significantly lower pesticide expenditures when compared to the non-<br />
FFS <strong>and</strong> control farmers on the short term (Table 2).<br />
Us<strong>in</strong>g the environmental impact quotient as a dependent variable <strong>in</strong> the two period model<br />
also confirms the results <strong>of</strong> the t-test. FFS participation reduces the trend <strong>in</strong> the negative<br />
consequences <strong>of</strong> pesticides on environment <strong>in</strong> the short term (Table 2). As measured through<br />
the FFS participation dummy, the growth rate <strong>in</strong> EIQ <strong>of</strong> the FFS farmers shows a significant<br />
decl<strong>in</strong>e. It is also <strong>in</strong>terest<strong>in</strong>g to note that the counterfactual scenario (no FFS tra<strong>in</strong><strong>in</strong>g) shows<br />
Development <strong>and</strong> Agricultural Economics - Work<strong>in</strong>g Paper 2006 /07 6
grow<strong>in</strong>g negative environmental impact from pesticides. This can be concluded from the<br />
<strong>in</strong>tercepts <strong>of</strong> the models, which were significant at the 0.01 % level <strong>in</strong> the short term. Aga<strong>in</strong>,<br />
with<strong>in</strong> villages diffusion towards more environmentally benign pesticide use practices does<br />
not seem to be susta<strong>in</strong>ed as shown by the non-significant variable for Non-FFS.<br />
Table 2: Impact <strong>of</strong> FFS on pesticide expenditures <strong>and</strong> environmental impact quotient <strong>in</strong> the<br />
short term, two period growth model<br />
Two periods growth model<br />
Δ <strong>in</strong> Pesticide<br />
costs<br />
Δ <strong>in</strong> EIQ<br />
Constant (α) 0.248 2.340<br />
(1.576) (3.096)***<br />
Dummy for FFS (μ) -0.485 -1.685<br />
(-2.368)** (-1.715)*<br />
Dummy for Non-FFS (β) -0.220 -1.008<br />
(-0.937) (-0.895)<br />
Knowledge on rice <strong>and</strong> pest managements (ln Δ K) -0.030 -0.133<br />
(-2.593)** (-2.421)**<br />
Total labor use (ln Δ L) 0.052 0.160<br />
(3.911)*** (2.498)**<br />
R 2 0.109 0.064<br />
F-statistics 7.236*** 4.005***<br />
Durb<strong>in</strong>-Watson statistic 1.853 1.883<br />
N 241 241<br />
Note: data <strong>in</strong> parenthesis are the t-value. Pesticide expenditures are converted to real value.<br />
4.3. Three periods growth model<br />
To test for the long-term effects <strong>of</strong> FFS tra<strong>in</strong><strong>in</strong>g a three period growth model (see<br />
Wooldridge, 2000) was used. Two time period dummies are <strong>in</strong>cluded as explanatory<br />
variables.<br />
The long-term effects <strong>of</strong> FFS on farmer’s pesticide use confirm the results <strong>of</strong> the shortterm<br />
effect. Hence, FFS farmers reta<strong>in</strong> their improved judicious pesticide use practices <strong>and</strong><br />
cont<strong>in</strong>ue to reduce pesticide use over time. By contrast, no significant change can be observed<br />
for the non-FFS farmers <strong>and</strong> the control farmers <strong>in</strong> either period. Aga<strong>in</strong> change for both on<br />
the short <strong>and</strong> the long term knowledge had a significant effect on pesticide reduction.<br />
Development <strong>and</strong> Agricultural Economics - Work<strong>in</strong>g Paper 2006 /07 7
For the EIQ parameter the long-term change followed the results <strong>of</strong> pesticide use<br />
expenditures. On the log term FFS farmers not only reduce pesticide use levels but also<br />
cont<strong>in</strong>ue to adopt safer products <strong>and</strong> knowledge seems to be a major driver for this process.<br />
On the other h<strong>and</strong>, no significant change can be observed for non-FFS farmers. The<br />
counterfactual scenario however <strong>in</strong>dicates that there may <strong>in</strong>deed be an overall trend towards<br />
less harmful pesticides as <strong>in</strong>dicated <strong>in</strong> the time period dummies.<br />
Table 3: Impact <strong>of</strong> FFS on pesticide expenditures <strong>and</strong> environmental impact quotient <strong>in</strong> the<br />
short term, three period panel data growth model<br />
Three periods panel data growth model<br />
Δ <strong>in</strong> Pesticide<br />
costs<br />
Δ <strong>in</strong> EIQ<br />
Period 2 Dummy -0.001 1.365<br />
(-0.006) (2.798)***<br />
Period 3 Dummy 0.077 -1.894<br />
(0.730) (-4.063)***<br />
Dummy for FFS -0.254 -1.869<br />
(-2.167)** (-3.616)***<br />
Dummy for Non-FFS 0.137 0.041<br />
(1.219) (0.068)<br />
Knowledge on rice <strong>and</strong> pest management (ln Δ K) -0.229 -0.073<br />
(-2.517)** (-0.181)<br />
Total labor use (man-day) (ln Δ L) 0.445 1.060<br />
(10.561)*** (5.698)***<br />
R 2 0.448 0.294<br />
F-statistics 28.183*** 11.505***<br />
Durb<strong>in</strong>-Watson statistic 1.817 1.467<br />
N 188 188<br />
Note: data <strong>in</strong> parenthesis are the t-value. Pesticide expenditures are converted to real value.<br />
5. Conclusion<br />
Results show that farmers who participated <strong>in</strong> the <strong>Farm</strong>er <strong>Field</strong> School reta<strong>in</strong> their knowledge<br />
<strong>and</strong> cont<strong>in</strong>ue to practice improved IPM practices. Growth rates <strong>of</strong> pesticide expenditures <strong>and</strong><br />
environmental impact are significantly reduced by the FFS tra<strong>in</strong><strong>in</strong>g both <strong>in</strong> the short <strong>and</strong> long<br />
term. On the other h<strong>and</strong> farmers not tra<strong>in</strong>ed <strong>in</strong> FFS tend to cont<strong>in</strong>ue non-judicious ways <strong>of</strong><br />
Development <strong>and</strong> Agricultural Economics - Work<strong>in</strong>g Paper 2006 /07 8
us<strong>in</strong>g chemical pesticides. Thus for rice production <strong>in</strong> Thail<strong>and</strong>, the <strong>Farm</strong>er <strong>Field</strong> School is an<br />
effective method to reduce uneconomical use <strong>of</strong> chemical pesticides <strong>and</strong> make farmers to<br />
adopt more environmentally benign pesticide use practices. Thus this study confirms the<br />
f<strong>in</strong>d<strong>in</strong>g <strong>of</strong> other studies on <strong>Farm</strong>er <strong>Field</strong> <strong>Schools</strong> (e.g. Tripp 2005). Chang<strong>in</strong>g farmer’s<br />
pesticide use practices thus generates environmental benefits that not only accrue to the<br />
farmers but to society at large. However, the direct economic benefits <strong>of</strong> farmers expressed <strong>in</strong><br />
terms <strong>of</strong> gross marg<strong>in</strong>s are difficult to detect <strong>and</strong> may be small. One reason could be that <strong>in</strong><br />
technologically advanced rice production systems possible yield ga<strong>in</strong>s are small <strong>and</strong> hardly<br />
measurable by means <strong>of</strong> recall surveys. Also pesticide use does not account for a high share<br />
<strong>of</strong> the variable costs <strong>and</strong> therefore gross marg<strong>in</strong> differences can be confounded by other<br />
factors. Besides <strong>in</strong>creased productivity effects <strong>of</strong> chemical pesticides through better tim<strong>in</strong>g are<br />
small unless there are pest outbreaks, which however did not occur dur<strong>in</strong>g the years that the<br />
surveys were conducted.<br />
Us<strong>in</strong>g difference <strong>in</strong> difference growth models to panel data reveals the factors that cause<br />
a change <strong>in</strong> pest management technologies. At the same time new questions arise. For<br />
example what is the driv<strong>in</strong>g force for farmers to adopt IPM <strong>in</strong> a crop like rice if the effects on<br />
pr<strong>of</strong>it are <strong>in</strong>significant?<br />
6. References<br />
Anderson, D.R., D.J. Sweeney, <strong>and</strong> T.A. Williams. (2002). Statistics for Bus<strong>in</strong>ess <strong>and</strong><br />
Economics, South-Western College Publish<strong>in</strong>g, New York, USA.<br />
Erickson, R. 2004. Review <strong>and</strong> Evaluation Technical Assistance No. 3383-PAK: Integrated<br />
Pest Management. Asian Development Bank. Philipp<strong>in</strong>es.<br />
Feder, G., R. Murgai, <strong>and</strong> J. B. Quizon. 2003. Send<strong>in</strong>g <strong>Farm</strong>ers Back to School: The Impact<br />
<strong>of</strong> <strong>Farm</strong>er <strong>Field</strong> <strong>Schools</strong> <strong>in</strong> Indonesia. Review <strong>of</strong> Agricultural Economics – Volume 26,<br />
no. 1, pp. 1-18<br />
FEDER, G., R. MURGAI, <strong>and</strong> J. B. QUIZON 2004. The Acquisition <strong>and</strong> Diffusion <strong>of</strong><br />
Knowledge: The Case <strong>of</strong> Pest Management Tra<strong>in</strong><strong>in</strong>g <strong>in</strong> <strong>Farm</strong>er <strong>Field</strong> <strong>Schools</strong>,<br />
Indonesia. Journal <strong>of</strong> Agricultural Economics – Volume 55, no. 2, pp. 221-243<br />
Godtl<strong>and</strong> E., E. Sadoulet, A. de Janvry, R. Murgai <strong>and</strong> O. Ortiz, 2004. The Impact <strong>of</strong> <strong>Farm</strong>er<br />
<strong>Field</strong> School on Knowledge <strong>and</strong> Productivity: A Study <strong>of</strong> Potato <strong>Farm</strong>ers <strong>in</strong> the<br />
Peruvian Andes. Economic development <strong>and</strong> cultural change - Volume 53, no. 1, pp.<br />
63-92<br />
Greene, W.H. 2000. Econometric Analysis, forth edition. Prentice Hall International, New<br />
Jersey.<br />
Development <strong>and</strong> Agricultural Economics - Work<strong>in</strong>g Paper 2006 /07 9
Kovach, J. C., P.J. Degnl, <strong>and</strong> J. Tette. 1992. A Method to Measure the <strong>Environmental</strong> Impact<br />
<strong>of</strong> Pesticides. . New York’s Food <strong>and</strong> Life Sciences Bullet<strong>in</strong> No. 139, Cornell<br />
University, Ithaca, USA. (http://www.nysipm.cornell.edu/publications/<br />
EIQ_Value03.pdf).<br />
Ooi, P. S. Praneetvatakul, H. Waibel, <strong>and</strong> G. Walter-Echols. 2005. The Impact <strong>of</strong> the FAO-<br />
EU IPM Programme for Cotton <strong>in</strong> Asia. A Publication <strong>of</strong> the Pesticide Policy Project,<br />
special issue publication series, 123 pp.<br />
Praneetvatakul, S. <strong>and</strong> H. Waibel. 2003. <strong>Farm</strong>-<strong>Level</strong> Economic Analysis <strong>of</strong> <strong>Farm</strong>er <strong>Field</strong><br />
<strong>Schools</strong> <strong>in</strong> Integrated Pest Management, Poster paper presented at International<br />
Association <strong>of</strong> Agricultural Economics conference, 16-22 August 2003, Durban, South<br />
Africa.<br />
Quizon, J., G. Feder, <strong>and</strong> R. Murgai. 2001. Fiscal Susta<strong>in</strong>ability <strong>of</strong> Agricultural Extension:<br />
The Case <strong>of</strong> the <strong>Farm</strong>er <strong>Field</strong> School Approach. Journal on International Agricultural<br />
<strong>and</strong> Extension Education 8 (spr<strong>in</strong>g 2001): pp. 13-24.<br />
Rola, A. <strong>and</strong> P. P<strong>in</strong>gali, 1993. Pesticides, rice productivity, <strong>and</strong> farmers' health - An economic<br />
assessment. Los Baños (Philipp<strong>in</strong>es), IRRI. 100 pp.<br />
ROLA, A. C., S. B. JAMIAS, <strong>and</strong> J. B. Quizon. 2002. Do <strong>Farm</strong>er <strong>Field</strong> School Graduates Reta<strong>in</strong><br />
<strong>and</strong> Share What They Learn?: An Inverstigation <strong>in</strong> Iloilo, Philipp<strong>in</strong>es. Journal <strong>of</strong><br />
International Agricultural <strong>and</strong> Extension Education, Spr<strong>in</strong>g 2002 – Volume 9, no. 1, pp.<br />
65-76<br />
Tripp, R.. M. Wijeratne <strong>and</strong> V. H. Piyadasa. 2005. What should we expect from farmer field<br />
schools? A Sri Lanka case study. World Development - Volume 33, no. 10, pp. 1705-<br />
1720<br />
Van den Berg, H. 2004: IPM <strong>Farm</strong>er <strong>Field</strong> <strong>Schools</strong>: A synthesis <strong>of</strong> 25 impact evaluations,<br />
Wagen<strong>in</strong>gen University, Report prepared for the FAO Global IPM Facility, Rome.<br />
Waibel, H., Fleischer,G. <strong>and</strong> G. Walter-Echols. 2001. The Costs <strong>of</strong> Transform<strong>in</strong>g Extension<br />
Bureaucracies – The Case <strong>of</strong> New Approaches to Agricultural Extension <strong>in</strong> Egypt. "<br />
Public Adm<strong>in</strong>istration <strong>and</strong> Development 22: 309-322.<br />
Wooldridge, J.M. 2000. Introductory Econometrics. South-Western College Publish<strong>in</strong>g.<br />
Australia.<br />
Yang, P., Iles, M., Yan, S., <strong>and</strong> Jolliffe, F., 2005. <strong>Farm</strong>ers' knowledge, perceptions <strong>and</strong><br />
practices <strong>in</strong> transgenic Bt cotton <strong>in</strong> small producer systems <strong>in</strong> Northern Ch<strong>in</strong>a. Crop<br />
Protection 24(3), 229-239.<br />
Development <strong>and</strong> Agricultural Economics - Work<strong>in</strong>g Paper 2006 /07 10


