Zimbabwe Platinum Mines - Imara
Zimbabwe Platinum Mines - Imara
Zimbabwe Platinum Mines - Imara

Create successful ePaper yourself
Turn your PDF publications into a flip-book with our unique Google optimized e-Paper software.
OVERVIEW OF Q3 2012 FINANCIAL RESULTS<br />
Improved quarterly performance. Zimplats recently issued its Q3<br />
2012 financial results showing 32% q-o-q revenue growth to USD<br />
28.0m. However, y-o-y revenues were down 2.0%. We attribute the<br />
surge in quarterly earnings to improved metal prices.<br />
Mining production was adversely affected by illegal industrial<br />
actions. An industrial action at Zimplats led to a loss of two and<br />
half production shifts during Q3 2012. As a result, tonnes mined at<br />
1,125,000 were 1.0% below Q2 2012, though up 6.0% y-o-y. The<br />
head grade at 3.33g/t was satisfactory at 1.0% above Q2 2012.<br />
Tonnes of ore milled at 1,069,000 were 4.0% lower than Q2 2012 (up<br />
6.0% y-o-y) owing to scheduled major plant maintenance<br />
shutdowns. Overall, PGM production dropped by 2.0% to 90,557oz<br />
q-o-q (up 8.0% y-o-y) on the back of illegal strikes and power<br />
outages,which affected operations at the mine's platinum matte<br />
furnace.<br />
An increase in cash costs. Operating costs surged 18.0% y-o-y to<br />
USD 76.4m from USD 64.9m in Q3 2011. We note that cost<br />
performance for Q3 2012 was worse than same period last year due<br />
to significant increases in electricity and employment costs.<br />
Furthermore, the company’s local spend (including payments to<br />
government and related institutions) increased by 6.0% to 69% of<br />
total payments in Q3 2012. Consequently, the cash cost of<br />
production per 4E oz was 1.0% higher than Q2 2012 and 12.0% higher<br />
that Q3 2012, driven mainly by lower 4E production. Overall,<br />
operating profit for the quarter amounted to USD 51.9m.<br />
OPERATIONAL REVIEW<br />
Phase II at advanced stages. We note that Phase II project is<br />
progressing well, with a total spend of USD 89.0m by H1 2012.<br />
Generally, all three mines are now operating at full capacity and as<br />
a result ore mined totaled 2, 289,000 tonnes by H1 2012. We expect<br />
this trend to continue as the expansion projects gain momentum.<br />
Limited exploration drilling has resumed. We note that<br />
exploration drilling has resumed in the areas north of Portal 10. The<br />
overall FY12 exploration budget has been increased tenfold on FY<br />
2011 and also allows for further exploration of Portals 5.<br />
A number of legal issues still hanging. We recall that in December<br />
2010, the <strong>Zimbabwe</strong> Revenue Authority (ZIMRA) issued an amended<br />
Additional Profits Tax (APT) assessment in respect of the years 2001<br />
to 2007, whereby it disallowed the deduction of income tax<br />
assessed losses in the derivation of net cash receipts. The effect of<br />
this disallowance was to increase the previously assessed APT<br />
liability by USD 26.9m to USD 50.4m.<br />
The Zimplats board is of the view that the amendment of the APT<br />
assessment was based on incorrect interpretation of the provisions<br />
of the Income Tax Act. An objection to the amended assessment<br />
was lodged, but dismissed by ZIMRA. As a result, Zimplats has<br />
lodged an appeal through the Special Court of Income Tax Appeals,<br />
but the case is yet to be heard. On another note, ZIMRA has<br />
demanded royalties allegedly owed in the sum of USD 22.9m for the<br />
period January 2010 to September 2011. The royalties were<br />
computed at rates set in terms of the <strong>Mines</strong> and Minerals Act (as<br />
read with the Finance Act) rather than the Zimplats Mining<br />
Agreement.<br />
Production Statistics Q3 2011 Q3 2012 % Δ<br />
Ore Mined Tonnes (000) 1,062 1,125 6%<br />
Head grade 3.34 3.33 0%<br />
Processing Q3 2011 Q3 2012 % Δ<br />
Ore Milled 1,007 1,069 6%<br />
Recovery (4E%) 83 82 0%<br />
Metal in concentrate 4E oz 89,260 94,321 6%<br />
Metal in converter matte 4E oz 84,007 90,557 8%<br />
Nickel (tonnes) 810 941 16%<br />
Copper (tonnes) 593 681 15%<br />
Metal Sales Q3 2011 Q3 2012 % Δ<br />
4E (oz) 85,069 89,979 6%<br />
Nickel (tonnes) 803 935 16%<br />
Copper (tonnes) 586 677 16%<br />
Income Statement (USD 000) Q3 2011 Q3 2012 % Δ<br />
Turnover 130,539 128,211 -2%<br />
Operating Costs (64,959) (76,356) 18%<br />
Operating Profit 65,580 51,855 -21%<br />
Cost Analysis (USD) Q3 2011 Q3 2012 % Δ<br />
Cash cost of prod /4Eoz 702 785 12%<br />
Net cash /4Eoz 433 561 30%<br />
Revenue/4E oz 1,535 1,425 -7%<br />
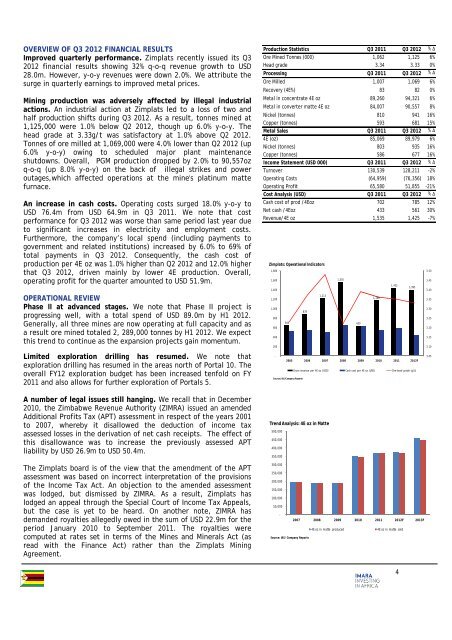
Zimplats: Operational Indicators<br />
1,800<br />
1,600<br />
1,400<br />
1,200<br />
1,000<br />
800<br />
600<br />
400<br />
200<br />
-<br />
644<br />
878<br />
1,213<br />
1,555<br />
2005 2006 2007 2008 2009 2010 2011 2012F<br />
Source: IAS/Company Reports<br />
630<br />
1,169<br />
1,432<br />
1,395<br />
Gross revenue per 4E oz (USD) Cash cost per 4E oz (USD) Ore head grade (g/t)<br />
Trend Analysis: 4E oz in Matte<br />
500,000<br />
450,000<br />
400,000<br />
350,000<br />
300,000<br />
250,000<br />
200,000<br />
150,000<br />
100,000<br />
50,000<br />
-<br />
Source: IAS/ Company Reports<br />
2007 2008 2009 2010 2011 2012F 2013F<br />
4E oz in matte produced<br />
4E oz in matte sold<br />
3.50<br />
3.45<br />
3.40<br />
3.35<br />
3.30<br />
3.25<br />
3.20<br />
3.15<br />
3.10<br />
3.05<br />
4