Waste not want not - States Assembly
Waste not want not - States Assembly
Waste not want not - States Assembly

Create successful ePaper yourself
Turn your PDF publications into a flip-book with our unique Google optimized e-Paper software.
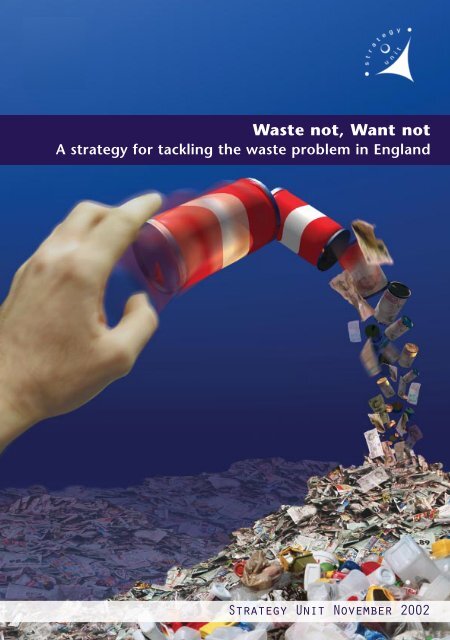
<strong>Waste</strong> <strong>not</strong>, Want <strong>not</strong><br />
A strategy for tackling the waste problem in England<br />
Strategy Unit November 2002
CONTENTS<br />
Foreword by the Prime Minister 3<br />
Executive Summary 5<br />
1. Introduction 15<br />
2. What is waste and how much is there? 19<br />
3. Why waste matters – the economic and environmental challenge 25<br />
4. Barriers to more sustainable waste management 32<br />
5. Moving forwards to a new strategy 41<br />
6. Economic and regulatory framework 57<br />
7. Strategic investment measures 82<br />
8. Funding and delivering 100<br />
9. Summary of key recommendations and action plan 113<br />
Annex A The role of the Strategy Unit 140<br />
Annex B The Project Team, Sponsor Minister and Advisory Group 141<br />
Annex C Wider wastes 143<br />
Annex D Glossary of terms 151<br />
CONTENTS<br />
1
WASTE NOT, WANT NOT<br />
2
FOREWORD BY THE PRIME MINISTER<br />
I am intensely proud of the central achievement of this Government –<br />
strong economic growth, based on sound fundamentals. Unemployment,<br />
inflation and mortgage rates are at their lowest level for decades.<br />
In large part this has been accompanied by environmental improvements<br />
– cleaner air, drinking water, river quality and bathing waters; falling<br />
emissions of greenhouse gases.<br />
But higher incomes and consumption have brought with them increased<br />
waste, and associated problems of disposal.<br />
Household waste is now growing at a rate of 3% each year, faster than<br />
growth in the economy as a whole. On average every person in the UK<br />
now produces about seven times their own weight in waste a year.<br />
Around 20% of the food we buy off supermarket shelves goes straight to<br />
the bin.<br />
At the moment most of this waste is buried in landfill sites. This is simply<br />
<strong>not</strong> sustainable. In some areas we are running out of space. And there are<br />
major environmental considerations – landfill is responsible, for example,<br />
for 25% of our emissions of methane, a major greenhouse gas.<br />
But the most important reason for changing direction is that the current<br />
position is, literally, wasteful. Half of the waste we generate could be reused<br />
and recycled, and transformed from a problem into an asset.<br />
At current rates of growth the amount of household rubbish will double<br />
by 2020, and cost £3.2bn per year to dispose of. That would mean<br />
spending an extra £1.6bn a year on waste management. So we need first<br />
to reduce the amount of waste we create.<br />
We have improved our recycling record over the past decade. But <strong>not</strong> by<br />
as much as we or previous governments <strong>want</strong>ed. It is excellent that some<br />
local authorities are really starting to deliver on recycling. But the<br />
majority are <strong>not</strong>, and many are <strong>not</strong> even trying seriously. We need now<br />
a step change.<br />
This is why I asked the Strategy Unit to look at how we could do better.<br />
Their work has involved a thorough analysis of the problem and of the<br />
potential solutions. They have consulted experts in the field and<br />
examined examples of successful waste management both at home<br />
and abroad.<br />
FOREWORD BY THE PRIME MINISTER<br />
3
The report shows clearly that a different approach to waste will pay<br />
economic and environmental dividends; that the focus of strategy needs<br />
to be on reducing, re-using and recycling waste, with reformed<br />
incentives and regulations; and that government, local authorities,<br />
industry and households, all need to play a part in containing the<br />
problem. The report is offered <strong>not</strong> as a statement of government policy,<br />
but as a contribution to the debate. But I accept its diagnosis. We must<br />
rise to its challenge.<br />
WASTE NOT, WANT NOT<br />
4
EXECUTIVE SUMMARY<br />
Key points<br />
England has a growing waste mountain<br />
The UK produces enough waste in one hour to fill the Albert Hall.<br />
Household waste is a particular problem. The quantity produced is rising by 3% per year<br />
(faster than GDP and faster than in most other nations). The waste mountain will double by<br />
2020 adding £1.6bn per year to waste disposal costs.<br />
The way England manages its waste harms the environment and squanders<br />
resources<br />
Nearly 80% of household waste goes to landfill, far more than in most other European<br />
countries. By contrast, the recycling rate in England – at 12% – is well below that in many<br />
other EU countries some of whom recycle over 40% of household waste.<br />
We need to act now to reduce waste growth and recycle more<br />
There are strong environmental and economic reasons for acting now to slow the increase in<br />
household waste and to reduce reliance on landfill. Landfill:<br />
●<br />
●<br />
●<br />
●<br />
accounts for over a quarter of all UK methane emissions (a greenhouse gas);<br />
squanders valuable resources which could be reused or recycled;<br />
is unpopular with people who live near landfill sites; and<br />
areas such as the South East are running out of potential sites.<br />
It has taken other European countries 10-15 years to shift to a more sustainable approach to<br />
waste management. A similar timescale is likely to be needed in England.<br />
Other countries have shown that waste can be tackled more sustainably<br />
The good news is that many other nations have shown that careful policy design can lead to a<br />
reduction in the growth of waste, less reliance on landfill and more recycling, without in any<br />
way damaging business competitiveness. England can learn from the best performers by<br />
focusing on waste minimisation; reusing and recycling more waste; and making the most of a<br />
wide range of alternative technologies for dealing with residual waste.<br />
EXECUTIVE SUMMARY<br />
5
Key points (continued)<br />
The aim of policy should be to secure future prosperity whilst reducing harm to<br />
the environment<br />
The overall aim of policy should be to ensure that, by 2020, England has a world class waste<br />
management system that allows the nation to prosper whilst reducing harm to the<br />
environment and preserving resources for future generations. This means:<br />
●<br />
●<br />
●<br />
reducing growth in waste volumes to less than growth in GDP;<br />
fully covering the true costs of disposing of waste in the prices of products and services;<br />
implementing waste management options that deliver the overall aim at least cost.<br />
A robust strategy is needed to realise this overall aim<br />
This strategy needs to be underpinned by three key principles:<br />
●<br />
●<br />
●<br />
the ‘waste hierarchy’ provides a sensible framework for thinking about how to achieve a<br />
better balance between waste minimisation; recycling; incineration and landfill;<br />
measures taken to advance the strategy should take full account of the balance of benefits<br />
and costs; and<br />
sustainable waste management is <strong>not</strong> just a responsibility of government but also of<br />
individuals, businesses and other stakeholders.<br />
This report sets out how these principles can be put into practice. It puts waste<br />
reduction, re-use and recycling at the forefront of its reform package together<br />
with creating the right environment and new institutional structures to deliver<br />
change.<br />
To be successful the strategy needs:<br />
●<br />
●<br />
●<br />
a robust long term economic and regulatory framework. This should include significant<br />
increases in the landfill tax and new incentives for households to reduce and recycle waste;<br />
a package of short to medium term measures to put England on the path to more<br />
sustainable waste management including measures to slow the growth in the amount of<br />
waste; investment in recycling infrastructure; and support for new alternative waste<br />
management technologies; and<br />
additional funding accompanied by radical reform of delivery structures to ensure the<br />
overall aim is realised.<br />
Implementation of the strategy would enable England to match best practice in<br />
other countries and at lower cost<br />
WASTE NOT, WANT NOT<br />
In combination, the elements of the Strategy Unit package would:<br />
●<br />
slow waste growth from 3% to 2% per annum reducing environmental damage, saving<br />
money and reducing the number of new waste management facilities required in the longer<br />
term;<br />
6
Key points (continued)<br />
●<br />
●<br />
●<br />
●<br />
boost recycling by developing the infrastructure needed for increased recycling (including<br />
national kerbside collection, focusing on organics, and more bring sites and civic amenity<br />
sites designed for re-use and recycling). This would raise national recycling rates to at least<br />
45% by 2015;<br />
increase choice by creating the economic environment within which a wider range of<br />
options for managing waste can develop: giving industry, local authorities and households<br />
greater flexibility over how they manage their waste, as well as the incentive to reduce<br />
damage to the environment;<br />
stimulate innovation in waste treatment and waste management organisations in<br />
England; and<br />
reduce environmental damage and improve resource productivity by reducing<br />
reliance on landfill and other disposal options; preserving resources for future generations<br />
and reducing environmental impacts.<br />
By learning from good and bad practices in other countries, England could achieve a waste<br />
management system that will match current best practice in the world more cost-effectively,<br />
with reduced waste growth, more recycling, less reliance on disposal, and better incentives for<br />
the use of a wider range of technologies to manage waste.<br />
The Secretary of State for the Environment, Food and Rural Affairs should be the Ministerial<br />
Champion for this strategy.<br />
In the short term, a ministerial group, reporting jointly to the Secretary of State and the Chief<br />
Secretary to the Treasury should develop the public expenditure programmes and institutional<br />
arrangements needed to implement this report’s recommendations.<br />
England faces rapidly growing<br />
waste volumes<br />
Some 28 million tonnes of municipal waste are<br />
produced annually in England. Each person<br />
produces about seven times their body weight<br />
in household waste (ten times if all municipal<br />
waste is taken into account).<br />
Household waste in England is growing at a rate<br />
of 3% annually – faster than the growth in GDP.<br />
At this rate, the volume of England’s municipal<br />
waste will double by 2020, and will cost £1.6<br />
billion a year more (at today’s prices) to manage<br />
and dispose of.<br />
England is behind most other<br />
developed countries when it<br />
comes to waste management<br />
– we produce more waste per<br />
head, and recycle less<br />
Most other European countries have a number<br />
of alternatives to landfill in place, as well as<br />
legislation and incentives to support these<br />
alternatives. Currently, almost 80% of municipal<br />
waste in England is sent to landfill sites,<br />
compared with around 50% in France and 7%<br />
in Switzerland. England recycles just 12% of its<br />
municipal waste, while Germany recycles 52%<br />
and the Netherlands 47%.<br />
EXECUTIVE SUMMARY<br />
7
WASTE NOT, WANT NOT<br />
8<br />
There are several reasons for this:<br />
●<br />
●<br />
●<br />
●<br />
●<br />
England has traditionally relied on landfill<br />
because of the country’s abundance of holes<br />
from extractive industries and other activities.<br />
This has made landfill relatively cheap and<br />
discouraged investment in alternatives;<br />
there are few financial incentives in place for<br />
either industry or householders to develop or<br />
seek alternatives to landfill. Landfill tax in the<br />
UK is currently £13 per tonne, compared<br />
with, for example, £45 per tonne in the<br />
Netherlands and £34 per tonne in Denmark.<br />
As a result there is much less economic<br />
incentive to invest in alternatives to landfill in<br />
the UK;<br />
public awareness of the growing waste<br />
problem, the benefits of managing waste<br />
effectively, and the steps everyone can take<br />
to reduce waste is far lower than in other EU<br />
countries;<br />
responsibility for waste management is split<br />
between a number of different government<br />
departments, making coherent policy-making<br />
difficult; and between tiers of local<br />
government, causing inefficiency between<br />
collection and disposal authorities; and<br />
obtaining planning permission for waste<br />
facilities can be difficult and time-consuming.<br />
Such facilities are often opposed by local<br />
people concerned about noise, pollution,<br />
traffic and effect on house prices.<br />
There is a strong case for<br />
acting now to tackle the<br />
problem of growing amounts<br />
of waste<br />
Effective action to tackle the increase in<br />
waste would bring a number of benefits:<br />
●<br />
it costs less to act now. The longer action is<br />
delayed, the greater the cost because there<br />
will be more waste to manage;<br />
●<br />
●<br />
●<br />
●<br />
increasing waste volumes are causing<br />
significant and growing damage to the<br />
environment. Landfill currently produces up<br />
to 25% of all UK methane emissions. As<br />
methane is a powerful greenhouse gas (21<br />
times more powerful than carbon dioxide),<br />
reducing these emissions will have a highly<br />
beneficial impact on climate change;<br />
the EU Landfill Directive requires the UK to<br />
reduce the volume of biodegradable<br />
municipal waste sent to landfill by 2010, with<br />
further reductions in 2013 and 2020. Failure<br />
to meet these targets could result in fines of<br />
up to £180 million per year;<br />
landfill sites are becoming increasingly scarce,<br />
particularly in the South East and the North<br />
West. More of these sites and/or other<br />
residual waste treatment facilities will be<br />
required, unless greater efforts are made to<br />
reduce volumes of waste; and<br />
there are significant lead times. Countries<br />
that have developed effective waste<br />
management systems have taken between<br />
10 and 15 years to do so.<br />
It would also bring significant<br />
economic benefits<br />
Over 50% of the household waste sent to<br />
landfill sites or incinerated in England could be<br />
diverted from incineration and landfill through<br />
home composting and recycling on the basis of<br />
current best practice. By failing to do this, the<br />
country is wasting valuable resources and<br />
putting itself at a competitive disadvantage:<br />
●<br />
●<br />
less wasteful product design and<br />
manufacturing processes would lead to cost<br />
savings for business; and<br />
growth in markets for recyclates and new<br />
technologies for waste management<br />
represent major opportunities for UK<br />
businesses.
The Government has<br />
recognised that the problem<br />
of waste needs to be tackled<br />
The Government has introduced statutory<br />
targets for local authorities for the recycling and<br />
composting of household waste: 17% by 2003<br />
and 25% by 2005/6. There are also targets to<br />
recycle 30% by 2010; and 33% by 2015. <strong>Waste</strong><br />
Strategy 2000 for England and Wales stated that<br />
statutory targets for individual councils would<br />
be set to support at least the 2010 target.<br />
Targets have also been set for reducing the<br />
amount of commercial and industrial waste sent<br />
to landfill.<br />
The proportion of household waste being<br />
recycled and composted has increased from<br />
7.5% in 1996/97 to 11.2% in 2000/01. The<br />
<strong>Waste</strong> and Resources Action Programme (WRAP)<br />
has been set up to help boost markets for<br />
recycled material and is proving very successful.<br />
But there is much more to do.<br />
The good news is that other<br />
countries provide successful<br />
examples of better waste<br />
management<br />
There is much that England can learn from<br />
other nations about:<br />
A clear vision is needed to take<br />
the waste strategy forward<br />
This report argues that the overall aim of policy<br />
should be to ensure that, by 2020, England has<br />
a world class waste management system that<br />
allows the nation to prosper whilst reducing<br />
harm to the environment and preserving<br />
resources for future generations. This means:<br />
●<br />
●<br />
●<br />
decoupling growth in the amount of waste<br />
from growth in GDP i.e. waste growth rates<br />
that are lower than GDP growth rates;<br />
fully including the costs of disposing of waste<br />
in the prices of products and services; and<br />
identifying the waste management options<br />
that will deliver the overall aim at least cost.<br />
A strategy for realising this<br />
aim needs to be based on<br />
sound principles<br />
The first principle underpinning the strategy in<br />
this report is that England needs to move up<br />
the waste hierarchy (see chart below). The<br />
higher levels of the hierarchy reflect more<br />
sustainable waste and resource management.<br />
The <strong>Waste</strong> Hierarchy<br />
●<br />
how to focus greater effort on measures to<br />
●<br />
reduce waste;<br />
the impact of measures to promote re-use<br />
<strong>Waste</strong><br />
reduction<br />
and recycling; and<br />
Re-use<br />
●<br />
how to make use of a wider range of waste<br />
technologies e.g. composting, recycling<br />
technologies and residual waste technologies<br />
such as mechanical biological treatment.<br />
Recycling &<br />
Composting<br />
Energy recovery with<br />
heat & power<br />
Landfill with energy<br />
Landfill<br />
EXECUTIVE SUMMARY<br />
9
WASTE NOT, WANT NOT<br />
10<br />
The second principle is that any measures to<br />
move up the waste hierarchy need to be<br />
soundly based in cost-benefit terms. European<br />
legislation requires member states to establish<br />
facilities using the best available technology<br />
without involving excessive costs. In deciding<br />
which individual facilities are appropriate to<br />
local needs and circumstances, the Best<br />
Practicable Environmental Option should be<br />
taken into account. England should avoid<br />
locking itself prematurely into costly and<br />
irreversible options for disposing of waste. New,<br />
cheaper and environmentally more sustainable<br />
options for managing municipal waste should<br />
be sought, in particular by encouraging<br />
technological innovation.<br />
The third principle underpinning the strategy is<br />
that tackling the rising amount of waste is <strong>not</strong><br />
just a matter for the Government; it also<br />
involves action by individual households,<br />
business and other stakeholders.<br />
England faces a clear strategic<br />
choice<br />
Do <strong>not</strong>hing …<br />
If no changes are made, environmental damage<br />
will continue and potentially valuable resources<br />
will continue to be squandered. The costs of<br />
managing the municipal waste stream will<br />
double by 2020, the UK could face fines from<br />
the EU for failing to meet its international<br />
obligations, and more landfill sites and<br />
incinerators will be required. Lack of suitable<br />
sites for significant waste facilities in some areas<br />
(e.g. the South East) will put even more<br />
pressure on greenbelt land.<br />
… or develop a more sustainable approach to<br />
waste management<br />
The package set out in this report will minimise<br />
waste, boost re-use and recycling, promote<br />
alternative approaches to waste management<br />
and bring environmental benefits such as<br />
reduced methane emissions. Improving resource<br />
efficiency should help to make industry more<br />
competitive. Households will have access to<br />
more convenient facilities for recycling, at little<br />
extra cost. Most importantly, fewer landfill sites<br />
and incinerators will be required, improving the<br />
local environment for all.<br />
Doing <strong>not</strong>hing offers the least value for money as<br />
costs will still double and greater environmental<br />
degradation and resource wastage will occur.<br />
Over the long term the strategy set out in this<br />
report costs only 10% more than doing<br />
<strong>not</strong>hing, while delivering a sustainable waste<br />
management system equal to best practice in<br />
other nations, with significant corresponding<br />
environmental and resource productivity<br />
benefits. Taking account of externalities, the<br />
investment package is a classic example of<br />
‘spend to save’.<br />
The proposed strategy in this<br />
report puts waste reduction<br />
and recycling at its core<br />
Previous waste strategies have endorsed the<br />
waste hierarchy and the need to minimise and<br />
recycle waste, but were short of delivery<br />
mechanisms. The strategy in this report<br />
emphasises waste minimisation and recycling,<br />
and sets out the key measures needed to<br />
achieve its goals, focusing in particular on an<br />
enhanced role for economic instruments, new<br />
investment and reformed delivery structures.
To be successful the future<br />
strategy for waste<br />
management needs to have<br />
three key elements<br />
These are:<br />
●<br />
●<br />
●<br />
a robust long term economic and regulatory<br />
framework;<br />
a package of short to medium term measures<br />
to put England on the path to more<br />
sustainable waste management; and<br />
additional funding accompanied by radical<br />
reform of delivery structures.<br />
Putting in place a robust<br />
economic and regulatory<br />
framework is the most<br />
essential ingredient for success<br />
This requires:<br />
●<br />
a significant increase in the landfill tax<br />
over the medium term. Landfill tax<br />
remains relatively low in the UK, which<br />
reduces the economic incentive to develop<br />
alternatives. A rise to £35 a tonne is required<br />
over the medium term to change behaviour.<br />
It needs to be signalled several years in<br />
advance, as in other nations, to allow the<br />
development of alternatives. Redirecting<br />
proceeds from the increased landfill tax<br />
partially directly back to business, and also<br />
investing in alternative methods of waste<br />
management, should minimise any upward<br />
pressure on business costs. <strong>Waste</strong> costs are a<br />
small part of most business sectors’ turnover<br />
and even at £35 a tonne, landfill tax in the<br />
UK would be lower than in many other EU<br />
nations;<br />
●<br />
●<br />
●<br />
greater freedom for local authorities<br />
to develop new financial incentives for<br />
householders to reduce and recycle<br />
their waste. Households currently pay the<br />
same Council Tax no matter how much<br />
waste they produce or whether they recycle<br />
or <strong>not</strong>. This means that they have no<br />
incentive to manage their waste in more<br />
sustainable ways. This report has identified<br />
17 other major industrialised nations where<br />
incentives are available for households who<br />
produce less waste, and/or recycle and<br />
compost more. These schemes have helped<br />
reduce waste growth, contain costs, and<br />
achieve recycling rates 3-4 times higher than<br />
that of the UK. Comparable incentives that<br />
could be taken forward in the UK include:<br />
Council Tax discounts for people who recycle<br />
or compost; reward schemes for people who<br />
recycle or compost regularly; and giving local<br />
authorities freedom to introduce variable<br />
charging schemes, where the Council Tax<br />
element for waste would be removed and<br />
charges to households made according to<br />
the amount of un-recycled and unsorted<br />
waste they produce;<br />
much waste is the result of poor product<br />
design and inefficient manufacturing<br />
processes. Producer responsibility is a key to<br />
better waste management and there is<br />
substantial new EU regulation in the pipeline.<br />
Rather than add more regulation, this report<br />
recommends additional voluntary<br />
agreements with manufacturers. For<br />
example, to increase the recyclability<br />
of their products; and<br />
consideration of new financial<br />
incentives for ‘green’ goods such as<br />
reduced VAT on recycled products, where<br />
legal, to boost use and expand markets.<br />
Product taxes could be levied on products<br />
EXECUTIVE SUMMARY<br />
11
WASTE NOT, WANT NOT<br />
12<br />
that cause environmental harm to encourage<br />
the development of environmentally-friendly<br />
substitutes. For example, Denmark, Belgium<br />
and Italy tax batteries containing heavy<br />
metals. Some countries also offer<br />
manufacturers the alternative of ‘bring back’<br />
schemes where households can return<br />
hazardous waste for safe disposal. These<br />
measures should be considered in the<br />
context of the whole supply chain for<br />
different products.<br />
Investment is required in four<br />
key areas to accelerate<br />
progress and give local<br />
authorities and households<br />
more choice in managing<br />
waste effectively<br />
These are:<br />
●<br />
●<br />
●<br />
●<br />
tackling the growth in waste. This can be<br />
done through increasing WRAP’s role in<br />
waste minimisation programmes; expanding<br />
home composting; and increasing funding to<br />
Envirowise to help industry reduce waste;<br />
developing the infrastructure for recycling and<br />
associated education programmes. Kerbside<br />
recycling programmes, focusing on organic<br />
waste, should be rolled out to households to<br />
make it easier for everyone to participate in<br />
recycling. Awareness also needs to be raised to<br />
ensure effective use of new waste infrastructure<br />
and high participation in efforts to promote<br />
the use of composted and recycled goods;<br />
improving data and research on waste<br />
management. Lack of data and research has<br />
undermined efforts to develop a waste<br />
strategy, and is essential to monitor progress;<br />
and<br />
giving financial backing to pilots of<br />
alternative technologies for waste treatment.<br />
To ensure additional funding<br />
and new investment<br />
effectively tackles the growing<br />
amount of waste, they should<br />
be accompanied by reforms to<br />
the delivery structures<br />
This report proposes:<br />
●<br />
●<br />
●<br />
●<br />
●<br />
that while one third of the existing Landfill<br />
Tax Credit Scheme revenue should be<br />
retained in its current form, the remaining<br />
two thirds should be used to fund key<br />
measures set out above and below. This will<br />
create a significant funding stream over the<br />
next 2-3 years – which will then continue to<br />
rise in tandem with the level of landfill tax<br />
revenues;<br />
extending the role of WRAP in order to<br />
minimise waste, boost recycling rates,<br />
(focusing on organics), and extending<br />
markets for recycled goods;<br />
setting up an operational task force to help<br />
bridge the gap between central policymaking<br />
and action at a local level. This would<br />
help to spread best practice among local<br />
authorities and drive progress;<br />
giving local authorities incentives to work<br />
together more effectively through joint plans<br />
and funds to realise economies of scale and<br />
focus on sustainable waste management. In<br />
the medium term, this might involve<br />
combining waste collection and disposal<br />
authorities to create unitary resource<br />
management authorities with targets for<br />
waste minimisation, recycling and reducing<br />
quantities of waste sent to final disposal<br />
options;<br />
establishing an industry forum, so that<br />
government and the waste industry can have<br />
a constructive dialogue on key issues;
●<br />
●<br />
better resourcing of the waste function in<br />
DEFRA to help it to co-ordinate and<br />
disseminate waste policy more effectively and<br />
take a proactive approach at the centre of<br />
government; and<br />
establishing a steering group, chaired by the<br />
Secretary of State for the Environment, Food<br />
and Rural Affairs, to help implement policy<br />
and monitor progress.<br />
Successfully implementing this<br />
strategy is <strong>not</strong> just a matter<br />
for central government.<br />
Everyone has a role to play<br />
●<br />
central government needs to set the<br />
strategic and policy direction on waste<br />
management; put in place the framework to<br />
support this strategy; disseminate information<br />
and have a clear national communications<br />
strategy; contribute appropriately to the local<br />
authority funding needed to make the<br />
necessary changes; minimise and recycle its<br />
own waste; and procure recycled goods;<br />
●<br />
●<br />
●<br />
– dissemination of the national<br />
communications strategy in the context of<br />
local needs; and<br />
– providing incentives for sound waste<br />
management.<br />
producers and retailers need to reduce<br />
the amount of waste they produce; pass on<br />
less waste through the supply chain to<br />
customers; and use recycled materials<br />
wherever possible;<br />
the waste industry needs to provide an<br />
appropriate range of waste-handling facilities,<br />
in line with government policy and regulatory<br />
requirements; identify and pursue opportunities<br />
for developing new technologies; and take<br />
responsibility for the long-term safe operation<br />
and aftercare of waste facilities;<br />
householders need to reduce the waste<br />
they produce, for example through home<br />
composting and purchasing goods with less<br />
packaging; reusing products; using recycling<br />
facilities; and contributing to collections for<br />
composting facilities where home composting<br />
is <strong>not</strong> practical; and<br />
●<br />
local authorities need to set a strategy for<br />
managing municipal waste locally; allocate<br />
sufficient resources to waste; and provide an<br />
appropriate level of infrastructure to support:<br />
●<br />
NGOs and the community sector need to<br />
educate householders in minimising waste<br />
and reusing and recycling goods; develop<br />
partnerships with local authorities and<br />
– home composting to homes that <strong>want</strong> to<br />
compost;<br />
– kerbside recycling (focusing on organics<br />
business to help promote and deliver<br />
recycling services; and continue innovating<br />
on service delivery.<br />
first);<br />
– more bring sites and better civic amenity<br />
sites designed for re-use and recycling;<br />
– more practical support and advice for local<br />
people;<br />
Implementation of the<br />
strategy would enable England<br />
to match best practice in other<br />
countries and at lower cost<br />
– minimising and recycling the authority’s<br />
own waste;<br />
– buying and specifying composted and<br />
recycled products;<br />
The key success measures for the strategy in this<br />
report, if taken forward by government, will be:<br />
●<br />
reducing the rate of household waste growth<br />
to 2% per annum by the end of 2006;<br />
EXECUTIVE SUMMARY<br />
13
●<br />
50% of households carrying out home<br />
composting by 2006;<br />
●<br />
●<br />
●<br />
●<br />
the roll out of kerbside recycling collections;<br />
a target of at least 35% of household waste<br />
being composted or recycled by 2010 and at<br />
least 45% of household waste being<br />
composted or recycled nationally by 2015;<br />
an absolute reduction in the amount of<br />
municipal waste going to landfill annually<br />
from 2007; and<br />
30% of collection authorities to have tried<br />
incentive based schemes to encourage sound<br />
management of household waste by 2005/6.<br />
It needs to be backed up by<br />
effective arrangements for<br />
driving forward and<br />
monitoring progress<br />
The Secretary of State for the Environment,<br />
Food and Rural Affairs should be the Ministerial<br />
Champion for this strategy. But, in the short<br />
term a ministerial group reporting jointly to the<br />
Secretary of State and the Chief Secretary to the<br />
Treasury should develop the public expenditure<br />
programmes and arrangements needed to<br />
implement this report.<br />
WASTE NOT, WANT NOT<br />
14
1. INTRODUCTION<br />
Summary<br />
The Strategy Unit was tasked at the end of 2001 with carrying out a<br />
review of the <strong>Waste</strong> Strategy in England.<br />
The aim of this review has been:<br />
●<br />
●<br />
●<br />
to analyse the scale of the challenge posed by growing quantities of<br />
municipal household waste;<br />
to assess the main causes and drivers behind this growth now and in<br />
the future; and<br />
to devise a strategy, with practical and cost-effective measures for<br />
addressing the challenge, which will put England on a sustainable<br />
path for managing future streams of household waste.<br />
This report sets out the<br />
findings of a review of waste<br />
strategy in England<br />
1.1 The Strategy Unit (SU), formerly the<br />
Performance and Innovation Unit, was asked by<br />
the Prime Minister to carry out a review of <strong>Waste</strong><br />
Strategy 1 at the end of 2001. It was asked in<br />
particular to consider the implications of Article<br />
5 of the EU Landfill Directive 2 which sets targets<br />
for reducing the proportion of biodegradable,<br />
municipal waste sent to landfill sites.<br />
1.2 This report’s focus on municipal waste – i.e.<br />
waste under the control of local authorities –<br />
does <strong>not</strong> mean that other wastes are<br />
unimportant. On the contrary, their aggregate<br />
volume is substantially greater than municipal<br />
waste, and hazardous, industrial and<br />
commercial waste streams are also increasingly<br />
affected by EU Directives. A working paper on<br />
the SU web site sets out proposals for further<br />
work that might be undertaken on such waste<br />
streams. Where appropriate this report<br />
highlights recommendations relevant to the<br />
more sustainable management of other wastes.<br />
1.3 The study is concerned with waste policy in<br />
England as waste policy, with the exception of<br />
most economic instruments, 3 is devolved.<br />
Wales, Scotland and Northern Ireland have their<br />
own waste strategies. 4 Some of the positive<br />
steps underway in the devolved administrations<br />
to tackle waste are set out in Box 1.<br />
1<br />
Department for the Environment, Transport and the Regions, <strong>Waste</strong> Strategy 2000 for England and Wales (May 2000). As stated above,<br />
Wales now has its own <strong>Waste</strong> Strategy<br />
2<br />
Council Directive 99/31/EC on the landfill of waste<br />
3<br />
Chapter 9 clarifies any impacts of the report’s recommendations on the devolved administrations<br />
4<br />
Wise about <strong>Waste</strong> – The National <strong>Waste</strong> Strategy for Wales (June 2002) is available at<br />
www.wales.gov.uk/subienvironment/content/wastesummary-e.pdf. The National <strong>Waste</strong> Strategy for Scotland (1999) is available at<br />
www.sepa.org.uk/nws/pdf/nws/national_waste_strategy.pdf. Scotland’s new National <strong>Waste</strong> Plan will be published in 2003. Northern<br />
Ireland’s <strong>Waste</strong> Strategy is available at www.ehsni.gov.uk/pubs/publications/NIWMS.pdf<br />
INTRODUCTION<br />
15
Box 1: Tackling waste in the devolved administrations<br />
Wales<br />
The National <strong>Waste</strong> Strategy for Wales, published in June 2002, sets out how Wales plans to<br />
move from current over-reliance on landfill to more sustainable waste management. The Strategy<br />
includes a number of specific targets for Wales including waste reduction targets for public<br />
bodies and businesses (the aim is to have reduced the volume of waste to at least 10% of the<br />
1998 level by 2010). The Strategy also emphasises the importance of government, business,<br />
retailers and the public all playing their part in tackling waste. For example, manufacturers are<br />
encouraged to invest in green products likely to represent a future growth sector, and retailers to<br />
support eco-labelling.<br />
Scotland<br />
Scotland is preparing a National <strong>Waste</strong> Plan which will emphasise the importance of reducing the<br />
quantity of municipal waste and encouraging recycling and composting through segregated<br />
collection and bring facilities. This should reduce the scale of new facilities required in Scotland<br />
to treat and dispose of mixed waste. Local authorities are being encouraged to pursue local<br />
waste solutions for their own areas through collaborative working with neighbouring authorities.<br />
Northern Ireland<br />
Northern Ireland has launched a major new waste awareness campaign ‘Wake up to <strong>Waste</strong>,’<br />
involving television and radio advertisements, shopping centre roadshows and a dedicated<br />
campaign website (www.wakeuptowaste.org). The campaign focuses on easy, practical steps<br />
which the public can take every day to reduce and re-use waste, for example re-using plastic<br />
carrier bags. A number of recycling operations have already reported increases of 10-30% in the<br />
volumes of recyclable materials collected since the campaign began in February 2002.<br />
WASTE NOT, WANT NOT<br />
16<br />
1.4 However, the Landfill Directive applies UKwide<br />
so, where appropriate, reference is made<br />
to the challenges faced by the whole of the UK.<br />
The review had four main objectives:<br />
●<br />
●<br />
●<br />
to analyse the scale of the waste problem, its<br />
causes and barriers to progress;<br />
to identify the most cost-effective and<br />
environmentally sustainable options for<br />
dealing with the growing volume of<br />
municipal waste in England;<br />
to make recommendations on how the EU<br />
Landfill Directive targets could be delivered;<br />
and<br />
●<br />
to set out a vision of the waste management<br />
system to 2020 that will allow the nation to<br />
prosper whilst protecting human health and<br />
reducing harm to the environment.<br />
The review was carried out by a multidisciplinary<br />
team with support from an<br />
Advisory Group<br />
1.5 The review team consisted of civil servants<br />
and secondees from outside Whitehall. Annex B<br />
gives details of the team members and their<br />
parent organisations.<br />
1.6 In carrying out the project, the SU team<br />
drew on the expertise of an Advisory Group<br />
which consisted of various experts and<br />
stakeholders from inside and outside<br />
government. Annex B lists the Advisory Group’s
members. Margaret Beckett, the Secretary of<br />
State for the Environment, Food and Rural<br />
Affairs, acted as the project’s sponsor Minister<br />
and Chair to the Advisory Group. The input and<br />
assistance of the Advisory Group was a crucial<br />
part of the project. The advisory role of the<br />
Group does mean, however, that this report<br />
does <strong>not</strong> necessarily represent the views of all its<br />
members.<br />
1.7 The SU team was also assisted at working<br />
level by a Support Group consisting of a variety<br />
of stakeholders representing central and local<br />
government, the waste and packaging<br />
industries, green groups, NGOs and others. The<br />
SU is grateful for the support and assistance of<br />
the Support Group as well as the wide variety<br />
of stakeholders who have contributed to<br />
discussions during the course of the project.<br />
There were a number of<br />
methodological stages to the<br />
review<br />
The review had eight distinct phases:<br />
●<br />
●<br />
●<br />
a <strong>Waste</strong> Summit was held by Margaret Beckett,<br />
Secretary of State for the Environment, Food<br />
and Rural Affairs, at the outset of the project<br />
in November 2001. This provided invaluable<br />
material on the scale and nature of the waste<br />
problem and options for overcoming it;<br />
a scoping <strong>not</strong>e for the review setting out the<br />
key issues to be addressed was produced in<br />
December 2001. This was posted on the SU<br />
web site and views were sought from<br />
stakeholders;<br />
workshops were held with experts and<br />
stakeholders to discuss various waste<br />
management options and their pros and<br />
cons. These addressed issues such as waste<br />
minimisation, recycling, residual waste<br />
management and the planning process.<br />
Bilateral discussions were also held with a<br />
wide range of stakeholders;<br />
●<br />
●<br />
●<br />
●<br />
●<br />
a review was conducted of the economic<br />
and regulatory frameworks for waste<br />
management that have been adopted by<br />
other nations. Members of the SU team<br />
visited the Netherlands, Belgium and Italy<br />
to discuss how they had improved their<br />
management of waste;<br />
some local authorities were visited to seek<br />
their views on barriers to progress and<br />
options for more effective and sustainable<br />
waste management;<br />
representatives of the community sector were<br />
consulted and MORI was commissioned to<br />
conduct focus group research on public<br />
perceptions of the problems;<br />
data was gathered and detailed models<br />
developed to analyse the costs and benefits<br />
of alternative options for future waste<br />
management. This modelling was<br />
underpinned by more detailed work on:<br />
waste composition and growth rates;<br />
technological options and their costs;<br />
collection costs; and modelling of likely<br />
behavioural responses to different recycling<br />
and composting options. The aim of this<br />
modelling was <strong>not</strong> to try to predict the future<br />
but rather to increase understanding of<br />
potential solutions, their costs and benefits;<br />
and<br />
drawing on the above, the team worked up a<br />
vision for the sustainable management of<br />
waste in England and a strategy for achieving<br />
it including funding requirements, the<br />
necessary economic and regulatory<br />
framework, and reforms to delivery<br />
structures.<br />
The rest of this report is structured as<br />
follows…<br />
●<br />
Chapter 2 gives an overview of the scale<br />
and growth of waste streams in England,<br />
how they are managed and how England<br />
compares with other countries;<br />
CHAPTER TITLE<br />
17
●<br />
Chapter 3 describes why tackling waste<br />
matters and sets out the economic and<br />
environmental challenge;<br />
Annex J:<br />
The SU’s review of the literature on<br />
health effects of waste<br />
management options<br />
●<br />
Chapter 4 discusses the main barriers to<br />
Annex K:<br />
New delivery frameworks<br />
more sustainable waste management;<br />
Annex L:<br />
Modelling, data and assumptions<br />
●<br />
●<br />
Chapter 5 outlines a vision and strategy for<br />
moving forward;<br />
Chapter 6 sets out the economic and<br />
Annex M:<br />
Annex N:<br />
Moving beyond the SU strategy<br />
Bibliography<br />
regulatory framework required for change in<br />
the medium and longer term;<br />
●<br />
Chapter 7 sets out a package of short to<br />
medium term strategic investment measures<br />
required to put England on the path to more<br />
sustainable management of its waste streams;<br />
●<br />
Chapter 8 sets out the funding and delivery<br />
mechanisms required; and<br />
●<br />
Chapter 9 summarises the key<br />
recommendations and sets out an action<br />
plan.<br />
Annexes cover:<br />
●<br />
●<br />
●<br />
●<br />
the role of the SU;<br />
details of the project team, Sponsor Minister<br />
and Advisory Group;<br />
an overview of wider controlled wastes; and<br />
a glossary of terms used in the report.<br />
The following annexes are published on the SU<br />
website:<br />
WASTE NOT, WANT NOT<br />
18<br />
Annex E:<br />
Annex F:<br />
Annex G:<br />
Annex H:<br />
Annex I:<br />
Greening government<br />
procurement<br />
The role of alternative technologies<br />
Treatment and disposal of residual<br />
waste (Mechanical Biological<br />
Treatment (MBT) and Incineration)<br />
The biowaste fraction<br />
International comparisons
2. WHAT IS WASTE AND HOW MUCH IS THERE?<br />
Summary<br />
Households in England produce 25 million tonnes of waste every year.<br />
Over half of this consists of garden waste, waste paper and board, and<br />
kitchen waste.<br />
<strong>Waste</strong> quantities in England are rising faster than growth in GDP and<br />
faster than in most other European countries. At current rates of growth,<br />
the costs of managing household waste will double by 2020.<br />
By international standards, England currently disposes of a higher<br />
proportion of its municipal waste through landfill (78% of the total) and<br />
a much lower proportion through recycling (12%) and thermal treatment<br />
(9%).<br />
<strong>Waste</strong> comes from many different sources<br />
There are several ways to define waste. A description of the main types of waste is set out in<br />
Box 2 below.<br />
Box 2: Types of waste: 5<br />
Controlled waste – describes waste that must be managed and disposed of in line with waste<br />
management regulations. It includes municipal, commercial and industrial waste and can come<br />
from private homes, schools, hospitals, shops, offices, factories or other businesses. It can be solid<br />
or liquid and include a range of materials such as scrap metal, old newspapers, used glass or<br />
plastic bottles, aluminium cans, kitchen and garden waste.<br />
Municipal waste – includes all waste under the control of local authorities, whether or <strong>not</strong> they<br />
have contracted out services. It includes all household waste (89% of municipal waste), 6 street<br />
litter, waste sent to council recycling points, municipal parks and garden wastes, council office<br />
waste, and some commercial waste from shops and small trading estates where local authority<br />
waste collection agreements are in place.<br />
5<br />
From <strong>Waste</strong> Strategy 2000 op.cit, Chapter 2 and ODPM<br />
6<br />
Municipal <strong>Waste</strong> Management Survey (MWMS), 2000/01, DEFRA<br />
WHAT IS WASTE AND HOW MUCH IS THERE?<br />
19
Box 2: Types of waste: (continued)<br />
Household waste – includes regular waste from household doorstep collections, bulky waste<br />
collection, hazardous household waste collection, communal collection of garden waste, plus<br />
waste from schools, street sweepings and litter.<br />
Commercial waste – includes waste arisings from wholesalers, shops, offices and catering<br />
businesses.<br />
Industrial waste – includes waste arisings from factories and industrial plants.<br />
Agricultural waste – includes waste from farms and market gardens – including plastics,<br />
packaging, tyres and machinery and dependent on its use, some organic matter such as manure,<br />
slurry and crop residues.<br />
Construction and demolition waste – includes any waste arisings from the construction,<br />
repair, maintenance and demolition of buildings and structures. It consists of brick, concrete,<br />
hardcore, subsoil and topsoil as well as timber, metals, plastics and special waste materials.<br />
Mines and quarries waste – includes materials such as overburden, rock inter-bedded with<br />
the mineral resource, and residues left over from the initial processing of extracted material (e.g.<br />
tailings).<br />
This report is concerned with<br />
municipal waste<br />
2.1 Around 375 million tonnes of waste are<br />
produced every year in England. Twenty five<br />
million tonnes come from householders,<br />
47 million tonnes from industry and a further<br />
24 million tonnes from commercial businesses.<br />
Construction and demolition waste represents<br />
around 89 million tonnes of the remaining<br />
190 million tonnes, with materials such as<br />
agricultural wastes, mining and quarry wastes,<br />
sewage sludge and dredged spoils making up<br />
the balance.<br />
2.2 The main focus of this report is on<br />
municipal waste in England. This totalled 28.2<br />
million tonnes in 2000/01. 7 Household waste,<br />
estimated to be 89% of the total, or 25.1<br />
million tonnes 8 typically consists of a wide<br />
variety of materials. These include (as a<br />
percentage by weight): garden waste (20% of<br />
the total); paper and board (18%); putrescible 9<br />
waste such as kitchen waste (17%); glass (7%);<br />
miscellaneous non-combustible waste (5%);<br />
dense plastics (4%); and textiles (3%).<br />
WASTE NOT, WANT NOT<br />
7<br />
English Municipal <strong>Waste</strong> Management Survey op.cit<br />
8<br />
As foot<strong>not</strong>e 7<br />
9<br />
all these could be composted<br />
20
Figure 1: Composition of Household <strong>Waste</strong> 2000/01<br />
Garden <strong>Waste</strong> 20%<br />
Paper and Board 18%<br />
Kitchen <strong>Waste</strong> 17%<br />
General Household Sweepings 9%<br />
Glass 7%<br />
Wood 5%<br />
Scrap metal/White goods 5%<br />
Dense plastic 4%<br />
Plastic film 4%<br />
Textiles 3%<br />
Metal packaging 3%<br />
Nappies 2%<br />
Soil 3%<br />
Source: Parfitt J. Analysis of household waste composition and factors driving waste increases<br />
The quantity of municipal<br />
waste is growing faster than<br />
GDP<br />
2.3 The amount of municipal waste produced<br />
in England is growing at around 3-4% per<br />
year. 10 This is faster than growth in GDP<br />
(around 2-2.5%) and is one of the fastest<br />
growth rates in Europe. 11 A range of economic<br />
and social factors lie behind this growth such as<br />
rising household incomes, changing lifestyles,<br />
advertising and the growth in sales of prepackaged<br />
goods.<br />
2.4 The growing volume of municipal waste is<br />
pushing up the costs of waste management. At<br />
current rates, the amount of municipal waste<br />
produced in England will double by 2020, with<br />
the costs of managing this waste stream,<br />
doubling to £3.2 billion 12 per annum from £1.6<br />
billion 13 currently on unchanged policies.<br />
2.5 Local authorities are under a statutory duty<br />
to regularly collect household waste produced<br />
by some 21 million 14 households. They also<br />
have a duty to collect commercial waste if<br />
requested, and may also collect industrial waste.<br />
The waste collected, other than that which the<br />
10<br />
Since 1996/97, the amount of municipal waste collected each year has increased by an average of 3.4% per year. Municipal <strong>Waste</strong><br />
Management Survey, 2000/01<br />
11<br />
OECD/Eurostat data. % increase/year 1991-1999 = 2.48% in Belgium; 2.55% in Austria; 0.43% in Denmark; compared to 3.87% in<br />
the UK (Eurostat figures)<br />
12<br />
SU analysis based on waste growth at 3%<br />
13<br />
Estimate. Latest outturn figure is £1.5 billion in 2000/01, CIPFA (The Chartered Institute of Public Finance and Accountancy)<br />
14<br />
Mid-year estimate, 2001 Office of National Statistics<br />
WHAT IS WASTE AND HOW MUCH IS THERE?<br />
21
authority makes arrangements to recycle, must<br />
be delivered to the appropriate <strong>Waste</strong> Disposal<br />
Authority. Increasingly the business of<br />
collection, management and disposal of waste is<br />
contracted out to private sector waste<br />
management companies.<br />
Most of England’s municipal<br />
waste goes to landfill sites<br />
2.6 England landfills the majority of its<br />
municipal waste. Almost 80% of municipal<br />
waste is handled in this way, compared to 50%<br />
of commercial and industrial waste.<br />
Figure 2: <strong>Waste</strong> Management in England and Wales, 1998/99<br />
<strong>Waste</strong> Landfill Recovery (a) Recycling/<br />
Composting<br />
Industrial waste<br />
(excluding construction<br />
and demolition waste) 44% 48% 44%<br />
Commercial waste 68% 28% 24%<br />
Municipal waste 78% 21% 12%<br />
(a) including recycling and composting and energy recovered via incineration (therefore<br />
the total percentages add up to more than 100%)<br />
Source: <strong>Waste</strong> Strategy 2000 – based on provisional data<br />
Municipal waste: England Municipal <strong>Waste</strong> Management Survey, 2000/01, DEFRA<br />
This contrasts with waste<br />
management in most other<br />
countries<br />
2.7 Figure 3 compares the different waste<br />
management methods used by different<br />
countries. Most other countries in the EU as well<br />
as the USA, Canada, Australia and New Zealand<br />
rely on a mix of alternatives. This commonly<br />
includes extensive recycling infrastructure and<br />
developing new technologies to tackle waste as<br />
well as landfill.<br />
2.8 England recycles 12% of its municipal waste<br />
stream, and deals with 9% of it through thermal<br />
treatment technologies including incineration.<br />
This is in contrast to the waste management<br />
methods of most of the UK’s European<br />
neighbours. For example, Switzerland recycles<br />
or composts 45%, incinerates 48% and landfills<br />
just 7%.<br />
WASTE NOT, WANT NOT<br />
22
Figure 3: Methods of waste management by country<br />
100%<br />
90%<br />
16% 19%<br />
7%<br />
1%<br />
23%<br />
13%<br />
80%<br />
percentage of waste<br />
70%<br />
60%<br />
50%<br />
40%<br />
30%<br />
22%<br />
62%<br />
34%<br />
48%<br />
38%<br />
55%<br />
81%<br />
20%<br />
10%<br />
0%<br />
Flanders<br />
1999<br />
47% 45%<br />
Netherlands<br />
2000<br />
Switzerland<br />
2000<br />
38%<br />
Sweden<br />
2000<br />
32%<br />
Denmark<br />
2000<br />
8%<br />
11%<br />
UK 1999<br />
Other Landfill Incineration Recycling and Composting<br />
Source: Figures taken from Green Alliance “Creative policy packages for waste: lessons for the UK”<br />
Autumn 2002. UK figures are for England and Wales only. Figures for municipal waste for the<br />
Netherlands and Denmark were constructed by the Green Alliance.<br />
Other countries also use a<br />
wider range of policy<br />
instruments to tackle growth<br />
in waste volumes<br />
2.9 Many of the most successful European<br />
nations have in place more comprehensive<br />
packages of both legislative and incentive-based<br />
measures to reduce growth in waste volumes<br />
and move waste management up the waste<br />
hierarchy. For example, they tend to make<br />
greater use of higher landfill taxes, landfill bans<br />
of some waste streams, variable household<br />
charging for the collection and disposal of<br />
waste (found in at least 17 other countries) and<br />
Extended Producer Responsibility (EPR). 15 EPR<br />
extends the responsibility of producers for<br />
environmental impacts of their products to the<br />
entire life cycle including take-back, recycling<br />
and disposal. These kinds of packages of<br />
15<br />
Dr Jane Beasley, CIWM – work for the SU (see Annex I)<br />
measures, supported by a strong economic and<br />
regulatory framework, make it more profitable<br />
for waste companies to invest in alternatives to<br />
landfill and help to reduce/recycle waste.<br />
2.10 A few specific examples of the means used<br />
across Europe to promote alternative options<br />
are given in Box 3.<br />
WHAT IS WASTE AND HOW MUCH IS THERE?<br />
23
Box 3: Instruments used in other countries to promote alternatives<br />
to landfill<br />
<strong>Waste</strong> prevention and minimisation is tackled in a number of countries through the use of<br />
product taxes on a life-cycle approach. For example, Denmark has a general tax on disposable<br />
items such as batteries, electric bulbs, tyres and pesticides. Similarly, Belgium has a product tax<br />
on a number of items including disposable drinks containers and some types of packaging. Italy<br />
and recently Ireland introduced taxes on carrier bags.<br />
<strong>Waste</strong> minimisation, re-use and recycling is successfully promoted in a number of<br />
countries through deposit refund schemes. Sweden, for example, operates such a scheme for<br />
glass and plastic bottles, and aluminium cans, and Germany for a variety of products. Some<br />
countries have reported high administrative costs in setting up such schemes, although a number<br />
of schemes have achieved return levels above 90%.<br />
Diversion from landfill has been encouraged in a number of countries through the use of<br />
landfill taxes, often administered with additional instruments including landfill bans on certain<br />
types of waste. The current UK landfill tax rate is £13 16 (20.3 Euros) per tonne compared to<br />
landfill tax rates in countries such as Denmark (50 Euros per tonne) and Austria (43.6 Euros<br />
per tonne). Some countries have used landfill tax revenues to develop alternative infrastructures<br />
for managing waste, while incentivising a shift towards alternative waste management<br />
approaches.<br />
WASTE NOT, WANT NOT<br />
16<br />
The Government announced in the 1999 Budget that it intends to raise the standard rate of landfill tax by £1 per tonne in April each<br />
year to 2004, subject to Parliamentary approval. Budget 2002 stated that “The Government anticipates that the rates of landfill tax<br />
will need to be increased significantly in the medium term as part of the mix of future policy measures. The Government will take<br />
future decisions on landfill tax, and consider the case for a tax on incineration, in the light of the findings of the PIU waste project.”<br />
HM Treasury Budget 2002<br />
24
3. WHY WASTE MATTERS – THE ECONOMIC AND<br />
ENVIRONMENTAL CHALLENGE<br />
Summary<br />
There are strong economic and environmental reasons for tackling the<br />
growing quantity of waste:<br />
a) poor product design and manufacturing processes add unnecessarily<br />
to industrial costs as well as creating extra household waste;<br />
b) disposing of waste causes serious pollution. For example, landfill<br />
sites account for around 25% of UK methane emissions (a powerful<br />
greenhouse gas); and<br />
c) well targeted government intervention to reduce the rate of growth<br />
in waste volumes would be wholly consistent with principles of<br />
sustainable development.<br />
England has invested less in reducing the volume of household waste<br />
and in alternative methods of disposing of it than other countries. This<br />
reflects the historic availability of cheap landfill sites in this country. But<br />
such sites are becoming increasingly scarce, especially in the South East.<br />
Taking account of the derogation to which the UK is entitled, the EU<br />
Landfill Directive requires the volume of biodegradable municipal waste<br />
sent to landfill to be reduced to 75% of the 1995 level produced by 2010;<br />
50% by 2013; and 35% by 2020.<br />
Unless waste management practices change there will be a widening gap<br />
between practice and our international legal obligations.<br />
Addressing this gap is the key challenge for future waste strategy. Later<br />
chapters of this report will set out what should be the main elements of a<br />
strategy to close the gap.<br />
WHY WASTE MATTERS – THE ECONOMIC AND ENVIRONMENTAL CHALLENGE<br />
25
There are sound economic and<br />
environmental reasons for a<br />
more sustainable approach to<br />
managing waste<br />
3.1 Securing sustainable waste management is<br />
arguably the biggest environmental challenge<br />
after climate change. 17 The case for action has<br />
been accepted at all levels of government:<br />
●<br />
●<br />
●<br />
internationally, as a part of the Sustainable<br />
Development Summits in 1992 and 2002<br />
which have led the call for a de-coupling of<br />
economic growth and contributors to<br />
environmental damage;<br />
in Europe, where legislation is driving more<br />
sustainable waste management; and<br />
nationally, as a part of agreed existing and<br />
previous UK Government policy on<br />
sustainable development and waste.<br />
3.2 The case for action has also been accepted<br />
by the public, who when presented with the<br />
choices between different waste management<br />
options 18 call for more opportunities to recycle,<br />
and less reliance on landfill.<br />
3.3 Government intervention to tackle waste<br />
will bring benefits to:<br />
●<br />
the economy – there are economic<br />
opportunities to be realised from improving<br />
the way that waste streams are managed. For<br />
example, less wasteful product design and<br />
manufacturing processes will translate<br />
directly into cost savings for business. New<br />
waste technologies and services can also<br />
provide new markets for UK businesses and<br />
generate significant revenues;<br />
●<br />
●<br />
the environment – benefits to climate<br />
change are likely to result from minimising<br />
waste and more re-use and recycling. As<br />
waste continues to grow, so too will its<br />
contribution to climate change and<br />
environmental degradation if we do <strong>not</strong><br />
change how we deal with it; and<br />
society as a whole – alternative waste<br />
management options, particularly recycling,<br />
can have a positive effect on social cohesion<br />
and inclusion, because of the communitybased<br />
nature of such activities. Good waste<br />
management also sends appropriate signals<br />
to the public about valuing the local<br />
environment and can help both to reduce<br />
anti-social behaviour, such as fly-tipping and<br />
littering, and to improve local liveability. 19<br />
Reducing excessive reliance on<br />
landfill should be a policy<br />
priority for England<br />
3.4 As Chapter 2 showed, England is highly<br />
reliant on landfill as its main method of waste<br />
disposal. 20 Yet landfilling waste is generally the<br />
least sustainable of all the waste management<br />
options:<br />
●<br />
●<br />
landfill sites account for 25% 21,22 of all UK<br />
methane emissions – a powerful greenhouse<br />
gas;<br />
by landfilling biodegradable waste, resources<br />
that could be re-used or recycled are lost;<br />
17<br />
There are links between the two issues as waste management impacts on climate change<br />
WASTE NOT, WANT NOT<br />
18<br />
MORI Public Attitudes Towards Recycling and <strong>Waste</strong> Management Research for the SU, (September 2002). Report available at<br />
www.strategy.gov.uk/2002/waste/downloads/mori.pdf. Research shows that the disposal of society’s waste is <strong>not</strong> an environmental<br />
issue at the forefront of people’s minds. However, its significance as an issue rises when people are prompted about the waste<br />
management options they face<br />
19<br />
Intensive recycling schemes tend to reduce the quantity of street litter arisings. Robin Murray, personal communication<br />
20<br />
78% of municipal waste goes to landfill in England<br />
21<br />
Biffa Future Perfect (2002) quotes DEFRA figures on UK methane emissions by source: waste accounted for 3.8MT Carbon in 2000<br />
(out of a total of 14.3MT Carbon emissions overall)<br />
22<br />
Although methane gas is increasingly being captured from landfill sites<br />
26
●<br />
●<br />
public concerns have been raised about the<br />
impact of all waste management facilities,<br />
but particularly about the quality of the<br />
environment surrounding landfills, including<br />
noise, odour and litter problems, as well as<br />
potential health effects of emissions; and<br />
landfill sites are becoming increasingly scarce<br />
in the South East and North West due to<br />
other pressures on land use and proximity to<br />
settlements. Transporting waste further<br />
distances to be landfilled will mean further<br />
impacts on the environment.<br />
This priority would be<br />
consistent with the EU Landfill<br />
Directive, which requires<br />
significant reductions in the<br />
amount of biodegradable<br />
municipal waste sent to<br />
landfill<br />
3.5 The aim of the EU Landfill Directive, which<br />
applies to most waste, is to prevent or reduce<br />
the negative effects of landfill, including the<br />
production of methane from organic sources. As<br />
with any EU Directive, non-compliance carries<br />
the potential sanction of a fine. It has been<br />
suggested that the UK could be fined up to<br />
£180 million a year if it does <strong>not</strong> comply with<br />
the Landfill Directive targets.<br />
3.6 The main requirements of the Landfill<br />
Directive are set out in Box 4 below:<br />
Box 4: Requirements of the Landfill Directive: 23<br />
To reduce the volume of biodegradable municipal waste sent to landfill to 75% of that produced<br />
in 1995 by 2010, 50% of that produced in 1995 by 2013 and 35% of that produced in 1995 by<br />
2020. These targets take account of a 4-year derogation offered by the EU to those countries<br />
heavily reliant on landfill such as the UK.<br />
The co-disposal of hazardous and non-hazardous wastes is banned from 2004, and separate<br />
landfills for hazardous, non-hazardous and inert wastes are required.<br />
Landfill of tyres is banned (by 2003 for whole tyres; by 2006 for shredded tyres).<br />
Landfill of liquid wastes, certain clinical wastes and certain types of hazardous waste is already<br />
banned.<br />
There are also provisions to control, monitor and report, and close sites.<br />
23<br />
Council Directive 99/31/EC on the landfill of waste<br />
WHY WASTE MATTERS – THE ECONOMIC AND ENVIRONMENTAL CHALLENGE<br />
27
Current policies are failing to<br />
tackle rising waste quantities<br />
or to reduce the quantity of<br />
waste going to landfill sites<br />
3.7 Successive governments have recognised<br />
the need to move to more sustainable forms of<br />
waste management. Governments have<br />
responded to this challenge by producing<br />
framework strategies within which they have set<br />
targets to move away from landfill and deliver<br />
higher rates of recycling. Until <strong>Waste</strong> Strategy<br />
2000, the targets were aspirational (and remain<br />
so for non-municipal streams). However, in the<br />
absence of a coherent mix of policy and<br />
delivery instruments, successive targets have<br />
<strong>not</strong> been met:<br />
●<br />
●<br />
●<br />
1990 – The Environment White Paper 24 – set<br />
a target of 25% recycling by 2000. This has<br />
<strong>not</strong> been met;<br />
1995 – “Making <strong>Waste</strong> Work” 25 – the<br />
recycling and composting rate for household<br />
waste stood at 6%. This document reemphasised<br />
the need to meet the 25% target<br />
by 2000;<br />
1999 – “A Way with <strong>Waste</strong>” 26 – recognised<br />
that the 25% recycling/composting target<br />
would <strong>not</strong> be met by 2000;<br />
<strong>Waste</strong> Strategy 2000 also set a target of 25%<br />
of household waste to be recycled/composted<br />
by 2005/6. On current progress it will be<br />
very difficult to achieve this.<br />
3.8 England spends about 60% of the EU<br />
average on waste management and disposal<br />
(i.e. around 0.5% of GDP in the UK versus 1.0%<br />
in the Netherlands) 29 and around 40% of those<br />
at the leading edge of waste management<br />
(Figure 4). Because of England’s reliance on<br />
landfill, householders pay some of the lowest<br />
rates for waste collection and disposal in Europe<br />
– around £50 per year on average, 30 which is<br />
roughly half the EU average and about 30% of<br />
the rate of high performing countries. England’s<br />
lower spend on waste per capita reflects both<br />
the relative cheapness and the efficiency of<br />
landfill. However, while some landfill will<br />
justifiably continue to provide a disposal route<br />
for certain wastes, 31 England’s current overreliance<br />
on this form of waste disposal means<br />
that significant environmental impacts are <strong>not</strong><br />
being captured in what households pay. The UK<br />
has the same population as France and the<br />
same GDP, but spends 50% less on municipal<br />
waste management; France diverts 150% more<br />
municipal solid waste from landfill than the UK. 32<br />
●<br />
2000 – <strong>Waste</strong> Strategy 2000 27 – set targets of<br />
recycling or composting 17% of the<br />
household waste stream by 2003/4. This was<br />
translated into statutory targets for each local<br />
authority. This is unlikely to be met as<br />
performance in 2001/2 was under 12%. 28<br />
A landfill site – photo courtesy of Hampshire County Council<br />
24<br />
Department of the Environment, This Common Inheritance: Britain’s Environmental Strategy, (1990)<br />
WASTE NOT, WANT NOT<br />
25<br />
Department of the Environment and Welsh Office, Making <strong>Waste</strong> Work: a strategy for sustainable waste management in England and<br />
Wales, (December 1995)<br />
26<br />
Department of the Environment, Transport and the Regions, A Way with <strong>Waste</strong>: A draft <strong>Waste</strong> Strategy for England and Wales (part<br />
one), (June 1999)<br />
27<br />
Department of the Environment, Transport and the Regions, <strong>Waste</strong> Strategy 2000 for England and Wales, (May 2000)<br />
28<br />
Municipal <strong>Waste</strong> Management Survey 2000/01 op.cit<br />
29<br />
Kees Wielenga, FFact Management Consultants An alternative view from the Netherlands, 3rd ESTET Conference, (18 September 2002)<br />
30<br />
Taking into account central government grants and business rates. This is far less than households think (they estimate £200-£260<br />
when asked). <strong>Waste</strong> Watch 1999 What people think about waste and MORI survey for the Environmental Services Association<br />
31<br />
<strong>Waste</strong>s which are <strong>not</strong> reusable, recyclable, compostable or flammable and have no other beneficial use<br />
32<br />
Hazell D, ESA, personal communication<br />
28
Figure 4: UK’s spend on waste per capita per week compared to<br />
the European average<br />
1.6<br />
1.4<br />
Estimated Spend per capita (£)<br />
1.2<br />
1<br />
0.8<br />
0.6<br />
0.4<br />
0.2<br />
0<br />
UK<br />
Rest of Europe<br />
Source: Hazell D, Environmental Services Association, Dr Dominic Hogg,<br />
and FFact Management Consultants<br />
3.9 Other European countries give higher<br />
political priority to waste issues, and therefore<br />
tend to have far higher public awareness of the<br />
waste problem. Many have introduced education<br />
programmes informing businesses and the public<br />
how to go about waste reduction, re-use,<br />
recycling and composting. They have been able<br />
to persuade their citizens that even making small<br />
lifestyle changes, for example choosing products<br />
containing recyclable materials, re-using<br />
products, composting and taking part in<br />
recycling schemes, can help to reduce growth in<br />
waste volumes, cut the cost of managing waste<br />
and secure environmental benefits for all.<br />
The current strategy is set out<br />
in <strong>Waste</strong> Strategy 2000<br />
3.10 <strong>Waste</strong> Strategy 2000 set out the vision,<br />
aims and objectives of sustainable waste<br />
management in England and Wales for the next<br />
20 years. It has two underlying principles:<br />
●<br />
●<br />
protection of the environment and of human<br />
health; and<br />
the waste hierarchy<br />
33<br />
Council Directive 75/442/EEC as amended by Council Directive 91/156/EEC<br />
34<br />
The 1875 Act charged local authorities with the duty to arrange the removal and disposal of waste<br />
35<br />
BPEO (see Chapter 5)<br />
3.11 Both of these are derived from the <strong>Waste</strong><br />
Framework Directive. 33 The first has been the<br />
rationale for the regulation of the waste industry<br />
since the Public Health Act of 1875. 34 The<br />
second is a proxy for sustainable waste<br />
management at national level, but should also<br />
take account of the BPEO (Best Practicable<br />
Environmental Option) 35 at local level and the<br />
proximity principle. 36 These fundamental<br />
principles would need to underpin any strategy<br />
for waste and resource use.<br />
3.12 <strong>Waste</strong> Strategy 2000 identified the need<br />
to minimise waste and to recycle, compost or<br />
re-use waste that was produced. However, there<br />
were few instruments put in place that would<br />
directly bear on waste growth. Positive actions<br />
that have been taken to deliver <strong>Waste</strong> Strategy<br />
2000 and meet current targets include:<br />
36<br />
The Proximity Principle is a key element of EU environmental and waste management policy. It advocates that all waste should be<br />
disposed of, or otherwise managed, as near to its place of production as possible<br />
WHY WASTE MATTERS – THE ECONOMIC AND ENVIRONMENTAL CHALLENGE<br />
29
●<br />
setting up the <strong>Waste</strong> and Resources Action<br />
Programme (WRAP) to help strengthen the<br />
market for recyclables;<br />
●<br />
minimising waste (as exemplified by the<br />
absence of any waste minimisation targets);<br />
and<br />
●<br />
●<br />
●<br />
●<br />
●<br />
●<br />
●<br />
setting local authorities statutory targets for<br />
recycling and composting of household<br />
waste for the first time;<br />
setting up arrangements for those targets to<br />
be pooled by local authorities where they<br />
wish to do so;<br />
increasing funding for local authorities<br />
through the Environmental Protection and<br />
Cultural Services (EPCS) Standard Spending<br />
Assessment which includes waste;<br />
setting up the <strong>Waste</strong> Minimisation and<br />
Recycling Fund to support local authority<br />
waste minimisation, recycling and<br />
composting projects in 2002 and 2003;<br />
announcing funding through the New<br />
Opportunities Fund to support community<br />
sector recycling;<br />
introducing legislation for a landfill<br />
allowances scheme setting limits for the<br />
amount of biodegradable municipal waste<br />
which councils may send to landfill; 37 and<br />
supporting investment in waste infrastructure<br />
through the Private Finance Initiative; funds<br />
have been repositioned to support very high<br />
recycling rates.<br />
3.13 Despite these positive steps, there remains<br />
concern that the targets in <strong>Waste</strong> Strategy 2000<br />
will <strong>not</strong> be met. In particular, there is concern<br />
that <strong>Waste</strong> Strategy 2000 gives insufficient<br />
attention to: 38<br />
●<br />
putting in place the economic and regulatory<br />
framework and enough associated policy<br />
tools to deliver tangible improvements in<br />
waste minimisation, re-use and recycling.<br />
There is a major and growing<br />
gap between waste produced,<br />
amounts of waste sent to<br />
landfill and what the Landfill<br />
Directive will allow<br />
3.14 Without more progress it is clear that<br />
England will move further away from meeting<br />
the EU Landfill Directive, as Figure 5 shows.<br />
3.15 Few alternatives to landfill have been put<br />
in place and international experience has<br />
demonstrated that there are long lead times in<br />
getting new infrastructure in place and<br />
changing behaviour. For example, in the<br />
Netherlands and Belgium it has taken 10-15<br />
years to achieve change following increases in<br />
landfill tax, producer responsibility measures<br />
and significant new investment in waste<br />
infrastructure.<br />
3.16 The UK has only 8 years until the first EU<br />
Directive comes into force and must make<br />
considerable progress quickly.<br />
WASTE NOT, WANT NOT<br />
37<br />
<strong>Waste</strong> and Emissions Trading Bill, November 2002<br />
38<br />
Select Committee on the Environment, Transport and Regional Affairs 5th report, <strong>Waste</strong> Management, the Strategic Challenge<br />
30
Figure 5: Estimated biodegradable waste for landfill in England<br />
versus the EU Landfill Directive targets (million tonnes)<br />
25<br />
Biodegradable waste for Landfill (mt)<br />
20<br />
15<br />
10<br />
5<br />
0<br />
Estimated biodegradable<br />
landfill if no further action<br />
(i)<br />
2010 Target<br />
2002<br />
2003<br />
2004<br />
2005<br />
2006<br />
2007<br />
2008<br />
2009<br />
2010<br />
2011<br />
2012<br />
Source: Strategy Unit analysis which (i) takes account of incinerator capacity coming on stream; and<br />
(ii) assumes incinerator capacity does <strong>not</strong> increase and all additional waste goes to landfill<br />
2013<br />
(ii)<br />
2013 Target<br />
Tonnages to be<br />
diverted away from<br />
biodegradable landfill<br />
to recycling/<br />
composting, thermal<br />
treatment or other<br />
methods of disposal<br />
2020 Target<br />
2014<br />
2015<br />
2016<br />
2017<br />
2018<br />
2019<br />
2020<br />
WHY WASTE MATTERS – THE ECONOMIC AND ENVIRONMENTAL CHALLENGE<br />
31
4. BARRIERS TO MORE SUSTAINABLE WASTE<br />
MANAGEMENT<br />
Summary<br />
A number of factors lie behind the absence of a more sustainable<br />
approach to waste management in England:<br />
●<br />
historically, waste has <strong>not</strong> been an area of policy priority and there<br />
has been a relative abundance of cheap landfill sites. This has<br />
resulted in comparatively low levels of investment in waste<br />
management;<br />
●<br />
there has been a lack of public awareness of the seriousness of the<br />
waste problem alongside perceptions that new waste facilities of all<br />
kinds may be damaging to health or have other disbenefits;<br />
●<br />
the economic and regulatory framework has offered few incentives<br />
either for a reduced rate of growth in waste volumes or for<br />
alternative methods of management and disposal (such as recycling);<br />
●<br />
delivery structures at both national and local level have been<br />
complex, with insufficiently clear responsibilities and accountabilities<br />
for delivering change; and<br />
●<br />
there have been various practical problems and barriers such as<br />
delays in granting planning permissions for waste management<br />
plants of all kinds.<br />
WASTE NOT, WANT NOT<br />
32<br />
England has <strong>not</strong> needed to<br />
invest in alternatives to landfill<br />
because of its geology and<br />
history<br />
4.1 England’s reliance on landfill reflects its<br />
geology and extraction industry history, which<br />
have made suitable landfill sites relatively<br />
abundant. This abundance of cheap landfill sites<br />
has also meant that England, unlike many of its<br />
European neighbours, has <strong>not</strong> needed to invest<br />
to the same degree in alternative waste<br />
management options.<br />
4.2 However, England now needs to make a<br />
substantial shift away from landfill to other<br />
methods of waste disposal. This will require a<br />
number of institutional and practical barriers set<br />
out in this chapter to be overcome.
<strong>Waste</strong> has <strong>not</strong> been an area of<br />
policy priority<br />
4.3 Historically, waste policy has struggled to<br />
compete for resources with other areas of public<br />
expenditure both nationally and locally. Indeed,<br />
environmental issues generally have only really<br />
moved towards the top of the policy agenda<br />
over the past 15-20 years. Even then the focus<br />
has been on problems such as climate change<br />
rather than the challenges posed by waste.<br />
The economic and regulatory<br />
framework has offered few<br />
incentives for waste<br />
minimisation or the<br />
development of alternative<br />
methods of waste<br />
management<br />
4.4 The economic and regulatory framework in<br />
the UK has done comparatively little to<br />
incentivise waste minimisation or to encourage<br />
a move to alternatives to landfill: 39<br />
●<br />
●<br />
●<br />
there have been few measures to curb the<br />
growth of waste volumes apart from, for<br />
example the introduction of producer<br />
responsibility measures for packaging targets<br />
following the EU Packaging Directive;<br />
householders have little or no incentive to<br />
minimise or recycle their waste. They pay the<br />
same regardless of the amount of waste they<br />
produce. The costs of waste collection and<br />
disposal are only indirectly passed on to<br />
householders through Council Tax;<br />
despite the introduction of the landfill tax,<br />
landfill has remained a low cost and readily<br />
accessible method of waste disposal. To date<br />
●<br />
the level of landfill tax has been set to reflect<br />
environmental costs of landfill and at too low<br />
a rate either to incentivise industry to<br />
develop more resource efficient means of<br />
production or to encourage local authorities<br />
to use alternatives; 40 and<br />
explicit incentives for recycling have been<br />
limited. Measures such as the payment of<br />
recycling credits for waste collection<br />
authorities, have had only a marginal impact<br />
on the costs of treatment and disposal, and<br />
collection costs have remained unaffected.<br />
Similarly, neither statutory recycling targets<br />
nor measures to promote markets for<br />
recyclates have yet had much impact.<br />
Delivery structures have been<br />
too complex to be effective<br />
4.5 Responsibility for waste is split between<br />
several government departments and agencies:<br />
●<br />
●<br />
●<br />
policy between DEFRA and DTI;<br />
funding between HMT, ODPM and DEFRA;<br />
regulatory responsibility is split between the<br />
Environment Agency (EA) and local<br />
authorities.<br />
4.6 Various stakeholders consulted as part of<br />
this study have argued that the lack of a single<br />
focus for waste policy has caused confusion,<br />
made coherent policy making more difficult,<br />
and made it more difficult to make the case for<br />
waste to be treated as a priority for central<br />
government. A number of stakeholders have<br />
called for the current split of responsibility<br />
between DEFRA and DTI in particular to end. 41<br />
While DEFRA leads on most waste negotiations,<br />
responsibility for responding to some EU <strong>Waste</strong><br />
Directives is split between DTI and DEFRA as<br />
both Departments have major interests.<br />
39<br />
there are several reviews of the economic and regulatory framework in the literature. See, for example, Final Report to the National<br />
Resources and <strong>Waste</strong> Forum, Eunomia Research and Consulting and Julia Hummel, The Legislative Driven Economic Framework<br />
Promoting MSW Recycling in the UK. (2002)<br />
40<br />
Dirk Hazell, ESA, personal communication<br />
41<br />
See for example BIFFA Future Perfect (2002)<br />
BARRIERS TO MORE SUSTAINABLE WASTE MANAGEMENT<br />
33
4.7 As well as DTI and DEFRA, the EA has also<br />
taken a role in trying to clarify policy. Whilst this<br />
is understandable, it adds to confusion. DEFRA<br />
and the EA need to work together to ensure<br />
there is a clear interpretation of EU waste policy<br />
from DEFRA, and the EA needs to play its role in<br />
ensuring this interpretation is used consistently<br />
in the provision of advice across regions.<br />
4.8 At local authority level, the split between<br />
collection and disposal authorities appears to be<br />
unique in Europe. 42 The Audit Commission 43<br />
has found that this split leads to inefficiencies<br />
and state that two tier local authorities, where<br />
collection and disposal are split, will find it<br />
harder to meet their targets.<br />
The planning system has<br />
caused long delays in getting<br />
permission for new waste<br />
facilities of all kinds<br />
4.9 Delays in obtaining planning permission are<br />
perceived as a barrier to the delivery of the<br />
Landfill Directive targets and to moving to more<br />
sustainable waste management. The issues of<br />
concern are:<br />
●<br />
●<br />
●<br />
the length of time it takes to secure planning<br />
permission;<br />
the risks that permission will be refused due<br />
to public opposition; and<br />
inconsistency in planning decisions.<br />
4.10 While some delay may be a legitimate part<br />
of the local democratic process, a number of<br />
stakeholders have expressed concern at<br />
excessive delays in getting planning permission<br />
for waste facilities of all kinds. Applications for<br />
composting facilities (both open windrow and<br />
in-vessel), recycling facilities, incinerators and<br />
landfill sites have all been subject to opposition<br />
by the public, often due to concerns about<br />
effects on local house prices, traffic and general<br />
nuisance such as odours and noise.<br />
4.11 The causes of delay include:<br />
●<br />
●<br />
●<br />
●<br />
permissions refused by local authorities due<br />
to public opposition even where the<br />
proposals are reasonable and in line with the<br />
waste plan;<br />
applications being turned down and going to<br />
appeal or other problems in reaching a final<br />
decision;<br />
inconsistency in planning decisions; and<br />
delays in the production of waste plans.<br />
<strong>Waste</strong> plans can take around four years to<br />
produce. A number of planning authorities<br />
have still to produce waste development<br />
plans, while others, whose plans were<br />
adopted prior to publication of <strong>Waste</strong><br />
Strategy 2000, need to consider their<br />
revision.<br />
4.12 Some of the causes are specifically related<br />
to the nature of waste:<br />
●<br />
●<br />
by their nature waste facilities are unwelcome<br />
and controversial and objections will always<br />
be made. Those seeking to secure new<br />
facilities do <strong>not</strong> always take a realistic view of<br />
timescales and make applications<br />
accordingly; 44<br />
there are generic issues which are repeated at<br />
every public inquiry, often without new<br />
information from a previous debate. This<br />
adds delay and may <strong>not</strong> facilitate the<br />
democratic process. Equally some issues may<br />
<strong>not</strong> properly be for the land use planning<br />
system at all;<br />
WASTE NOT, WANT NOT<br />
42<br />
EUNOMIA Research and Consulting, Dr Dominic Hogg – <strong>Waste</strong> in the Resource Productivity Framework<br />
43<br />
Audit Commission, <strong>Waste</strong> Management, Guidance for Improving Services<br />
44<br />
Some commentators have compared the UK system to nations where planning permission is an assumption with a permit to operate,<br />
or where democratic objections are <strong>not</strong> heard. The SU has <strong>not</strong> looked into these fundamental issues. In the case of waste, there is a<br />
good case that it is <strong>not</strong> only legitimate for objections to be taken fully into account, but also the process is essential if full ownership<br />
of waste is to be achieved and with it sustainable choices<br />
34
●<br />
●<br />
●<br />
●<br />
facilities require a pollution control permit or<br />
licence 45 in addition to planning permission.<br />
This can be an additional cause of delay;<br />
some areas interpret the proximity principle<br />
very stringently without taking account of the<br />
whole life cycle impact of waste. This may<br />
lead to unnecessary duplication of facilities<br />
and thus avoidable environmental impacts;<br />
there is a debate about whether there is a<br />
need at all, at a national level, for incineration<br />
capacity. Guidance is required on whether<br />
this is an acceptable form of waste<br />
management and, if so, under what<br />
circumstances; and<br />
local authority elected members see no gains<br />
from taking decisions on planning<br />
applications for waste facilities which are<br />
never popular. Facilities are therefore turned<br />
down or <strong>not</strong> determined within the statutory<br />
time period, leading to delay and cost both<br />
to the taxpayer and applicant on appeals.<br />
This can be true even where facilities have<br />
been agreed as necessary in the municipal<br />
waste strategy.<br />
underpinned by long-term contracts, essentially<br />
because of the scale and cost of making PFI<br />
bids. There is also funding available through the<br />
Landfill Tax Credit Scheme (LTCS) but this has<br />
been criticised for failing to adequately focus on<br />
funding projects to reduce, re-use and recycle<br />
waste and for a lack of transparency and<br />
quantifiable outputs. 46<br />
4.15 The problems of long-term, inflexible<br />
contracts for waste management options have<br />
been raised by a number of stakeholders,<br />
particularly with respect to incinerators.<br />
Incinerators are typically contracted on a 25-<br />
year basis to take guaranteed minimum volumes<br />
of waste. These contracts are agreed by local<br />
authorities because they see them as necessary<br />
to finance the high capital costs of an<br />
incinerator and to ensure continuity of<br />
feedstock. However, this may reduce the<br />
flexibility and incentives for local authorities to<br />
pursue recycling. It may be preferable to<br />
structure contracts for incinerators so they take<br />
waste only after other waste streams have been<br />
separated. This would help to avoid any<br />
potential for ‘crowding out’ other options<br />
including recycling.<br />
To date there has been an<br />
unwillingness in England to<br />
invest on the scale necessary<br />
to achieve a more sustainable<br />
waste management system<br />
4.13 Earlier chapters have shown that England<br />
invests less in waste management and disposal<br />
than other countries. This is a major factor<br />
behind the failure to shift away from landfill.<br />
4.14 Where investment does take place, there<br />
have been concerns about the value for money<br />
obtained. PFI schemes, for example, have<br />
tended to support large infrastructure projects,<br />
4.16 Insufficient local authority expertise in<br />
negotiating and producing effective contracts<br />
has been raised as a barrier to more sustainable<br />
waste management by a number of<br />
stakeholders.<br />
Public awareness of the waste<br />
problem, their role in solving<br />
it and the true health risks of<br />
different waste facilities, is<br />
very low<br />
4.17 Public awareness of the growing waste<br />
problem is low. Recent MORI research indicated<br />
45<br />
An authorisation and licensing procedure which is applied to processes which can have a harmful effect on the environment. It is<br />
administered by the Environment Agency and is generally required by a developer to operate a waste management facility in addition<br />
to the requirement to obtain planning permission<br />
46<br />
Financial Times, Landfill Tax Credit Lacks Accountability (25 July 2002)<br />
BARRIERS TO MORE SUSTAINABLE WASTE MANAGEMENT<br />
35
that only 7% of the public identify waste as an<br />
important environmental issue. 47 There is also a<br />
lack of public acceptance that they must do<br />
more to tackle waste, for example, by buying<br />
more recycled goods and participating in<br />
schemes to recycle waste. 48 There is a good<br />
deal of misunderstanding about waste, and the<br />
role of industry and households in tackling it is<br />
<strong>not</strong> widely recognised.<br />
Box 5: MORI research into public attitudes towards recycling and<br />
waste management 49<br />
MORI research found a number of barriers to public awareness of waste. For example:<br />
●<br />
●<br />
●<br />
●<br />
●<br />
only around half of households with a kerbside collection scheme are aware that this is<br />
available to them;<br />
one in three do <strong>not</strong> feel informed about which materials can and can<strong>not</strong> be recycled;<br />
two in five do <strong>not</strong> know where to recycle locally;<br />
two in three do <strong>not</strong> feel informed enough about incineration as an option; and<br />
there are particular information barriers regarding composting (i.e. how to compost).<br />
Public acceptance of personal responsibility for waste varies considerably across MORI’s research.<br />
What is clear is that where the public perceives other parties to be inactive in promoting<br />
recycling (the Government, manufacturers, retailers etc.) they tend to lay the blame elsewhere. 50<br />
4.18 There are many waste ‘myths’ (see Box 6).<br />
For example, the vast majority of households<br />
think they pay more for waste management than<br />
is actually the case. The majority of people believe<br />
that around £200 per year of Council Tax is spent<br />
on waste management and almost a third think<br />
they pay over £260. 51 The reality – as <strong>not</strong>ed<br />
above – is closer to £50 per household per year.<br />
Box 6: Common waste ‘myths’… and what the MORI research<br />
revealed about the issue 52<br />
Myth: The majority of people in the UK recycle their waste…<br />
Reality: 85% of the UK population say that they recycle waste 53 – if 85% of people did recycle<br />
everything that it is currently possible to recycle on a regular basis – and sufficient markets were<br />
found – this would translate into a national recycling rate of 45%. It is 12%.<br />
47<br />
MORI research for SU op cit. 7% awareness without prompting. However, when prompted, this figure rose to 34%<br />
WASTE NOT, WANT NOT<br />
48<br />
ENCAMS quantitative national study involving 1,000 respondents. 20% of respondents were put off from recycling because they<br />
<strong>want</strong>ed a tidy home; 23% felt that councils and retailers ought to be doing more to recycle; 14% said they were too busy to recycle.<br />
The report concluded that a convenient doorstep recycling collection service taking into account residents’ needs was crucial.<br />
ENCAMS <strong>Waste</strong> Segmentation Report, (November 2002) is available at www.encams.org<br />
49<br />
MORI quantitative research compiled for the SU, including Recycling and packaging from the domestic waste stream (MORI 1999),<br />
<strong>Waste</strong> management in Leicestershire, (MORI 2002) together with original focus group research<br />
50<br />
MORI focus group in Kettering, (September 2002)<br />
51<br />
<strong>Waste</strong> Watch 1999 What people think about waste and MORI survey for the Environmental Services Association quoted in ESA’s<br />
Resource Management and Recovery fortnightly magazine, (issue 6, 6 September 2002). See also MORI qualitative research for the SU,<br />
September 2002 op cit<br />
52<br />
MORI Public Attitudes Towards Recycling and <strong>Waste</strong> Management Research for the SU op cit<br />
53<br />
<strong>Waste</strong> Watch 1999 What people think about waste<br />
36
Box 6: Common waste ‘myths’… and what the MORI research<br />
revealed about the issue (continued)<br />
MORI survey evidence: The public perceives a strong and positive association between<br />
recycling and the environment. However, to the majority of the public, environmental<br />
motivations are <strong>not</strong> sufficient alone to encourage them to recycle on a regular, rather than adhoc<br />
basis. Rather, regular participation in recycling is conditional upon other factors – <strong>not</strong>ably<br />
convenience and time. In particular, demand for kerbside collection services is high; three in four<br />
people said they would recycle more if this was available to them. Education and awareness<br />
campaigns are also key; two in five people said they did <strong>not</strong> know where to go to recycle locally,<br />
and one in three did <strong>not</strong> fully understand which materials could and could <strong>not</strong> be recycled.<br />
Myth: Doing ‘my little bit’ won’t make a difference…<br />
Reality: Yes it will. If all the aluminium drinks cans sold in the UK were recycled there would be<br />
14 million fewer dustbins of waste each year. 54 Every tonne of glass recycled saves more than a<br />
tonne of raw materials. 55 That means less quarrying, less damage to the countryside, less<br />
pollution and global warming, and more energy savings. Switching from plastic to reusable glass<br />
bottles, recycling newspapers, choosing products containing recyclable materials, reusing carrier<br />
bags, and composting garden cuttings can directly benefit the environment and reduce cost<br />
increases due to waste growth.<br />
The Flintham Ecoteam programme<br />
Households from the Nottinghamshire village of Flintham took part in a seven-month pilot project<br />
aimed at reducing the impact of daily life on the environment. Householders were supported by the<br />
local council and the green charity, Global Action Plan. One family who participated in the scheme,<br />
the Claytons said: “Before we started the programme, we’d fill nearly three large bin bags a<br />
week…now we’ve managed to bring that down to just one.” With the help of a coach, the<br />
Claytons now recycle all their plastics, cardboard, paper and glass, as well as composting their<br />
organic waste. And to reduce their amount of packaging, they buy loose fruit and vegetables rather<br />
than pre-packaged. The Flintham figures are still being analysed, but the experience of similar<br />
programmes suggests that, on average, each household can reduce its rubbish by 50%.<br />
The Guardian, 4 September 2002<br />
MORI survey evidence: The concept of ‘fairness’ is very important to the public i.e. there is a<br />
demand for a collective public response led by action from all stakeholders, particularly the<br />
Government, local authorities and manufacturers. While the disposal of the UK’s waste was <strong>not</strong><br />
an issue at the forefront of people’s minds, when prompted the public did make the links<br />
between waste and global issues such as climate change, and local issues, including street<br />
cleaning, litter and the wider ‘liveability’ of the local area.<br />
Myth: Incineration is a waste management option which is wholly unacceptable to the public…<br />
Reality: Incineration is undoubtedly a contentious option, and amongst some sections of the<br />
population it provokes an instinctive negative reaction because of associations with health risks,<br />
and polluting emissions.<br />
54<br />
UK Aluminium Packaging Recycling Organisation (Alupro). Website: www.alupro.org.uk<br />
55<br />
DETR Every little bit helps<br />
BARRIERS TO MORE SUSTAINABLE WASTE MANAGEMENT<br />
37
Box 6: Common waste ‘myths’… and what the MORI research<br />
revealed about the issue (continued)<br />
MORI survey evidence: Awareness of incineration as a waste management option is very low.<br />
Although contentious, there does <strong>not</strong> appear to be any absolute rejection of incineration. Rather,<br />
acceptance tends to be conditional upon several requirements, including:<br />
●<br />
●<br />
●<br />
●<br />
incineration being part of a recycling-led strategy where everything that can be recycled has<br />
been recycled;<br />
certain materials are separated out and <strong>not</strong> incinerated (toxicity from certain plastics was a<br />
particular concern);<br />
operating guidelines for incinerators are strict and preferably under public control rather than<br />
managed by a private company; and<br />
the environmental benefits, such as energy recovery from incineration, are emphasised.<br />
Myth: The public will never support variable household charging schemes…<br />
Reality: The idea of charging people on the basis of how much unsorted rubbish they produce<br />
is a contentious issue. Initial reactions are often negative, because participants immediately<br />
associate the idea with ‘paying extra’ on top of their existing Council Tax. The public also<br />
foresees practical barriers, including disproportionate impacts on families, and concerns that<br />
increased fly-tipping will result. Yet a survey by the EA 56 showed that 60% were in favour if<br />
recycling facilities were in place.<br />
MORI survey evidence: Local authority plans to pursue variable household charging must be<br />
sensitively and thoroughly explained to the public to gain their support. MORI found that in<br />
principle people were more accepting of variable household charging if certain assurances<br />
were given:<br />
●<br />
●<br />
●<br />
●<br />
there must be an opportunity to recycle voluntarily before charging is introduced (pointing to<br />
the importance of investment in facilities and infrastructure first);<br />
charging must be in accordance with the ‘Polluter Pays Principle’ i.e. dependent on how much<br />
unsorted rubbish is produced, with refunds given to reward those who recycle and compost<br />
and disincentives to those who do <strong>not</strong>;<br />
any revenue generated should be accountable and spent openly on related environmental<br />
issues within the local community;<br />
responsibility is <strong>not</strong> placed only on individuals – other stakeholders (such as manufacturers and<br />
supermarkets) should be subject to rewards and penalties for their own contribution and<br />
performance in relation to recycling and waste minimisation;<br />
WASTE NOT, WANT NOT<br />
●<br />
public opinion also flagged the importance of providing a ‘safety net’ to protect<br />
disadvantaged people; addressing the specific needs of different dwelling types (e.g. flats) and<br />
tougher measures to discourage, and to penalise ‘fly-tipping.’<br />
56<br />
Test Research for the EA, Household <strong>Waste</strong> Questionnaire – England & Wales, (April 2002)<br />
38
4.19 Concerns are regularly raised about the<br />
potential health effects of emissions from waste<br />
facilities of all kinds. It is true that all waste<br />
management options contain some degree of<br />
risk. 57 However, these risks are low and<br />
generally much lower than the public perceives,<br />
or that they find acceptable from other<br />
activities. The waste disposal and recycling<br />
industry is responsible for 4.3%, 0.32% and<br />
5.2% 58 of emissions to air, water and sewers<br />
respectively. Other industrial activities therefore<br />
have a far greater impact than the waste<br />
disposal and recycling industry. These<br />
percentages would be lower still if other<br />
unregulated emissions to our atmosphere, such<br />
as car emissions, were included in the figures.<br />
4.20 In the case of landfill, there is a small<br />
statistical link between landfills and birth<br />
defects. 59 However, cause and effect is <strong>not</strong><br />
proven because of other elements in the<br />
environment (such as industrial pollution) which<br />
makes analysis of the issues complex.<br />
Incinerators also cause concern to the public,<br />
yet these are the most tightly regulated of<br />
industrial plant. UK municipal solid waste<br />
incinerators are estimated to release less than<br />
1.5% of the total for any of the 35 pollutants in<br />
the National Atmospheric Emissions Inventory,<br />
and less than 0.5% for 27 of them. Dioxin<br />
emissions to the air from UK municipal solid<br />
waste incinerators are now estimated to be less<br />
than 1% of the UK total, 60 down 200 fold from<br />
those of 5 years ago.<br />
4.21 The public is becoming more concerned<br />
about other waste management facilities where<br />
the potential risks are also very small. It is<br />
therefore important that local authorities have<br />
sufficient information on the relative health<br />
effects of different waste management options<br />
to help guide their choices.<br />
4.22 Policies to reduce the production of waste<br />
and the hazardousness of waste, as well as the<br />
regulation of waste facilities, are the most<br />
effective ways of managing risks. These risks are<br />
regulated by the EA who can take action to<br />
ensure that risks are <strong>not</strong> unacceptable and are<br />
reduced and effectively managed.<br />
There is insufficient data and<br />
research on waste streams<br />
4.23 Data on specific waste streams, their<br />
growth rates, composition, life cycles and<br />
impacts is inadequate and yet is vital to<br />
underpin sound waste management. Currently<br />
data collection and publication is widespread<br />
but <strong>not</strong> very well co-ordinated:<br />
●<br />
●<br />
●<br />
●<br />
●<br />
a municipal waste management survey<br />
(MWMS) – a comprehensive annual survey of<br />
local authorities in England and Wales is<br />
carried out by DEFRA;<br />
an industrial and commercial survey – last<br />
carried out in 1998/9 by the EA;<br />
construction and demolition data – gathered<br />
by ODPM;<br />
the <strong>Waste</strong> Collection and Disposal Statistics<br />
Survey – an annual survey prepared by the<br />
Chartered Institute of Public Finance and<br />
Accountancy (CIPFA); and<br />
the LTCS funds research data and collection<br />
but this is poorly co-ordinated and there is<br />
no systematic dissemination of the results.<br />
Current research and data gaps include:<br />
●<br />
●<br />
more consistent data on the source and<br />
composition of waste;<br />
better data on what is spent on waste<br />
management and by whom;<br />
57<br />
EUNOMIA Research and Consulting Ltd, Dr Dominic Hogg, Health effects of waste management treatments – work for SU<br />
58<br />
Based on total 2000 aggregated releases. Source: McLanaghan Dr S. Delivering the Landfill Directive: The role of new and emerging<br />
technologies report for the SU (November 2002) available at www.strategy.gov.uk/2002/waste/downloads/technologies.pdf<br />
59<br />
Elliott et al, Health Outcomes in Populations Living Near Landfill Sites British Medical Journal (August 2001)<br />
60<br />
The Environment Agency, Solid Residues from Municipal <strong>Waste</strong> Incinerators in England and Wales (May 2002)<br />
BARRIERS TO MORE SUSTAINABLE WASTE MANAGEMENT<br />
39
●<br />
time series data on the costs of dealing with<br />
waste;<br />
●<br />
●<br />
●<br />
●<br />
●<br />
●<br />
●<br />
product specific information, for example to<br />
monitor the impact of producer responsibility<br />
directives (e.g. WEEE); 61<br />
further development of life cycle analysis and<br />
assessment tools that can be used for policy;<br />
better understanding of the drivers of waste<br />
growth and compositional changes in waste<br />
streams;<br />
a good understanding of what determines<br />
household and other behaviour;<br />
systematic dissemination of the EA’s data and<br />
research programme;<br />
co-ordination of research bodies undertaking<br />
research on waste; and<br />
the development of a central database to<br />
access key research and data.<br />
WASTE NOT, WANT NOT<br />
61<br />
<strong>Waste</strong> Electrical and Electronic Equipment<br />
40
5. MOVING FORWARDS TO A NEW STRATEGY<br />
Summary<br />
Tackling the problem of rapidly growing volumes of household waste<br />
requires a clear vision setting out what needs to be achieved.<br />
The vision of this report is that: by 2020, England should have a world<br />
class waste management system that allows it to prosper whilst<br />
minimising environmental impacts and protecting human health.<br />
The practical implementation of this vision needs to be guided by a<br />
number of subsidiary aims and principles:<br />
●<br />
●<br />
●<br />
●<br />
growth in waste volumes should be de-coupled from growth in GDP;<br />
the costs of waste management and disposal should be fully<br />
internalised in the costs of all goods and services;<br />
responsibility for moving to a more sustainable path for waste<br />
management rests <strong>not</strong> only with central government but with local<br />
authorities, businesses, local communities and individual households.<br />
To succeed everyone needs to play their role; and<br />
the measures taken to advance future strategy should be soundly<br />
based in cost-benefit terms.<br />
Action is needed in three main areas to deliver the vision:<br />
●<br />
●<br />
putting in place a robust long term economic and regulatory<br />
framework with significant increases in the landfill tax and new<br />
incentives for households to minimise waste and increase recycling;<br />
a package of short to medium term investment measures to facilitate<br />
the transition to a more sustainable waste management system<br />
including action to: reduce the rate of growth in waste volumes;<br />
boost recycling and its associated infrastructure; fund new waste<br />
management technologies; and<br />
MOVING FORWARDS TO A NEW STRATEGY<br />
41
Summary (continued)<br />
●<br />
funding for new waste infrastructure and reform of delivery<br />
structures to ensure investment is accompanied by improved and<br />
robust delivery structures.<br />
Action in these areas should achieve:<br />
● a 1% reduction by weight in the rate of waste growth by 2005/06;<br />
● an increase in recycling rates for household waste to 45% by 2015<br />
with the majority of households participating in kerbside collection<br />
schemes;<br />
●<br />
50% of households carrying out home composting by 2005/06; and<br />
● a reduction in the amount of waste going to landfill from 2005/06.<br />
WASTE NOT, WANT NOT<br />
By 2020 England should be<br />
enjoying the benefits of a<br />
more prosperous economy<br />
and a safer and cleaner<br />
environment<br />
5.1 Chapter 3 set out the clear links between<br />
waste policy and its contribution to environmental<br />
goals. But achieving these benefits is <strong>not</strong> cost free.<br />
It involves investment, commitment and a change<br />
in behaviour and attitudes. There will be<br />
important trade-offs and choices to make about<br />
how much we are all prepared to pay and do to<br />
achieve the required changes.<br />
5.2 Paying for the environment and better<br />
waste management does <strong>not</strong> mean that the<br />
wealth generating capacity of the economy has<br />
to be sacrificed. On the contrary, a less wasteful<br />
society is one that can create and use its wealth<br />
more sustainably. <strong>Waste</strong> itself can be a valuable<br />
resource – e.g. as a fuel source; as a replacement<br />
for raw materials; or to increase soil fertility. This<br />
is why the vision of this report is:<br />
“To have, by 2020, a world class waste<br />
management system that allows the country<br />
to prosper whilst minimising environmental<br />
impacts and protecting human health.”<br />
5.3 This vision puts waste firmly at the centre of<br />
the sustainable development objective for England<br />
and is consistent with the significant contribution<br />
that waste can make to that objective.<br />
To get there the nation should<br />
aim to achieve three key goals<br />
that put reduction and<br />
recycling at the centre of its<br />
waste strategy<br />
5.4 To make the vision meaningful, there needs<br />
to be practical goals to aim for. These are:<br />
●<br />
the rate of growth in waste volumes should<br />
be decoupled from the rate of economic<br />
growth (i.e. so that waste growth is slower).<br />
This is a challenging goal that few countries<br />
have achieved 62 but is critical to making real<br />
progress;<br />
62<br />
The Netherlands, Iceland and Germany have demonstrated some success in de-linking municipal waste generation from economic<br />
activity over time. Source: European Topic Centre on <strong>Waste</strong><br />
42
●<br />
●<br />
the costs of waste management and disposal<br />
should be fully internalised in the costs of all<br />
goods and services; and<br />
the waste management options that secure<br />
the greatest environmental benefit should be<br />
pursued, provided they are soundly based in<br />
cost-benefit terms.<br />
from waste by recycling it, composting or<br />
recovering energy (i.e. through incineration)<br />
and, finally, the option at the bottom of<br />
the hierarchy is to dispose of waste e.g.<br />
through landfill.<br />
Figure 6: the waste hierarchy 63<br />
The achievement of these<br />
goals should be guided by<br />
sound principles<br />
5.5 If these goals are to be achieved they will<br />
need to draw on a set of guiding principles. The<br />
three important ones for waste are:<br />
Reduce<br />
Re-use<br />
●<br />
●<br />
using the waste hierarchy as a guide to<br />
environmental benefits and applying the<br />
BPEO to make decisions;<br />
setting out a clear framework of roles and<br />
responsibilities; and<br />
Recover<br />
Disposal<br />
●<br />
keeping options open.<br />
Using the waste hierarchy and<br />
the BPEO to achieve higher<br />
rates of waste reduction, reuse<br />
and recycling<br />
5.6 The waste hierarchy is a useful framework<br />
that has become a cornerstone of sustainable<br />
waste management, setting out the order in<br />
which options for waste management should be<br />
considered based on environmental impact.<br />
Following the hierarchy (see Figure 6) the best<br />
option for the environment is to generate less<br />
waste. The second best option is to re-use<br />
products and materials, thirdly to recover value<br />
63<br />
As set out in the EC <strong>Waste</strong> Framework Directive<br />
64<br />
See for example, consultation responses to A Way With <strong>Waste</strong> op. cit<br />
5.7 The merits or otherwise of the waste<br />
hierarchy have been widely debated. The main<br />
criticisms are that:<br />
●<br />
●<br />
it is too simplistic a tool to use; 64 and<br />
it does <strong>not</strong> explicitly incorporate a costbenefit<br />
dimension for reaching judgements<br />
about the preferred point within the<br />
hierarchy.<br />
5.8 To answer the first of these, more<br />
sophisticated variants of the hierarchy, (as<br />
shown for example in Figure 7) have been<br />
developed which set out the range of waste<br />
management options more comprehensively.<br />
MOVING FORWARDS TO A NEW STRATEGY<br />
43
Figure 7: A more detailed version<br />
of the waste hierarchy<br />
<strong>Waste</strong><br />
reduction<br />
Re-use<br />
Recycling &<br />
Composting<br />
Energy recovery with<br />
heat & power<br />
Energy recovery<br />
Landfill with energy recovery<br />
Landfill<br />
Source: in Murray R. Creating Wealth from <strong>Waste</strong><br />
from work by Merrill Lynch<br />
binding tool in the same way as the <strong>Waste</strong><br />
Hierarchy in Figure 6 under the EC <strong>Waste</strong><br />
Framework Directive.<br />
Figure 8: SU version of the<br />
waste hierarchy<br />
Reduce<br />
Re-use<br />
Recycle<br />
A mixture of pretreatment<br />
and disposal<br />
options<br />
5.9 A third alternative is possible by combining<br />
the two versions in Figures 6 and 7 into Figure 8.<br />
This retains the principle of moving up the<br />
hierarchy to a reduction-re-use-recycling-led<br />
strategy but makes a clearer distinction between<br />
these options and disposal or pre-treatment<br />
options. 65 It is a clearer guide to non-waste<br />
experts and underpins the approach of the<br />
strategy set out later in this chapter and in<br />
detail in the remainder of the report, namely to<br />
aim for options in the top half of the hierarchy.<br />
It provides a helpful way of focusing on the<br />
main themes in this strategy – namely reducing,<br />
re-using and recycling waste. However, it should<br />
be stressed that it is <strong>not</strong> an accepted and legally<br />
5.10 However, it is clear that whatever the<br />
specification of the waste hierarchy, it can only<br />
be a partial guide to decision making. It shows<br />
an ordering of the options and illustrates that<br />
each step up will generate an additional<br />
environmental benefit. To be of practical use it<br />
needs to be assessed against other criteria,<br />
including costs, to reach an acceptable point on<br />
the hierarchy. This is why the principle of the<br />
BPEO is used by waste management experts at<br />
local level together with the hierarchy (see Box 7).<br />
5.11 There are cases where the BPEO for a type<br />
of waste may be some way down the hierarchy.<br />
Box 7: Best Practicable Environmental Option (BPEO)<br />
The Royal Commission on Environmental Pollution (12th Report) defined BPEO as<br />
WASTE NOT, WANT NOT<br />
“for a given set of objectives, the option that provides the most benefits or the least damage to<br />
the environment as a whole, at acceptable costs in the long term as well as in the short term.”<br />
65<br />
This does <strong>not</strong> imply that pre-treatment or other disposal options have no value, nor that all the options within the lower half have the<br />
same environmental impact<br />
44
For example, recycling may <strong>not</strong> be the BPEO if<br />
the costs of recovery or transport emissions<br />
associated with it are high compared to landfill.<br />
5.12 For the remainder of this report the term<br />
‘residual waste’ is used to describe waste from<br />
household sources containing materials that<br />
have <strong>not</strong> been separated and sent for<br />
reprocessing – i.e. the bottom half of the “SU<br />
waste hierarchy”.<br />
Clarity about the roles and<br />
responsibilities of different<br />
stakeholders is important<br />
5.13 Everyone has a part to play in solving the<br />
problems associated with waste. The roles and<br />
responsibilities of the different stakeholders<br />
should therefore be clear. Box 8 sets these out.<br />
Box 8: Roles and Responsibilities<br />
Everyone should:<br />
●<br />
●<br />
●<br />
seek to minimise their own waste;<br />
re-use, recycle and compost as much as they can;<br />
buy recycled goods.<br />
central government needs to:<br />
●<br />
●<br />
●<br />
●<br />
●<br />
take the lead in setting the strategic policy direction on waste management;<br />
put in place an appropriate economic and regulatory framework to underpin the strategy;<br />
ensure the key players are well informed about the strategy and its implications;<br />
contribute appropriately to local authority funding to make the necessary changes; and<br />
buy and specify products incorporating recyclates as part of its procurement policy.<br />
local authorities need to:<br />
●<br />
●<br />
put in place local strategies for sustainable management of municipal waste;<br />
plan for and secure an appropriate range of facilities for the management of municipal waste<br />
within their area, including co-operation and joint planning with other local authorities and<br />
the private sector;<br />
●<br />
●<br />
●<br />
allocate sufficient resources to waste;<br />
secure management of waste in line with the BPEO and their own local strategy; and<br />
provide ongoing education and practical advice for local people.<br />
MOVING FORWARDS TO A NEW STRATEGY<br />
45
Box 8: Roles and Responsibilities (continued)<br />
The waste industry needs to:<br />
●<br />
●<br />
●<br />
●<br />
provide an appropriate range of facilities to handle waste in line with government policy and<br />
regulatory requirements;<br />
take responsibility for the safe, long term operation and aftercare of waste facilities;<br />
mitigate, as far as it is practical, the impact of waste facilities on communities; and<br />
identify and pursue opportunities for developing new technologies/approaches.<br />
manufacturers/processors need to:<br />
●<br />
●<br />
●<br />
●<br />
comply with statutory obligations to recycle or recover materials, for example under producer<br />
responsibility obligations;<br />
seek to recycle waste materials wherever their manufacturing processes allow it;<br />
pre-treat waste, where necessary, before disposal to reduce hazards and adverse environmental<br />
impact;<br />
comply with regulations and give their workforce the training to do so.<br />
householders need to:<br />
●<br />
●<br />
●<br />
●<br />
minimise their own waste and encourage manufacturers to do so by refusing over packaged<br />
and wasteful products;<br />
source separate waste and use recycling facilities provided including bring sites;<br />
accept responsibility and ownership of their waste, including accepting waste management<br />
facilities where appropriate; and<br />
manage their own waste responsibly, including <strong>not</strong> littering.<br />
NGOs and the community sector need to:<br />
●<br />
●<br />
●<br />
work in partnership with local authorities and business to support local waste strategies;<br />
deliver recycling services to households targeting particularly hard to reach groups;<br />
help promote waste minimisation, re-use and recycling to householders.<br />
The Environment Agency needs to:<br />
●<br />
●<br />
regulate waste facilities and the handling, transport, processing, treatment and disposal of<br />
waste in line with the BPEO;<br />
give advice to parties on the handling, transport, processing, treatment and disposal of waste<br />
and the operation of facilities; and<br />
WASTE NOT, WANT NOT<br />
●<br />
give advice to planning authorities on the appropriateness of sites for waste facilities.<br />
46
Managing future uncertainty<br />
by keeping existing options<br />
open whilst creating new ones<br />
5.14 Recent data is <strong>not</strong> a reliable guide to<br />
future trends. There are economic, social and<br />
technological factors that will influence future<br />
waste growth rates, the composition of future<br />
waste streams, and the range of future options<br />
for waste management. 66 Any strategy needs to<br />
prepare for the future by keeping options open<br />
and encouraging new ones to be developed. It<br />
is important to avoid prematurely locking into<br />
costly and irreversible options. This applies<br />
equally to the reduce-re-use-recycle options at<br />
the top of the waste hierarchy as well as to the<br />
residual waste options at the bottom.<br />
There also needs to be a clear<br />
rationale for government<br />
intervention<br />
5.15 The rationale for government intervention<br />
in the management and disposal of waste lies in<br />
a number of market failures, which mean that in<br />
the absence of government intervention, an<br />
economically efficient outcome would <strong>not</strong> be<br />
achieved. Box 9 gives more details. 67<br />
Box 9: Market failures in waste<br />
Externalities: for markets to work efficiently, prices need to reflect all the costs and benefits<br />
associated with the production and consumption of goods and services. However, in the case of<br />
waste, the prices of most goods and services do <strong>not</strong> reflect the adverse impact of managing and<br />
disposing of waste streams on the environment. This leads to more waste being produced and<br />
less investment in alternatives such as recycling than is economically efficient.<br />
Missing markets: for example there are poorly developed markets for recyclates.<br />
Imperfect information: efficient markets require good information. But consumers are<br />
typically <strong>not</strong> well informed about the different environmental impacts or health effects of<br />
managing waste arisings from the products they buy.<br />
Behaviour and attitudes: peoples’ views on and understanding of waste are sometimes<br />
limited or mis-informed (as shown elsewhere in this report, for example in Box 5 (chapter 4) on<br />
the MORI results).<br />
66<br />
See for example ESTO Project: Decoupling Municipal Solid <strong>Waste</strong> that describes the main uncertainties influencing household waste<br />
composition and growth in the next 20 years. These include: lifestyle of household members technological development e.g. IT<br />
replacing paper, and demographics e.g. the ageing population<br />
67<br />
This is also discussed in more detail in Tax and the environment: using economic instruments, HMT, (November 2002)<br />
MOVING FORWARDS TO A NEW STRATEGY<br />
47
Having set out the principles<br />
and the rationale for<br />
government intervention,<br />
what are the strategic choices<br />
that England faces?<br />
5.16 The SU has conducted a detailed analysis<br />
of projected municipal waste arisings, waste<br />
management options and the associated<br />
expenditure. This was carried out with the help<br />
and advice of experts in the field 68 as well as<br />
assessing other models 69 and research.<br />
5.17 This analysis sought to examine:<br />
●<br />
●<br />
the trade-offs involved in placing emphasis<br />
on different parts of the waste hierarchy; and<br />
the opportunities and constraints posed by<br />
different factors e.g. the composition of the<br />
waste stream and behavioural responses.<br />
Four main options were analysed and compared<br />
with a ‘status quo’ base case. A description of<br />
the options is set out in Figure 9.<br />
Figure 9: Description of strategies modelled<br />
Strategy<br />
Option 1: status quo<br />
Description a<br />
Current growth rates, continuation of landfill as<br />
predominant waste disposal option<br />
Option 2: high incineration (i)<br />
Option 3: high incineration (ii)<br />
50%+ incineration and 25% recycling<br />
50% incineration and 35% recycling<br />
Option 4: maximum recycling 60% recycling and incineration at current levels (10%)<br />
Option 5: reduction/recycle<br />
Reduce rate of growth in waste, 45%+ recycling, 30% or<br />
less residual waste management comprising a combination<br />
of incineration & other technologies e.g. MBT 70<br />
a. percentages refer to outcomes in 2020<br />
A summary of the results of the analysis is shown in Figure 10.<br />
WASTE NOT, WANT NOT<br />
68<br />
Several pieces of work were specially commissioned by the SU: McLanaghan Dr. S. Delivering the Landfill Directive: The role of new and<br />
emerging technologies, Parfitt Dr. J. Analysis of household waste composition and factors driving waste increases, Hummel Dr. J. Projecting<br />
Collection Costs, Tucker Professor P. and Speirs D. Modelling Forecasts of Recycling Participation Rates and Material Capture Rates for<br />
Possible Future Recycling Scenarios, Patel N. and Wheeler P. Facilities Model. The SU also convened a Data and Assumptions Panel to<br />
support the modelling work. More details of the data and assumptions used in the modelling work are given in Annex L<br />
69<br />
Strategic Option Appraisal Tool designed by AEA Technology to facilitate the development of strategies for waste disposal at local<br />
authority level. It ranks options and their performance base on criteria such as economic, environmental, operational, technical or<br />
waste policy<br />
70<br />
Mechanical Biological Treatment. A hybrid treatment that stabilises biodegradable content and mechanically recovers recyclate from<br />
residual waste. This is explained in more detail in Annex G<br />
48
Figure 10: Benefits and costs of alternative strategic approaches, 2002-2020<br />
Option Costs Feasibility Environmental Flexibility Ranking<br />
(£bn) (a) as a way to benefits (avoiding<br />
meet the<br />
locking-in<br />
Landfill<br />
to one<br />
Directive<br />
option)<br />
Option 5:<br />
reduction/recycle 29.6 ✔✔✔ ✔✔✔ ✔✔✔ 1<br />
Option 3:<br />
high incineration (ii) 29.6 ✔✔✔ ✔✔ ✔✔ 2<br />
Option 4:<br />
maximum recycling 31.0 ✔ ✔✔✔ ✔✔ 3<br />
Option 2:<br />
high incineration (i) 28.9 ✔✔ ✔✔ ✔ 4<br />
Option 1:<br />
status quo 27.4 ✘ ✘ ✘ 5<br />
✔✔✔ offers maximum benefits<br />
✔✔ offers some benefits<br />
✔ offers few benefits<br />
✘ offers no benefits<br />
Notes: (a) costs are waste management expenditure at local authority level from 2002 to 2020<br />
and are discounted to reduce the value of projected future costs to their value as seen from the<br />
present day.<br />
Source: SU analysis<br />
5.18 Although the analysis suggests that ‘doing<br />
<strong>not</strong>hing’ is the cheapest option, it fails to meet<br />
any of the key criteria. The other options are<br />
more expensive – by between 5% and 13% –<br />
but have a mixture of advantages and<br />
disadvantages. The extremes of adopting either<br />
high incineration or high recycling as a strategy<br />
are judged to be less flexible. ‘Maximum<br />
recycling’, although it scores highly in terms of<br />
environmental benefits, would require a huge<br />
change in culture and behaviour which was<br />
judged to be less feasible in policy terms than<br />
pursing a range of options, and still left a<br />
significant residual. Reduction in waste growth<br />
rates reduced costs and the number of facilities<br />
required by all the options.<br />
The SU reduction and recycling option<br />
has considerable advantages…<br />
5.19 Different experts and members of the<br />
waste industry will have their own views, but<br />
looking across the whole waste system and its<br />
operation in England, the SU approach was<br />
judged to meet all the criteria and was <strong>not</strong><br />
significantly (around 10%) more expensive than<br />
‘doing <strong>not</strong>hing’.<br />
5.20 The benefits would be:<br />
●<br />
although the focus is on reduction and<br />
recycling, it avoids locking in prematurely to<br />
any one method of reducing waste volumes<br />
or of disposing of waste. Indeed it aims to<br />
increase the options available. This keeps<br />
MOVING FORWARDS TO A NEW STRATEGY<br />
49
●<br />
●<br />
●<br />
options open and reduces future risks of<br />
inflexibility in the face of changing<br />
legislation, technology, or other factors;<br />
it increases reduction, re-use and recycling<br />
and thus moves England up the waste<br />
hierarchy;<br />
it reduces the level of incineration and the<br />
number of costly waste facilities required;<br />
and<br />
once landfill taxes rise, it should lever in<br />
significant private sector funding and<br />
investment.<br />
...but also some risks and tough choices<br />
5.21 The main risk is that:<br />
●<br />
reducing the waste growth rate by 1% is<br />
challenging and ambitious.<br />
5.22 The tough choices are:<br />
●<br />
●<br />
●<br />
what we are prepared to pay and prepared<br />
to do;<br />
changing the behaviour of households will<br />
<strong>not</strong> be easy. Many say they <strong>want</strong> to recycle<br />
and <strong>want</strong> a convenient doorstep collection,<br />
but only some are willing to pay for these<br />
new and better services. Many feel they pay<br />
too much already but overestimate what they<br />
pay by 4-5 times the actual amount;<br />
recycling will be an expensive option until<br />
markets for recycled goods are further<br />
developed creating economies of scale; and<br />
●<br />
planning and other delays may make it<br />
difficult to get the collection infrastructure<br />
and the required number of waste<br />
management facilities in place. Most<br />
householders say they do <strong>not</strong> <strong>want</strong> landfill or<br />
incinerators (even though in reality 80% of<br />
the UK public live within 2km of a landfill,<br />
open or closed). People say they do <strong>not</strong> <strong>want</strong><br />
landfill but are concerned about the risks<br />
from incineration (even though the<br />
perception of the risk is massively higher than<br />
the reality – about the same likelihood as the<br />
risk of death from a lightning strike); 71<br />
5.23 Whilst the Government has a role in<br />
creating the right economic conditions,<br />
outlining national aspirations and providing<br />
funding for local authorities for a more<br />
sustainable strategy, the reality is that many of<br />
the choices will ultimately fall to local authorities<br />
and households. <strong>Waste</strong> is <strong>not</strong> always a high<br />
priority compared to many other areas of local<br />
government e.g. education and social services.<br />
5.24 In short everyone seems to <strong>want</strong> a better<br />
environment and appear willing to recycle more<br />
but few <strong>want</strong> to pay the additional cost for a<br />
better service.<br />
5.25 If we are to shift waste management onto<br />
a more sustainable footing – and the benefits of<br />
doing this are clear – then there needs to be<br />
additional funding, more choices for local<br />
authorities, a better informed public who are<br />
more involved in local strategies, and a<br />
willingness to make relatively small changes<br />
in lifestyle.<br />
The recommended strategy<br />
WASTE NOT, WANT NOT<br />
5.26 The recommended strategy has three<br />
strands as set out in Box 10.<br />
71<br />
Enviros Aspinwall, SU working paper The Context for Emissions and Health Impact Associated with <strong>Waste</strong> Management, (2002)<br />
www.strategy.gov.uk/2002/waste/downloads/enviros.pdf<br />
50
Box 10: The SU recommended strategy<br />
For the medium to long term, a strengthening of the economic and regulatory<br />
framework<br />
●<br />
●<br />
to send clear signals about the direction of change; and<br />
to secure the desired change in behaviour along the production-consumption chain.<br />
This would be achieved through a series of measures including: substantive increases in landfill<br />
tax and new incentives on households to reduce waste and increase recycling by local authorities<br />
that wish to take this forward.<br />
For the short to medium term, a package of investment measures to put waste<br />
management on a more sustainable path. This would include measures to:<br />
●<br />
●<br />
●<br />
●<br />
increase waste minimisation;<br />
boost recycling;<br />
develop new technologies; and<br />
improve information/data/the research base.<br />
To support and deliver the strategy, these need to be backed up by effective<br />
delivery structures. This requires:<br />
●<br />
●<br />
●<br />
clarity at the centre of government about the direction and focus of waste policy;<br />
a better link between policy and delivery on the ground;<br />
funding for new waste infrastructure to deliver the SU strategy; and<br />
●<br />
the right skills and delivery structures at all levels to achieve change.<br />
This strategy builds on the<br />
<strong>Waste</strong> Strategy 2000 and<br />
moves it forward in a number<br />
of important respects<br />
5.27 The proposed strategy reinforces the<br />
current <strong>Waste</strong> Strategy 2000, and adds to it by:<br />
●<br />
●<br />
putting waste reduction and recycling at the<br />
centre of the strategy as desirable and<br />
achievable goals;<br />
recognising that disposal and pre-treatment<br />
of waste will remain part of waste<br />
management for the foreseeable future;<br />
●<br />
●<br />
●<br />
<strong>not</strong> specifying particular options from the<br />
centre but setting out the general direction<br />
that aims to realise the vision;<br />
setting out the policy instruments and<br />
delivery tools to make the change happen;<br />
and<br />
setting tougher and more challenging goals.<br />
Clear and explicit measures<br />
are needed to judge its success<br />
5.28 Success will have been achieved when the<br />
goals set out above have been realised. In terms<br />
of intermediate indicators of success, those that<br />
are key are:<br />
MOVING FORWARDS TO A NEW STRATEGY<br />
51
●<br />
●<br />
●<br />
●<br />
reducing the rate of household waste growth<br />
to 2% per annum by the end of 2006 and in<br />
the longer term decoupling waste growth<br />
from GDP;<br />
50% of households to be carrying out home<br />
composting by 2006;<br />
the roll out of kerbside recycling collections<br />
across England focusing on organics first;<br />
a target of at least 35% of household waste<br />
to be recycled or composted by 2010 and at<br />
least 45% of household waste to be recycled<br />
or composted nationally by 2015;<br />
In summary<br />
5.30 Figure 11 summarises the links between<br />
the vision, high level goals, strategy and<br />
outcomes. The following chapters set out in<br />
more detail the proposals to strengthen the<br />
economic and regulatory framework (chapter<br />
6); to invest in measures to put the country on<br />
to a more sustainable path for managing its<br />
waste (chapter 7); and to enhance funding and<br />
delivery structures (chapter 8).<br />
●<br />
●<br />
an absolute reduction in the amount of<br />
municipal waste going to landfill annually<br />
from 2007; and<br />
30% of collection authorities to have tried<br />
incentive based schemes to encourage sound<br />
management of household waste by 2005/6.<br />
5.29 Boxes 11, 12 and 13 set out how waste<br />
management in England in 2015 may change<br />
depending on the progress made in<br />
implementing the strategy set out in this report.<br />
Kerbside recycling boxes – photo courtesy of Stockton-on-Tees Borough Council<br />
A kerbside recycling collection scheme in operation – photo courtesy of David<br />
Mansell, Avon Friends of the Earth.<br />
WASTE NOT, WANT NOT<br />
52
Figure 11: Summary of the vision, high level goals and strategy underlining this report<br />
The vision:<br />
To have, by 2020, a world<br />
class waste management<br />
system that allows the<br />
country to prosper whilst<br />
minimising environmental<br />
impacts and protecting<br />
human health<br />
The Goals: Translate<br />
through<br />
principles<br />
To decouple<br />
growth in waste<br />
from economic<br />
growth<br />
An economy where<br />
the full costs of<br />
products and<br />
services, including<br />
the costs of<br />
disposal, are taken<br />
into account<br />
The waste<br />
hierarchy<br />
& BPEO<br />
Roles &<br />
responsibilities<br />
Into a<br />
Strategy<br />
1) Economic and<br />
regulatory<br />
framework<br />
2) Investment<br />
measures:<br />
– waste minimisation;<br />
– recycling;<br />
– new technologies;<br />
– data and research.<br />
Pursuing waste<br />
management options<br />
that secure the<br />
greatest environmental<br />
benefit based on<br />
cost-benefit analysis<br />
Keeping<br />
options<br />
open<br />
3) Funding for new<br />
waste infrastructure<br />
supported by effective<br />
delivery structures<br />
To<br />
achieve...<br />
1% reduction in<br />
growth rates<br />
Tripling of<br />
recycling rates<br />
Minimal residual<br />
waste<br />
EU Landfill<br />
Directive met<br />
MOVING FORWARDS TO A NEW STRATEGY<br />
53
Box 11: Scenario 1 – Do <strong>not</strong>hing – how England might look in 2015<br />
● waste growth has continued unabated and waste costs have increased by 70%;<br />
●<br />
●<br />
●<br />
●<br />
●<br />
●<br />
●<br />
●<br />
the number of landfill sites has increased by over 100 from 2002; there have been widespread<br />
protests about the shipping of waste from areas where there is little landfill available like the<br />
South East to the north of the country;<br />
England’s household recycling rate has continued to rise at only 1% per year and is just under<br />
25% – the target originally set in 1990 for the year 2000. Other EU nations such as Holland<br />
and Germany have recycling rates around 60%;<br />
England has failed to meet the Landfill Directive in both 2010 and 2013 and the UK is<br />
currently suffering its fourth year of EU fines. These fines now come to just over £700 million.<br />
EU nations who have adopted sustainable waste management are losing patience with the UK;<br />
attempts to meet the 2020 Landfill Directive by a massive increase in incineration are meeting<br />
with resistance in some areas;<br />
England’s reliance on landfill is causing problems for wider waste management as new EU<br />
regulations influenced by nations with lower waste growth, higher recycling and more<br />
advanced waste management options, hit the country harder;<br />
industry too has been suffering under tighter waste regulation. Failure to invest in lean<br />
manufacturing and alternative waste management methods has undermined productivity and<br />
is now requiring a large programme of costly investment to meet new EU regulations;<br />
a MORI Poll shows that most people see waste as a government problem and say that<br />
recycling is too difficult due to lack of investment in new recycling facilities. Discussion of the<br />
options has <strong>not</strong> taken place, awareness remains low, and NIMBYism 72 has increased;<br />
England now faces a larger and more costly challenge to try and catch up with nations whose<br />
waste management is now 20-30 years in front of that of England; and<br />
●<br />
the UK remains at the bottom of the European waste management league.<br />
WASTE NOT, WANT NOT<br />
72<br />
NIMBY= Not in My Backyard. An increasingly common way of expressing people’s growing reluctance to having certain structures in<br />
their neighbourhoods<br />
54
Box 12: Scenario 2 – the SU trajectory – how England might look<br />
in 2015<br />
●<br />
●<br />
●<br />
●<br />
●<br />
●<br />
●<br />
●<br />
●<br />
refocusing existing funding along with new resources in 2003, plus an increase in landfill tax<br />
to £35 a tonne, has stimulated a clear transformation in UK waste management;<br />
initiatives to help households reduce waste have paid dividends. Over 50% of UK households<br />
now compost at home. <strong>Waste</strong> growth dropped to 2% from 3% in 2006. It is now in line with<br />
GDP as in many other nations, and in the last 2 years has dipped slightly below that. This has<br />
reduced costs and the need for additional facilities;<br />
it has also helped industry who, with advice from Envirowise and having made investment in<br />
changes, are now making substantial savings on raw materials and waste costs;<br />
every home now has kerbside recycling for organic waste and key dry recyclables. Recycling<br />
has reached 45% in England putting the UK above average EU performance;<br />
areas with incentives to reduce waste and recycle are doing even better and around 60% of<br />
authorities use this approach;<br />
the new waste resource authorities introduced gradually from 2007, have changed the<br />
emphasis from waste disposal to resource management. They are paid based on their success<br />
in waste reduction, recycling and reducing residual waste;<br />
LAs are working together, with industry and community groups to produce more effective<br />
solutions to waste management;<br />
stimulation of the uptake of more existing and new technologies has provided a wider range<br />
of options to manage waste. A wider range of waste treatment methods are being used for<br />
handling residual waste: mechanical biological treatment, digestion, gasification and pyrolysis<br />
are being used along with a much smaller increase in incineration than was thought necessary<br />
to reduce the active waste going to landfill in 2002;<br />
industry and households are now much more aware of waste and the environment. New<br />
markets for recycled goods have developed and participation in recycling continues to grow.<br />
This holds out the prospect of recycling rates reaching around 50% by 2020;<br />
●<br />
the Landfill Directive targets for 2010 and 2013 were met.<br />
MOVING FORWARDS TO A NEW STRATEGY<br />
55
Box 13: Scenario 3 – Doing even better – how England might look<br />
in 2015<br />
The SU strategy, which seemed ambitious in 2002, is now seen as setting the right direction and<br />
progress exceeded expectations:<br />
●<br />
●<br />
●<br />
initiatives to help households reduce waste have paid dividends. Over 60% of UK homes now<br />
compost at home. UK waste growth is now 0.5% lower than the growth in GDP at 1.5%. The<br />
UK is one of an exclusive club of nations who have managed to achieve this decoupling of<br />
waste growth from GDP (including Germany and the Netherlands). This has saved costs and<br />
the need for additional facilities;<br />
the majority of local authorities have chosen to take up the option of incentive based schemes<br />
for household waste that suit their needs, where those who produce less waste and recycle<br />
more pay less. The principal that ‘the polluter pays’ is now universally accepted;<br />
everyone now participates effectively in kerbside recycling, suggesting that investment in<br />
education and information has paid dividends;<br />
● recycling rates in England are over 50% and could reach 60% by 2020;<br />
●<br />
●<br />
●<br />
●<br />
the market for recycled and environmentally friendly goods is well established with people<br />
demonstrating their willingness to pay a little extra for goods that are better for the<br />
environment and produce less waste;<br />
great leaps forward have been made in tackling wider wastes as well as municipal waste.<br />
Producer responsibility via regulation and voluntary agreement has brought about a significant<br />
reduction of waste and an increase in the recycling of materials. This has saved many<br />
companies money;<br />
those industries who pioneered eco-design to produce such goods are making significant<br />
returns. As products that are less wasteful or easier to recycle become more prevalent, the<br />
reductions in waste growth are maintained and recycling increases;<br />
the Landfill Directive targets for 2020 are met early without the 4-year derogations envisaged<br />
in the SU strategy;<br />
●<br />
“green procurement” is widespread throughout the public sector and targets have been<br />
exceeded.<br />
WASTE NOT, WANT NOT<br />
56
6. ECONOMIC AND REGULATORY FRAMEWORK<br />
Summary<br />
Giving clear signals within the right economic and regulatory framework<br />
is crucial to securing a long-term and sustainable change in waste<br />
management.<br />
Action is needed in the following five areas to put the right long term<br />
economic and regulatory framework in place:<br />
●<br />
greater incentives to reduce the rate of growth in waste volumes. This<br />
requires mechanisms that reward households for producing less<br />
waste and recycling more; encouragement of voluntary producer<br />
responsibility obligations to produce less waste; and greater support<br />
for eco-friendly design;<br />
●<br />
new measures to encourage re-use, such as deposit-refund schemes<br />
and designing civic amenity sites for re-use;<br />
●<br />
the promotion of more recycling through support for the expansion<br />
of markets in recyclates; reviewing the use of BSI Standards to<br />
facilitate the use of recycled materials; and more proactive green<br />
procurement by central and local government;<br />
●<br />
encouragement of composting; and<br />
●<br />
greater incentives to move away from landfill including a substantial<br />
increase in the landfill tax and more rigorously enforced fines for flytipping<br />
and other waste crimes.<br />
ECONOMIC AND REGULATORY FRAMEWORK<br />
57
Reform of the economic and<br />
regulatory framework is crucial<br />
to realising the vision<br />
6.1 This chapter sets out a comprehensive<br />
package of measures for strengthening the<br />
economic and regulatory framework required to<br />
put the waste management system on to a<br />
sustainable path. These measures address five<br />
objectives:<br />
Option (a): more incentives<br />
and rewards for households to<br />
produce less waste, re-use<br />
goods and recycle more<br />
6.3 Incentives for households could take a<br />
number of forms:<br />
●<br />
●<br />
discounts on current charges i.e. Council Tax;<br />
cash incentives and reward schemes;<br />
●<br />
reducing the rate of growth in waste<br />
volumes;<br />
●<br />
a mixture of free services and some charges<br />
for special services; and<br />
●<br />
●<br />
●<br />
●<br />
encouraging the re-use of goods;<br />
increasing recycling;<br />
promoting more composting; and<br />
reducing the volume of waste sent to landfill<br />
sites.<br />
Reducing the rate of growth in<br />
waste volumes<br />
6.2 There are three main options:<br />
(a)<br />
more incentives and rewards for<br />
households to reduce the volume of<br />
waste they produce;<br />
●<br />
freedom for local authorities to introduce<br />
various forms of direct and variable charging.<br />
6.4 Some of these already exist as pilots and<br />
trials as described in Boxes 14 and 15.<br />
6.5 Variable charging – in its broadest sense,<br />
charging households according to the volume<br />
of waste they produce – is well established in<br />
many other industrialised countries. Direct or<br />
variable charging schemes are used successfully<br />
in over 17 other nations around the world 73 and<br />
have been in use in parts of the USA for over 80<br />
years (see Box 16).<br />
(b)<br />
(c)<br />
strengthening producer responsibility<br />
obligations; and<br />
greater incentives for eco-friendly<br />
design.<br />
WASTE NOT, WANT NOT<br />
73<br />
USA, Canada, Australia, New Zealand, Austria, Belgium, Denmark, parts of France, Germany, Italy, Luxembourg, Sweden and<br />
Switzerland. It is also likely to be introduced in Finland, Spain and Ireland very soon<br />
58
Box 14: An example of a successful variable charging scheme in<br />
the UK<br />
A variable charging scheme for household waste collection was introduced twelve months ago<br />
by Blaby District Council in Leicestershire. This has reportedly increased the volume of<br />
recycled waste by 50% and significantly reduced the amount of waste sent to landfill sites.<br />
Until last year, Blaby residents left their rubbish in black bags, with some households also<br />
provided with a container for recyclable materials. Under the new scheme, introduced across the<br />
district during 2001, households have been given a 140-litre wheeled bin – compared to the<br />
usual 240-litre bin – for their refuse. They also receive, on request, a green-lidded 140-litre bin<br />
for recyclable materials. Garden waste is only collected in special pre-paid sacks or special rented<br />
bins, but the council hopes to introduce a third bin for garden waste shortly.<br />
Recyclable materials are collected fortnightly. Some 60% of households can recycle paper, plastic<br />
bottles and cans, and the remainder can recycle mixed paper and cardboard. If the refuse bin is<br />
filled before the end of the week, householders can buy refuse sacks from the council or have<br />
their refuse bin replaced with a larger one for an annual rental fee. Households with five or more<br />
people qualify for a discount on the fee.<br />
Of the 37,750 properties served, just 7% are renting a larger bin or buying more refuse sacks.<br />
With no reports of increased dumping of household waste, this suggests that most householders<br />
have reduced the amount of mixed refuse they throw away.<br />
The amount of recyclables collected by the kerbside scheme rose by 55% after the scheme was<br />
introduced across the district.<br />
Source: ENDS Report 332, September 2002<br />
Box 15: An example of incentives to encourage recycling<br />
Recycling Incentive Trials in Brent and Lambeth<br />
Two pilot studies were carried out over a six-month period between June and December 2001 to<br />
investigate the impact of offering cash incentives for participation in kerbside recycling schemes<br />
and for the amount of household waste put out for recycling. The pilots took place in Sudbury,<br />
Brent and Tulse Hill, Lambeth.<br />
In Sudbury 1,240 household properties on an existing weekly multi-material kerbside collection<br />
round, including paper, glass, cans and textiles, were given a bar-coded collection box with<br />
information about the scheme at the start of the trial. The bar-codes were scanned by the<br />
collection officer using a hand held device each time the box was put out for recycling.<br />
Households were offered a £10 cash incentive if they put out the recycled box for collection<br />
at least half of the time over the six-month trial period.<br />
ECONOMIC AND REGULATORY FRAMEWORK<br />
59
Box 15: An example of incentives to encourage recycling (continued)<br />
Participation in kerbside recycling rose from 35% to 41%. The tonnage of recycling collected<br />
each week rose during the trial by 34% in comparison to the same time period preceding the<br />
trial. 22% of properties qualified for the £10 payment for participating at least half of the time.<br />
In Tulse Hill, 887 households on a high-density housing estate were offered a £10 cash incentive<br />
for recycling at least half of the time over a six-month period. Residents were given a booklet of<br />
slips that they posted in a special box each time they used the recycling bins located on the<br />
estate. The slips, along with the glass, paper and can banks, were collected weekly. The<br />
participation rate for the Tulse Hill trial was 13%. A total of 1,872 valid slips were returned over<br />
the six-month trial, equating to 8.1% of possible usage. The average weight of material collected<br />
over the trial was 475 kilograms, an increase of 27%. Some 11% of households qualified for the<br />
£10 incentive.<br />
Source: The Mayor of London’s Draft Municipal <strong>Waste</strong> Management Strategy, 4D.21<br />
6.6 A key element of these direct or variable<br />
charging schemes is that the waste<br />
management element of Council Tax is<br />
replaced by a charge related to the amount or<br />
weight of unsorted waste in order to finance<br />
recycling services. It does <strong>not</strong> involve people<br />
being charged twice to have their waste<br />
collected and disposed of. On the contrary, it<br />
creates incentives to compost or recycle in order<br />
to lower the charge. The scheme is therefore<br />
an incentive-based one where people who<br />
compost and recycle pay less.<br />
6.7 There are a number of issues that local<br />
authorities would have to consider if they chose<br />
to implement such a system:<br />
●<br />
●<br />
it could penalise low-income families if poorly<br />
designed and implemented. Low-income<br />
families already get Council Tax rebates and<br />
similar rebates could be applied under<br />
variable charging. In many countries with<br />
variable charging schemes, disadvantaged<br />
people receive a free allowance, for example<br />
in the form of free bags or stickers for bags to<br />
exempt them from charges; and<br />
it can be complex or costly to administer. There<br />
are a variety of possible schemes and some<br />
are very simple and inexpensive.<br />
●<br />
there could be an increase in fly-tipping – so far<br />
this has <strong>not</strong> happened to any significant<br />
extent in any of the 17 countries with<br />
variable charging schemes, and in the few<br />
cases where it has occurred, the effect has<br />
been temporary;<br />
WASTE NOT, WANT NOT<br />
60
Box 16: Case study – US experience with variable charging<br />
●<br />
●<br />
●<br />
●<br />
●<br />
significant reductions in waste disposal at landfills in the year following adoption of variable<br />
charging with an average reduction of 40% with a high of 74% and a low of 17%;<br />
variable charging programmes accompanied by aggressive recycling had larger average<br />
decreases in tonnages landfilled than programmes with “average” recycling;<br />
in the 12 cities that adopted a recycling programme prior to adopting variable charging,<br />
major increases in recycling occurred causing increases of 63% to 141% in 4 cases;<br />
with few exceptions, city officials all reported no <strong>not</strong>iceable increases in littering, and said that<br />
illegal dumping was <strong>not</strong> a problem; and<br />
there was evidence that individuals were undertaking significant source reduction activities i.e.<br />
trying to minimise the waste they produced.<br />
Source: Research by DEFRA for <strong>Waste</strong> Strategy 2000<br />
6.8 Implementation of direct or variable<br />
charging schemes in other countries has worked<br />
best where:<br />
●<br />
the public have full information about the<br />
system and access to help and advice if they<br />
need it; and<br />
●<br />
composting and recycling infrastructure is in<br />
●<br />
there are significant fines for fly-tipping and<br />
place;<br />
other waste crimes.<br />
●<br />
means for mitigating impacts for those on<br />
low incomes are in place;<br />
Box 17: Measures to tackle fly-tipping<br />
Fly-tipping – the illegal dumping of rubbish – poses a significant problem for a number of local<br />
authorities. Not only is fly-tipping anti-social and unsightly, it also poses a threat to the<br />
environment, wildlife and to public health and safety. Fly-tipping can be aggravated by poor<br />
waste collection services, a lack of proper disposal facilities (or short opening hours at civic<br />
amenity sites), or high charging for bulky refuse collection/trade waste. Many local authorities<br />
have started to crackdown on fly-tipping hot spots. This is done in co-operation with the police,<br />
local businesses and residents, testing methods such as the use of hidden cameras.<br />
Local authorities including Manchester City Council have been tackling the blight of fly-tipping<br />
through a poster campaign, designed to make the public more aware of the anti-social nature of<br />
dumping rubbish. The Council’s Operational Services Department also advertises a free collection<br />
service for most bulky goods from people’s doors. And the London Borough of Barnet offers ‘free<br />
skip weekends’ advertised through the local press. The skips are rotated around different areas of<br />
the borough, offering residents a convenient way of disposing of bulky items. A number of<br />
authorities also provide a public help-line for people concerned about fly-tipping or <strong>want</strong>ing to<br />
report a particular incident. SEPA (the Scottish Environment Protection Agency) run a 24-hour<br />
freephone pollution hotline to report waste crimes.<br />
ECONOMIC AND REGULATORY FRAMEWORK<br />
61
Box 17: Measures to tackle fly-tipping (continued)<br />
Further measures to tackle fly-tipping are being considered by central government. A recently<br />
published DEFRA consultation document “Powers and Responsibilities in Public Spaces and Local<br />
Environments: Options for Reforming the Legislative Framework” set out several options for<br />
dealing with fly-tipping, including:<br />
●<br />
●<br />
●<br />
extending investigative powers for fly-tipping to local authorities. The main enforcement body<br />
at present is the EA, and it may be that local authorities are better placed to deal with local flytipping<br />
offences, including minor incidents;<br />
introducing more robust powers for clearing fly-tipped waste from private land, with the<br />
option of reclaiming costs for the clean-up; and<br />
extending the ‘duty of care’ to householders to require them to account for the safe and<br />
proper disposal of their waste in much the same way as businesses. Specific guidance would<br />
be issued to householders covering what they could and could <strong>not</strong> put into weekly household<br />
waste for collection and what would require specialist arrangements. Fixed penalty <strong>not</strong>ices<br />
could be enforced for non-compliance.<br />
The above options all have pros and cons, and are open to full consultation with stakeholders.<br />
The results of the consultation exercise, where relevant to this report, should be taken forward in<br />
line with the SU’s Implementation Plan set out in Chapter 9.<br />
WASTE NOT, WANT NOT<br />
62<br />
6.9 Since local authorities face different<br />
circumstances and are at different stages of<br />
progress, implementation of any form of<br />
incentive scheme – including variable charging<br />
– should be a matter of local discretion. It<br />
would <strong>not</strong> make sense to introduce a uniform<br />
national charging scheme in all areas. Local<br />
authorities will be best placed to judge the right<br />
time to introduce an incentive scheme in the<br />
right form for their local area. But, in order to<br />
facilitate this, the Government should secure an<br />
early legislative opportunity to grant local<br />
authorities powers to implement incentive and<br />
charging schemes for waste if they <strong>want</strong> to do so.<br />
Recommendation 1:<br />
Local authorities that wish to take forward<br />
household incentive schemes to help reduce<br />
waste volumes and increase recycling should<br />
be allowed to do so.<br />
6.10 Local authorities would need to consider<br />
the following to ensure a successful incentivebased<br />
scheme:<br />
●<br />
●<br />
●<br />
●<br />
the case for piloting the scheme and its likely<br />
impact before full roll out;<br />
the arrangements for helping households on<br />
low incomes and the specific needs of<br />
households in particular dwellings e.g. flats;<br />
the adequacy of recycling, composting and<br />
other facilities; and<br />
the adequacy of measures to deal with flytipping<br />
– if it occurs.<br />
Option (b): producer<br />
responsibility obligations<br />
6.11 Producer responsibility is an alternative to<br />
taxation or traditional regulation. It aims to<br />
move towards a lifecycle approach by making
the producer bear at least some of the costs of<br />
their products in and after use. Well-designed<br />
schemes give producers incentives to design<br />
products that minimise waste, or that can be reused<br />
or recycled. Producer responsibility has<br />
been taken forward largely at European level,<br />
with voluntary agreements used at national level<br />
in the UK.<br />
6.12 Currently, there are producer responsibility<br />
obligations for packaging, junk mail and<br />
newsprint. The packaging (which is regulatory<br />
following implementation of the EC Directive on<br />
Packaging and Packaging <strong>Waste</strong>) and junk mail<br />
(voluntary) schemes require certain levels of<br />
recycling to be achieved by the producers. The<br />
voluntary agreement on newsprint sets target<br />
levels for the recycled content of newsprint.<br />
6.13 While such schemes do place some extra<br />
costs on business, these appear to be small.<br />
Estimates of the compliance costs of the<br />
packaging regulations, for example, range from<br />
0.18% of profit (large firms) to 2.2% (SMEs). 74<br />
Box 18: The UK Producer Responsibility Obligations (Packaging<br />
<strong>Waste</strong>) Regulations<br />
The regulations place three main obligations on businesses (i.e. the ‘producers’) each year:<br />
●<br />
●<br />
●<br />
to register with the EA, pay a fee and provide data on the packaging handled by the business<br />
in the previous year (‘the registration obligation’);<br />
to recover and recycle specified tonnages of packaging waste (‘the recovery and recycling<br />
obligations’); and<br />
to certify whether the recovery and recycling obligations have been complied with (‘the<br />
certifying obligation’)*.<br />
In addition, retailers have a ‘consumer information obligation’ to inform consumers about various<br />
recycling issues.<br />
Businesses handling 50 tonnes or less of packaging each year, and with turnover of £2million or<br />
less, are exempt from the regulations. A business may comply themselves, or join a registered<br />
compliance scheme, which will discharge the producer responsibility obligations for it.<br />
In 1997 the UK recovered some 30% and recycled around 27% of packaging waste. By the end<br />
of 2001, some 48% was recovered and 42% recycled.<br />
The Environment Council reached political agreement on a Common Position in October 2002,<br />
which envisages a minimum overall 60% recovery target, and an overall recycling target of<br />
between 55% and 80% by 2008. In addition, there are material-specific recycling targets of:<br />
glass 60%, paper 60%, metals 50%, plastic 22.5% and wood 15%. The European Parliament<br />
have yet to have their second reading but the review of the Directive is expected to conclude<br />
in 2003.<br />
74<br />
Packaging <strong>Waste</strong> Regulatory Impact Assessment<br />
ECONOMIC AND REGULATORY FRAMEWORK<br />
63
Box 18: The UK Producer Responsibility Obligations (Packaging<br />
<strong>Waste</strong>) Regulations (continued)<br />
These higher targets suggest that packaging recovery from the municipal waste stream will<br />
become increasingly important. This underlines the need for segregation and sorting systems and<br />
infrastructure as well as co-operation at local level.<br />
*The evidence takes the form of Packaging Recovery Notes (PRNs). Obligated parties that do <strong>not</strong> have access to their<br />
own sources of recycled materials can either buy them from the processors or sign contracts with collectors of recyclable<br />
material. PRNs therefore have a price. If there is a shortage of a particular material in relation to the target, then the<br />
price of PRNs should rise and increase supply (and vice versa).<br />
6.14 Producer responsibility is likely to provide<br />
the clearest incentives for innovation and<br />
improvement when responsibility is related to<br />
producers’ own products and where action is<br />
introduced over a sufficiently long time scale to<br />
enable producers to change their products.<br />
There is, however, a balance to be struck<br />
between linking responsibility to producers’<br />
own products and the most cost-effective ways<br />
of achieving particular targets. The best approach<br />
for some products may <strong>not</strong> work for others.<br />
6.15 Voluntary agreements have the benefit of<br />
working with the relevant industry and avoiding<br />
the need for taxation or the burden of<br />
regulation. They can challenge industry to<br />
devise its own solutions to tackle environmental<br />
problems efficiently. 75<br />
Recommendation 2:<br />
DEFRA and DTI should extend voluntary<br />
agreements with industry to reduce waste<br />
and increase the use of recycled materials<br />
and the recyclability of products.<br />
Box 19: Junk mail<br />
For some people direct or ‘junk’ mail serves a useful purpose, and it is an important<br />
communication method for many companies, small businesses and charities. As such it<br />
contributes to national economic performance. However, many households dislike unsolicited<br />
mail. A proportion of junk mail ends up as household waste for disposal or as litter. Though junk<br />
mail represents only a very small proportion of the municipal waste stream, it still poses<br />
environmental problems, such as the loss of virgin forest to create the glossy paper often used.<br />
Some measures to tackle junk mail are already underway. For example, DEFRA has negotiated a<br />
new voluntary producer responsibility scheme for the recycling of direct mail and promotions<br />
material with the Direct Marketing Association (DMA) – the body representing most producers of<br />
junk mail. This initiative aims to increase the recycling of junk mail, minimise the quantity of junk<br />
mail sent to landfill, improve the targeting of its distribution, and reduce the use of contaminants<br />
in mailshots (e.g. glue). A Good Practice Guide for producers will also be published.<br />
WASTE NOT, WANT NOT<br />
64<br />
Members of the public can contact the Mailing Preference Service 76 if they wish to have their<br />
names and home addresses removed from direct mailing lists. Some local authorities and/or local<br />
voluntary groups also distribute “no junk mail” stickers to households and produce hints and tips<br />
on reducing junk mail. 77<br />
75<br />
Experience of voluntary agreements should help in identifying suitable candidates for further agreements and identifying successful<br />
factors in implementation. Existing evidence shows that adding voluntary agreements to a policy mix of traditional command and<br />
control instruments can improve the flexibility and cost-effectiveness of the policies as well as reducing administration. OECD<br />
Voluntary Approaches for Environmental Policy, an assessment (1999)<br />
76<br />
Mailing Preference Service, DMA House, 70 Margaret Street, London W1W 8SS, telephone 020 7291 3310, web site<br />
www.mpsonline.org.uk<br />
77<br />
For example, advising households that when dealing with their credit card company, donating money, or ordering a product or<br />
service they should mark their account with the words “please do <strong>not</strong> pass or sell my name and address to any other company.”
Option (c): stimulating ecofriendly<br />
design<br />
6.16 There is currently relatively little incentive<br />
for consumers to demand products which are<br />
designed to minimise waste over the life of the<br />
product. Stronger incentives for households to<br />
reduce waste would have some impact.<br />
However, there may also be a case for providing<br />
financial incentives to manufacturers to test new<br />
designs. Some pioneering industries have<br />
already started to develop new products based<br />
on eco-design (e.g. refillable packages for<br />
household cleaning products and toothbrushes<br />
with changeable heads). Industry has voluntarily<br />
pushed eco-design objectives (e.g. “product<br />
stewardship” by the chemicals industry and<br />
“eco-design” by Phillips). 78<br />
6.17 The Advisory Committee on Consumer<br />
Products and the Environment (ACCPE) is<br />
already considering the role of eco-design and<br />
integrated products design through a series of<br />
recommendations to government. 79<br />
plastic bag tax has been a successful measure in<br />
terms of raising awareness and reducing litter.<br />
Plastic bags are, however, a very small part of<br />
the municipal waste stream (substantially less<br />
than 1%).<br />
6.20 Deposit refund schemes are a<strong>not</strong>her<br />
approach. Such schemes use an up front charge<br />
(deposit) combined with a refund payable when<br />
the waste product is returned to encourage reuse<br />
(or recycling). They can have significant<br />
impacts on return rates, litter and waste<br />
management costs and are suitable for products<br />
that cause particular disposal problems.<br />
Applications in other countries have included<br />
beer bottles, hazardous wastes, batteries and<br />
light bulbs. 81<br />
Recommendation 3:<br />
DEFRA and WRAP should consider the<br />
options for increasing incentives for the reuse<br />
of goods. More work is needed to assess<br />
the preferred means for different products<br />
and to establish where the impact on the<br />
waste stream would be greatest.<br />
Encouraging the re-use of goods Increasing recycling<br />
6.18 Re-use means the multiple use of a product 6.21 There are five main options for increasing<br />
in its original form. Excluding exchanges within the volume of waste that is recycled:<br />
families and the turnover of charity shops, the<br />
(a) developing markets for recycled goods and<br />
market for second-hand goods in the UK totals<br />
recyclates;<br />
an estimated £3 billion a year. 80<br />
(b) incentives for ‘green’ products;<br />
6.19 To date there have been few incentives for<br />
re-use in the UK, and the packaging regulations (c) removing regulatory barriers;<br />
exclude re-used materials. In other countries,<br />
(d) green procurement targets for the public<br />
there are a variety of incentives for re-use<br />
sector; and<br />
including, for example, taxes on single-use<br />
items such as batteries and the recently<br />
(e) targets for local authorities.<br />
implemented plastic bag tax in Ireland. The<br />
78<br />
OECD Working Party on Environmental Policy, OECD Household Energy and Water Consumption and <strong>Waste</strong> Generation: Trends,<br />
Environmental Impacts and Policy Responses (2002)<br />
79<br />
Advisory Committee on Consumer Products and the Environment, Action for Greener Products: a tool-box for change. Second Report<br />
(2002)<br />
80<br />
WRAP and Envirowise, The Size of the UK Recycling and Re-Use Industry (2002)<br />
81<br />
For a review of examples see Stavins R.N. Experience with Market-Based Environmental Policy Instruments, discussion paper 00-09,<br />
(January 2000)<br />
ECONOMIC AND REGULATORY FRAMEWORK<br />
65
Option (a): developing<br />
markets for recycled goods<br />
and recyclates<br />
6.22 Markets for recycled goods and recyclates<br />
are still comparatively small. As these markets<br />
expand and increasing volumes of waste<br />
material are recycled, economies of scale and<br />
greater stability of market prices can be<br />
expected to reduce the unit cost of recycled<br />
goods. It is important to continue and expand<br />
the work of WRAP (the <strong>Waste</strong> and Resources<br />
Action Programme) whose remit includes<br />
facilitating the development and expansion of<br />
these markets (see Box 20).<br />
Box 20: Market Development by WRAP<br />
WRAP is working to create stable and efficient markets for some of the 100 million tonnes of<br />
waste produced each year by households, industry and commerce. Its plan for delivering a stepchange<br />
in recycling in the UK focuses on three generic areas (procurement, financial<br />
mechanisms, and standards and specifications) and five specific material streams (paper, glass,<br />
plastics, wood and, in England only, aggregates).<br />
Some examples of its achievements include:<br />
●<br />
●<br />
●<br />
●<br />
support for a capital investment of £23m in the UPM-Kymmene paper mill at Shotton, North<br />
Wales. If approved by the European Commission, this investment will boost the UK’s paper<br />
recycling capacity by 30%, diverting an extra 320,000 tonnes of newspapers and magazines<br />
away from landfill;<br />
support for investment of £5.5m in 34 research and development projects. Together, these<br />
projects – which range from investigating the use of recycled glass in industrial-scale drinking<br />
water filtration to developing standards at European level for recycled plastics – have the<br />
potential to prevent an extra 2.6 million tonnes of waste materials going to landfill;<br />
creation of a British Standards Institution Publicly Available Specification (BSI PAS 100) for<br />
Composted Materials. BSI PAS 100, which lays the foundation for a first full British Standard<br />
for compost, was funded by WRAP and developed jointly with BSI and The Composting<br />
Association. Launched in November 2002, it has been designed to boost the market for<br />
composted products by improving production methods, increasing confidence among<br />
potential buyers and making it easier for end-users to identify high-quality composted<br />
materials; and<br />
development of a model paper supply contract for use by local authorities in selling recovered<br />
paper to re-processors. One of the key aims of this initiative is to encourage broad acceptance<br />
of longer-term contracts that incorporate a degree of price predictability and thus reduce both<br />
parties’ exposure to market price volatility.<br />
WASTE NOT, WANT NOT<br />
More details on WRAP and its progress to date can be found at<br />
www.wrap.org.uk/stakeholders_report.asp<br />
66
Option (b): incentives for<br />
“green” products<br />
6.23 Green products are, in the broadest sense,<br />
those that have an environmental benefit and<br />
can range from unleaded petrol and energyefficient<br />
light bulbs to products made from<br />
recycled materials. The European Commission’s<br />
Green Paper on Integrated Product Policy<br />
emphasised the potential role for economic<br />
instruments to promote green products. 82 There<br />
are a number of incentives that could be<br />
applied to increase demand for ‘green’<br />
products.<br />
6.24 These are:<br />
●<br />
●<br />
●<br />
●<br />
taxes on ‘non-green’ products to reflect<br />
negative externalities;<br />
subsidies for ‘green products’ 83 to reflect<br />
positive externalities;<br />
differential VAT rates on products according<br />
to their environmental characteristics; 84 and<br />
market incentives to promote green products<br />
such as eco-labelling.<br />
Recommendation 4:<br />
HMT and DEFRA should consider the case for<br />
applying incentives such as economic<br />
instruments to encourage environmentallyfriendly<br />
products. This could include<br />
differential product charges and incentives<br />
such as VAT reductions.<br />
Option (c): removing<br />
regulatory barriers<br />
BSI Standards<br />
6.25 BSI Standards 85 have been cited as a<br />
potential barrier to the use of more recycled<br />
materials by a number of stakeholders. BSI does<br />
<strong>not</strong> currently have a specific policy on the use of<br />
recycled materials in its Standards. However, BSI<br />
are taking action in some areas. For example, in<br />
addition to their work with WRAP to produce a<br />
Standard for composted material (see Box 20),<br />
they are producing a suite of Standards for<br />
material recovery and for the use of recycled<br />
plastics material as packaging.<br />
Further work is required to evaluate the case for<br />
applying these in the UK, in particular:<br />
Recommendation 5:<br />
DTI should also work with DEFRA, WRAP,<br />
industry and the BSI Group to assess what<br />
● the gains of switching demand to alternatives<br />
more can be done to promote the use of<br />
i.e. whether the benefits would outweigh the<br />
secondary resources where appropriate<br />
economic and administrative costs;<br />
through BSI Standards. Where practical, they<br />
● the sensitivity of demand in response to price<br />
signals;<br />
should review areas of standardisation which<br />
may be unnecessarily blocking the use of<br />
recycled goods; and consider whether an<br />
● what is a clear and workable distinction<br />
affirmative policy on the use of recycled<br />
between green and non-green products and<br />
materials in BSI Standards might be<br />
how this might change over time; and<br />
appropriate.<br />
● potential infringement of international trade<br />
rules.<br />
82<br />
European Commission Green Paper on Integrated Product Policy, (2001)<br />
83<br />
Proposal would have to be compatible with the single market<br />
84<br />
Any changes in VAT are subject to renegotiations of the EU VAT Directive which is due to be reformed at the start of 2003<br />
85<br />
The British Standards Institution is a UK national body that facilitates standards development in support of public policy<br />
ECONOMIC AND REGULATORY FRAMEWORK<br />
67
Building regulations<br />
6.26 One of the reasons that people give for<br />
<strong>not</strong> recycling is the lack of room in their homes<br />
to store separated material. 86 In future such<br />
storage space should be an integral part of the<br />
design of living space in new developments.<br />
Existing building regulations and planning<br />
guidance do <strong>not</strong> cover designing in space for<br />
the storage of items (such as recyclates) either<br />
inside or outside the home.<br />
Recommendation 6:<br />
ODPM should revise the building regulations<br />
to require, where there are new housing<br />
developments with more than 50 houses,<br />
that space is allocated within the<br />
development for easily accessible recycling<br />
facilities. Similar requirements should be<br />
taken forward in Housing Corporation<br />
standards for new social housing schemes<br />
and NHBC standards for new private housing<br />
developments.<br />
6.28 Although some progress has been made,<br />
performance across departments against targets<br />
set by Green Ministers 88 remains patchy. For<br />
example, there has been wide variation in the<br />
performance of departments against the key<br />
target to recover 25% of total office waste from<br />
recycling or composting in 2000/1, rising to<br />
70% by 2003/4. While a few departments have<br />
been exceeding their recycling targets, others<br />
are recycling less than 25%. 89 Pilot<br />
arrangements for departments to procure<br />
recycled goods, initially paper, were announced<br />
in <strong>Waste</strong> Strategy 2000 but to date have <strong>not</strong><br />
been successfully taken up. Targets proposed by<br />
SPG, in partnership with WRAP, address some<br />
areas of government procurement of particular<br />
environmental concern where there is scope for<br />
improvement. These are set out in Box 21.<br />
Option (d): green<br />
procurement targets for the<br />
public sector<br />
6.27 The Government can play a significant<br />
role in boosting markets for recycled materials<br />
by increasing targets for green procurement. A<br />
high-level inter-departmental Sustainable<br />
Procurement Group (SPG) 87 has been set up by<br />
DEFRA to raise awareness of the importance of<br />
green procurement across government.<br />
86<br />
MORI research report for SU and ENCAMS study op. cit<br />
WASTE NOT, WANT NOT<br />
87<br />
SPG is feeding into the new Framework for Sustainable Development on the Government Estate to be published in Spring 2003 (see<br />
http://www.sustainable-development.gov.uk). This new Framework supersedes the Greening Government initiative and will<br />
incorporate new targets<br />
88<br />
Green Ministers are tasked with considering the impact of government policies on sustainable development and championing<br />
sustainable development in their own departments. For details of published targets see the Greening Government Third Annual Report<br />
(2001) at http://www.sustainable-development.gov.uk<br />
89<br />
Data from the Greening Government Third Annual Report (2001) e.g. the Home Office recycled 21% of its waste in 2000/01; the ONS<br />
22%; and DfEE 25%. A number of departments did <strong>not</strong> submit data, in part because some may <strong>not</strong> have had adequate data<br />
collection systems in place at the time<br />
68
Box 21: SPG/WRAP proposed targets* for government green<br />
procurement<br />
Targets for paper<br />
White copier paper – recycled fibre should comprise a minimum of 35% of the weight of paper<br />
procured in any one year by 2003/4, increasing to a minimum of 75% by 2006/7.<br />
Tissue (eg hygiene products) to be made from 100% recycled material from 2003/4.<br />
Packaging to consist of 100% recycled materials from 2003/4.<br />
Targets for construction materials<br />
For aggregates, a target of at least 10% recycled (by weight) by 2003/4, rising to 20% by<br />
2006/7.<br />
For all other construction materials, a target of at least 10% (by value) by 2003/4, rising to 25%<br />
by 2005/6.<br />
(Suggested targets apply per project and would <strong>not</strong> be applicable to projects under £500,000 in<br />
value.)<br />
*As of December 2002, targets are still being finalised. Further details on these targets, including the reasoning behind<br />
them, are included in Annex E on Greening Government procurement, available on the Strategy Unit web site at<br />
www.strategy.gov.uk.<br />
6.29 In local government, sustainable<br />
procurement is also used inconsistently and is<br />
part of a broader issue of procurement<br />
management. The Byatt review of local<br />
authority procurement skills 90 recommended<br />
that every authority should have in place a<br />
formal documented procurement strategy.<br />
According to the Audit Commission, 91 80% of<br />
procurement strategies are inadequate, either<br />
because they are <strong>not</strong> finalised, <strong>not</strong><br />
implemented, or do <strong>not</strong> cover all the necessary<br />
issues. Byatt also highlighted the importance of<br />
local authorities working in partnership with<br />
each other to negotiate contracts more<br />
effectively.<br />
6.30 The SU supports the work that WRAP is<br />
undertaking with the LGA and IDeA 92 to<br />
promote the take-up of green procurement by<br />
local authorities and the training of<br />
procurement officers. This work should continue<br />
and be extended to the pooling of knowledge,<br />
perhaps through regionally based procurement<br />
units. It is also suggested that formal<br />
mechanisms are put in place by Green<br />
Ministers 93 to roll-out best practice tools<br />
developed by SPG to local government.<br />
Recommendation 7:<br />
OGC and other Departments should work<br />
through SPG and WRAP to finalise targets<br />
for the use of recycled materials as set out in<br />
Box 21. Departments should put in place a<br />
trained Green Procurement Officer (either<br />
combined with a finance officer’s role, or as<br />
a separate post). Consideration should also<br />
be given to setting specific waste<br />
90<br />
Ian Byatt chaired a review of the state of procurement skills and practices in English local government in Summer 2000, taking<br />
evidence from 35 local authorities. Research in support of Byatt by the DETR/LGA found that only 27% of English local authorities had<br />
a written procurement strategy in place as at September 2000. 50% were in progress<br />
91<br />
Audit Commission Competitive Procurement (March 2002)<br />
92<br />
Local Government Association (LGA) and the Improvement and Development Agency (IDeA). IDeA is an advocate of best practice in<br />
local government and aims to develop practical and innovative solutions to improve local government communications and<br />
performance. Further information about IDeA is available on their web site at www.idea.gov.uk<br />
93<br />
The Ministerial Sub-Committee of Green Ministers (ENV(G)). This is made up of 20 Ministers from every government department<br />
ECONOMIC AND REGULATORY FRAMEWORK<br />
69
minimisation targets for office waste<br />
streams, for example, for office paper.<br />
Recommendation 8:<br />
ODPM and the LGA should consider setting<br />
voluntary environmental procurement<br />
targets for local authorities to encourage<br />
the purchase of more recycled goods and<br />
services, to minimise waste volumes and to<br />
encourage them to recycle more of their<br />
waste. These targets might be incentivised in<br />
a number of ways, for example through links<br />
to implementing service area targets within<br />
Sustainability Action Plans or re-instating<br />
waste in Beacon status for councils.<br />
Option (e): targets for local<br />
authorities<br />
6.31 The Government has set statutory<br />
performance standards for each <strong>Waste</strong><br />
Collection Authority and <strong>Waste</strong> Disposal<br />
Authority. These have been set at a level to<br />
ensure that each authority contributes<br />
proportionately to the achievement of the<br />
national targets in 2003/4 and 2005. 94 In<br />
addition there are nine Best Value Indicators for<br />
waste management. 95<br />
6.32 The statutory targets are intended to drive<br />
up the rate of recycling but they risk creating<br />
perverse incentives. Since the targets are<br />
expressed as percentages of total waste<br />
tonnages, there is a particularly strong incentive<br />
to recycle the heaviest items such as green<br />
waste, but this may <strong>not</strong> be the economically or<br />
environmentally most efficient outcome.<br />
Moreover, they risk encouraging the collection<br />
of additional green waste, which could be more<br />
cost-effectively managed through home<br />
composting. 96 There are no explicit targets for<br />
waste reduction, despite <strong>Waste</strong> Strategy 2000<br />
stating that these should be a priority. 97<br />
6.33 The nine Best Value Indicators (see Box 22)<br />
also contain various anomalies:<br />
●<br />
●<br />
they are based on the tonnage collected with<br />
no indicator of success in reducing waste<br />
collected;<br />
they include an indicator for ‘the cost of<br />
waste disposal per tonne’. But costs could be<br />
reduced by disposing of more waste at<br />
landfill sites.<br />
WASTE NOT, WANT NOT<br />
94<br />
Taking performance from the 1998/99 baseline data, these standards equate for many authorities to doubling their 1998/99 recycling<br />
rate by 2003/4. Audit Commission <strong>Waste</strong> Management: Guidance for improving services<br />
95<br />
see http://www.bvpi.gov.uk<br />
96<br />
Where local authorities are offering green waste collections, there is evidence of a significant increase in waste growth compared to<br />
those that do <strong>not</strong>. Parfitt J. (2002)<br />
97<br />
Evidence suggests a correlation between waste reduction and those authorities that have encouraged home composting. However, in<br />
some cases local authorities have encouraged waste growth through issuing 240 litre bins, compared to the normal bin size of 140<br />
litres, and proposing that waste is only collected fortnightly even though pressure to maintain service levels has often resulted in<br />
weekly collections. Parfitt J. (2002)<br />
70
Box 22: The nine Best Value Indicators<br />
<strong>Waste</strong> management is a key service provided by local authorities and a number of Best Value<br />
Indicators have been set for waste management services. These are:<br />
1. The tonnage and percentage of household waste arisings that are<br />
– recycled<br />
– composted<br />
– used to recover heat, power and other energy sources<br />
– landfilled<br />
2. Weight of household waste collected, per head<br />
3. Cost of keeping land clear of litter and refuse per km<br />
4. Cost of waste collection per household<br />
5. Cost of municipal waste disposal, per tonne<br />
6. Number of collections missed per 100,000 collections of household waste<br />
7. Percentage of people satisfied with cleanliness standards in their area<br />
8. Percentage of people expressing satisfaction with<br />
– recycling facilities<br />
– household waste collection<br />
– civic amenity sites<br />
9. Percentage of population served by a kerbside collection of recyclable waste, or within one<br />
kilometre of a recycling centre.<br />
Source: <strong>Waste</strong> Strategy 2000, Vol. II<br />
6.34 The SU has reviewed whether the current 6.35 All have merits in principle: they are<br />
targets and indicators should be amended. simple, output based and would provide<br />
There are several options that would provide incentives consistent with overall strategic<br />
better-focused targets:<br />
objectives. However, there are practical<br />
●<br />
●<br />
●<br />
a waste minimisation target alongside the<br />
recycling rate;<br />
a balanced scorecard approach combining<br />
waste minimisation and recycling and a<br />
residual waste target; and<br />
a residual waste target i.e. a volume limit on<br />
waste after re-use and recycling/composting<br />
– a declining target would be set over time.<br />
98<br />
A broad definition is given in Chapter 5 but for a measurable target this would need to be refined<br />
difficulties in their application – the key one<br />
being definitions e.g. what counts as residual<br />
waste. 98<br />
6.36 The most effective target would be the<br />
residual one. It is simple and moves away from<br />
the unnecessary focus on tonnage based<br />
recycling rates, which have led to increased<br />
waste growth.<br />
ECONOMIC AND REGULATORY FRAMEWORK<br />
71
Recommendation 9:<br />
DEFRA together with ODPM, the Audit<br />
Commission and WRAP should develop<br />
proposals for alternative indicators that<br />
incorporate success in reducing waste<br />
volumes. New targets for local authorities<br />
should then be set to reflect the SU waste<br />
reduction and recycling strategy.<br />
Recommendation 10:<br />
DEFRA should continue to encourage the<br />
development of quality standards for<br />
compost, ensuring in particular that the<br />
needs of the customer are taken fully into<br />
account. These quality standards should<br />
inform DEFRA’s position during any<br />
negotiations on an EU Bio-waste Directive.<br />
WASTE NOT, WANT NOT<br />
72<br />
Promoting more composting<br />
6.37 Markets for compost, as well as for<br />
recyclates have a vital role to play in reducing<br />
the volume of biodegradable municipal waste<br />
going to landfill.<br />
6.38 The most immediate issue concerning<br />
compost has been raised by the Animal By<br />
Products Order (ABPO) 1999. Amendments to<br />
the ABPO in 2001 effectively banned the<br />
composting of catering waste by making it<br />
illegal to spread the resulting compost on land<br />
where animals (including wild birds) may have<br />
access. This has halted progress in the use of<br />
compost on agricultural land. DEFRA have<br />
issued a consultation paper on changes to the<br />
ABPO that will allow the composting of catering<br />
waste and its spreading on land, under certain<br />
conditions. 99<br />
6.39 Currently there are no statutory standards<br />
for compost; however this may change as the<br />
EU is expected to begin negotiations on a Bio-<br />
<strong>Waste</strong> (the biodegradable fraction of waste)<br />
Directive sometime in 2003. In the meantime a<br />
full national British Standard has been<br />
developed by the Composting Association,<br />
WRAP and BSI (see Box 20).<br />
6.40 The development of markets for organics<br />
is considered further in Chapter 7.<br />
6.41 A separate annex on biowaste is available<br />
on the SU web site.<br />
6.42 DEFRA should also develop a bio-waste<br />
strategy addressing, amongst other issues:<br />
●<br />
●<br />
●<br />
●<br />
making available a soil map showing where<br />
compost may benefit agricultural land;<br />
the provision of advice to farmers on the<br />
agricultural and environmental benefits of<br />
compost;<br />
the contribution compost can make as a<br />
carbon sink for the UK climate change<br />
programme; and<br />
the scope for extending farm environment<br />
schemes to cover the improvement of soil<br />
quality through the application of compost.<br />
Reducing the volume of waste<br />
sent to landfill sites<br />
6.43 The main options are:<br />
(a) a further increase in the landfill tax;<br />
(b) banning waste from landfill.<br />
Option (a): a further increase<br />
in the landfill tax<br />
6.44 The UK introduced a landfill tax in 1996.<br />
There are two tax rates: a standard rate,<br />
originally set at £7 per tonne, for “active”<br />
wastes; and a lower rate of £2/t for “inactive”<br />
wastes. 100 While the lower rate has remained at<br />
99<br />
In the absence of domestic legislation on this issue, the terms of the EU Animal By-Products Regulation will become UK law. These<br />
requirements are much more stringent and probably rule out composting operations using catering waste as the feed material<br />
100<br />
Inactive waste includes: rocks and soil, ceramic or concrete materials, minerals, furnace slags, ash, low activity inorganic compounds,<br />
calcium sulphate, calcium hydroxide and brine, water
£2/t since inception, the standard rate was<br />
increased to £10/t in 1999. Current policy for<br />
the standard rate is based on the escalator<br />
announced in 1999, under which there was to<br />
be a series of five annual £1/t increases from<br />
April 2000 to April 2004. The standard rate for<br />
active wastes will therefore reach £15/t in April<br />
2004.<br />
6.45 When the landfill tax was introduced the<br />
rates were based on estimates of the<br />
environmental externalities (i.e. the<br />
environmental costs that are <strong>not</strong> reflected in the<br />
market price) associated with disposing of waste<br />
at landfill. As mentioned above, current policy<br />
for the standard rate is based on the escalator<br />
announced in 1999. In effect, the landfill tax<br />
has become more of a “behavioural” tax,<br />
designed to reduce further our reliance on<br />
landfill, and encourage a shift towards more<br />
sustainable waste disposal practices.<br />
6.46 The annual revenue raised by the tax is<br />
£502 million (2001/02) 101 net of contributions<br />
to the Landfill Tax Credit Scheme, of which<br />
95% is ‘active’ waste revenue. This is offset by a<br />
0.2% reduction in employer National Insurance<br />
Contributions.<br />
Moreover, landfill disposal costs represent a<br />
relatively small proportion of business operating<br />
expenses. 103<br />
6.48 If a reduction in landfill is desirable (and<br />
the earlier chapters of this report argue it is), a<br />
further increase in the landfill tax would be one<br />
way in which this could be achieved. 104,105,106<br />
It would be important, however, that any<br />
increase in the landfill tax strikes the right<br />
balance between stimulating the desired change<br />
in behaviour whilst <strong>not</strong> imposing unacceptable<br />
burdens on local authorities and business.<br />
6.49 Of the total revenue sourced from active<br />
waste, approximately 46% is paid by business<br />
and the remaining 54% by local authorities.<br />
Some analysis has shown that for business<br />
sectors, a landfill tax as high as £45/tonne<br />
would mean that waste management costs<br />
would rise to at most only a few tenths of a<br />
percent of turnover in any one sector. 107<br />
However, this analysis would need to be<br />
supplemented by more work to look at the<br />
impact in more detail.<br />
6.47 Since the introduction of the tax, there<br />
has been a 60% reduction in the volumes of<br />
‘inactive’ waste sent to landfill sites, whilst the<br />
volume of ‘active’ waste sent to landfill has<br />
remained broadly unchanged. 102 The latter is<br />
explained by the fact that the costs of landfill,<br />
including landfill tax, remain low compared to<br />
other alternative methods of treatment/disposal.<br />
101<br />
Latest year. The Landfill Tax Credit Scheme is explained in more detail in Chapter 7. Source: Customs and Excise Annual Boards<br />
Reports<br />
102<br />
Customs and Excise<br />
103<br />
Quoted in ACBE Resource Productivity, <strong>Waste</strong> Minimisation and the Landfill Tax (August 2001) – Original source: Effectiveness of the<br />
Landfill Tax in the UK: Barriers to Effectiveness and Options for the Future, ECOTEC Research and Consulting (March 1998)<br />
104<br />
Environment, Transport and Regional Affairs Select Committee 5th Report op.cit<br />
105<br />
ACBE, op.cit<br />
106<br />
Budget 2002: “The Government anticipates that the standard rate of landfill tax will need to be increased significantly in the medium<br />
term as part of the mix of future policy measures.”<br />
107<br />
ACBE, op.cit<br />
ECONOMIC AND REGULATORY FRAMEWORK<br />
73
Figure 12: Landfill tax rates and prices in other countries<br />
EU states: Tax rates £/tonne Landfill prices £/tonne<br />
Austria 18-54 36-82<br />
Belgium 3-14 43-51<br />
Denmark 28 13-21<br />
Finland 9 -<br />
France 4 -<br />
Germany none 16-32<br />
Greece none 4-9<br />
Ireland none -<br />
Italy 0.6-16 -<br />
Luxembourg none -<br />
Netherlands 8-40 47<br />
Portugal none 4-9<br />
Spain none 9<br />
Sweden 17 -<br />
UK 2-13 13-23<br />
Non-EU states:<br />
Czech Republic 11 -<br />
Norway 24.50 -<br />
Switzerland 6-20 56-65<br />
Note: figures are approximate due to rounding. Figures represent the latest years available<br />
and may <strong>not</strong> be consistent between countries<br />
Sources: OECD, ENDS and Austrian Federal Environment Agency, 2002<br />
6.50 Of those countries which have a landfill<br />
tax, the UK currently has the lowest tax rates for<br />
active waste (Figure 12), apart from France<br />
(which has an escalator of 1 Euro per tonne per<br />
annum) and Finland which is proposing large<br />
increases (See Box 23 below). As the UK also<br />
has relatively low gate fees 108 the overall cost of<br />
landfill remains low compared to other<br />
countries.<br />
WASTE NOT, WANT NOT<br />
108<br />
the price charged by the waste management facility for dealing with the waste<br />
74
Box 23: Recently announced increase in landfill tax in Finland<br />
The Finnish government has proposed doubling its landfill tax over the next three years. A newly<br />
approved national waste plan, covering the years 2002 to 2005, stresses the need for urgent<br />
measures to improve waste management practices in Finland as progress has been slow. Under<br />
the plan, waste taxes are to rise in steps from their present level of €15.14 per tonne of waste to<br />
€30 per tonne by 2005. Revenue is to be used to increase government spending on research<br />
and development and other investments in waste management.<br />
6.51 Like businesses, a rise in landfill tax will<br />
provide local authorities with an incentive to<br />
fund alternative ways of managing and<br />
disposing of waste. For example, increasing<br />
recycling through civic amenity sites and bring<br />
sites – the lowest cost ways of recycling – would<br />
become economically attractive options.<br />
6.52 It is <strong>not</strong> envisaged that the operation of<br />
the tradable allowances scheme (Box 24) will be<br />
adversely affected by increases in the landfill<br />
tax. It supplements the effect of the tax by<br />
providing an additional incentive to ensure that<br />
targets under Article 5 of the Directive relating<br />
to biodegradable municipal waste will be met.<br />
However, significant rises in landfill tax rates to<br />
those approaching the highest rates in Europe,<br />
could remove the incentive for local authorities<br />
to trade allowances as the net cost of diverting<br />
waste to alternative waste management options<br />
falls.<br />
Box 24: Tradable landfill allowances for local authorities<br />
The <strong>Waste</strong> and Emissions Trading Bill was published on 15 November 2002. Part 1 of the Bill sets<br />
up a system of tradable landfill allowances. This is believed to be the first of its kind in Europe. If<br />
an active trading market develops, this system should help to ensure that the targets in Article 5<br />
of the Landfill Directive are met in the most cost efficient and effective way for the UK as a<br />
whole.<br />
<strong>Waste</strong> disposal authorities will be able to send to landfill biodegradable municipal waste only up<br />
to the levels of the allowances which they hold. Local authorities that divert more waste away<br />
from landfill (e.g. though more recycling) will be able to trade their unused allowances with a<br />
local authority that does <strong>not</strong> hold enough allowances to cover the amount of waste it plans<br />
to landfill.<br />
The key advantage of tradable allowances is that they allow the Landfill Directive targets to be<br />
met at less cost. This is because those authorities with high costs of diversion from landfill will<br />
wish to buy allowances from those with lower costs of diversion so that they can continue to<br />
landfill. Lower cost diverters will be incentivised to over-achieve their targets and receive an<br />
income from selling the surplus allowance.<br />
ECONOMIC AND REGULATORY FRAMEWORK<br />
75
6.53 Lessons from the introduction of high<br />
rates of landfill tax in other countries include:<br />
●<br />
it forces all firms to comply regardless of the<br />
costs.<br />
●<br />
●<br />
the importance of signalling the increase 2 to<br />
3 years in advance to allow time for the<br />
transition and the development of<br />
alternatives; and<br />
there may be advantages in banning specific<br />
waste products from landfill sites in parallel<br />
with the tax increase.<br />
6.54 Based on SU analysis of the relative prices<br />
of waste management options, a landfill tax rate<br />
of £35/t would provide a sufficient incentive to<br />
change behaviour and reduce reliance on<br />
landfill as the major waste management option.<br />
This is broadly in line with previous estimates. 109<br />
Recommendation 11:<br />
HM Treasury should consider an increase in<br />
the landfill tax to £35/t for active waste in<br />
the medium term.<br />
6.55 The proceeds from an increased landfill<br />
tax are considered in Chapter 8.<br />
6.57 There is less of a case for applying a ban<br />
now, however it could be retained as an option<br />
for the future. A suitable time for review would<br />
be 3-4 years before the first Article 5 target on<br />
municipal biodegradable waste to landfill in<br />
2010.<br />
6.58 A specific ban on biodegradable material<br />
could be considered if the other instruments<br />
designed to meet Article 5 of the Landfill Directive<br />
were failing to make progress. A<strong>not</strong>her alternative<br />
is to impose a ban on recyclable materials at some<br />
future point. Consideration could also be given to<br />
extending a similar ban to incineration.<br />
Recommendation 12:<br />
DEFRA and DTI should review the case for a<br />
ban on the landfilling of recyclable products<br />
in 2006/7 and at the same time consider the<br />
case for a similar ban on incinerating<br />
recyclable products.<br />
WASTE NOT, WANT NOT<br />
Option (b): banning waste<br />
from landfill<br />
6.56 The combination of instruments<br />
recommended in this chapter should provide a<br />
strong incentive to reduce volumes of waste<br />
sent to landfill. Consideration of a ban would be<br />
necessary if these instruments were less effective<br />
than anticipated. 110 However, an outright ban<br />
has several disadvantages:<br />
●<br />
●<br />
it allows less flexibility within the waste<br />
management system compared to economic<br />
incentives;<br />
it can be counterproductive if, for some<br />
wastes, landfilling is the most cost-effective<br />
option; and<br />
Should there be a<br />
complementary increase in<br />
fines?<br />
6.59 As the landfill tax increases and waste costs<br />
go up, there is a strong argument for increasing<br />
the penalties for illegal dumping of waste.<br />
6.60 The evidence on fines and prosecutions<br />
shows that current penalties are low. Although<br />
the fines imposed for waste offences by<br />
Magistrates Courts under Section 33 of The<br />
Environmental Protection Act 1990 have been<br />
gradually increasing, 111 the average levels of<br />
fines still fall far short of the maximum that can<br />
be awarded for waste offences i.e. up to<br />
£20,000 as shown by Figure 13 below.<br />
109<br />
See for example Biffa Future Perfect (2002) and the House of Commons Environment, Transport and Regional Affairs Committee Fifth<br />
Report<br />
110<br />
Sweden has banned combustible municipal waste from landfill from January 2002. This was first proposed in 1997. Sweden already<br />
landfills just under one quarter of household waste, the figure is estimated to fall as low as 5-10% within three years (Swedish<br />
Environmental Protection Agency)<br />
111<br />
Data supplied by the Environment Agency. Maximum penalties for waste offences under Section 33 (8) of The Environmental<br />
Protection Act 1990: on summary conviction, imprisonment for up to six months or a fine up to £20,000 or both; on conviction on<br />
indictment, imprisonment for up to two years or a fine or both<br />
76
Figure 13: Prosecutions and average fines for various waste<br />
management offences between 1999-2002<br />
14,000<br />
12,000<br />
10,000<br />
Prosecutions<br />
Average Fine<br />
£12,130<br />
8,000<br />
6,000<br />
4,000<br />
£3,044<br />
£4,553<br />
£3,989<br />
2,000<br />
0<br />
645<br />
Individuals &<br />
Organisations<br />
£1,147<br />
304<br />
72 14 39<br />
Individuals Organisations Individuals Organisations<br />
Offence 1 Offence 2 Offence 3<br />
Offence 1: Section 33 – Unauthorised or harmful depositing, treatment or disposal of waste<br />
Offence 2: Section 33 (1) (a) – Fly-tipping and Related Offences<br />
Offence 3: Section 33 (6) – Contravention of conditions of a waste management licence<br />
6.61 A recent Home Office report 112 on fine<br />
enforcement in magistrates’ courts highlighted<br />
the need for more effective imposition of fines<br />
at the point of sentencing; shortening<br />
timescales for enforcement actions; and<br />
measures to deal with persistent offenders.<br />
More generally, the report highlighted the<br />
importance of increasing courts’ capacity to<br />
trace and pursue offenders more efficiently and<br />
the need for better training for magistrates.<br />
6.62 The Lord Chancellor’s Department has in<br />
place (from April 2002) a 2-year collection<br />
scheme by which revenue from fines paid is<br />
netted off and returned to the courts, ringfenced<br />
for enforcement. Legislation on more<br />
stringent fine enforcement arising from the<br />
Government’s “Justice for All” White Paper 113 is<br />
also being taken forward through the Courts<br />
Bill, introduced in the House of Lords on 28<br />
November 2002.<br />
112<br />
Home Office, Fine enforcement in magistrates’ courts (2002)<br />
Recommendation 13:<br />
The Home Office/Lord Chancellor’s<br />
Department should ensure that guidance<br />
directed to magistrates is sufficient to<br />
support more prosecutions for waste crimes.<br />
Strengthening the role of other deterrents to<br />
waste crimes, such as vehicle confiscation,<br />
driving license removal, and more ‘on the<br />
spot’ fines, should also be considered.<br />
Even if high levels of recycling<br />
are reached, it will still leave a<br />
significant proportion of the<br />
waste stream to be managed<br />
6.63 Less of England’s waste stream will go to<br />
landfill for the reasons explained in earlier<br />
chapters. The implications for incineration and<br />
other residual waste management methods will<br />
depend on the success of the future waste<br />
113<br />
The Government White Paper Justice for All was published in July 2002 and set out a programme of reform of the Criminal<br />
Justice System<br />
ECONOMIC AND REGULATORY FRAMEWORK<br />
77
management strategy in reducing waste<br />
volumes, increasing re-use and promoting<br />
recycling. The more successful these aspects of<br />
the strategy, the smaller will be the volume of<br />
residual waste to be disposed of, and the lower<br />
the requirement for associated facilities.<br />
6.64 England makes less use of incineration<br />
than other industrialised countries (see Box 25).<br />
Incineration capacity has been increasing very<br />
slowly in the UK in recent years. There are<br />
currently 12 incinerators dealing with municipal<br />
waste.<br />
Box 25: How other countries manage their residual waste<br />
The two main methods of managing residual waste in other nations are incineration and landfill.<br />
Incineration is widely used in other nations as a means of recovering some energy as electricity<br />
and heat.<br />
It accounts for about 20% of municipal waste management on average in the EU. Even countries<br />
with high recycling rates e.g. the Netherlands incinerate around 30% of their waste. The UK<br />
currently incinerates about 9% of its waste.<br />
Despite having kerbside recycling and other measures in place to tackle waste, the Italian<br />
Government has recently decided it must build some incinerators to deal with residual waste and<br />
has set out a national programme to this end.<br />
WASTE NOT, WANT NOT<br />
What is the potential role of<br />
incineration?<br />
6.65 Although there is some recovery of energy<br />
and heat from incineration it can be quite small,<br />
and the EU is currently deciding if incineration<br />
should be classified as a disposal option. In the<br />
SU’s view, recycling is higher up the waste<br />
hierarchy than incineration. However,<br />
incineration is widely used in the EU (even in<br />
nations with high recycling rates) for waste that<br />
is <strong>not</strong> easily recycled or can<strong>not</strong> be recycled as<br />
an alternative to landfill.<br />
6.66 Its place in England’s waste management,<br />
like any other option for managing residual<br />
waste, depends on our success in reduction, reuse<br />
and recycling and the development of<br />
alternative residual waste facilities such as MBT.<br />
If we do <strong>not</strong> reduce our residual waste/develop<br />
alternatives we will need far more incinerators<br />
to manage residual waste.<br />
6.67 Ultimately it is for local authorities to<br />
decide on the BPEO for managing their waste.<br />
When considering incineration they should:<br />
●<br />
●<br />
●<br />
●<br />
take care to avoid being locked into long<br />
term tonnage contracts that do <strong>not</strong> take<br />
account of plans to reduce and recycle<br />
considerably more waste;<br />
make the choice between lower costs, by<br />
sharing large-scale incinerators with<br />
neighbours, and higher cost local incinerators<br />
on a smaller scale;<br />
give thought to the development of contracts<br />
that only allow the incineration of residual<br />
waste i.e. waste after it has been presegregated;<br />
and<br />
consider other options like MBT for<br />
managing residual waste.<br />
78
6.68 The aim should be to find the best options<br />
for dealing with waste which can<strong>not</strong> be<br />
reduced, re-used or recycled. This is a decision<br />
best made by local authorities depending on<br />
local circumstances.<br />
Should there be a<br />
complementary introduction<br />
of an incineration tax?<br />
6.69 The introduction of a much higher rate of<br />
taxation on landfill sites raises the question of<br />
whether an incineration tax needs to be<br />
introduced in parallel to reflect the logic of the<br />
waste hierarchy. Several considerations are<br />
relevant to this:<br />
●<br />
the evidence on the environmental<br />
externalities associated with incineration is<br />
mixed. Some estimates point to<br />
environmental costs of £50 per tonne whilst<br />
others point to benefits of £30 per tonne<br />
depending on the assumptions about which<br />
fuels and generating technologies are used to<br />
produce the electricity displaced by the<br />
incinerator; 114<br />
Recommendation 14:<br />
The case for an incineration tax should be<br />
kept under review. The purpose of raising<br />
the landfill tax is <strong>not</strong> to promote<br />
incineration at the expense of all other<br />
options, but rather to send a clear signal<br />
about landfill.<br />
6.70 Any review should consider the possibility<br />
of applying differential tax rates e.g. to promote<br />
‘cleaner technology’ and/or on different types<br />
of waste processed through incineration, with<br />
perhaps higher taxes on incineration of<br />
unsorted waste, recyclable materials, or<br />
materials with a high level of toxicity.<br />
What are the health effects of<br />
incineration?<br />
6.71 No waste management options carry zero<br />
risk. Incineration is one of the most widely<br />
studied of all the waste options. There are those<br />
who say that there are significant health<br />
effects 115 and those who disagree. 116<br />
●<br />
a significant increase in the landfill tax is<br />
unlikely to make incineration the cheapest<br />
option for disposing of waste. Furthermore, it<br />
is <strong>not</strong> expected that all waste diverted from<br />
landfill would automatically be incinerated.<br />
114<br />
These figures reflect the range of external cost estimates in the available literature<br />
115<br />
Greenpeace, Incineration and Human Health, Friends of the Earth, Incineration and Health issues<br />
116<br />
Environment Agency, Solid Residues from Municipal <strong>Waste</strong> Incinerators in England and Wales, National Society of Clean Air, Comparisons<br />
of emission from waste management options<br />
ECONOMIC AND REGULATORY FRAMEWORK<br />
79
Box 26: Department of Health evidence on the health effects of the<br />
incineration of municipal solid waste: 117<br />
●<br />
●<br />
●<br />
A report on “Health effects of waste combustion products” published in 1997 by the Medical<br />
Research Council Institute for Environment and Health concluded that epidemiological studies<br />
of people who work or live near incinerators have shown no consistent excess incidence of any<br />
specific disease.<br />
Similarly, a report on waste incineration and public health published in 1999 by the US<br />
National Research Council, concluded that “few epidemiological studies have attempted to<br />
assess whether adverse health effects have actually occurred near individual incinerators, and<br />
most of them have been unable to detect any effects.” The studies which did report any<br />
health effects had shortcomings and failed to provide convincing evidence.<br />
The independent advisory committee on the carcinogenicity of chemicals in food, consumer<br />
products and the environment has considered studies on cancer incidence near municipal<br />
solid waste incinerators. It considers that any risk of cancer due to residency near to municipal<br />
solid waste incinerators is exceedingly low and probably <strong>not</strong> measurable using most modern<br />
epidemiological techniques. The committee said there was no further need for investigations<br />
of cancer incidence near municipal solid waste incinerators. Their statement can be found at<br />
www.doh.gov.uk/munipwst.htm<br />
These studies suggest that, while health effects can<strong>not</strong> be completely ruled out, the potential<br />
effects are so small that they are very difficult to isolate from other potential causes. Indeed,<br />
exposure to risk was hard to measure with any precision.<br />
The Department of Health states it is <strong>not</strong> aware of any subsequent epidemiological studies that<br />
invalidate these conclusions. Furthermore most of these studies concern older incinerators which<br />
are now required to comply with much more stringent emissions standards.<br />
WASTE NOT, WANT NOT<br />
6.72 Despite this research and the fact that 6.74 Incineration should be treated like any<br />
emissions from incinerators are falling rapidly, other waste management approach. This means<br />
incineration continues to be the subject of a that every effort should be made to ensure that<br />
good deal of controversy. This is particularly they are well regulated. If it is the BPEO for an<br />
with respect to the potential health effects of area, and it is effectively regulated, it should be<br />
even very low levels of emissions.<br />
for local authorities to decide if they wish to use<br />
6.73 The SU’s initial review of the literature 118 this method. Although all residual waste options<br />
should be scaled to ensure they take full account<br />
suggests that whilst there are concerns about<br />
of waste reduction and recycling targets.<br />
the health effects of materials produced from all<br />
waste management facilities, the risks are very 6.75 However, building on the initial review<br />
low and difficult to measure. Like the<br />
undertaken by the SU, there is a case for setting<br />
Department of Health, the review found no up a more comprehensive evidence base on the<br />
evidence of a proven causal link between health and environmental effects of incineration<br />
incinerators and cancer.<br />
and all other waste management options to:<br />
117<br />
Department of Health<br />
118<br />
SU working paper, Enviros Aspinwall, The Context for Emissions and Health Impacts Associated with <strong>Waste</strong> Management.<br />
This is summarised in Annex J, available on SU website<br />
80
●<br />
●<br />
help planners and local authorities when<br />
making decisions; and<br />
provide the conditions for greater public<br />
acceptance of all the different options for<br />
managing residual waste.<br />
Recommendation 15:<br />
An independent body should bring together<br />
the literature and evidence on the relative<br />
health and environmental effects of all the<br />
different waste management options;<br />
relative both to each other and to other<br />
activities affecting health and the<br />
environment.<br />
ECONOMIC AND REGULATORY FRAMEWORK<br />
81
7. CHAPTER STRATEGIC HEADINGS INVESTMENT MEASURES<br />
Summary<br />
The changes described in chapters 5 and 6 need to be backed up by<br />
practical measures now if we are to achieve a sustainable system of waste<br />
management.<br />
This requires a balanced package, which will:<br />
(i)<br />
reduce the rate of growth in waste quantities through an expansion<br />
of home composting, the promotion of waste minimising measures in<br />
the retail sector and encouraging the design of new products<br />
specifically to reduce biodegradable waste;<br />
(ii) expand and develop the infrastructure for recycling through a<br />
programme of best practice advice on the collection of materials, the<br />
development of recyclate markets, and kerbside, bring and civic<br />
amenity site design;<br />
(iii) provide better information and advice to households and businesses;<br />
(iv) improve the quality and range of data and research on waste by<br />
improving the co-ordination of existing surveys and data, increasing<br />
dissemination, filling critical gaps and ensuring efficient data<br />
collection systems; and<br />
(v) promote new technologies and approaches to waste management<br />
through a package of technical support and advice and a programme<br />
of pilot studies.<br />
WASTE NOT, WANT NOT<br />
82
If England is to make progress<br />
towards sustainable waste<br />
management new investment<br />
is needed now<br />
7.1 Chapter 6 set out the recommended<br />
framework of incentives and regulation that<br />
needs to be put in place in the medium to<br />
longer term. This chapter sets out what is<br />
required in the short term.<br />
7.2 There are five key elements:<br />
1. Reducing the amount of waste produced by<br />
households.<br />
2. The expansion of recycling via kerbside<br />
collection, increased bring and well designed<br />
civic amenity sites, and composting.<br />
3. Improving information and advice available<br />
to households and industry on all aspects of<br />
managing and reducing waste.<br />
4. Improving the data and research available to<br />
government, local authorities and the waste<br />
industry for policy formulation, strategic<br />
planning and service delivery.<br />
What’s needed?<br />
7.4 Five key measures are proposed. Their aim<br />
is to bring about a 1% per annum reduction in<br />
the rate of growth in household waste<br />
quantities from 3% to 2%, equivalent to about<br />
1 million tonnes each year by 2005/06. The<br />
measures are described in more detail in Figure<br />
14 but, in summary, consist of:<br />
●<br />
●<br />
an extension of home composting<br />
participation;<br />
greater use of re-usable nappies;<br />
● a retailer initiative focused on the top 5<br />
supermarkets;<br />
●<br />
●<br />
increased research and development on<br />
waste minimisation through better product<br />
design; and<br />
WRAP to help LAs conduct incentive based<br />
schemes for waste minimisation and<br />
education to accompany waste minimisation<br />
programmes.<br />
5. Promoting new technologies.<br />
Priority 1: reducing the<br />
amount of waste produced by<br />
households<br />
7.3 This is a crucial yet challenging element of<br />
the overall strategy since it requires a significant<br />
shift in behaviour, lifestyles and attitudes to<br />
waste. But, if successful, it offers potentially high<br />
returns in terms of lower long-run costs of waste<br />
management and a reduced number of extra<br />
facilities, minimising public opposition.<br />
A Home Composter – photo courtesy of The Composting Association<br />
STRATEGIC INVESTMENT MEASURES<br />
83
WASTE NOT, WANT NOT<br />
Figure 14: Four Investment Measures to Reduce <strong>Waste</strong><br />
Measure Aims Rationale Estimated Cost Benefit/impact<br />
1. Extension of home<br />
composting<br />
A three year programme to<br />
help households start home<br />
composting and to improve<br />
composting rates for those<br />
who already participate.<br />
Led by WRAP through a<br />
programme of roll-out of<br />
composting bins and high<br />
quality, practical advice<br />
directly to individual<br />
households. Based on the<br />
successful Master Composter<br />
model from the US and<br />
Canada.<br />
● To raise householder<br />
participation in home<br />
composting by 10% in<br />
urban areas and 15% in<br />
rural areas;<br />
● specific target areas<br />
would be selected after<br />
research. The emphasis<br />
will be on rural areas<br />
where a realistic target<br />
would be 120<br />
kg/household a year<br />
diverted. In urban areas<br />
a realistic target is<br />
90kg/household a year<br />
diverted; 119<br />
● aim is to reduce<br />
arisings by a total of<br />
400,000 tonnes over<br />
three years;<br />
● in each of the following<br />
years the aim is to<br />
reduce arisings by<br />
300,000 tonnes per<br />
annum.<br />
● Home composting<br />
carried out to high<br />
standards is an effective<br />
way of reducing the<br />
organic component of<br />
waste arisings.<br />
● There have been<br />
successful schemes in<br />
Austria, Italy and<br />
Belgium as well as in<br />
Canada and the US.<br />
● Around a third of<br />
households in England<br />
have participated in<br />
some form of<br />
composting activity in<br />
the last 12 months. 120<br />
Local authorities are<br />
estimated to have<br />
rolled out 1.5 million<br />
composting bins since<br />
1995/6. 121 However,<br />
the lack of sustained<br />
support for householders<br />
is a major factor in the<br />
relative lack of<br />
demonstrable success<br />
of current home<br />
composting activities.<br />
Based on an average oneoff<br />
bin cost of £20 per<br />
household (assuming<br />
major economies of scale<br />
from large orders) and an<br />
average support package<br />
of £10 per household a<br />
year, the programme costs<br />
are £30 million over three<br />
years.<br />
● An overall diversion of<br />
300,000 tonnes could<br />
be achieved from the<br />
third year of the<br />
programme onwards.<br />
This is based on raising<br />
participation by an<br />
additional 10% in<br />
urban areas and 15% in<br />
rural areas assuming<br />
waste reduction/<br />
diversion from the<br />
household stream of<br />
90kg-120kg per<br />
household a year.<br />
● Based on average waste<br />
management costs of<br />
£45/t, 122 the reduction<br />
would save £13.5<br />
million in waste<br />
management costs per<br />
year. The programme<br />
breaks even by<br />
2006/07.<br />
119<br />
Parfitt J. (2002), Home Composting – from participation to diversion? Paper presented at Home Composting Conference 2002, Imperial College, London. This shows a range of estimated home<br />
composting diversion rates from 50-250kg/household per year, <strong>not</strong> all of this material would otherwise have become part of the household waste stream. See also Wheeler P. & Parfitt J. (2002),<br />
Lifecycle assessment for home composting. Paper presented to <strong>Waste</strong> 2002 Conference. Recent analysis of home composting diversion field trials showing average 5.25kg/household per week.<br />
120<br />
Onyx/NOP (2000) Public attitudes towards waste<br />
121<br />
DoE/DETR/DEFRA<br />
122<br />
SU analysis. Estimated average unit waste management cost per tonne, net of landfill tax, 2003/4 – 2005/6.<br />
84
Figure 14: Four Investment Measures to Reduce <strong>Waste</strong> (continued)<br />
Measure Aims Rationale Estimated Cost Benefit/impact<br />
2. Re-usable nappies<br />
Building on successful<br />
schemes such as the West<br />
Sussex Initiative, promoting<br />
re-usable nappies and<br />
developing nappy washing<br />
businesses.<br />
The main feature is pump<br />
priming grant aid for SMEs<br />
and new start-ups for nappy<br />
washing businesses.<br />
● To achieve an average<br />
diversion of 225kg/yr<br />
per participating<br />
household by the third<br />
year of the programme.<br />
The scheme would aim<br />
to reach 550,000<br />
households, equivalent<br />
to 24% of households<br />
with children aged 0-3<br />
years;<br />
● aim is to reduce<br />
arisings by a total of<br />
200,000 tonnes over<br />
three years.<br />
● Disposable nappies<br />
make up between 2-<br />
3% of household<br />
waste. Even modest<br />
initiatives to displace<br />
disposable nappy use<br />
with re-usable nappies<br />
can have a significant<br />
waste minimisation<br />
impact.<br />
● Promotion and<br />
education form an<br />
integral part of any<br />
nappy washing<br />
initiative, and more<br />
successful schemes<br />
have also included an<br />
element of financial<br />
incentives to<br />
households.<br />
Based on the West Sussex<br />
Scheme, an average cost<br />
of £18 per household per<br />
year and a target of<br />
550,000 in the scheme at<br />
any one time gives a total<br />
cost of £24 million over 3<br />
years.<br />
● Based on a target of<br />
500,000 households<br />
and an average of<br />
225kg waste diverted<br />
per participating<br />
household per year, the<br />
total reduction is<br />
124,000 tonnes per<br />
year at the end of the<br />
three-year programme.<br />
STRATEGIC INVESTMENT MEASURES<br />
85
WASTE NOT, WANT NOT<br />
Figure 14: Four Investment Measures to Reduce <strong>Waste</strong> (continued)<br />
Measure Aims Rationale Estimated Cost Benefit/impact<br />
3. Retailer initiative<br />
Engaging the top 5<br />
supermarket chains at a high<br />
level to secure agreement to<br />
reduce own brand packaging<br />
and plastic film, introduce refillable<br />
bottles and help<br />
households reduce food<br />
waste, for example through<br />
improved labelling of sell<br />
by/use by dates. WRAP will<br />
draw up the strategy and take<br />
the lead in its<br />
implementation. WRAP<br />
should also work with DEFRA<br />
to ensure that existing<br />
requirements placed on<br />
retailers under the Packaging<br />
Regulations are properly taken<br />
into account.<br />
● To reduce plastic bags,<br />
own-brand packaging,<br />
householder food<br />
waste, plastic film<br />
waste and to promote<br />
the use of refillable<br />
bottles;<br />
● aim is to reduce<br />
arisings by a total of<br />
310,000 tonnes over<br />
three years;<br />
● in each of the following<br />
years the aim is to<br />
reduce arisings by<br />
250,000 tonnes per<br />
year.<br />
● WRAP has established<br />
that between 35-40%<br />
of all household waste<br />
which ultimately ends<br />
up in landfill began its<br />
life as a purchase from<br />
one of the top 5<br />
supermarket chains. 123<br />
● The supermarkets link<br />
massive supply chains<br />
with households’<br />
behaviour and are<br />
therefore best-placed to<br />
influence change.<br />
It is difficult to assess the<br />
costs at this stage. The<br />
supermarkets will incur<br />
costs in changing labels<br />
etc. WRAP will require a<br />
budget to run the<br />
programme estimated to<br />
be £12 million over 3<br />
years.<br />
The potential benefits of<br />
this initiative are probably<br />
greater than any of the<br />
other waste minimisation<br />
programmes in securing a<br />
real reduction in<br />
household waste over the<br />
long term. Over the 3 year<br />
period the programme<br />
should have reduced<br />
waste by over 300,000<br />
tonnes. From 2005/6<br />
onward the estimated<br />
reduction is 250,000<br />
tonnes, saving £11 million<br />
a year.<br />
123<br />
Parfitt J. (2002)<br />
86
Figure 14: Four Investment Measures to Reduce <strong>Waste</strong> (continued)<br />
Measure Aims Rationale Estimated Cost Benefit/impact<br />
4. R&D Innovation Fund<br />
Establish an innovation fund<br />
for waste minimisation<br />
including mechanisms for<br />
targeting products that<br />
impact on the municipal<br />
waste stream, particularly<br />
biodegradable waste. The<br />
fund would be competitive<br />
based on key criteria of<br />
reduction in tonnage of<br />
material and be led and<br />
managed by WRAP. The fund<br />
should be sufficient to identify<br />
and develop five new<br />
innovative products that will<br />
reduce biodegradable MSW.<br />
● Provide funding for the<br />
development of high<br />
quality innovations.<br />
● Further work is needed<br />
to challenge industry<br />
and the retail sector to<br />
develop innovative<br />
ways of minimising<br />
material use in<br />
products, design for<br />
minimum material use<br />
and maximum<br />
recyclability.<br />
A fund of £12 million over<br />
3 years.<br />
The benefits will come<br />
once these innovations are<br />
in place. It is difficult to<br />
assess at this stage.<br />
STRATEGIC INVESTMENT MEASURES<br />
87
What could a reduction in waste<br />
growth achieve?<br />
7.5 Taking 2002/3 as a base year, in which it is<br />
estimated that household arisings in England<br />
will be over 26 million tonnes, growth at 3%<br />
per annum would lead to waste arisings of 29.1<br />
million tonnes by 2005/6 but only 28.3 million<br />
tonnes if the growth rate were only 2% per<br />
annum – giving a waste reduction target of<br />
800,000 tonnes by year 3. Figure 15 below<br />
illustrates the estimated contribution of each<br />
programme to achieving this.<br />
Figure 15: Projected tonnes reduced from household waste<br />
arisings in relation to baseline (3%) and target scenario<br />
(2%): indicative contribution from sub-programmes<br />
Thousands of tonnes<br />
29,250<br />
29,000<br />
28,750<br />
28,500<br />
28,250<br />
28,000<br />
27,750<br />
27,500<br />
27,250<br />
27,000<br />
26,750<br />
26,500<br />
2002/3<br />
base year<br />
<strong>Waste</strong> minimisation: tonnes/year<br />
from sub-programmes<br />
home composting<br />
re-usable nappies<br />
retail sector (excluding nappies)<br />
<strong>Waste</strong> minimisation and<br />
other initiatives/R&D<br />
Baseline scenario:<br />
3% annual increase<br />
Target scenario:<br />
2% annual increase<br />
2003/4 2004/5 2005/6<br />
Year<br />
Source: WRAP<br />
7.6 In summary, the total cost over three years<br />
is £100 million, resulting in an estimated<br />
reduction in waste volumes of 1.14 million<br />
tonnes. This is estimated to save £51million in<br />
waste management disposal costs over three<br />
years. However, the impacts of home<br />
composting, the retail sector initiative and R&D<br />
and other waste minimisation measures will<br />
continue beyond the 3-year period, potentially<br />
saving £32 million per year.<br />
Over 3 years<br />
2003/4 to 2005/6<br />
Cost of four programmes £100m<br />
WASTE NOT, WANT NOT<br />
Anticipated reduction in arisings<br />
1.140 million tonnes<br />
<strong>Waste</strong> management disposal cost savings @ £45/t 124 £51m<br />
124<br />
SU analysis. Estimate of unit waste management cost, net of landfill tax, 2003/04 – 2005/06<br />
88
Recommendation 16:<br />
WRAP should take forward four measures to<br />
reduce waste volumes through an extension<br />
of home composting; promotion of the reuse<br />
of nappies; joint initiatives with the<br />
major supermarkets to reduce packaging;<br />
and support for R&D.<br />
Priority 2: expanding recycling<br />
and composting infrastructure<br />
7.7 Without the necessary infrastructure, a shift<br />
to more recycling and composting will <strong>not</strong> be<br />
delivered.<br />
Figure 16 sets out the key elements of the<br />
infrastructure needed for increased recycling<br />
and composting.<br />
Figure 16: infrastructure for recycling and composting<br />
Collection<br />
infrastructure<br />
Sorting/<br />
bulking<br />
Reprocessing<br />
Secondary<br />
Resource<br />
Market<br />
Kerbside<br />
collections<br />
Civic<br />
amenity sites<br />
Bring banks<br />
Bulking<br />
stations<br />
Material<br />
Recycling<br />
Facilities<br />
(MRFs)<br />
E.g.<br />
Composting<br />
E.g.<br />
Secondary<br />
smelting and<br />
refining mills<br />
E.g.<br />
Pulp mills<br />
7.8 The development of collection infrastructure has been relatively slow because of cost and the<br />
added challenge of encouraging people to participate. Provision of kerbside collections has grown<br />
from 20% of households in 1995/96 to 52% in 2000/01. Box 27 summarises the current situation.<br />
Outside the Material Recovery Facility (MRF) in Portsmouth – photo courtesy of<br />
Hampshire County Council/Onyx<br />
Inside the Material Recycling Facility (MRF) in Huddersfield (part of the Kirklees<br />
Energy and Materials Recycling Park) – photo courtesy of Kirklees Metropolitan<br />
Council<br />
A recycling bring site – photo courtesy of Hartlepool Borough Council<br />
STRATEGIC INVESTMENT MEASURES<br />
89
Box 27: current collection infrastructure for municipal waste<br />
Kerbside collections – 52% of local authorities have some kind of kerbside collection for<br />
recyclables. These are very varied e.g. collecting paper only or a mixed collection of paper, cans<br />
and glass or bulky items only. These types of collection are the most expensive, but also the most<br />
convenient for households. During the period of growth in kerbside collections, there has been a<br />
shift away from paper only collections towards multi-material schemes. Currently only 8% of<br />
households receive organic waste collections.<br />
Civic amenity (CA) sites – 1.2 million tonnes of waste are collected through CA sites. The<br />
current network of civic amenity sites achieves variable recycling rates. The average is 22%<br />
although best practice sites have achieved much higher rates (Essex 53%, Hampshire 51%).<br />
Bring banks – 0.7 million tonnes of waste, mainly paper and glass is collected from bring sites.<br />
The current density of provision is 1:1,170 households – below that in Belgium (1:400) and<br />
Germany (1:800). The Audit Commission recommended in 1997 that good practice should<br />
involve the provision of one bring bank for every 750 households.<br />
J. Parfitt (2002)<br />
WASTE NOT, WANT NOT<br />
90<br />
What’s needed?<br />
7.9 Two investment programmes are needed:<br />
1. a WRAP-led programme of advice to local<br />
authorities on the expansion of kerbside<br />
collection. There should be particular emphasis<br />
on supporting the roll-out of organic waste<br />
collections where current provision is low; and<br />
2. a corresponding expansion of markets for<br />
compost.<br />
The objectives of the programmes would be to:<br />
●<br />
●<br />
●<br />
●<br />
expand collection infrastructure to provide<br />
simple and convenient facilities and to enable<br />
critical capacities to be reached and<br />
economies of scale to be achieved;<br />
increase participation and bring about<br />
behavioural change;<br />
develop recyclate markets focusing more<br />
attention on organic wastes; and<br />
develop secondary materials markets to<br />
stabilise prices and encourage private sector<br />
investment.<br />
7.10 Details of the two proposed programmes<br />
are set out in Figure 17.<br />
125<br />
Spending Review 2002<br />
What could they achieve?<br />
7.11 The aims are to achieve a step change in<br />
the overall levels and quality of composting in<br />
England:<br />
●<br />
●<br />
to produce an additional 1 million tonnes per<br />
annum of compost produced from new local<br />
authority organics collections by 2006. This<br />
should add 3.5% to the average household<br />
recycling/composting rate; and<br />
expand the market for compost in the<br />
landscaping, horticultural and agricultural<br />
sectors to 1 million tonnes by 2006.<br />
7.12 The estimated cost of the programmes is<br />
£45 million over 3 years. The programmes<br />
could be run by WRAP, building on their current<br />
role in developing markets for compost and<br />
drawing on their extensive expertise.<br />
7.13 This would contribute towards meeting<br />
DEFRA’s PSA target of 25% recycling and<br />
composting of household waste that can<strong>not</strong> be<br />
composted at home by 2005/6. 125
Figure 17: Two Investment Measures to Expand Recycling and Composting<br />
Measure Aims Rationale Estimated Cost Benefit/impact<br />
1. Advice to local authorities<br />
on the implementation and<br />
improvement of kerbside<br />
collection, particularly for<br />
organic waste, through a<br />
Kerbside Taskforce (KTF)<br />
service to local authorities.<br />
● To give direct advice to<br />
local authorities;<br />
● to deliver training to<br />
recycling/composting<br />
managers.<br />
● WRAP is currently<br />
piloting a national<br />
training programme for<br />
recycling managers as<br />
part of the Quality<br />
Sourcing Initiative. Even<br />
at this early stage, it is<br />
clear that there is a<br />
strong demand from<br />
local authorities for<br />
more intensive expert<br />
advice and support to<br />
assist them in devising<br />
and implementing<br />
successful kerbside<br />
collection programmes.<br />
● The role of the KTF is<br />
advisory but it would<br />
work alongside the rollout<br />
of the Challenge<br />
Fund and other<br />
government initiatives.<br />
£7 million over 3 years.<br />
● The KTF would be<br />
available to local<br />
authorities for up to 30<br />
person days/year on an<br />
application basis.<br />
● Criteria would be<br />
developed for provision<br />
of support, based on<br />
local authority need,<br />
current performance,<br />
likely resources<br />
available to them and<br />
potential tonnages<br />
recycled/composted to<br />
secure maximum<br />
leverage in raising<br />
recycling/composting<br />
rates.<br />
STRATEGIC INVESTMENT MEASURES<br />
91
WASTE NOT, WANT NOT<br />
Figure 17: Two Investment Measures to Expand Recycling and Composting (continued)<br />
Measure Aims Rationale Estimated Cost Benefit/impact<br />
2. Expansion of markets –<br />
priority on organics<br />
WRAP has developed an<br />
outline Organics Material<br />
Programme, key elements<br />
of which are:<br />
● capital competition for<br />
investment support for<br />
additional, large scale<br />
primary processing<br />
capacity;<br />
● Business Development<br />
initiative for smaller-scale<br />
emerging composting<br />
businesses;<br />
● continued development of<br />
Compost Standards to<br />
underpin expansion of<br />
end-markets for composted<br />
products;<br />
● marketing and product<br />
development activities with<br />
the landscaping and<br />
horticultural sectors.<br />
● To double the market<br />
share of compost into<br />
landscaping and<br />
horticultural markets by<br />
2006;<br />
● increase by 17% the<br />
utilisation of compost<br />
in agriculture;<br />
● 30 new business startups<br />
in composting.<br />
● A broad cross-section of<br />
WRAP stakeholders<br />
have repeatedly argued<br />
for a specific<br />
programme to address<br />
organics issues.<br />
● Organic collection<br />
systems and the link<br />
with home composting<br />
will be a vital<br />
component in reducing<br />
biodegradable material<br />
sent to landfill.<br />
● There would be a<br />
strong link to best<br />
practice activity in<br />
collection – the<br />
Kerbside Taskforce (see<br />
above).<br />
£36 million over 3 years.<br />
● 1 million tonnes per<br />
annum additional<br />
compost produced<br />
from local authority<br />
organics collections.<br />
92
Recommendation 17:<br />
WRAP should take forward two measures to<br />
increase recycling and composting through<br />
the provision of advice to local authorities<br />
on kerbside collection infrastructure and<br />
support for the expansion of markets in<br />
recyclable materials.<br />
Priority 3: improving the<br />
information and advice<br />
available to households and<br />
industry<br />
Households: what’s needed?<br />
1. a national programme to raise public<br />
awareness of waste issues, building on the<br />
‘Rethink Rubbish’ brand used by NWAI; and<br />
2. a series of issue-specific programmes to support<br />
the related programme activity in waste<br />
minimisation and kerbside recycling at local<br />
level (set out in recommendations 16 and 17).<br />
7.17 Good practice from other countries<br />
indicates a significant level of spend per capita<br />
on waste awareness would offer good value for<br />
money in support of government objectives for<br />
waste. For example, Canada spends the<br />
equivalent of about 45 pence per household per<br />
year. A well-designed campaign is estimated to<br />
cost £30m over 3 years.<br />
7.14 The level of awareness of waste in the UK<br />
is very low. As <strong>not</strong>ed in Chapter 4, a recent<br />
MORI survey found that only 7% of<br />
respondents saw waste as a key environmental<br />
issue unless prompted. However, 94% said they<br />
were concerned about the disposal of society’s<br />
waste. 126 It also demonstrated that there were<br />
many misconceptions about waste, and that if<br />
the facts were explained to them, people would<br />
be more receptive to various waste measures<br />
that they would <strong>not</strong> intuitively accept.<br />
7.15 Many national campaigns have already<br />
been led by the National <strong>Waste</strong> Awareness<br />
Initiative (NWAI). However, awareness of waste<br />
remains low so it is <strong>not</strong> clear that a further<br />
large-scale generic campaign would in itself be<br />
effective. There is a stronger case for continuing<br />
education and awareness through more<br />
targeted and focused practical messages in<br />
parallel with the roll-out of specific schemes and<br />
programmes.<br />
7.16 To support the strategy recommended in<br />
this report and to tackle awareness and<br />
attitudes – one of the key identifiable barriers<br />
set out in chapter 4 – it is recommended that<br />
two measures are taken forward:<br />
126<br />
MORI research report for SU: www.strategy.gov.uk/2002/waste/downloads/mori.pdf<br />
127<br />
WRAP Delivery Plans, 11 October 2002<br />
Households: what could it achieve?<br />
7.18 It is difficult to assess the direct impact of<br />
educational programmes, as the effects are<br />
generally combined with other policy changes.<br />
For example, the <strong>Waste</strong>Watch campaign to<br />
promote garden waste collection raised<br />
recycling rates by up to 10% and the Rethink<br />
Rubbish road show increased paper recycling by<br />
9%. In order to achieve maximum impact, each<br />
education/awareness activity will need to ensure<br />
that: 127<br />
●<br />
●<br />
●<br />
key audiences are identified and clearly<br />
understood;<br />
messages are clearly defined, taking account<br />
of lessons from past awareness programmes;<br />
and<br />
monitoring and evaluation of impacts is<br />
comprehensive and sustained with<br />
appropriate feedback to programme design.<br />
Recommendation 18:<br />
WRAP should promote education and<br />
awareness of waste issues through a<br />
programme of national and targeted local<br />
or issue-specific campaigns related to waste<br />
minimisation and recycling.<br />
STRATEGIC INVESTMENT MEASURES<br />
93
Industry: what’s needed?<br />
7.19 Since around 50% of waste is generated<br />
during the production process, 128 effective<br />
action at this stage can have major impacts on<br />
waste volumes. The ways in which industry can<br />
reduce waste are shown in Box 28:<br />
Box 28: Producers, retailers and waste reduction<br />
●<br />
●<br />
●<br />
●<br />
●<br />
more efficient use of raw materials and leaner production processes;<br />
eco-design to ensure products are more recyclable and friendlier to the environment;<br />
design for upgradeability/ease of repair where practicable;<br />
taking more responsibility for their products e.g. through producer responsibility obligations<br />
(whether statutory or voluntary) – which is progressing as a part of EU legislation; and<br />
reduction in the packaging/waste passed on to households.<br />
7.20 Some of these are already being<br />
progressed, but the need for an overarching<br />
source of information for industry has already<br />
been recognised through the creation of<br />
Envirowise. Envirowise has been successful in<br />
helping businesses to reduce costs through<br />
waste minimisation measures (Box 29).<br />
Box 29: Envirowise<br />
Envirowise is a government sponsored programme that offers free, independent advice to<br />
industry on minimising waste, and adopting cleaner, cost efficient technologies to transform<br />
turnover into profit, and reduce reliance on landfill through more sustainable waste<br />
management. The programme achieves this through the provision of sector tailored tools<br />
(including seminars, case studies, guides, a web site and a Helpline).<br />
Envirowise has a target of helping companies to save £10 per year for every £1 of programme<br />
expenditure. Research has shown that industrial companies can typically save about £1,000 per<br />
employee through waste minimisation programmes. By 31 December 2001, Envirowise had<br />
achieved total cost savings to UK industry approaching £180 million.<br />
Examples of the support Envirowise gives businesses include:<br />
Example 1:<br />
WASTE NOT, WANT NOT<br />
Service Business Forms Ltd employs 32 people and designs and prints business stationery. It<br />
decided to join the West Midlands <strong>Waste</strong> Minimisation Project. A team of employees investigated<br />
how to reduce paper use and waste during major product runs. They identified ways to reduce<br />
the amount of virgin paper being used and the waste going to landfill. Implementing the<br />
findings reduced the amount of paper used by 21 tonnes per year. This reduction in waste saves<br />
the company £24,000 per year. [Envirowise Case Study CH116 Process Improvements Reduce<br />
Paper <strong>Waste</strong>.]<br />
128<br />
Robin Murray – Zero <strong>Waste</strong> – Greenpeace Environmental Trust<br />
94
Box 29: Envirowise (continued)<br />
Example 2:<br />
Some wastes are unavoidable but can be recovered to be re-used on site. The Electronic Controls<br />
Division of Stadium plc employs 180 people and manufactures electronic assemblies and<br />
injection moulded plastics. Stadium became concerned about the high cost of new solder<br />
needed to replace that lost in dross. They tested on-site solder recovery and found that the<br />
recovered solder met their specifications. They now recover 3600kg of solder from their waste<br />
dross and are saving £11,500 per year in avoided purchase costs. [Envirowise Case Study CS319<br />
Solder and Cost Recovery from Dross.]<br />
Example 3:<br />
One way of reducing waste is to reduce the amount of material in a product, so there is less to<br />
dispose of when it is finally discarded. Fulleon Ltd is a leading supplier of elements for fire alarm<br />
systems, employing 170 people in South Wales. In March 1999, Fulleon decided to redesign its<br />
‘break-glass’ call point product. A cross-functional design team was set up to look at all aspects<br />
of the product design. The new design has reduced the number of parts from 17 to 11 and<br />
reduced plastic consumption by 27%. It is also quicker to manufacture and assemble.<br />
Manufacturing costs have been reduced by £92,000 per year, with a payback period of just over<br />
a year. The new design was also the first product to gain certification to a new European<br />
standard for manual fire alarm call points. [Envirowise Case Study CS326 Product Redesign Cuts<br />
Materials and Costs.]<br />
Further details about Envirowise are available on their web site: www.envirowise.org.uk<br />
7.21 However, while Envirowise has reached up<br />
to 90% of companies in the areas where it has<br />
concentrated, only about 5% of UK companies<br />
are aware of the programme. The impact of<br />
Envirowise could be increased by expanding<br />
awareness (and hence use) of the programme,<br />
possibly through targeted marketing campaigns<br />
directed at companies with more than 10<br />
employees. Envirowise estimate that awareness<br />
of the programme amongst companies could<br />
be increased to at least 20% within two years.<br />
Increasing the regional focus of Envirowise<br />
through closer links with the RDAs, Business<br />
Links and Local Enterprise Councils would also<br />
help raise the programme’s profile. An increase<br />
in resources would allow Envirowise to offer<br />
more individual support to companies; to play a<br />
larger role in skills enhancement in the<br />
workforce; and to offer better support to waste<br />
minimisation clubs. It might also enable<br />
Envirowise to expand coverage to other sectors<br />
including agriculture and construction.<br />
Industry: what could it achieve?<br />
7.22 It would be feasible to extend Envirowise’s<br />
coverage to up to 20% of all UK companies.<br />
This would help improve business efficiency and<br />
reduce waste arisings with consequent<br />
economic and environmental benefits.<br />
Recommendation 19:<br />
The role of Envirowise should be expanded<br />
so its coverage is extended to 20% of UK<br />
companies over the next 2 years.<br />
STRATEGIC INVESTMENT MEASURES<br />
95
Priority 4: improving the<br />
research and data available to<br />
government, local authorities<br />
and the waste industry<br />
What’s needed?<br />
7.23 Chapter 4 set out the key research and<br />
data gaps. Some of these gaps will be filled by:<br />
●<br />
●<br />
design specific policy interventions; and<br />
understand the role that waste plays in the<br />
economy and how it is integrated with other<br />
policy areas.<br />
Recommendation 20:<br />
DEFRA and the Environment Agency should<br />
jointly draw up a data and research strategy<br />
for the next three years to identify and fill<br />
key data and analytical gaps<br />
WASTE NOT, WANT NOT<br />
●<br />
●<br />
a forthcoming review of the Municipal <strong>Waste</strong><br />
Management Survey by DEFRA;<br />
a forthcoming National Household <strong>Waste</strong><br />
analysis programme by the EA. This will<br />
provide information for local authorities on<br />
the biodegradable content of municipal<br />
waste and the household behaviours that<br />
influence recycling.<br />
7.24 As part of its regulatory role, the EA has<br />
responsibility for the collection of data for<br />
monitoring purposes. It also puts the EA in a<br />
strong position to lead on major areas of data<br />
collection and in the co-ordination of research.<br />
In carrying out this role, the EA should:<br />
●<br />
●<br />
●<br />
be resourced with the right mix and level of<br />
skilled statisticians and analysts;<br />
be able to liaise effectively with other major<br />
users of data, namely government<br />
departments; and<br />
disseminate available data, and lead<br />
discussion and peer review on major pieces<br />
of data and research in consultation with<br />
DEFRA.<br />
What could it achieve?<br />
7.25 Good quality data on waste is vital to:<br />
●<br />
●<br />
formulate strategy;<br />
monitor and evaluate performance of the<br />
strategy;<br />
129<br />
See Annex G<br />
Priority 5: promoting new<br />
technologies<br />
What’s needed?<br />
130<br />
McLanaghan (2002) www.strategy.gov.uk/2002/waste/downloads/technologies.pdf<br />
7.26 As landfill diminishes in importance, and if<br />
the development of incineration continues to<br />
make slow but steady progress, new options will<br />
need to be developed and tested in the<br />
medium term for dealing with residual waste.<br />
Several alternative technologies are already<br />
employed in other countries but have yet to be<br />
introduced into the UK. For example, MBT is<br />
used extensively in Germany and Austria but its<br />
introduction in the UK is recent and as yet on a<br />
small scale. Advantages of the MBT process 129<br />
include:<br />
●<br />
●<br />
●<br />
reducing the volume of waste and therefore<br />
the landfill void space taken and the cost to<br />
the local authority of disposal;<br />
reducing the biodegradable element of waste<br />
and therefore the production of methane; and<br />
enabling good quality metals to be recovered<br />
for recycling.<br />
7.27 The SU commissioned a comprehensive<br />
survey 130 of new and emerging technologies to<br />
assess the current state of development and<br />
potential deployment of alternative<br />
technologies. This also looked at existing<br />
technology, including incineration. Figure 18<br />
gives a simple guide to the options.<br />
96
7.28 The Government needs to ensure that<br />
there is an economic environment that provides<br />
adequate incentives for the development and<br />
take-up of these new technologies both to<br />
provide more alternatives to landfill for<br />
managing residual waste, and to offer England a<br />
wider variety of waste management options for<br />
the future.<br />
7.29 However, there are a number of potential<br />
barriers to the take-up and development of new<br />
technologies:<br />
●<br />
higher costs relative to landfill;<br />
What could it achieve?<br />
7.33 New technology opens up potentially<br />
cheaper and/or cleaner ways of managing<br />
waste.<br />
Recommendation 21:<br />
DEFRA and DTI should take forward a<br />
programme of advice on and development of<br />
new technologies including pilots for more<br />
innovative waste management practices in<br />
partnership with industry and local<br />
authorities.<br />
●<br />
●<br />
local authority purchasing rules; and<br />
risk aversion.<br />
7.30 Some of these barriers can be addressed<br />
through other recommendations in this report<br />
(e.g. a rise in landfill tax). The Government has<br />
a role in ensuring that there are no major<br />
barriers to development so that local authorities<br />
can have maximum freedom to develop the<br />
most appropriate waste management systems<br />
for their area.<br />
A Mechanical Biological Treatment (MBT) plant in Edmonton, Alberta, Canada<br />
– photo courtesy of Edmonton City Council, Alberta, Canada<br />
7.31 New technology development can be<br />
addressed in a number of ways to tackle the<br />
barriers set out above. These include:<br />
●<br />
●<br />
●<br />
financial support to reduce risks;<br />
pilot or demonstration projects; and<br />
co-ordinating or disseminating expertise and<br />
advice.<br />
7.32 The availability of EU funds to support<br />
new technology should be investigated. Other<br />
member states have funded small-scale capital<br />
investment in this way. Given the long lead<br />
times in planning and acquiring new capital,<br />
this should be taken forward immediately by<br />
DEFRA and DTI.<br />
STRATEGIC INVESTMENT MEASURES<br />
97
WASTE NOT, WANT NOT<br />
Figure 18: Summary Review of Available and Developing Technologies for Municipal Solid <strong>Waste</strong> (MSW) Management<br />
<strong>Waste</strong> Description & Economics Design to Biodegradable Municipal Environmental<br />
Management development commissioning <strong>Waste</strong> (BMW) diversion role and health issues<br />
Technology status timescales and environmental benefits<br />
Landfill<br />
containment and<br />
stabilisation – employs<br />
proven technology<br />
UK landfill tax low. Siteengineering<br />
&<br />
conditioning plan<br />
requirements raising costs<br />
substantial consented UK<br />
void space, problems in<br />
some areas<br />
no direct role – indirect from<br />
methane combustion. Future<br />
need will increasingly focus on<br />
MSW reprocessing residues<br />
concerns: health effects<br />
& vehicle movements.<br />
Sub-optimal resource<br />
recovery option<br />
BIOLOGICAL<br />
Composting<br />
aerobic degradation of<br />
organic material –<br />
commercially developed<br />
low-medium cost.<br />
Windrow technology<br />
exhibits clear economies.<br />
In-vessel technology is<br />
more modular<br />
plants designed today<br />
should be on-stream by<br />
2006-10<br />
potentially significant role –<br />
returns biomass and nutrients<br />
to soil, reduces soil erosion,<br />
acts as a carbon sink and<br />
displaces natural peat &<br />
manufactured soil conditioners<br />
concerns: Animal By-<br />
Products crosscontamination<br />
issues,<br />
odours and vehicle<br />
movements<br />
Anaerobic Digestion<br />
biological process in the<br />
absence of oxygen. Whilst,<br />
trialed, <strong>not</strong> yet<br />
commercially proven in<br />
the UK on MSW<br />
low-medium cost. Plant is<br />
somewhat modular<br />
requiring step-change for<br />
capacity increase<br />
with right incentives,<br />
could be on-stream by<br />
2006-10, subject to<br />
securing planning<br />
potentially significant role –<br />
returns nutrients to soil,<br />
displacing manufactured<br />
fertilizers, acts as a carbon sink<br />
and produces a renewable<br />
energy<br />
concerns: likely to mirror<br />
those for composting.<br />
Renewable bio-gas offers<br />
CO 2<br />
neutral combustion<br />
Ethanol production<br />
waste fermentation<br />
followed by distillation.<br />
Commercially proven in<br />
non-MSW applications<br />
medium-high cost. First<br />
commercial MSW plant<br />
under construction – may<br />
become a test-bed<br />
<strong>not</strong> as yet known where<br />
MSW is concerned –<br />
probably similar to process<br />
engineering facilities<br />
potentially significant role –<br />
ethanol is a renewable energy<br />
source which can be used in<br />
existing hydrocarbon<br />
infrastructure, resulting in CO 2<br />
neutral combustion<br />
public concerns likely to<br />
mirror those for any<br />
process engineering<br />
facility, or as per<br />
composting<br />
98
Figure 18: Summary Review of Available and Developing Technologies for Municipal Solid <strong>Waste</strong> (MSW) Management<br />
(continued)<br />
<strong>Waste</strong> Description & Economics Design to Biodegradable Municipal Environmental<br />
Management development commissioning <strong>Waste</strong> (BMW) diversion role and health issues<br />
Technology status timescales and environmental benefits<br />
THERMAL<br />
Mass-burn<br />
Incineration (MBI)<br />
controlled combustion<br />
process – most developed<br />
waste treatment<br />
technology<br />
significant economies with<br />
larger plant sizes<br />
unpopularity resulting in<br />
long lead-times. Plants at<br />
design stage today are<br />
unlikely to meet 2006-10<br />
target date<br />
full bio-stabilisation,<br />
potentially significant role for<br />
residual BMW. Maximises<br />
overall recycling rates from<br />
residual MSW. Energy recovery<br />
(heat &/or power)<br />
concerns: dioxins & local<br />
air quality deterioration<br />
(driven by poor<br />
perception), visual<br />
intrusion & vehicle<br />
movements<br />
Advanced Thermal<br />
Treatment<br />
(ATT)<br />
partial conversion of waste<br />
into intermediaries.<br />
Relatively unproven<br />
worldwide on non-uniform<br />
waste. UK pilots in<br />
progress<br />
difficult to extrapolate<br />
from pilot plants.<br />
Currently expensive<br />
without wider (economic)<br />
incentives<br />
probable more limited<br />
contribution to residual<br />
BMW streams this side of<br />
2006-10<br />
full bio-stabilisation,<br />
potentially significant role for<br />
residual BMW. Maximises<br />
overall recycling rates from<br />
residual MSW. Energy recovery<br />
(heat &/or power)<br />
initial public concerns<br />
likely to mirror those for<br />
mass-burn incineration<br />
HYBRID<br />
Mechanical-Bio<br />
Treatment (MBT)<br />
ranging from bio-stabilised<br />
followed by landfill,<br />
through to more complex<br />
options. Proven: UK testbed<br />
in progress<br />
considerable economies<br />
envisaged on larger plants<br />
use of residue for energy<br />
recovery – or landfilled –<br />
could have an impact on<br />
overall timescales<br />
provides bio-stabilisation &<br />
bulk reduction. Assists in<br />
maximizing overall recycling<br />
rates from residual MSW. Use<br />
of residue for energy recovery<br />
concerns: bio-aerosols and<br />
odours, vehicle<br />
movements<br />
MECHANICAL<br />
Clean Material<br />
Recovery Facility<br />
(MRF)<br />
processing option:<br />
separates clean co-mingled<br />
recyclates. Commercially<br />
proven in UK<br />
considerable economies<br />
can result from increased<br />
plant size<br />
probably easiest waste<br />
management facilities to<br />
secure planning<br />
permission<br />
no direct BMW diversion role –<br />
but offers an important<br />
material processing/bulking<br />
role<br />
concerns: perception of<br />
dirty MRFs equating to<br />
poor standards, vehicle<br />
movements<br />
Source: McLanaghan Dr S. Delivering the Landfill Directive: The role of new and emerging technologies<br />
STRATEGIC INVESTMENT MEASURES<br />
99
8. Funding and Delivery<br />
Summary<br />
Spending Review 2002 announced additional resources for waste. There<br />
is also potential for getting better value for money from existing sources<br />
of funding and to contain or reduce costs through investment and better<br />
management.<br />
New funding and investment needs to be accompanied by reform of<br />
delivery structures.<br />
Roles, responsibilities and accountabilities need to be clear and ensure<br />
maximum coherence between central policy-making and delivery at local<br />
level.<br />
It is recommended that:<br />
●<br />
●<br />
●<br />
●<br />
co-ordination of waste policy at national level should be improved by<br />
strengthening the policymaking, technical, legal and other resources<br />
available to DEFRA;<br />
WRAP’s role should be expanded so it can take on delivery of key<br />
elements of the investment package to reduce waste volumes and<br />
increase recycling and the education packages that go with this;<br />
delivery at local level should be strengthened by the creation of a<br />
taskforce to help local authorities gain access to best practice<br />
methods e.g. in contracting with the waste industry; and<br />
local authorities should be encouraged to work more effectively with<br />
each other and with waste companies and community groups.<br />
WASTE NOT, WANT NOT<br />
100
The future costs of managing<br />
England’s rising volume of<br />
household waste are very<br />
uncertain but clearly subject to<br />
upward pressure<br />
8.1 Local authorities in England are estimated<br />
to spend around £1.6 billion each year on waste<br />
collection and disposal services. 131 This is largely<br />
spent through contracts with the private sector<br />
and, as set out earlier in this report, is<br />
dominated by disposal of waste at landfill sites.<br />
If policies remain unchanged, this expenditure<br />
will double over the next twenty years as a<br />
result of rising waste volumes.<br />
Various commentators and analysts have<br />
attempted to estimate the cost to local<br />
authorities of meeting various targets over the<br />
medium term. These are shown in Box 30.<br />
Box 30: The cost of reducing reliance on landfill<br />
Ernst and Young(a) have estimated that additional investment of £600-700m per annum over<br />
the next 10 years will be required to reduce the volume of waste sent to landfill, sufficient to<br />
meet the Article 5 targets of the EU Landfill Directive.<br />
A County Surveyor’s Society(b) report has estimated future costs of waste management in<br />
the medium and long term. This analysis concluded that local authority expenditure might have<br />
to increase by 60% compared to 2001 in order to meet the 2005 Best Value recycling targets<br />
(25% of household waste recycled and composted by 2005) and by over 100% by 2013.<br />
<strong>Waste</strong> Strategy 2000(c) estimated the additional costs over a baseline of different mixes of<br />
waste management options to meet the <strong>Waste</strong> Strategy targets. These ranged from £3.4 billion<br />
to £7.7 billion in present value terms.<br />
(a) Ernst and Young Local Authority <strong>Waste</strong> Management Survey, 2001<br />
(b) AEA Technology <strong>Waste</strong> Strategy Compliance Costs – Phase II, 2002<br />
(c) DETR, <strong>Waste</strong> Strategy 2000, Part 2<br />
8.2 Predicting the future cost of waste<br />
8.3 The least value for money option is making<br />
management is, of course, highly dependent on no change. Environmental damage will continue<br />
the assumptions made. The SU estimates that and potentially valuable resources will continue<br />
the cost of implementing the strategy set out in to be squandered. The costs of managing the<br />
this report would <strong>not</strong> be significantly different municipal waste stream will double by 2020,<br />
from doing <strong>not</strong>hing over the 18 years to 2020 – the UK could face fines from the EU for failing<br />
less than £3 billion more in present value terms: to meet its international obligations, and more<br />
£26.7 billion versus £29.6 billion. 132 landfill sites and incinerators will be required.<br />
131<br />
Estimated. Latest out-turn figure is £1.5 billion in 2000/01, CIPFA<br />
132<br />
SU analysis. These figures differ slightly from those presented in Figure 10 in chapter 5 and result from incorporating more<br />
information into the analysis of ‘status quo’ and the package of SU recommendations<br />
FUNDING AND DELIVERY<br />
101
WASTE NOT, WANT NOT<br />
102<br />
Pressures for increased<br />
spending on managing and<br />
disposing of household waste<br />
can, in part, be dealt with by<br />
making better use of existing<br />
resources<br />
8.4 There are currently five main funding routes<br />
for waste management. It is important that best<br />
use is made of each.<br />
1. Local Government Standard<br />
Spending Assessments: the EPCS<br />
block<br />
8.5 The main source of funding for local<br />
authority waste services is through the<br />
Environmental Protection and Cultural Services<br />
(EPCS) Standard Spending Assessment (SSA).<br />
This SSA is <strong>not</strong> a limit on local authority<br />
expenditure on these services, but is the means<br />
by which government distributes resources to<br />
local authorities.<br />
8.6 The EPCS SSA provides for a wide range of<br />
local authority services including libraries, local<br />
transport and flood defence, as well as waste. In<br />
total, the provision for the block is:<br />
2002/3 2003/4 2004/5 2005/6<br />
£8,961m £9,435m £9,703m £10,024m<br />
8.7 This provision includes the following<br />
increases announced in the Spending Review<br />
2002.<br />
2003/4 2004/5 2005/6<br />
£82m £350m £671m<br />
8.8 Provision for waste services is <strong>not</strong> separately<br />
identified within the total.<br />
2. The <strong>Waste</strong> Minimisation and<br />
Recycling Fund: “The Challenge<br />
Fund”<br />
8.9 Announced as part of the 2000 Spending<br />
Review, this Challenge Fund is designed to<br />
support better waste management practices<br />
including waste minimisation, re-use and<br />
recycling. In November 2001, DEFRA consulted<br />
local authorities and other interested parties on<br />
the distribution of £140m available to the fund<br />
in England.<br />
8.10 For 2003/4 a total of £76.3m will be<br />
available for projects. An expert panel evaluates<br />
the bids. Project categories include:<br />
●<br />
●<br />
●<br />
●<br />
●<br />
partnership working;<br />
turning around low performance;<br />
high performance innovation and best<br />
practice;<br />
developing community initiatives; and<br />
general projects<br />
8.11 Whilst this scheme has <strong>not</strong> been without<br />
its problems, <strong>not</strong>ably allocation of funds for<br />
2002/3, it remains an important means of<br />
providing support for waste management.<br />
Efforts need to be made to ensure that sufficient<br />
weighting is given to waste minimisation<br />
projects as well as recycling projects. Building<br />
on the challenge elements in the fund,<br />
consideration should be give to open up some<br />
of these funds to the private sector to tackle<br />
municipal waste.<br />
Recommendation 22:<br />
The Challenge Fund should be retained with<br />
consideration given to opening up the fund<br />
to bids from the private sector either<br />
independently or in partnership with local<br />
authorities to tackle municipal waste.
3. The Private Finance Initiative (PFI)<br />
8.12 PFI is one of the mechanisms through<br />
which local government funds investment in<br />
waste services and improves the value for<br />
money that they get from existing expenditure.<br />
To date, 5 waste PFI projects have been signed<br />
and a further 5 are in procurement.<br />
8.13 <strong>Waste</strong> PFI projects in the past tended to<br />
focus on funding incineration projects. In<br />
September 2000, DEFRA re-issued the criteria<br />
that they use in selecting PFI projects. These<br />
criteria placed much greater emphasis on<br />
recycling than had been the case in the past<br />
and required that any new incineration<br />
proposals demonstrated that they did <strong>not</strong><br />
crowd out recycling. Since the waste PFI criteria<br />
were revised in September 2000, DEFRA has<br />
approved two further applications with a value<br />
of £62m that will provide infrastructure for local<br />
recycling.<br />
4. The Landfill Tax Credit Scheme<br />
(LTCS)<br />
8.16 Under the LTCS, registered landfill site<br />
operators may allocate up to 20% of their<br />
landfill tax liability for the year to fund approved<br />
environmental projects. Not more than 90% of<br />
the costs of these projects may be met by this<br />
funding; the remainder of the cost must be<br />
funded from other sources. These projects are<br />
administered through environmental bodies<br />
approved by ENTRUST, the private sector<br />
regulator of the LTCS. Some £400m from the<br />
scheme has so far contributed to environmental<br />
projects.<br />
8.17 The scheme has <strong>not</strong> been without<br />
criticism. 133 This has centred on its complexity,<br />
the potential for fraud or conflicts of interest,<br />
whether the waste industry has too much<br />
influence over the scheme and poor<br />
arrangements for evaluating outcomes.<br />
8.14 Government has increased the resources 8.18 The current target of directing 65% of<br />
provided for waste PFI projects in recent years. LTCS funds specifically to waste projects is being<br />
Spending Review 2002 provided PFI credits of met, but without reference to strategic<br />
£355m for waste PFI projects from 2003/4 to objectives or value for money. There are also<br />
2005/06.<br />
concerns over transparency. In April 2002,<br />
DEFRA and HM Treasury published a<br />
8.15 The interpretation of the September 2000<br />
consultation document outlining possible<br />
criteria and the need to adapt projects that<br />
changes to the LTCS. These ranged from<br />
were in development at the time, has meant a<br />
retaining the scheme as it currently exists to its<br />
slow throughput of projects to procurement<br />
replacement in whole or in part by public<br />
and some uncertainty in the market. DEFRA also<br />
spending. Whilst there was a considerable<br />
underestimated the resources that were needed<br />
degree of support for retaining the current<br />
to fully implement the September 2000 criteria<br />
scheme (over 80% of respondents) there was<br />
and to develop waste PFI solutions. Recognising<br />
also support for a more strategic approach to<br />
this, DEFRA have now set up a <strong>Waste</strong> PFI<br />
sustainable waste management objectives.<br />
delivery panel of key central and local<br />
government interests to consider in detail what Recommendation 24:<br />
can be done to improve the flow of PFI projects. The LTCS should be reformed to adopt a<br />
more strategic approach to waste. This could<br />
Recommendation 23:<br />
be done by transferring around two-thirds of<br />
DEFRA should accelerate the current<br />
current funds into a public expenditure<br />
programme of work to improve delivery of<br />
waste PFI projects.<br />
133<br />
See for example Landfill Tax Credit Scheme – House of Commons Public Accounts Committee 47th report. Also Financial Times,<br />
25 July 2002 – Landfill Tax Credit Scheme Lacks Accountability<br />
FUNDING AND DELIVERY<br />
103
scheme to tackle priority areas for<br />
investment in waste management. One third<br />
of funds should remain under the current<br />
scheme.<br />
8.19 Five priority areas for investment in waste<br />
are set out in chapter 7, together with details of<br />
how these can be taken forward and their<br />
expected outcomes. The five areas cover:<br />
I. reduction in the rate of growth in waste<br />
volumes;<br />
II. expansion and development of collection<br />
systems and markets for recycling;<br />
III.provision of better information and advice to<br />
households and business;<br />
IV.improvement in the quality and range of<br />
data and research on waste; and<br />
V. promotion of new technologies and<br />
approaches to waste management.<br />
5. New Opportunities Fund (NOF)<br />
8.20 The current round of the New<br />
Opportunities Fund (lottery funds) will provide<br />
£38.7m for England for community sector<br />
waste re-use, recycling and composting<br />
projects. The directions for the programme<br />
were agreed 18 months ago. These funds are<br />
likely to be committed by 2003/4.<br />
8.21 The community sector plays an<br />
increasingly important role in waste<br />
management at a local level. There are several<br />
hundred <strong>not</strong>-for-profit SMEs and many more<br />
voluntary groups and societies operating 1.2<br />
million household kerbside collections.<br />
New investment and better<br />
management could also help<br />
to reduce the costs of<br />
managing and disposing of<br />
waste<br />
8.22 Ways in which the costs of managing and<br />
disposing of waste could be reduced include:<br />
1. Reducing the volume of waste<br />
produced<br />
The recommendations in this report that will<br />
contribute to reducing waste growth and<br />
associated expenditure are:<br />
● the waste minimisation programme led by<br />
WRAP (recommendation 16);<br />
● producer responsibility initiatives<br />
(recommendation 2); and<br />
● introducing greater incentives for<br />
households to curtail the waste they<br />
produce (recommendation 1).<br />
2. Reducing the unit costs of<br />
recycling and composting through<br />
market expansion and development<br />
In broad terms, a doubling in volumes<br />
handled by the recycling industry could<br />
reduce unit costs by around 15%. 134 The<br />
recommendations in this report that will<br />
contribute to reducing unit costs are:<br />
● advice on best practice kerbside collections,<br />
led by WRAP (recommendation 17);<br />
● expanding the markets for compost and<br />
recyclates, led by WRAP (recommendation<br />
17); and<br />
WASTE NOT, WANT NOT<br />
134<br />
SU analysis of segregated kerbside collections based on research by J Hummel<br />
● more bring and better designed civic<br />
amenity sites (recommendation 17).<br />
104
3. Improving local service delivery<br />
Local authorities can reduce costs by:<br />
● looking carefully at the efficiency of<br />
different collection systems; and<br />
● introducing a charging mechanism, e.g. at<br />
civic amenity sites, where small businesses<br />
use the service and contribute to the<br />
municipal waste stream.<br />
Any increase in landfill tax<br />
revenue could provide vital<br />
funding for new investment<br />
8.23 A rise in landfill tax to £35 a tonne,<br />
discussed under recommendation 11, would<br />
raise a significant revenue stream. The proceeds<br />
could be redirected back to local authorities and<br />
business (including, for example, Envirowise)<br />
and used to promote investment in alternative<br />
methods of waste management.<br />
8.24 For business, this should minimise any<br />
upward pressure on business costs and ensure<br />
that competitiveness is <strong>not</strong> undermined. For<br />
local authorities it could support investment in<br />
new infrastructure and collection systems that<br />
are vital to realising the strategy laid out in this<br />
report.<br />
Recommendation 25:<br />
HMT, DEFRA and other government<br />
departments should consider how tax<br />
revenues might best be redirected to<br />
incentivise investment in reduction, re-use<br />
and recycling.<br />
New funding and new<br />
investment need to be<br />
accompanied by reform of<br />
delivery structures<br />
8.25 If more resources are to be spent on<br />
waste, then delivery structures must be<br />
reformed to ensure outcomes are delivered<br />
efficiently and progress is made in line with the<br />
strategy. It is clear that lack of delivery over a<br />
number of strategies and administrations 135 is<br />
due in part to the complex structure of<br />
government responsibility for waste policy and<br />
waste services.<br />
A potential framework for<br />
delivery<br />
8.26 The essential elements of an effective<br />
delivery framework are shown in Figure 19. This<br />
framework aims to:<br />
●<br />
●<br />
●<br />
●<br />
take forward the SU strategy;<br />
facilitate improved LA performance;<br />
co-ordinate funding more effectively; and<br />
boost the take up of wider options for waste<br />
management.<br />
8.27 The remainder of this chapter summarises<br />
the framework and then describes each element<br />
and the associated recommendations. A more<br />
detailed version of required delivery structures<br />
has been developed jointly by DEFRA and the<br />
Delivery Unit. This is available on the SU web<br />
site as Annex K.<br />
135<br />
At least since This Common Inheritance op.cit 1990<br />
FUNDING AND DELIVERY<br />
105
Figure 19: A new framework for the delivery of waste policy and waste services<br />
Strategy/Advice/Performance<br />
Delivery<br />
Steering Group<br />
– reports to S of S;<br />
– monitors progress of DEFRA/<br />
task force in delivering<br />
the strategy;<br />
– members include DTI, HMT,<br />
DU, LGA, <strong>Waste</strong> Industry,<br />
academics<br />
S of S<br />
DEFRA<br />
Operational Taskforce<br />
– help and advise LA’s on plans<br />
and contracts;<br />
– members include experts and<br />
specialists drawn from<br />
industry and LAs<br />
DEFRA<br />
– strengthened policy arm;<br />
– foresight function;<br />
– delivery planning and overall<br />
responsibility for delivery;<br />
– management and co-ordination<br />
of funds for LAs for waste<br />
infrastructure;<br />
– co-ordination of technology<br />
pilots;<br />
– dissemination of policy via<br />
Taskforce to LAs.<br />
Local Government<br />
– work with operational<br />
taskforce to produce<br />
sound plans and<br />
contracts;<br />
– advice from WRAP on<br />
waste reduction and<br />
kerbside recycling;<br />
– incentives to work in<br />
partnership on<br />
performance<br />
monitoring and<br />
intervention for poor<br />
performance.<br />
DEFRA/DTI<br />
– Industry forum<br />
– Hazardous <strong>Waste</strong> forum<br />
– Wider wastes<br />
WRAP<br />
Expanded role<br />
covering:<br />
– reduction<br />
– re-use<br />
– recycling<br />
Envirowise and Industry<br />
WASTE NOT, WANT NOT<br />
106
8.28 In summary, the main features of the<br />
structure are:<br />
For improved strategy and policy:<br />
●<br />
a strengthened role for DEFRA<br />
For improved delivery on the ground:<br />
●<br />
●<br />
●<br />
●<br />
●<br />
●<br />
an operational taskforce that helps local<br />
authorities to improve the effectiveness of<br />
their waste management and meet targets;<br />
an extended role for WRAP in waste<br />
minimisation, recycling and education and<br />
awareness;<br />
a new government-industry forum;<br />
an expanded role for Envirowise;<br />
incentives for local authorities to work<br />
together; and<br />
improving the planning process for waste<br />
facilities.<br />
For improved performance:<br />
●<br />
●<br />
a Steering Group reporting to the Secretary<br />
of State for DEFRA; and<br />
performance measures for local authorities.<br />
Improved strategy and policy<br />
8.29 DEFRA will need to be strengthened if it is<br />
to put more effort into policy dissemination,<br />
dialogue and delivery. The key responsibilities of<br />
DEFRA should be:<br />
●<br />
●<br />
policy-making on all waste issues;<br />
responsibility for negotiations in EU;<br />
8.30 In order to do this effectively, the waste<br />
function in DEFRA should have a dedicated policy<br />
unit, supported by a greater level of legal advice,<br />
a waste delivery unit and a team of technical<br />
experts. DEFRA should ensure that resources are<br />
fully available to support this function.<br />
8.31 This should help to achieve:<br />
●<br />
●<br />
●<br />
a more proactive approach to waste at the<br />
centre of government;<br />
more effective management of waste funds;<br />
and<br />
more timely implementation of directives.<br />
Recommendation 26:<br />
There should be a strengthening of waste<br />
policy-making, strategic planning, technical,<br />
legal and other services available to DEFRA.<br />
DEFRA should carry out a review to assess<br />
the scale of the resources required.<br />
8.32 Responsibility for responding to some EU<br />
waste directives is split between DTI and DEFRA,<br />
as both Departments have major interests.<br />
However, stakeholders outside government are<br />
sometimes confused about who leads and the<br />
respective roles of DEFRA, DTI and the EA in<br />
disseminating and interpreting waste policy.<br />
Recommendation 27:<br />
A review should be undertaken to assess the<br />
merits of focusing all waste policy in one<br />
Department.<br />
Improved delivery on the<br />
ground<br />
●<br />
●<br />
●<br />
foresight planning, specifically on upcoming<br />
waste issues and the direction of EU waste<br />
policy;<br />
dissemination of policy to stakeholders; and<br />
co-ordination of research into health effects<br />
of waste management options.<br />
A delivery task force<br />
8.33 There is wide variation in the skills of local<br />
authorities and their progress in developing<br />
waste plans. 136,137 If additional resources are to<br />
be directed to waste, well-developed waste<br />
plans that meet local needs and national targets<br />
136<br />
BIFFA, Future Perfect, (2002) and the Audit Commission, <strong>Waste</strong> Management Guidance for Improving Services (July 2001)<br />
137<br />
The Audit Commission, <strong>Waste</strong> Management Guidance for Improving Services (July 2001)<br />
FUNDING AND DELIVERY<br />
107
will be required and then translated effectively<br />
into contracts with industry and/or community<br />
groups.<br />
8.34 A taskforce comprising a mix of experts<br />
and specialists with practical experience of<br />
waste management, drawn from industry and<br />
local authorities, should be available to help<br />
local waste managers.<br />
minimisation, re-use and recycling alongside its<br />
existing focus on developing markets for<br />
recyclates.<br />
8.37 Key recommendations in this report<br />
(Chapter 7) have set out the need for<br />
investment in priority areas that WRAP should<br />
take forward working with local authorities. In<br />
summary its functions would therefore become:<br />
8.35 The main function of the taskforce would<br />
be to help local authorities to prepare sound<br />
plans for the investment in waste management<br />
infrastructure to meet national targets and local<br />
needs. This would include advice on contract<br />
design and negotiation. The taskforce would<br />
consist of a “nerve centre” in DEFRA and<br />
regional advisors and support specialists. Local<br />
authorities would be able to bid to DEFRA for<br />
taskforce time.<br />
●<br />
●<br />
●<br />
providing advice on reduction, re-use and<br />
recycling;<br />
taking forward the waste minimisation<br />
programme and kerbside collection<br />
programmes including the associated<br />
education/awareness programmes<br />
(recommendations 16 and 17);<br />
helping LAs evaluate household incentive<br />
schemes (recommendation 1); and<br />
WASTE NOT, WANT NOT<br />
108<br />
Recommendation 28:<br />
A delivery taskforce to fill the gap between<br />
national policy and local plans should be set<br />
up to work with delivery teams in DEFRA<br />
and local authorities. This taskforce should<br />
be staffed predominantly by experts with a<br />
proven track-record in delivering waste<br />
management in local authorities, the waste<br />
industry and community groups, drawing on<br />
the expertise of the EA as required. The<br />
taskforce should also provide advice on<br />
contracting, and set up a website of best<br />
practice advice and details of approved<br />
waste consultants. DEFRA should work up<br />
criteria to ensure the most effective<br />
allocation of taskforce time.<br />
An extended role for WRAP<br />
8.36 In the short time since it was set up, WRAP<br />
has proven to be a successful organisation,<br />
commanding a great deal of respect at all levels<br />
across the waste industry. Building on this, its<br />
role should be expanded to focus on waste<br />
●<br />
the co-ordination of national awareness<br />
campaigns on waste (recommendation 18).<br />
Recommendation 29:<br />
WRAP should be allocated additional<br />
funding to boost investment in waste<br />
reduction, re-use and recycling measures,<br />
as well as the development of recyclate<br />
markets.<br />
Working with industry<br />
8.38 A government-industry forum could<br />
provide a venue to discuss wider waste<br />
measures and producer responsibility issues, and<br />
help to bring various waste initiatives together.<br />
It could absorb the hazardous waste forum<br />
already set up by DEFRA.<br />
Recommendation 30:<br />
DEFRA/DTI, the Environmental Services<br />
Association, the Chartered Institution of<br />
<strong>Waste</strong>s Management and the CBI should set<br />
up a joint government-industry forum
An expanded role for Envirowise<br />
8.39 Recommendation 19 in chapter 7 set out<br />
the case for an extended role for Envirowise. An<br />
increased coverage of business and closer<br />
working with government agencies will provide<br />
a key element of the delivery framework.<br />
Incentives for local authorities to<br />
work together<br />
8.40 The fragmentation of local authorities’<br />
waste management into two distinct functions<br />
of collection (at district level) and disposal (at<br />
county level) should be addressed to improve<br />
the effectiveness of the delivery of waste<br />
management.<br />
8.41 The Project Integra model adopted by<br />
Hampshire shows that co-operation between<br />
local authorities can work well (see Box 31<br />
below). There are also other examples in<br />
Warwickshire, Bedfordshire, and West Devon<br />
where joint working between districts has led to<br />
greater progress and more effective and efficient<br />
waste management.<br />
Box 31: Project Integra, an example of partnership working at local<br />
authority level<br />
Project Integra is the name given to the county-wide integrated waste management strategy<br />
being implemented in Hampshire. It is an example of how overall added value can be achieved<br />
through collaborative working:<br />
●<br />
●<br />
●<br />
●<br />
Risk and Investment Share: individual authorities (mainly districts and boroughs) share the<br />
increased risks of recycling and offset costs within the partnership. They benefit from access to<br />
advanced collection, processing and recovery systems that would ordinarily be outside the<br />
financial or ‘risk’ reach of most second tier authorities.<br />
Performance comparison: comparative assessments of different types of collection systems<br />
become significantly easier when made within the comfort of the partnership ‘family’. It is<br />
often agreed that one partner authority will try a particular collection approach and the other<br />
partners receive detailed feedback on cost, take-up and performance. A good example of Best<br />
Value in action.<br />
Effective use of capital assets: through integrated partnership working, the <strong>Waste</strong> Disposal<br />
Authorities (Hampshire, Southampton and Portsmouth) have been able to focus and target<br />
new infrastructure (developed, built and operated) in line with detailed plans for accelerated<br />
collection systems. Joint working means that Members can ascertain and prioritise future<br />
expenditure and commitments based on an understanding of the ‘whole picture.’<br />
Market Influence: considerable advantage has been gained by aggregating material volumes<br />
(plastic, paper, glass, metals) and securing contracts for supply at a price above that achieved<br />
by individual authorities working alone.<br />
Further information about Project Integra can be found at: www.hants.gov.uk/integra<br />
FUNDING AND DELIVERY<br />
109
Recommendation 31:<br />
DEFRA and ODPM should carry out a joint<br />
review to establish what further financial<br />
incentives might be put in place to encourage<br />
waste disposal and waste collection<br />
authorities to work together more effectively.<br />
Current financial relationships could be<br />
improved by:<br />
1. changing the basis on which collection<br />
authorities pay disposal authorities. There is<br />
currently a flat rate charge but changing to a<br />
rate per tonne would create an incentive to<br />
reduce waste for disposal;<br />
2. reviewing the function and operation of<br />
recycling credits – the payment from disposal<br />
authorities to collection authorities for each<br />
tonne recycled – and considering expanding<br />
credits to incorporate waste reduction<br />
achieved by collection authorities.<br />
Options for further incentives are:<br />
1. taking forward Joint Municipal <strong>Waste</strong><br />
Strategies between collection and disposal<br />
authorities, as agreed and shown to be<br />
beneficial in <strong>Waste</strong> Strategy 2000. The<br />
delivery taskforce (recommendation 28)<br />
could help LAs produce good quality plans<br />
and avoid unnecessary duplication; and/or<br />
2. agreeing pooled waste management targets<br />
between all collection and disposal<br />
authorities.<br />
8.42 In addition, DEFRA and ODPM should<br />
consider:<br />
1. waste disposal authorities requiring waste<br />
collection authorities to deliver waste separated<br />
for recycling to particular sites; 138 and<br />
2. where waste is managed in two tiers,<br />
consider the combination of collection and<br />
disposal functions into a single ‘resource<br />
management authority’ over the next 3-5<br />
years.<br />
Improving the planning process for<br />
waste facilities<br />
8.43 An effectively functioning land use<br />
planning system is essential to secure best use<br />
of land and location of facilities. This will<br />
become increasingly important in the future as<br />
more waste facilities are required to deal with<br />
growing waste volumes and diversion from<br />
landfill. 139<br />
8.44 General improvements to make the<br />
planning system faster and more consistent are<br />
being addressed by the ODPM’s review of the<br />
whole planning system. 140 These general<br />
improvements will in part address the problems<br />
associated with waste (summarised in Chapter<br />
4). The emphasis on improved local plans<br />
(recommendation 31) will also help industry to<br />
be aware of, and plan for the timescales<br />
involved. However, there remains a need to<br />
address issues that affect waste specifically.<br />
8.45 These can be addressed through a revision<br />
of Planning Policy Guidance (PPG10 provides<br />
guidance on waste) that will be updated as part<br />
of ODPM’s review.<br />
Recommendation 32:<br />
ODPM and DEFRA should discuss and revise<br />
PPG10 as a priority to ensure all required<br />
waste facilities can proceed.<br />
WASTE NOT, WANT NOT<br />
138<br />
<strong>Waste</strong> Disposal Authorities (counties in rural areas) have the power to direct the district councils in their area, who collect waste from<br />
householders and others, to deliver the waste they collect to particular sites. In <strong>Waste</strong> Strategy 2000, the Government announced<br />
that it would extend this power so that disposal authorities could require certain wastes to be delivered to them separately from<br />
other wastes so that they can be recycled<br />
139<br />
Recycling and composting facilities are smaller relative to thermal treatment and landfill, so an increasing number of planning<br />
applications for waste facilities can be expected in future. Material Recycling Facilities (MRFs) can generally handle between 25,000<br />
to 50,000 tonnes, composting facilities between 5,000 to 50,000 tonnes, and thermal treatment plants can range from 50,000 to<br />
400,000 tonnes<br />
140<br />
Being addressed through the reforms to the planning system indicated in ODPM’s statement Sustainable Communities: delivering<br />
through planning which was published on 18 July 2002. The aim is to speed up the planning system and make outcomes more<br />
predictable<br />
110
The revision should cover:<br />
1. guidance to ensure that conditions to lessen<br />
any health impacts of a waste facility are<br />
dealt with in granting a pollution control<br />
permit rather than within the planning<br />
permission process (this happens, for<br />
example, for telephone masts). There should<br />
also be clarification of which other issues are<br />
for the pollution control permit rather than<br />
planning;<br />
2. guidance on the requirement to keep<br />
development plans up to date; and<br />
3. an expectation that local authorities should<br />
give reasons when they turn down a specific<br />
application which conforms with their plan. If<br />
their reasons are site or facility specific they<br />
should make these clear and retain them for<br />
any future application.<br />
8.46 As part of this revision, consideration<br />
should be given to designating specific sites in<br />
the local plan for locating waste facilities in<br />
advance of individual planning applications.<br />
This would have the advantage of speeding up<br />
the planning process. On the other hand, it<br />
could delay the whole plan, and identification<br />
of sites in advance may blight land and prevent<br />
any development in the vicinity.<br />
Improved performance<br />
A Steering Group reporting to the<br />
Secretary of State<br />
8.47 In the short to medium term, there needs<br />
to be a driving force for co-ordinating all the<br />
recommendations in this report. <strong>Waste</strong> Strategy<br />
2000 was followed up by a monitoring and<br />
evaluation group that no longer exists. In order<br />
to make progress, a high-level and highpowered<br />
body to drive forward implementation<br />
of the strategy in this report is required.<br />
141<br />
DETR, Strong Local Leadership – Quality Public Services, (2001)<br />
8.48 A high level steering group that reports to<br />
the Secretary of State and chaired by a senior<br />
external figure should be set up. It should<br />
comprise around 10 senior figures able to<br />
address delivery, strategy and performance<br />
issues from government, the EA, the waste<br />
industry, the community sector, local<br />
government, WRAP and academia. A core of the<br />
current SU <strong>Waste</strong> Advisory Group might provide<br />
some of the members for this group.<br />
Recommendation 33:<br />
A high-level steering group, chaired by a<br />
senior external figure and reporting to the<br />
Secretary of State for the Environment, Food<br />
and Rural Affairs should be set up to drive<br />
forward the recommendations in this report.<br />
Performance of local authorities<br />
8.49 Over 100 local authorities say they will fail<br />
to meet their statutory waste targets. If<br />
additional resources are directed to waste<br />
management, then an appropriate performance<br />
framework must be in place to ensure that<br />
progress is made.<br />
8.50 The Local Government White Paper 141 sets<br />
out an approach to address all aspects of service<br />
performance. Outcomes are assessed through<br />
the new Comprehensive Performance<br />
Assessment (CPA) that includes an analysis of<br />
Best Value Performance Indicators (including<br />
nine indicators for waste), inspections and<br />
corporate service planning systems.<br />
Improvements identified by the CPA are set out<br />
in its Best Value Performance Plan. Chapter 6 set<br />
out the reasons why the Best Value indicators<br />
for waste management provide conflicting<br />
signals for local authorities. Making the<br />
appropriate changes will therefore enhance the<br />
CPA process applied to waste. An additional<br />
consideration is whether this is enough or<br />
whether waste should be given a higher priority<br />
within this process, albeit for a limited period.<br />
FUNDING AND DELIVERY<br />
111
Recommendation 34:<br />
ODPM and DEFRA should ensure that Best<br />
Value Indicators support waste reduction<br />
and recycling and that realistic penalties<br />
and incentives are available for LAs to meet<br />
waste targets.<br />
Options are:<br />
1. enhancing the existing Comprehensive<br />
Performance Assessment by making the Best<br />
Value Performance Indicators for waste<br />
consistent and in line with a reduce-re-userecycling<br />
strategy and possibly placing more<br />
emphasis on waste aspects of performance,<br />
at least for a short period;<br />
2. a performance reward grant that provides a<br />
positive incentive by linking funding in part<br />
with achievement of a certain target – for<br />
example on statutory performance standards<br />
for recycling – and in part through an<br />
advance allocation of resources to take<br />
account of the up-front costs and effort<br />
required to meet the target;<br />
3. fines could be levied on poor performers.<br />
However, this could have an adverse impact<br />
if LAs subsequently reduced their waste<br />
spend; and/or<br />
4. for high performing authorities or the waste<br />
industry to take over the management of the<br />
waste function in poor performing<br />
authorities.<br />
WASTE NOT, WANT NOT<br />
112
9. SUMMARY OF KEY RECOMMENDATIONS AND<br />
ACTION PLAN<br />
Summary<br />
●<br />
Successful implementation of the strategy and measures in this report<br />
requires a clear action plan.<br />
●<br />
For each recommendation, this chapter sets out who should have<br />
lead responsibility, what the timetable for implementation should be,<br />
and how success should be measured in each case.<br />
●<br />
The Secretary of State for the Environment, Food and Rural Affairs<br />
should have overall long term responsibility for the implementation<br />
of the strategy<br />
9.1 Figure 19 summarises the key<br />
recommendations in this report and the order in<br />
which they need to be carried out. The key is to<br />
signal the changed economic framework,<br />
provide time, funds and incentives for new<br />
waste treatment methods to develop, and then,<br />
if necessary to provide incentives or regulation<br />
to boost the use of the new infrastructure.<br />
The table of recommendations gives more detail<br />
of the actions to be taken, who is responsible<br />
for them and how progress is to be measured.<br />
The key recommendations in this<br />
report are:<br />
1. Economic and regulatory framework<br />
● freedom for LAs to introduce household<br />
incentive schemes to encourage waste<br />
reduction and recycling, if they wish to do<br />
so;<br />
● extend voluntary producer responsibility for<br />
waste reduction and recycling;<br />
● incentives for the re-use of goods;<br />
● economic instruments to encourage<br />
environmentally friendly products to reduce<br />
hazardous/non-recyclable waste;<br />
● promote use of secondary resources;<br />
● raise the landfill tax to £35 a tonne in the<br />
medium term;<br />
● make space in new housing developments<br />
for storage for recycling;<br />
● increase government green procurement;<br />
● new targets for waste<br />
minimisation/disposal;<br />
● review the case for banning the use of<br />
landfill/incineration for some materials in<br />
2006/7;<br />
● higher fines and more rigorous<br />
enforcement of fines for fly-tipping; and<br />
● keep the case for an incineration tax under<br />
review.<br />
SUMMARY OF KEY RECOMMENDATIONS AND ACTION PLAN<br />
113
WASTE NOT, WANT NOT<br />
114<br />
2. Strategic investment measures<br />
● waste minimisation measures – including<br />
extension of home composting;<br />
● roll out kerbside recycling to the majority<br />
of households, and increase the number of<br />
bring sites and well designed civic amenity<br />
sites;<br />
● information and education campaigns to<br />
support these programmes;<br />
● better waste data; and<br />
● incentives for the take up of the wider<br />
range of technologies that exist.<br />
3. Funding and delivery<br />
● the Challenge Fund should be retained and<br />
opened up to the private sector;<br />
● the LTCS should be reformed to provide<br />
more support for the strategic waste<br />
investment measures outlined in this<br />
report;<br />
● DEFRA’s waste management function<br />
should be strengthened;<br />
● a multi-disciplinary operational task-force<br />
should be set up to help local authorities<br />
deliver;<br />
● the role of WRAP should be extended to<br />
minimising and recycling waste (focusing<br />
on organics) as well as boosting recyclate<br />
markets;<br />
● improved incentives are needed to<br />
encourage tiers of local authorities and<br />
adjacent local authorities to work together<br />
to increase efficiency and realise economies<br />
of scale;<br />
● ensure the planning system and associated<br />
guidance can deliver the new facilities that<br />
will be required;<br />
● set up a high level steering board to drive<br />
forward implementation; and<br />
● ensure that the full range of appropriate<br />
interventions are used when local<br />
authorities fail to deliver on their waste<br />
plans and targets.<br />
Key actions needed between<br />
now and 2005<br />
●<br />
●<br />
●<br />
●<br />
●<br />
●<br />
●<br />
●<br />
decide the phasing of increases in the landfill<br />
tax and how tax revenues will be recycled to<br />
assist industry and local authorities move to<br />
more sustainable waste management;<br />
make decisions on an incineration tax;<br />
agree adequate resourcing of the strategy set<br />
out in this report and the allocation of<br />
reformed LTCS and other funding streams;<br />
put in place the multi-disciplinary operational<br />
task force to help local authorities deliver;<br />
expand WRAP’s role and fund its programme<br />
of reduction, re-use and recycling and the<br />
education that goes with it;<br />
expand the role of Envirowise for commercial<br />
waste;<br />
adequately resource waste management in<br />
DEFRA; and<br />
invest in the infrastructure required to deliver<br />
the SU plan.<br />
Key decision points/milestones<br />
9.2 <strong>Waste</strong> Strategy 2000 is due to be reviewed<br />
in 2005. The key decision point will be 2010. If<br />
we have made no significant progress by then,<br />
very urgent and costly action will be required to<br />
meet the EU Landfill Directive by 2020.<br />
9.3 Key milestones will be:<br />
●<br />
progress in reducing waste growth by end<br />
2006;
● achieving a household recycling rate of 35%<br />
by 2010 and 45% by 2015; and<br />
●<br />
achieving the 2010 Landfill Directive target.<br />
Implications of failure to make<br />
progress<br />
●<br />
●<br />
●<br />
●<br />
waste will continue to grow, meaning costs<br />
will rise and the inevitable transition to a<br />
more sustainable waste management system<br />
will cost more;<br />
EU fines of £180m could be levied;<br />
more landfill sites and incinerators will be<br />
needed; and<br />
the UK will face more waste crises, as<br />
occurred with fridges, due to its slow<br />
progress in developing alternative waste<br />
management options. This could transfer the<br />
costs of managing commercial wastes to local<br />
authorities.<br />
Overall responsibility for this<br />
report<br />
9.4 The Secretary of State for the Environment,<br />
Food and Rural Affairs should be the Ministerial<br />
Champion for the strategy and measures in this<br />
report. In the short term, however, a Ministerial<br />
Group reporting jointly to the Secretary of State<br />
and the Chief Secretary to the Treasury should<br />
develop the public expenditure programmes<br />
and institutional arrangements needed to<br />
implement the report’s recommendations.<br />
SUMMARY OF KEY RECOMMENDATIONS AND ACTION PLAN<br />
115
WASTE NOT, WANT NOT<br />
Summary of key recommendations and action plan<br />
It is mainly the role of DEFRA to take forward and monitor the recommendations of this strategy. The table below summarises these actions and<br />
lists the other lead departments/organisations who would need to be involved in taking them forward.<br />
Where appropriate, the recommendations will need to be subject to a Regulatory Impact Assessment.<br />
Key (w) = recommendations that may impact on the better management of wider wastes in addition to municipal waste<br />
* = recommendations likely to have a significant impact on the waste management of the Devolved Administrations<br />
Recommendation Benefits/Risks Action to By when Lead dept/ Others Measuring<br />
be taken organisation involved progress<br />
Chapter 6 – Economic<br />
and regulatory<br />
framework<br />
Recommendation 1:<br />
Local authorities that<br />
wish to take forward<br />
household incentive<br />
schemes to help reduce<br />
waste volumes and<br />
increase recycling<br />
should be allowed to<br />
do so.<br />
Schemes could include:<br />
Council tax discounts<br />
for households that<br />
home compost.<br />
Rewards/prizes for<br />
homes that recycle.<br />
Variable charging<br />
schemes to reduce<br />
Council Tax – those<br />
who reduce waste and<br />
recycle pay less.<br />
Benefits:<br />
It rewards those<br />
households who reduce<br />
and recycle waste.<br />
It reduces costs, boosts<br />
recycling and therefore<br />
the number of extra<br />
landfill sites, incinerators<br />
and other facilities<br />
required.<br />
It allows households to<br />
reduce their bills.<br />
Factors for LAs to<br />
consider when taking up<br />
incentive schemes:<br />
– need composting/<br />
recycling infrastructure<br />
in place;<br />
– needs to be<br />
accompanied by<br />
education and safety<br />
net for low income<br />
families;<br />
– ideally conduct pilots<br />
first.<br />
LAs to take up and<br />
try schemes.<br />
As LAs wish<br />
but starting<br />
now.<br />
DEFRA/<br />
ODPM/LGA<br />
LAs/WRAP<br />
(i) 30% of collection<br />
authorities to<br />
have tried<br />
incentive based<br />
schemes by<br />
2006.<br />
(ii) Reduction in rate<br />
of household<br />
waste growth to<br />
2% per annum<br />
by 2006.<br />
116
Recommendation Benefits/Risks Action to By when Lead dept/ Others Measuring<br />
be taken organisation involved progress<br />
Chapter 6 – Economic<br />
and regulatory<br />
framework<br />
Recommendation 2:<br />
DEFRA and DTI should<br />
extend voluntary<br />
agreements with<br />
industry to reduce<br />
waste and increase the<br />
use of recycled<br />
materials and the<br />
recyclability of<br />
products. (w)<br />
Benefits: reduces waste<br />
and boosts recycling.<br />
Risks: voluntary<br />
agreements have <strong>not</strong><br />
always been successful.<br />
Examine the UK<br />
waste stream to<br />
identify areas<br />
where producer<br />
responsibility<br />
would make a big<br />
impact.<br />
Study now.<br />
Aim for two<br />
new<br />
voluntary<br />
agreements<br />
per year.<br />
Study to be<br />
carried out by<br />
DEFRA/DTI.<br />
CBI/WRAP and<br />
Envirowise.<br />
Addition of 2 new<br />
schemes per year<br />
and increasing<br />
targets on existing<br />
ones e.g. junk mail.<br />
Recommendation 3:<br />
DEFRA and WRAP<br />
should consider the<br />
options for increasing<br />
incentives for<br />
re-use.<br />
Benefits: less waste to<br />
manage, reduces costs,<br />
prolongs life-cycle of<br />
products.<br />
Risks: extra<br />
administration/transport<br />
costs.<br />
Study now.<br />
Pilots of<br />
selected<br />
areas in<br />
2003.<br />
WRAP/DEFRA.<br />
Industry/<br />
Retailers.<br />
Successful pilots and<br />
implementation of<br />
at least two waste<br />
streams.<br />
SUMMARY OF KEY RECOMMENDATIONS AND ACTION PLAN<br />
117
WASTE NOT, WANT NOT<br />
Recommendation Benefits/Risks Action to By when Lead dept/ Others Measuring<br />
be taken organisation involved progress<br />
Chapter 6 – Economic<br />
and regulatory<br />
framework<br />
Recommendation 4:<br />
HMT and DEFRA to<br />
consider the case for<br />
applying incentives<br />
such as economic<br />
instruments to<br />
encourage<br />
environmentallyfriendly<br />
products.<br />
(w)<br />
Benefits: increases<br />
demand for<br />
environmentally friendly<br />
products.<br />
Increases markets for<br />
‘green’ products.<br />
Risks: burdens on sectors<br />
of industry if <strong>not</strong><br />
signalled in advance.<br />
VAT would need<br />
to be discussed in<br />
the context of<br />
renegotiation of<br />
the EU VAT<br />
Directive in 2003.<br />
Need to identify<br />
products for<br />
which green taxes<br />
are more<br />
appropriate than<br />
producer<br />
responsibility.<br />
HMT to<br />
study<br />
options.<br />
HMT/DEFRA.<br />
DTI<br />
HMT to develop<br />
effective economic<br />
instruments to<br />
increase demand for<br />
environmentally<br />
friendly product<br />
purchase.<br />
Recommendation 5:<br />
DTI should work with<br />
DEFRA, WRAP, industry<br />
and the BSI Group to<br />
assess what more can<br />
be done to promote<br />
the use of secondary<br />
resources through BSI<br />
standards.<br />
(w)<br />
Benefits: boosts the use<br />
of recyclate through<br />
reducing recycling costs<br />
and removing artificial<br />
barriers to its use.<br />
Risks: none where this is<br />
practicable.<br />
Assess what can be<br />
done to promote<br />
the use of<br />
secondary<br />
resources where<br />
appropriate,<br />
including reviewing<br />
areas of BSI<br />
standardisation<br />
where practicable,<br />
which may block<br />
the use of<br />
recycled materials.<br />
Complete<br />
review by<br />
03/04.<br />
Implement<br />
required<br />
changes by<br />
05/06.<br />
DTI/BSI<br />
group.<br />
WRAP/<br />
Envirowise<br />
DEFRA.<br />
Change in<br />
standards. Less<br />
barriers to use of<br />
recycled materials.<br />
Greater use of<br />
recyclate.<br />
Specifications to<br />
encourage use of<br />
recyclate.<br />
118
Recommendation Benefits/Risks Action to By when Lead dept/ Others Measuring<br />
be taken organisation involved progress<br />
Chapter 6 – Economic<br />
and regulatory<br />
framework<br />
Recommendation 6:<br />
ODPM should revise<br />
the building<br />
regulations to require<br />
the allocation of space<br />
in housing<br />
developments for<br />
accessible recycling<br />
facilities.<br />
Benefits: removes<br />
problem of storage space<br />
which is a major<br />
hindrance to recycling.<br />
Risks: slight extra costs<br />
to housing. Space will be<br />
used for other purposes.<br />
Could apply to<br />
new housing<br />
developments<br />
with more than<br />
50 houses.<br />
Allocate space<br />
within the<br />
development for<br />
recycling facilities.<br />
Housing<br />
Corporations to<br />
consider similar<br />
standards for<br />
social housing,<br />
and NHBC<br />
standards for<br />
private<br />
developments.<br />
Start now.<br />
ODPM<br />
WRAP/Housing<br />
Corporations/<br />
Construction<br />
Industry/LAs<br />
New dwellings and<br />
estates have suitable<br />
storage and space<br />
for recycling<br />
facilities.<br />
SUMMARY OF KEY RECOMMENDATIONS AND ACTION PLAN<br />
119
WASTE NOT, WANT NOT<br />
Recommendation Benefits/Risks Action to By when Lead dept/ Others Measuring<br />
be taken organisation involved progress<br />
Chapter 6 – Economic<br />
and regulatory<br />
framework<br />
Recommendation 7:<br />
OGC and other<br />
Departments to finalise<br />
central government<br />
targets for the use of<br />
recycled materials. All<br />
Departments to also<br />
have in place a trained<br />
Green Procurement<br />
Officer.<br />
(w)<br />
Benefits: expansion of<br />
markets for recyclates.<br />
Government<br />
departments meet<br />
targets.<br />
Risks: slight increase in<br />
costs until recyclate falls<br />
in price, unless good<br />
economies of scale in<br />
purchase obtained.<br />
OGC and other<br />
Departments to<br />
work through SPG<br />
(taking advice<br />
from WRAP) to set<br />
targets for<br />
purchasing goods<br />
with minimum<br />
recycled content.<br />
Recommend<br />
training for green<br />
procurement<br />
officers. Consider<br />
waste<br />
minimisation<br />
targets for office<br />
waste in the<br />
medium term.<br />
Start now.<br />
<strong>Waste</strong> min<br />
targets by<br />
2006/7<br />
OGC, SPG.<br />
WRAP, other<br />
government<br />
departments<br />
More green goods<br />
procured by<br />
2006/7.<br />
Higher percentages<br />
of waste recycled.<br />
120
Recommendation Benefits/Risks Action to By when Lead dept/ Others Measuring<br />
be taken organisation involved progress<br />
Chapter 6 – Economic<br />
and regulatory<br />
framework<br />
Recommendation 8:<br />
ODPM and the LGA to<br />
consider setting<br />
voluntary green<br />
procurement targets<br />
for local authorities to<br />
purchase more recycled<br />
goods, to minimise<br />
waste volumes and to<br />
encourage them to<br />
recycle more of their<br />
waste.<br />
(w)<br />
Benefits: expansion of<br />
markets for recyclate.<br />
Risks: could be a small<br />
initial cost increase.<br />
ODPM and LGA<br />
to consider setting<br />
voluntary<br />
environmental<br />
procurement<br />
targets for local<br />
authorities and<br />
targets for them<br />
to reduce their<br />
own waste.<br />
Consider linking<br />
targets to<br />
implementing<br />
service area<br />
targets within<br />
Sustainability<br />
Action Plans or reinstating<br />
waste in<br />
Beacon status for<br />
councils.<br />
Now<br />
ODPM/LGA<br />
DEFRA/WRAP<br />
Higher % of green<br />
goods procured.<br />
Increase in recycling<br />
rates for local<br />
authorities’ own<br />
waste.<br />
Re-instate waste in<br />
Beacon status.<br />
SUMMARY OF KEY RECOMMENDATIONS AND ACTION PLAN<br />
121
WASTE NOT, WANT NOT<br />
Recommendation Benefits/Risks Action to By when Lead dept/ Others Measuring<br />
be taken organisation involved progress<br />
Chapter 6 – Economic<br />
and regulatory<br />
framework<br />
Recommendation 9:<br />
DEFRA together with<br />
ODPM, the Audit<br />
Commission and WRAP<br />
to develop proposals<br />
for alternative<br />
indicators that<br />
incorporate success in<br />
reducing waste<br />
volumes. New targets<br />
for local authorities<br />
should then be set to<br />
reflect the SU reduction<br />
and recycling strategy.<br />
Benefits: motivates<br />
efforts on waste<br />
reduction.<br />
Risks: may be difficult to<br />
measure.<br />
Once local<br />
authorities have<br />
more tools e.g.<br />
funds for home<br />
composting and<br />
variable charging.<br />
Review<br />
05/06.<br />
Targets set<br />
05/06.<br />
DEFRA/ODPM<br />
WRAP/Audit<br />
Commission.<br />
Reduction in rate of<br />
growth of waste per<br />
head in LA area.<br />
e.g.<br />
(i) New targets –<br />
combined waste<br />
minimisation/<br />
recycling targets for<br />
LAs.<br />
<strong>Waste</strong> minimisation<br />
targets to be<br />
statutory.<br />
e.g.<br />
(ii) New targets – set<br />
LAs targets for roll<br />
out of home<br />
composting.<br />
Benefits: encourages<br />
households to reduce<br />
waste production.<br />
Means LAs don’t collect<br />
green waste they do <strong>not</strong><br />
need to at extra cost.<br />
Risks: people do <strong>not</strong><br />
compost effectively.<br />
50% of homes by<br />
05/06.<br />
Start now.<br />
Targets<br />
now.<br />
DEFRA/ODPM<br />
WRAP/Audit<br />
Commission.<br />
Increase in effective<br />
home composting.<br />
Reduction in<br />
green/organic waste<br />
entering domestic<br />
stream<br />
unnecessarily.<br />
122
Recommendation Benefits/Risks Action to By when Lead dept/ Others Measuring<br />
be taken organisation involved progress<br />
Chapter 6 – Economic<br />
and regulatory<br />
framework<br />
Recommendation 9:<br />
(continued)<br />
e.g.<br />
(iii) New targets –<br />
higher national<br />
recycling targets:<br />
35% by 2010;<br />
45% by 2015.<br />
Benefits: encourages<br />
recycling.<br />
Risks: LAs pursue green<br />
waste that could be<br />
composted and increase<br />
waste growth.<br />
A minimum of<br />
45% by 2015 (up<br />
from 33%).<br />
Incentives for LAs<br />
that do even<br />
better.<br />
Start now.<br />
DEFRA/ODPM<br />
WRAP<br />
Recycling rates<br />
increase by more<br />
than 1% per annum<br />
to meet SU<br />
trajectory milestones<br />
(35% by 2010 and<br />
45% by 2015).<br />
(DEFRA to consider<br />
making these statutory<br />
later)<br />
e.g.<br />
(iv) New targets –<br />
consider the option<br />
of replacing<br />
recycling targets<br />
with targets to<br />
reduce residual<br />
waste or a<br />
balanced scorecard.<br />
Benefits: one simple<br />
target meeting the needs<br />
of the strategy.<br />
Reduction in residual<br />
waste/landfill.<br />
Risks: defining residual<br />
waste clearly.<br />
Could provide<br />
right signal in one<br />
target. Does <strong>not</strong><br />
have the perverse<br />
incentive of high<br />
recycling targets<br />
i.e. growth in<br />
waste.<br />
Start now.<br />
DEFRA/ODPM<br />
WRAP<br />
Introduce targets<br />
that create the right<br />
behaviour and<br />
reflect where we<br />
wish to be.<br />
Reduce focus on<br />
disposal.<br />
SUMMARY OF KEY RECOMMENDATIONS AND ACTION PLAN<br />
123
WASTE NOT, WANT NOT<br />
Recommendation Benefits/Risks Action to By when Lead dept/ Others Measuring<br />
be taken organisation involved progress<br />
Chapter 6 – Economic<br />
and regulatory<br />
framework<br />
Recommendation 10:<br />
DEFRA to encourage<br />
the development of<br />
quality standards for<br />
compost. These should<br />
inform DEFRA’s position<br />
during any negotiations<br />
on an EU Bio-waste<br />
Directive.<br />
(w)<br />
Benefits: composting is<br />
a major element of any<br />
recycling strategy.<br />
Risks: none.<br />
DEFRA to draw up<br />
a bio-waste<br />
strategy and<br />
implement WRAP/<br />
Composting<br />
Association<br />
standards. The<br />
strategy should<br />
also include a<br />
review of the<br />
potential to use<br />
compost for soil<br />
improvement.<br />
By end<br />
2003.<br />
DEFRA<br />
WRAP/<br />
Composting<br />
Association<br />
Expansion of<br />
markets for<br />
compost.<br />
Recommendation 11:<br />
Raise landfill tax to £35<br />
a tonne for active<br />
waste in the medium<br />
term.<br />
(w)*<br />
Benefits: reduces<br />
reliance on landfill.<br />
Makes it economic to<br />
develop alternatives.<br />
Risks: revenue needs to<br />
be recycled to ensure<br />
alternatives are<br />
developed without<br />
significant impact on<br />
competitiveness/LAs.<br />
HMT to decide<br />
timing and<br />
phasing of rise of<br />
landfill tax.<br />
By Budget<br />
2003.<br />
HMT and C&E<br />
Percentage and level<br />
of waste to landfill<br />
falls.<br />
Investment in<br />
alternatives to<br />
landfill increases.<br />
124
Recommendation Benefits/Risks Action to By when Lead dept/ Others Measuring<br />
be taken organisation involved progress<br />
Chapter 6 – Economic<br />
and regulatory<br />
framework<br />
Recommendation 12:<br />
DEFRA and DTI to<br />
review the case for a<br />
ban on landfill or<br />
incineration of<br />
recyclable products or<br />
materials.<br />
(w)*<br />
Benefits: boosts<br />
recycling and reduces<br />
disposal facilities<br />
required.<br />
Risks: danger if in place<br />
before recycling<br />
infrastructure and<br />
markets developed.<br />
Increases regulatory<br />
burden.<br />
Consider a ban on<br />
the landfill of<br />
recyclates from<br />
2006/7 in light of<br />
progress towards<br />
2010 targets.<br />
Should <strong>not</strong> be<br />
required if<br />
kerbside rolled out<br />
and bring site<br />
density increases.<br />
Review<br />
dependent<br />
on<br />
progress.<br />
Can be<br />
enforced<br />
once<br />
kerbside is<br />
in place<br />
and bring<br />
sites have<br />
been<br />
intensified.<br />
DEFRA/DTI<br />
EA<br />
Increase in level of<br />
recycling.<br />
Reduction in landfill.<br />
SUMMARY OF KEY RECOMMENDATIONS AND ACTION PLAN<br />
125
WASTE NOT, WANT NOT<br />
Recommendation Benefits/Risks Action to By when Lead dept/ Others Measuring<br />
be taken organisation involved progress<br />
Chapter 6 – Economic<br />
and regulatory<br />
framework<br />
Recommendation 13:<br />
The Home Office/<br />
Lord Chancellor’s<br />
Department should<br />
ensure that guidance<br />
directed to magistrates<br />
is sufficient to support<br />
more prosecutions for<br />
waste crimes.<br />
Strengthening<br />
deterrents should also<br />
be considered.<br />
(w)<br />
Benefits: provides a<br />
more valuable deterrent<br />
as costs of waste rise.<br />
Risks: few are caught.<br />
Costs of court time.<br />
Could be mitigated, for<br />
example, by more on the<br />
spot fines and vehicle<br />
confiscation.<br />
Prosecutions and<br />
fines for<br />
flytipping/<br />
dumping currently<br />
very low. Will<br />
need to increase<br />
as waste costs rise.<br />
LCD are taking<br />
forward legislation<br />
on more stringent<br />
fine enforcement<br />
as follow up to<br />
White Paper,<br />
“Justice for All”.<br />
Ensure magistrates<br />
have sufficient<br />
guidance on the<br />
importance of<br />
imposing<br />
balanced fines.<br />
Consider other<br />
penalties e.g.<br />
vehicle<br />
confiscation/on<br />
the spot fines.<br />
Start now.<br />
Home Office<br />
LCD/Local<br />
magistrates/<br />
police<br />
Deterrent factor<br />
leads to a decrease<br />
in the amount of<br />
flytipping.<br />
Heavy penalties for<br />
those that are<br />
caught.<br />
Reduction in repeat<br />
offenders.<br />
126
Recommendation Benefits/Risks Action to By when Lead dept/ Others Measuring<br />
be taken organisation involved progress<br />
Chapter 6 – Economic<br />
and regulatory<br />
framework<br />
Recommendation 14:<br />
The case for an<br />
incineration tax should<br />
be kept under review.<br />
(w)*<br />
Benefits: would send a<br />
clear signal about the<br />
intention to focus on<br />
reduction and recycling.<br />
More information<br />
needed to make the case.<br />
HMT to conduct<br />
more work.<br />
Now –<br />
decisions<br />
by 2004<br />
HMT<br />
Recommendation 15:<br />
An independent body<br />
should bring together<br />
the literature and<br />
evidence on the<br />
relative health and<br />
environmental effects<br />
of all different waste<br />
management options,<br />
relative to each other<br />
and to other activities<br />
affecting health and<br />
the environment.<br />
(w)<br />
Benefits: an<br />
independent body could<br />
bring together current<br />
best research for the use<br />
of local authorities and<br />
to provide a definitive<br />
and objective line on<br />
effects.<br />
Risks: does <strong>not</strong> resolve<br />
debate on health effects<br />
or address perceptions of<br />
risk. Leads to a freeze in<br />
development of all<br />
facilities whilst study is<br />
undertaken.<br />
DEFRA to identify<br />
a suitable<br />
independent<br />
body, perhaps the<br />
Royal Society.<br />
Now.<br />
Review<br />
completed<br />
by Summer<br />
2003.<br />
DEFRA<br />
EA<br />
Definitive and<br />
objective review of<br />
current knowledge<br />
available to all.<br />
Helps LAs to<br />
understand pros and<br />
cons, communicate<br />
risks to households.<br />
SUMMARY OF KEY RECOMMENDATIONS AND ACTION PLAN<br />
127
WASTE NOT, WANT NOT<br />
Recommendation Benefits/Risks Action to By when Lead dept/ Others Measuring<br />
be taken organisation involved progress<br />
Chapter 7 – Strategic<br />
investment<br />
measures<br />
Recommendation 16:<br />
WRAP should take<br />
forward four measures<br />
to reduce waste<br />
volumes.<br />
Benefits: WRAP is well<br />
placed to manage this.<br />
Package will reduce<br />
waste growth, therefore<br />
saving money.<br />
Four programmes<br />
for: extending<br />
home<br />
composting;<br />
reusable nappies;<br />
retailers’ initiative;<br />
R&D Innovation<br />
Fund.<br />
Fund now,<br />
programmes<br />
implemented<br />
from Spring<br />
2003.<br />
WRAP<br />
DEFRA, LAs,<br />
Businesses,<br />
Retailers,<br />
Households<br />
DEFRA, LAs<br />
Businesses, Retailers<br />
Households.<br />
Recommendation 17:<br />
WRAP should take<br />
forward two measures<br />
to increase recycling<br />
and composting.<br />
Benefits: boosts<br />
recycling, reduces level<br />
of incineration and<br />
landfill otherwise<br />
required.<br />
Risks: public do <strong>not</strong> take<br />
part as expected.<br />
Mitigate risk via:<br />
• education<br />
• well-designed<br />
schemes<br />
• incentives to recycle.<br />
A package of<br />
measures to<br />
improve bring site<br />
density, increase<br />
effectiveness of<br />
civic amenity sites<br />
and roll out<br />
kerbside recycling.<br />
WRAP to<br />
implement<br />
kerbside taskforce<br />
and market<br />
development<br />
programme.<br />
DEFRA will<br />
manage<br />
co-ordination of<br />
funds for LA<br />
infrastructure.<br />
Fund and<br />
start now.<br />
WRAP,<br />
kerbside<br />
taskforce and<br />
market<br />
development<br />
programme<br />
from<br />
2003/4.<br />
DEFRA/WRAP/<br />
Operational<br />
task force/LAs<br />
By 2006:<br />
1 million tonnes per<br />
annum additional<br />
compost.<br />
An additional 3.5%<br />
to the average<br />
household<br />
composting/<br />
recycling rate.<br />
Boost recycling rates<br />
to at least 35% by<br />
2010 and 45% by<br />
2015.<br />
128
Recommendation Benefits/Risks Action to By when Lead dept/ Others Measuring<br />
be taken organisation involved progress<br />
Chapter 7 – Strategic<br />
investment<br />
measures<br />
Recommendation 18:<br />
WRAP should promote<br />
education and<br />
awareness of waste<br />
issues through a<br />
programme of national<br />
and targeted local or<br />
issue specific<br />
campaigns related to<br />
waste minimisation and<br />
recycling.<br />
Benefits: greater<br />
participation in waste<br />
management schemes.<br />
Less contamination in<br />
recyclate.<br />
More informed attitudes<br />
on local waste planning.<br />
There are two<br />
levels; raising<br />
awareness of the<br />
issue and how<br />
households can<br />
help, and specific<br />
education<br />
alongside<br />
initiatives that are<br />
required to ensure<br />
they are effective.<br />
Start now.<br />
WRAP<br />
DEFRA/LAs,<br />
NGOs e.g.<br />
<strong>Waste</strong> Watch,<br />
NWAI<br />
Education will lead<br />
to a more informed<br />
debate about waste<br />
options in local<br />
areas.<br />
Increase<br />
participation in<br />
waste management<br />
schemes.<br />
It is an essential<br />
facilitator of success.<br />
Recommendation 19:<br />
The role of Envirowise<br />
should be expanded so<br />
its coverage is<br />
extended to 20% of UK<br />
companies over the<br />
next 2 years.<br />
(w)<br />
Benefits: starts to tackle<br />
wider wastes. <strong>Waste</strong><br />
minimisation easier at<br />
industry end.<br />
Risks: some additional<br />
extra costs to industry,<br />
though many have saved<br />
money immediately with<br />
Envirowise.<br />
Envirowise to<br />
cover 20% of<br />
companies over<br />
2 years.<br />
Target more<br />
problematic waste<br />
streams/sectors.<br />
Start/fund<br />
now.<br />
Envirowise/<br />
DTI/DEFRA<br />
WRAP/CBI/<br />
SMEs<br />
Reduction in waste<br />
growth rates and<br />
size of problematic<br />
streams.<br />
Savings for business.<br />
SUMMARY OF KEY RECOMMENDATIONS AND ACTION PLAN<br />
129
WASTE NOT, WANT NOT<br />
Recommendation Benefits/Risks Action to By when Lead dept/ Others Measuring<br />
be taken organisation involved progress<br />
Chapter 7 – Strategic<br />
investment<br />
measures<br />
Recommendation 20:<br />
DEFRA and the<br />
Environment Agency<br />
should jointly draw up<br />
a data and research<br />
strategy for the next<br />
three years.<br />
(w)<br />
Benefits: better data on<br />
which to base effective<br />
waste specific<br />
interventions.<br />
Information for a wider<br />
waste strategy.<br />
Data to monitor and<br />
evaluate.<br />
Draw up a data<br />
and research<br />
strategy for the<br />
next three years to<br />
plug gaps in data.<br />
Start now.<br />
DEFRA/EA to<br />
lead<br />
<strong>Waste</strong> industry,<br />
CBI, SMEs,<br />
Departments<br />
and local<br />
government<br />
Good data on waste<br />
arisings for all waste<br />
streams including<br />
composition,<br />
growth rates and<br />
trends.<br />
Risks: failure to act<br />
means data is <strong>not</strong><br />
collected and analysed<br />
accurately.<br />
130
Recommendation Benefits/Risks Action to By when Lead dept/ Others Measuring<br />
be taken organisation involved progress<br />
Chapter 7 – Strategic<br />
investment<br />
measures<br />
Recommendation 21:<br />
DEFRA and DTI should<br />
take forward a<br />
programme of<br />
development of new<br />
technologies or<br />
approaches, including<br />
pilots.<br />
Benefits: broaden<br />
options for managing<br />
waste; kick-starts<br />
investment prior to<br />
landfill tax reaching £35.<br />
Reduces risk to<br />
government of <strong>not</strong><br />
meeting Landfill<br />
Directive.<br />
Provides LAs with a lowrisk<br />
way to try innovative<br />
options.<br />
Risks: money <strong>not</strong> well<br />
targeted – DEFRA to<br />
form technology board<br />
to provide advice on<br />
options to assess pilot<br />
schemes.<br />
Until landfill tax<br />
increases<br />
significantly, there<br />
is no incentive for<br />
new technologies<br />
in the waste area.<br />
LAs need to use<br />
proven<br />
technologies and<br />
are reluctant to<br />
take risks. Grants<br />
will pump prime<br />
the development<br />
of options and<br />
reduce the risk for<br />
waste companies<br />
and LAs who can<br />
fund in<br />
partnership with<br />
government.<br />
Start now,<br />
provide<br />
grants to<br />
help.<br />
DEFRA/DTI<br />
<strong>Waste</strong> industry/<br />
CBI/Carbon<br />
Trust/EA<br />
A greater range of<br />
effective options for<br />
managing waste<br />
and the provision of<br />
alternatives to<br />
landfill and<br />
incineration e.g.<br />
MBT.<br />
SUMMARY OF KEY RECOMMENDATIONS AND ACTION PLAN<br />
131
WASTE NOT, WANT NOT<br />
Recommendation Benefits/Risks Action to By when Lead dept/ Others Measuring<br />
be taken organisation involved progress<br />
Chapter 8 – Funding<br />
and Delivery<br />
Recommendation 22:<br />
The Challenge Fund<br />
should be retained with<br />
consideration given to<br />
opening up bids from<br />
the private sector,<br />
either independently or<br />
in partnership with LAs<br />
to tackle municipal<br />
waste.<br />
Benefits: Challenge<br />
Fund ensures resources<br />
for waste are available<br />
and more focused.<br />
Ensure Challenge<br />
Fund is spent<br />
effectively.<br />
Consider option of<br />
opening this up to<br />
private sector.<br />
Now<br />
DEFRA<br />
Quality of Challenge<br />
Fund bids improves.<br />
Funds channelled<br />
swiftly and<br />
accurately.<br />
Improved<br />
partnership working<br />
if combined bids<br />
accepted.<br />
Recommendation 23:<br />
DEFRA should<br />
accelerate the<br />
programme of work to<br />
improve delivery of PFI<br />
waste projects.<br />
Benefits: ensure PFI is<br />
used flexibly and has<br />
maximum impact.<br />
DEFRA has made<br />
considerable<br />
progress in this<br />
area.<br />
Now<br />
DEFRA<br />
HMT<br />
PFI used for a wide<br />
range of projects<br />
and to improve the<br />
flow of PFI targets.<br />
Recommendation 24:<br />
The LTCS should be<br />
reformed with 2/3rds<br />
of current funds<br />
transferred into a<br />
public expenditure<br />
scheme to fund priority<br />
areas for investment in<br />
waste management.<br />
1/3rd of funds to<br />
remain under the<br />
current scheme.<br />
Benefits: ensure this<br />
fund is better focused<br />
on strategic waste<br />
management.<br />
Risks: some good work is<br />
lost so 1/3rd of existing<br />
scheme is retained for<br />
valuable projects.<br />
Whilst the LTCS has<br />
made progress,<br />
there is insufficient<br />
transparency and<br />
ability to measure<br />
progress of<br />
projects.<br />
The fund is also<br />
<strong>not</strong> open to local<br />
authorities<br />
directly.<br />
Now<br />
HMT<br />
Funds directed at<br />
strategic waste<br />
management<br />
projects with clear<br />
benefits and<br />
measurable<br />
outcomes.<br />
132
Recommendation Benefits/Risks Action to By when Lead dept/ Others Measuring<br />
be taken organisation involved progress<br />
Chapter 8 – Funding<br />
and Delivery<br />
Recommendation 25:<br />
HMT, DEFRA and other<br />
government<br />
departments should<br />
consider how landfill<br />
tax revenue might best<br />
be redirected to<br />
incentivise investment<br />
in reduction, re-use and<br />
recycling.<br />
To increase incentives for<br />
investment in alternative<br />
waste management<br />
options.<br />
Assessment of<br />
options.<br />
In advance<br />
of landfill<br />
tax increase.<br />
HMT, DEFRA<br />
& other<br />
government<br />
departments<br />
Industry, LAs<br />
Landfill tax revenues<br />
are recycled to<br />
incentivise and fund<br />
the change to<br />
alternative waste<br />
management<br />
options.<br />
(w)<br />
Recommendation 26:<br />
DEFRA’s waste policy/<br />
management function<br />
should be<br />
strengthened. DEFRA<br />
should carry out a<br />
review to assess the<br />
scale of the resource<br />
required.<br />
(w)<br />
Benefits: waste is an<br />
area subject to more<br />
legislation and additional<br />
funding.<br />
A strengthened policy<br />
centre helps delivery.<br />
Risks: none.<br />
To include a policy<br />
cell, delivery unit<br />
and team of<br />
technical and legal<br />
support.<br />
Strengthen<br />
following areas:<br />
Negotiation with<br />
EU/legal advice.<br />
Liaison with key<br />
stakeholders and<br />
dissemination of<br />
policy.<br />
Start now.<br />
DEFRA<br />
Steering Group<br />
Effectiveness of<br />
negotiation.<br />
Clarity of policy<br />
amongst<br />
stakeholders.<br />
Peer review of<br />
satisfaction with<br />
DEFRA amongst key<br />
stakeholders.<br />
Peer review of<br />
funding<br />
management by<br />
Steering Group and<br />
HMT.<br />
SUMMARY OF KEY RECOMMENDATIONS AND ACTION PLAN<br />
133
WASTE NOT, WANT NOT<br />
Recommendation Benefits/Risks Action to By when Lead dept/ Others Measuring<br />
be taken organisation involved progress<br />
Chapter 8 – Funding<br />
and Delivery<br />
Recommendation 27:<br />
There should be a<br />
review to assess the<br />
merits of focusing<br />
responsibility for waste<br />
policy in one<br />
government<br />
department.<br />
(w)<br />
Benefits: coherence of<br />
response to EU<br />
legislation.<br />
Risks: problems during<br />
transition<br />
Undertake a study<br />
to assess the<br />
merits of focusing<br />
waste policy in<br />
one Department,<br />
including<br />
responsibility for<br />
the integration of<br />
EU Directives and<br />
regulations.<br />
Start now.<br />
Report end<br />
2003<br />
Study by<br />
Machinery of<br />
Government<br />
Secretariat.<br />
DTI/DEFRA<br />
Clearer focus for<br />
stakeholders.<br />
Joined-up policy.<br />
134
Recommendation Benefits/Risks Action to By when Lead dept/ Others Measuring<br />
be taken organisation involved progress<br />
Chapter 8 – Funding<br />
and Delivery<br />
Recommendation 28:<br />
A multi-disciplinary<br />
operational task force<br />
should be set up to<br />
help and provide<br />
advice to LAs.<br />
Benefits: provides extra<br />
support for LAs and<br />
helps to bridge the gap<br />
between central policy<br />
and local planning.<br />
Helps to ensure local<br />
plans meet central and<br />
local needs as far as<br />
possible.<br />
Helps LAs to put<br />
successful bids for funds<br />
together.<br />
Helps LAs with writing<br />
contracts.<br />
Risks: <strong>not</strong> getting right<br />
skills on taskforce and<br />
<strong>not</strong> focusing its efforts.<br />
Mitigate with careful<br />
planning.<br />
To bridge the gap<br />
between policy<br />
and delivery.<br />
To help LAs<br />
produce their<br />
plans and design<br />
their schemes.<br />
To act as a central<br />
reservoir of best<br />
practice and waste<br />
expertise.<br />
Start now –<br />
team to<br />
include:<br />
DEFRA<br />
policy<br />
representatives;<br />
<strong>Waste</strong><br />
Industry<br />
experts;<br />
LGA experts<br />
on waste;<br />
managers/<br />
contractors<br />
from<br />
successful<br />
areas;<br />
WRAP; and<br />
Community<br />
Groups.<br />
DEFRA/Task<br />
Force/LGA/<br />
WRAP<br />
<strong>Waste</strong> industry/<br />
community<br />
groups, LAs<br />
Increase in<br />
awareness of<br />
national policy.<br />
Spread of best<br />
practice.<br />
Increase in number<br />
of quality joint plans<br />
for waste<br />
management.<br />
Effective contracts in<br />
place to<br />
operationalise<br />
strategies.<br />
SUMMARY OF KEY RECOMMENDATIONS AND ACTION PLAN<br />
135
WASTE NOT, WANT NOT<br />
Recommendation Benefits/Risks Action to By when Lead dept/ Others Measuring<br />
be taken organisation involved progress<br />
Chapter 8 – Funding<br />
and Delivery<br />
Recommendation 29:<br />
The role of WRAP<br />
should be extended<br />
and additional funding<br />
allocated for waste<br />
minimisation, re-use,<br />
recycling and the<br />
development of<br />
recyclate markets.<br />
(w)<br />
Benefits: WRAP well<br />
regarded. Original role<br />
included reduction, reuse<br />
and recycling.<br />
Putting all 3 roles<br />
together ensures efforts<br />
are effectively balanced.<br />
Provide central<br />
focus for<br />
reduction, re-use<br />
and recycling<br />
activities, avoiding<br />
duplication and<br />
ensuring<br />
appropriate<br />
action.<br />
Start now.<br />
WRAP<br />
DEFRA<br />
Better and effective<br />
co-ordination of<br />
initiatives in this<br />
area.<br />
Reduction in<br />
residual waste.<br />
Increase in recycling<br />
rates.<br />
Reduction in overall<br />
amount of waste.<br />
Recommendation 30:<br />
An industry forum<br />
should be established.<br />
(w)<br />
Benefits: wider waste<br />
and municipal/waste<br />
policy drawn closer<br />
together.<br />
Better joint action by<br />
Govt/industry.<br />
Allows for joint<br />
strategy/co-disposal of<br />
waste.<br />
Provides a forum to<br />
share views on EU policy,<br />
upcoming issues etc.<br />
Municipal waste is<br />
only 28 million<br />
tonnes out of 400<br />
million. An<br />
industry forum<br />
would provide a<br />
venue to discuss<br />
wider waste<br />
measures,<br />
producer<br />
responsibility, and<br />
bring waste<br />
initiatives<br />
together.<br />
Start now.<br />
DEFRA/DTI<br />
and ESA to set<br />
up a wider<br />
waste forum<br />
CIWM, CBI,<br />
SMEs, LA<br />
representatives<br />
Creation of a wider<br />
waste strategy.<br />
Better<br />
communication of<br />
EU legislation.<br />
Scope for joint<br />
solutions/co-disposal<br />
identified.<br />
136
Recommendation Benefits/Risks Action to By when Lead dept/ Others Measuring<br />
be taken organisation involved progress<br />
Chapter 8 – Funding<br />
and Delivery<br />
Recommendation 31:<br />
DEFRA and ODPM<br />
should carry out a joint<br />
review to establish<br />
whether further fiscal<br />
incentives are needed<br />
to encourage LAs and<br />
tiers of authorities to<br />
work together more<br />
effectively<br />
Benefits: Best practice<br />
shared.<br />
Economies of scale.<br />
Faster progress.<br />
Options:<br />
Change the basis<br />
on which<br />
collection<br />
authorities pay<br />
disposal<br />
authorities to a<br />
rate per tonne;<br />
Review recycling<br />
credits and<br />
consider<br />
expanding them<br />
to incorporate<br />
waste reduction<br />
achieved by<br />
collection<br />
authorities;<br />
Now.<br />
DEFRA/ODPM<br />
LGA, LAs<br />
More LAs working in<br />
partnership.<br />
Two-tier waste<br />
management works<br />
together effectively.<br />
Building on<br />
recommendations<br />
in <strong>Waste</strong> Strategy<br />
2000; make Joint<br />
Municipal <strong>Waste</strong><br />
Strategies<br />
statutory;<br />
SUMMARY OF KEY RECOMMENDATIONS AND ACTION PLAN<br />
137
WASTE NOT, WANT NOT<br />
Recommendation Benefits/Risks Action to By when Lead dept/ Others Measuring<br />
be taken organisation involved progress<br />
Chapter 8 – Funding<br />
and Delivery<br />
Recommendation 31:<br />
(continued)<br />
Agree pooled<br />
targets between<br />
collection and<br />
disposal<br />
authorities;<br />
Give disposal<br />
authorities more<br />
control over the<br />
form in which<br />
waste is delivered;<br />
Consider the<br />
combination of<br />
two-tier waste<br />
management into<br />
a single level.<br />
Recommendation 32:<br />
ODPM and DEFRA<br />
should discuss and<br />
revise PPG10 as a<br />
priority to ensure the<br />
required facilities for<br />
recycling and residual<br />
waste management can<br />
proceed.<br />
Benefits: waste facilities<br />
required can be built.<br />
Risks: objections if<br />
planning process seen to<br />
be “unfair”.<br />
Consider whether<br />
further revisions<br />
are required to<br />
PPG10 or other<br />
planning guidance<br />
to secure delivery<br />
of waste facilities.<br />
LAs to start<br />
identifying<br />
suitable sites.<br />
Start now<br />
ODPM/DEFRA<br />
LAs<br />
% of waste facilities<br />
getting planning<br />
permission.<br />
Development of<br />
alternatives to<br />
landfill including a<br />
number of<br />
recycling/<br />
composting<br />
facilities.<br />
138
Recommendation Benefits/Risks Action to By when Lead dept/ Others Measuring<br />
be taken organisation involved progress<br />
Chapter 8 – Funding<br />
and Delivery<br />
Recommendation 33:<br />
A high level Steering<br />
Group should be set<br />
up, reporting to the<br />
Secretary of State for<br />
DEFRA, to drive<br />
forward<br />
implementation of the<br />
strategy in this report.<br />
(w)<br />
Benefits: provides multidisciplinary<br />
expertise and<br />
expert challenge to<br />
DEFRA’s work and<br />
delivery process.<br />
Drawing on SU<br />
advisory board, a<br />
group chaired by<br />
a senior external<br />
figure reporting to<br />
Secretary of State<br />
for DEFRA.<br />
Group will:<br />
• help to design/<br />
deliver policy;<br />
Start now<br />
(membership<br />
to cover key<br />
departments<br />
and waste<br />
stakeholders as<br />
SU board)<br />
DEFRA to<br />
provide<br />
facilities and<br />
Secretariat<br />
Gives continuity<br />
from the SU study.<br />
Provides expert<br />
challenge and<br />
monitoring of<br />
progress against SU<br />
recommendations.<br />
Helps to drive<br />
forward<br />
implementation.<br />
• provide peer<br />
review of<br />
delivery of<br />
strategy.<br />
Recommendation 34:<br />
ODPM and DEFRA<br />
should ensure that Best<br />
Value Indicators<br />
support waste<br />
reduction and<br />
recycling. There should<br />
be appropriate<br />
penalties and incentives<br />
for LAs to meet waste<br />
targets.<br />
Benefits: stimulates LAs<br />
to perform in this area.<br />
Risks: may discourage<br />
further some low<br />
performing LAs.<br />
Variety of options:<br />
• performance<br />
grants;<br />
• fines;<br />
• take over waste<br />
management<br />
of poor<br />
authorities.<br />
Start now<br />
DEFRA/ODPM<br />
HMT<br />
Fewer low<br />
performing<br />
authorities.<br />
Progress in low<br />
performing areas.<br />
SUMMARY OF KEY RECOMMENDATIONS AND ACTION PLAN<br />
139
ANNEX A. THE ROLE OF THE STRATEGY UNIT<br />
The Strategy Unit exists to provide the Prime<br />
Minister and government departments with a<br />
project-based capacity to look creatively at<br />
strategic long-term issues. It acts as a resource<br />
for the whole of government and tackles issues<br />
that cross public sector institutional boundaries.<br />
It was created by a merger of the Performance<br />
and Innovation Unit (PIU), the Prime Minister’s<br />
Forward Strategy Unit, and part of the Policy<br />
Studies Directorate of the Centre for<br />
Management and Policy Studies (CMPS).<br />
The unit carries out long-term strategic reviews<br />
and policy analysis, which can take several<br />
forms:<br />
●<br />
●<br />
●<br />
●<br />
long-term strategic reviews of major areas of<br />
policy;<br />
studies of cross-cutting policy issues;<br />
strategic audit; and<br />
working with departments to promote<br />
strategic thinking and improve policy making<br />
across Whitehall.<br />
Project work is carried out by mixed teams<br />
drawn from inside and outside government, the<br />
private and voluntary sectors, universities,<br />
NGOs, and local government.<br />
The director of the Unit is Geoff Mulgan. The<br />
Strategy Unit reports to the Prime Minister<br />
through the Cabinet Secretary.<br />
WASTE NOT, WANT NOT<br />
There is more information about the work of<br />
the Strategy Unit and its projects on its website:<br />
www.strategy.gov.uk<br />
140
ANNEX B. THE PROJECT TEAM, SPONSOR MINISTER<br />
AND ADVISORY GROUP<br />
This report was prepared by a multi-disciplinary<br />
team, guided by a ministerial sponsor and an<br />
Advisory Group with government and nongovernment<br />
representation.<br />
The Team<br />
The team comprised:<br />
Stephen Aldridge – Chief Economist, Strategy<br />
Unit<br />
Dr Jane Beasley (née Price) – on<br />
secondment from the Chartered Institution of<br />
<strong>Waste</strong>s Management (CIWM)<br />
Melanie Edmunds – Strategy Unit<br />
Ray Georgeson – on secondment from the<br />
<strong>Waste</strong> and Resources Action Programme (WRAP)<br />
Tom Graham – Strategy Unit<br />
Anne Hemming – on secondment from<br />
DEFRA<br />
Louise Hollingworth – on secondment from<br />
the <strong>Waste</strong> and Resources Action Programme<br />
(WRAP)<br />
Dr Paul Hollinshead – Team Leader –<br />
Strategy Unit<br />
Andrea Lee – Economist, Strategy Unit<br />
Lizzy Lomax – Economist, Strategy Unit<br />
Alison Sharp – Strategy Unit<br />
Fiona Thompson – Economist, Strategy Unit<br />
The team was assisted by Dr Mark<br />
Broomfield – Enviros Aspinwall, Philip<br />
Downing – MORI Social Research Institute,<br />
Dr Dominic Hogg – Eunomia Research and<br />
Consulting, Dr Julia Hummel – Eco<br />
Alternatives Ltd, Dr Stuart McLanaghan –<br />
Director, Associates in Industrial Ecology,<br />
Dr Julian Parfitt – WRAP, Professor Peter<br />
Tucker – University of Paisley.<br />
Sponsor Minister<br />
The work of all Strategy Unit teams is overseen<br />
by a sponsor minister; in this case it was<br />
Margaret Beckett, Secretary of State for<br />
Environment, Food and Rural Affairs.<br />
Advisory Group<br />
The team was greatly assisted by being able to<br />
draw on the experience and advice of its<br />
Advisory Group, although the report represents<br />
the views of the team and <strong>not</strong> of the Advisory<br />
Group. The team benefited from a process of<br />
consultation and review with the Advisory<br />
Group throughout the project. The group,<br />
chaired by Margaret Beckett, comprised:<br />
Michael Averill – Group Chief Executive,<br />
Shanks Group<br />
Richard Bird – DEFRA, Director, Environment,<br />
Energy and <strong>Waste</strong> Directorate<br />
Richard Brown – HMT, senior environmental<br />
official (alternate Jean-Christophe Gray)<br />
Vic Cocker – Chairman, <strong>Waste</strong> and Resources<br />
Action Programme (WRAP)<br />
Dirk Hazell – Chief Executive, Environmental<br />
Services Association<br />
Simon Hewitt – DEFRA, Head of <strong>Waste</strong><br />
Strategy<br />
ANNEX B. THE PROJECT TEAM, SPONSOR MINISTER AND ADVISORY GROUP<br />
141
Lester Hicks – ODPM, senior official on waste<br />
planning<br />
Martin Hurst – Number 10 Policy Directorate<br />
Alistair Keddie – DTI, senior environmental<br />
official (alternate Mark Downs)<br />
Paul Leinster – Director of Environmental<br />
Protection, Environment Agency (alternate<br />
Terry Coleman)<br />
Andy Moore – Community Recycling Network<br />
Robin Murray – Economist, London School of<br />
Economics<br />
Cllr Kay Twitchen – Essex County Council<br />
Support Group<br />
The team was also assisted at working level by a<br />
Support Group comprising:<br />
Andy Bond – ECT Group<br />
Terry Coleman – Environment Agency<br />
Paul Dumpleton – SITA<br />
Andrew Price – Planning Officers’ Society<br />
Stuart Reynolds – Norfolk Environmental<br />
<strong>Waste</strong> Services Ltd<br />
Dr Tom Simpson – ODPM<br />
Graham Tombs – New Forest District Council<br />
John Turner – VALPAK<br />
John Twitchen – Cory Environmental<br />
Dr Michael Waring – Department of Health<br />
Janet Westmoreland – Kirklees Metropolitan<br />
Council<br />
Workshop attendees<br />
The team was also assisted by being able to<br />
draw on the experience and advice of a number<br />
of experts and stakeholders who attended<br />
workshops associated with the project or<br />
bilateral discussions with the team. A full list of<br />
workshops, and of the attendees, is available on<br />
request from the Strategy Unit.<br />
Paul Dunn – Stockport Metropolitan Borough<br />
Council<br />
Mike Frizoni – London Borough of Bexley<br />
Peter Gerstrom – Cleanaway<br />
Dr Jane Gilbert – Composting Association<br />
Ray Greenall – Hertfordshire County Council<br />
Graham Harding – Lancashire County Council<br />
Barbara Herridge – <strong>Waste</strong> Watch<br />
Ross Hilliard – Shanks Group<br />
David Hutchinson – Greater London Authority<br />
Merlin Hyman – Environmental Industries<br />
Commission<br />
WASTE NOT, WANT NOT<br />
Peter Jones – Biffa<br />
Pat Kilbey – DEFRA<br />
Sheila McKinley – DEFRA<br />
142
ANNEX C. WIDER WASTES<br />
Summary<br />
The SU report has focussed on municipal waste and its diversion from<br />
landfill sites. However municipal waste accounts for only 28 million<br />
tonnes out of a total of 400 million tonnes of waste generated each year.<br />
A consultant 142 engaged by the SU prepared an overview of the key<br />
issues raised by wider wastes, specifically focusing on hazardous waste<br />
and industrial waste. For these waste streams, the Government’s role is<br />
setting the right economic and regulatory framework, ensuring policy is<br />
both clear and effectively disseminated and that facilities are well<br />
regulated.<br />
The Government has set a target for 2005, to reduce the amount of<br />
industrial and commercial waste sent to landfill to 85% of that landfilled<br />
in 1998. 143 There are no specific targets for reducing or recycling<br />
hazardous waste, although the Government is committed to reducing the<br />
quantity and hazardous nature of this waste stream, and the Landfill<br />
Directive now requires pre-treatment and imposes bans for specific<br />
materials.<br />
In general, management of much of the commercial and industrial waste<br />
stream is more sustainable than the municipal waste stream, with around<br />
51% going to landfill and recycling rates at around 30% or more.<br />
However, there is still significant scope for improvement.<br />
142<br />
Dr Jane Beasley (née Price), Chartered Institution of <strong>Waste</strong>s Management<br />
143<br />
<strong>Waste</strong> Strategy 2000 op.cit<br />
ANNEX C. WIDER WASTES<br />
143
WASTE NOT, WANT NOT<br />
The conclusions of the overview are: Landfill Directive obligations and national<br />
●<br />
●<br />
One of the major factors holding back<br />
effective policy making in these wider waste<br />
streams is a lack of data on quantities,<br />
composition, growth rates, and impacts on<br />
the environment. Improving data on wider<br />
waste streams should be a priority for the<br />
Environment Agency to focus on.<br />
There is a case for government to build on its<br />
work on wider wastes in <strong>Waste</strong> Strategy 2000<br />
so that the approaches to, and<br />
recommendations for managing municipal<br />
waste can be examined alongside wider<br />
waste issues. This will enable identification of<br />
common solutions and opportunities for joint<br />
management of waste streams.<br />
Correspondingly DTI and DEFRA should work<br />
closely on the issue of wider wastes.<br />
It is recommended that:<br />
●<br />
DEFRA, and the EA should design a project to<br />
produce quality data on wider wastes,<br />
growth rates, impacts and the capacity of the<br />
waste industry to manage them (linked to<br />
recommendation 20, chapter 7).<br />
● The industry forum (recommendation 30)<br />
should play a central role in the future<br />
development of policy for wider wastes.<br />
It should consider the potential for joint<br />
disposal of waste (disposing of waste streams<br />
in common facilities) and whether additional<br />
economic and regulatory measures are<br />
required to manage these streams. This work<br />
can be taken forward in the industry forum<br />
(refer to recommendation 30).<br />
Wider Controlled <strong>Waste</strong> Issues<br />
Whilst the focus of the detailed analysis in this<br />
report has been municipal solid waste,<br />
specifically in the context of the European<br />
recycling targets, consideration also needs to be<br />
given to wider controlled waste issues. 144 Over<br />
the next few years European legislation and<br />
policy will have a significant effect on<br />
management practices for all controlled waste.<br />
These legislative pressures include the Landfill<br />
Directive, Hazardous <strong>Waste</strong> Directive, <strong>Waste</strong><br />
from Electronic and Electrical Equipment<br />
Directive, Packaging Directive, <strong>Waste</strong><br />
Incineration Directive, <strong>Waste</strong> Oils Directive, End<br />
of Life Vehicles Directive, and the proposed<br />
Directive on Batteries. In addition there may be<br />
scope to develop economies of scale or more<br />
effective joint approaches for tackling municipal<br />
and wider wastes together.<br />
1. Hazardous <strong>Waste</strong><br />
This waste stream urgently needs to be tackled<br />
as it is specifically targeted for diversion in the<br />
Landfill Directive. The actual amounts may <strong>not</strong><br />
be large (approximately 4.5 million tonnes<br />
produced in 1999) but this is a potentially<br />
problematic waste stream.<br />
In terms of improving the management of this<br />
waste stream, a number of specific needs have<br />
been identified:<br />
●<br />
●<br />
●<br />
clarification of the constituents of the<br />
hazardous waste stream (including household<br />
hazardous waste);<br />
clear understanding of the acceptance criteria<br />
for such wastes so that industry can plan<br />
appropriately;<br />
an assessment of existing and planned<br />
capacity for hazardous waste management,<br />
to establish if a shortfall exists and therefore<br />
whether specific actions need to be taken. A<br />
decision on whether a strategy for hazardous<br />
waste is required could be taken following<br />
this work;<br />
144<br />
In this case to include hazardous, commercial, industrial, construction and demolition waste. Agricultural waste is <strong>not</strong> considered by<br />
the SU review as this is already under study by DEFRA.<br />
144
●<br />
●<br />
●<br />
●<br />
●<br />
consideration of the potential for fly-tipping<br />
of hazardous waste to increase as costs rise<br />
and how this would be managed;<br />
working with industry to look at how<br />
hazardous waste can be reduced through<br />
producer responsibility. More hazardous<br />
waste (e.g. waste oils) could also be recycled;<br />
setting targets for individual key hazardous<br />
waste streams; 145<br />
carrying out a review of product taxation as<br />
an instrument to reduce specific hazardous<br />
components of the waste stream;<br />
working with local authorities to look at the<br />
feasibility of separately collecting household<br />
hazardous waste, how this might be done;<br />
and the opportunities for co-disposal with<br />
industry.<br />
The SU welcomes and supports DEFRA’s<br />
decision to have a hazardous waste forum. In<br />
addition, a number of specific<br />
recommendations have been made in this<br />
report to address the needs identified and can<br />
be found in the table, ‘Summary of Key<br />
Recommendations and Action Plan: Wider<br />
<strong>Waste</strong>s’ attached to this annex.<br />
2. Construction & Demolition <strong>Waste</strong><br />
The quantities of Construction and Demolition<br />
(C & D) waste arising each year are estimated<br />
to be 90 146 million tonnes and 72.5 147 millions<br />
tonnes respectively for England & Wales. The<br />
total is greater than both the municipal and<br />
commercial waste streams combined. C & D<br />
wastes have recently been the subject of a<br />
significant data collection exercise (Spring 2000)<br />
for the Environment Agency. 148 The exercise<br />
undertaken by Symonds gives data on the<br />
estimated arisings of wastes from construction<br />
and demolition on a regional and national level<br />
for England & Wales, as well as the amounts<br />
recycled, re-used and disposed. In 2000, 35% of<br />
C&D waste was recycled, 13% was re-used on<br />
licensed landfill sites, and 28% was spread on<br />
sites registered as exempt from waste<br />
management licensing. 149 Only 24% was<br />
landfilled.<br />
The principle wastes in this stream are soil,<br />
ballast, concrete, asphalt, bricks, tiles, plaster,<br />
masonry, wood, metal, paper, glass and plastic.<br />
This is an area where a combination of landfill<br />
tax and the more recently implemented<br />
aggregates levy have been important tools in<br />
boosting recycling and re-use. Around half the<br />
construction and demolition wastes in England<br />
and Wales are re-used or recycled according to<br />
a recent UK Government study. 150 It is<br />
anticipated that further progress in this area<br />
would come through recommendations of the<br />
Egan 151 report to improve productivity and a<br />
review of standards to ensure that artificial<br />
barriers to use of secondary aggregates were<br />
<strong>not</strong> reducing progress. Overall however, this<br />
appears to be an area where significant progress<br />
is being made.<br />
The European Commission, in its working<br />
document on Construction and Demolition<br />
waste, suggested that Member <strong>States</strong> should<br />
aim towards combined recycling and re-use<br />
targets of 50-75% by 2005 and 70-85% by<br />
2010.<br />
145<br />
<strong>Waste</strong> Strategy 2000<br />
146<br />
BDS Marketing & Research<br />
147<br />
Symonds, Construction and Demolition <strong>Waste</strong> Survey, R&D Technical Summary PS368, (2001)<br />
148<br />
Environment Agency, Construction and Demolition <strong>Waste</strong> Survey, Research & Development Technical Report P402, (May 2001)<br />
ISBN 1 85705 450 4<br />
149<br />
Environment Agency data for England and Wales<br />
150<br />
ODPM, Construction and Demolition <strong>Waste</strong> Survey: England and Wales1999/2000, (2001)<br />
151<br />
DTI, Rethinking Construction, Report of the Construction Task Force to the Deputy Prime Minister, (July 1998)<br />
ANNEX C. WIDER WASTES<br />
145
WASTE NOT, WANT NOT<br />
146<br />
3. Commercial & Industrial <strong>Waste</strong><br />
Approximately 30 million tonnes of commercial<br />
waste, and 48 million tonnes of industrial waste<br />
was produced in England and Wales in<br />
1998/99. 152 From that total 36% was recycled<br />
and 54% was disposed of to landfill.<br />
Business and industry will opt for the most cost<br />
effective way to manage their waste stream and<br />
the interest taken in recycling and waste<br />
minimisation activities will largely depend on<br />
quantities of waste produced, market availability<br />
and impact of activities upon their final waste<br />
bill. Instruments such as the landfill tax have <strong>not</strong><br />
necessarily achieved the desired effect of<br />
diversion from landfill due to the level of<br />
taxation <strong>not</strong> being set high enough. In addition,<br />
as a result of resource and time constraints, it is<br />
the larger companies, multinationals, or those<br />
operating within an environmental remit that<br />
are more likely to consider different waste<br />
management options and incorporate recycling<br />
strategies. Essentially the drivers in this instance<br />
are <strong>not</strong> just economic but also external relations<br />
with the stakeholders. It is possible that further<br />
advancements can be made in this waste stream<br />
with the right levers for change.<br />
There are particular problems with changing<br />
behaviour in the SME sector. SMEs and the<br />
smaller waste generators are more likely to have<br />
less knowledge of their waste production and<br />
management and will simply have opted for the<br />
cheapest collection service available, or simply<br />
utilise the services of a waste management<br />
company they are familiar with or have had<br />
recommended. It is then entirely dependent<br />
upon the services offered by that waste<br />
management company in terms of the options<br />
for managing the waste generated. There is<br />
little or no incentive for SMEs to make the<br />
necessary investment in alternative waste<br />
management options, particularly in relation to<br />
152<br />
<strong>Waste</strong> Strategy 2000<br />
153<br />
<strong>Waste</strong> Strategy 2000<br />
154<br />
For example, Denmark, Netherlands, Norway and Sweden<br />
time and resources, to bring about a change in<br />
waste practices.<br />
As individual organisations, SMEs may be<br />
producing low levels of waste, but collectively<br />
they will be contributing a significant quantity<br />
to landfill for disposal. This could pose<br />
significant problems in the future if the UK is<br />
forced to readdress its definition of Municipal<br />
Solid <strong>Waste</strong>, which is contrary to the definition<br />
in use by a number of European countries, who<br />
include a significant quantity of commercial<br />
waste from SMEs and other small producers.<br />
Currently, no incentive exists for local authorities<br />
to target commercial operations for the<br />
recovery of materials. However there is potential<br />
for combining paper and cardboard collections<br />
from household sources with business parks &<br />
trading estates: thus potentially making<br />
household recyclables collection more<br />
economically viable. This is done in other<br />
nations such as the Netherlands and should be<br />
considered here.<br />
The use of tools such as mandatory<br />
environmental reporting (currently a voluntary<br />
initiative) could be considered as an approach<br />
to changing behaviour within the business<br />
sector. In 2000, the Government set a policy to<br />
encourage the top 350 companies to report on<br />
their environmental performance by the end of<br />
2001. 153 However the response from business<br />
and industry to date has been limited. A<br />
number of other European countries 154 have<br />
implemented mandatory environmental<br />
reporting aimed at specific sectors or companies<br />
of a certain size. Clear guidelines would need to<br />
be established as to the content and specifically<br />
the waste management element of the report, if<br />
it is to have the desired effect of changing<br />
waste management practices. The intention is<br />
that with the publishing of an environmental<br />
report, a company becomes more aware of its
waste generation and practices, and sets targets<br />
for the following year – in effect the report acts<br />
as an internal benchmark. Further work would<br />
be needed to assess if mandatory environmental<br />
reporting would be workable and yield<br />
significant benefits without imposing an<br />
additional burden on business. In the interim<br />
further encouragement should be given to<br />
voluntary take up of such environmental<br />
performance monitoring.<br />
The wider development of both <strong>Waste</strong><br />
Minimisation Clubs 155 and <strong>Waste</strong> Exchanges 156<br />
is an opportunity for providing commercial and<br />
industrial waste producers with a<strong>not</strong>her<br />
approach to increase awareness, change inhouse<br />
practices, and divert more material away<br />
from waste disposal options. There are<br />
approximately 100 active clubs across the UK<br />
and Envirowise is involved with them all to<br />
some extent. There is considerable scope to<br />
extend the number of clubs in operation and<br />
therefore increase the number of companies<br />
participating. In addition, the number of waste<br />
exchanges currently operating is minimal and<br />
the quantities of waste being re-used and<br />
recycled through these networks is limited,<br />
therefore there is potential to increase their role.<br />
The Environment Agency has set itself a policy<br />
to push waste exchanges and facilitate<br />
networks; however there has been limited<br />
evidence of progress to date and this area needs<br />
more work.<br />
A number of specific key barriers to greater<br />
action on this waste stream have been identified<br />
as:<br />
●<br />
●<br />
●<br />
●<br />
a lack of good data on waste arisings (see<br />
recommendation 20);<br />
a lack of sufficient economic incentives to<br />
recycle: the landfill tax is too low (see<br />
recommendation 11);<br />
a lack of extensive voluntary targets to<br />
encourage reduction and recycling of<br />
commercial and industrial waste, plus a lack<br />
of appreciation whether statutory targets<br />
would be appropriate; and<br />
a lack of awareness at the SME level of<br />
sustainable waste management practices<br />
(refer to recommendation 19).<br />
A number of specific recommendations have<br />
been made to address the key barriers and<br />
specific needs identified in this annex. Details<br />
can be found in the attached table ‘Summary of<br />
Key Recommendations and Action Plan: Wider<br />
<strong>Waste</strong>s’.<br />
155<br />
Aire and Calder and Project Catalyst, both demonstration projects in the early 1990’s, supported by government, showed<br />
considerable financial savings largely as a result of waste minimisation<br />
156<br />
<strong>Waste</strong> exchanges – where details of waste that may be used by others are available and can be exchanged<br />
ANNEX C. WIDER WASTES<br />
147
WASTE NOT, WANT NOT<br />
Annex C: Summary of Key Recommendations and Action Plan: Wider <strong>Waste</strong>s<br />
Recommendation Benefits/Risks Action to By when Lead dept/ Others Measuring<br />
be taken organisation involved progress<br />
HAZARDOUS WASTE<br />
B = Benefits.<br />
R = Risks.<br />
Ensure clear definition of all<br />
hazardous waste (including<br />
household) is developed and<br />
disseminated.<br />
B – clarity and time to<br />
plan.<br />
Clear list<br />
disseminated to all<br />
stakeholders.<br />
2003<br />
DEFRA<br />
EA<br />
Measures in place to<br />
manage hazardous<br />
waste.<br />
Assess existing and planned<br />
capacity for hazardous waste<br />
management.<br />
B – identify shortfall and<br />
time to plan.<br />
R – difficult to get data<br />
& information.<br />
Develop &<br />
implement data<br />
collection.<br />
2003<br />
DEFRA<br />
EA/Chemical<br />
Industry<br />
Association/ESA<br />
Sufficient capacity in<br />
place to meet<br />
requirements.<br />
Assess the potential for<br />
flytipping in light of legislative<br />
requirements.<br />
B – ensure effective<br />
management of<br />
hazardous waste.<br />
Examine the need<br />
for increased<br />
regulation and<br />
enforcement.<br />
2003<br />
EA<br />
Measures in place to<br />
manage flytipping.<br />
Hazardous <strong>Waste</strong> Forum.<br />
B – proactive approach<br />
to overcoming barriers<br />
and proposing solutions.<br />
Exchange of<br />
information and<br />
good practice.<br />
2003<br />
DEFRA + key<br />
stakeholders<br />
CBI, CIA, SMEs,<br />
ESA, LAs, EA<br />
Co-ordinated<br />
approach towards<br />
the development of<br />
more sustainable<br />
management<br />
practices.<br />
148
Annex C: Summary of Key Recommendations and Action Plan: Wider <strong>Waste</strong>s (continued)<br />
Recommendation Benefits/Risks Action to By when Lead dept/ Others Measuring<br />
be taken organisation involved progress<br />
COMMERCIAL &<br />
INDUSTRIAL WASTE<br />
Explore the potential for<br />
supporting the wider<br />
development of waste<br />
exchanges.<br />
B – industry led diversion<br />
of waste from landfill.<br />
R – take-up may be<br />
small.<br />
Good practice<br />
dissemination,<br />
including<br />
operational<br />
guidance and<br />
standards.<br />
2003<br />
DTI/DEFRA/<br />
Envirowise<br />
CBI, SMEs<br />
Diversion of waste<br />
from landfill,<br />
increased re-use and<br />
recycling.<br />
Consider the value of<br />
mandatory environmental<br />
reporting.<br />
B – improved in-house<br />
environmental practices.<br />
R – expertise may be<br />
lacking in some<br />
businesses to complete<br />
an environmental report.<br />
Establish<br />
effectiveness of<br />
voluntary approach<br />
to environmental<br />
reporting and<br />
assess costs/<br />
benefits of<br />
implementing a<br />
mandatory<br />
programme.<br />
2003<br />
DTI/DEFRA/<br />
Envirowise<br />
EA, CBI, SMEs<br />
Higher standards of<br />
operation and<br />
increased awareness<br />
of waste generation<br />
and management.<br />
Increase in the<br />
number of<br />
environmental<br />
reports produced.<br />
Increase the role of <strong>Waste</strong><br />
Minimisation Clubs.<br />
B – greater awareness of<br />
waste minimisation,<br />
particularly amongst the<br />
SMEs.<br />
Increase<br />
awareness of<br />
<strong>Waste</strong><br />
Minimisation<br />
Clubs and<br />
promote their<br />
benefits.<br />
2003<br />
DTI/DEFRA/<br />
Envirowise<br />
CBI, SMEs<br />
Improved waste<br />
management,<br />
particularly in SME<br />
sector.<br />
ANNEX C. WIDER WASTES<br />
149
WASTE NOT, WANT NOT<br />
Annex C: Summary of Key Recommendations and Action Plan: Wider <strong>Waste</strong>s (continued)<br />
Recommendation Benefits/Risks Action to By when Lead dept/ Others Measuring<br />
be taken organisations involved progress<br />
COMMERCIAL &<br />
INDUSTRIAL WASTE<br />
(continued)<br />
Consider the use of statutory<br />
targets for commercial and<br />
industrial waste.<br />
Consider increasing targets<br />
after 2005.<br />
B – enforceable<br />
requirement to divert<br />
material away from<br />
disposal<br />
R – baseline date against<br />
which targets set may<br />
<strong>not</strong> be accurate. Markets<br />
may <strong>not</strong> be adequate to<br />
accommodate increase<br />
in materials available.<br />
Examine potential<br />
opportunities,<br />
incentives and<br />
barriers to waste<br />
minimisation, reuse<br />
and recycling.<br />
2005 –<br />
review<br />
against<br />
progress<br />
and the<br />
success of<br />
<strong>Waste</strong><br />
Strategy<br />
2000 target<br />
for<br />
commercial<br />
and<br />
industrial<br />
waste.<br />
DEFRA/DTI<br />
CBI/SMEs/<br />
WRAP, EA<br />
Strategy developed<br />
regarding the use of<br />
targets for reducing<br />
disposal of<br />
commercial and<br />
industrial waste.<br />
150
ANNEX D. GLOSSARY OF TERMS<br />
Active waste –a term used to differentiate<br />
between the upper and lower rate of landfill<br />
tax, essentially referring to biodegradable<br />
material<br />
Aggregates – granular material used in<br />
construction<br />
Anaerobic digestion – a process where<br />
biodegradable material is encouraged to break<br />
down in the absence of oxygen. Material is<br />
placed into an enclosed vessel and in controlled<br />
conditions the waste breaks down into digestate<br />
and biogas<br />
Basel Convention – the 1989 United Nations<br />
Basel Convention on the control of<br />
transboundary movements of hazardous wastes<br />
and their disposal provides a framework for a<br />
global system of controls on international<br />
movements of hazardous and certain other<br />
wastes<br />
Best Practicable Environmental Option<br />
(BPEO) – a BPEO is the outcome of a<br />
systematic and consultative decision-making<br />
procedure which emphasises the protection and<br />
conservation of the environment across land, air<br />
and water. The BPEO procedure establishes, for<br />
a given set of objectives, the option that<br />
provides the most benefits or the least damage<br />
to the environment as a whole, at acceptable<br />
cost, in the long term as well as in the short<br />
term<br />
Best Value – places a duty on local authorities<br />
to deliver services (including waste collection<br />
and waste disposal management) to clear<br />
standards – covering both cost and quality – by<br />
the most effective, economic and efficient<br />
means available<br />
Bring site – A localised collection point for<br />
recyclates, e.g. glass, paper and cans<br />
Bulky <strong>Waste</strong> – waste which exceeds 25kg or<br />
any article that does <strong>not</strong> fit into a receptacle<br />
provided for householders, or if no receptacle is<br />
provided, a cylindrical container of 750mm in<br />
diameter and 1 metre high<br />
CBI – Confederation of British Industry<br />
Central composting – large-scale schemes<br />
which handle kitchen and garden waste from<br />
households and which may also accept suitable<br />
waste from parks and gardens<br />
Civic amenity waste – a sub-group of<br />
household waste, normally delivered by the<br />
public direct to sites provided by the local<br />
authority. Consists generally of bulky items such<br />
as beds, cookers and garden waste as well as<br />
recyclables<br />
CIWM – Chartered Institution of <strong>Waste</strong>s<br />
Management<br />
Clinical waste – waste arising from medical,<br />
nursing, dental, veterinary, pharmaceutical or<br />
similar practices, which may present risks of<br />
infection<br />
Combined Heat and Power – a highly fuel<br />
efficient technology which produces electricity<br />
and heat from a single facility<br />
Commercial waste – waste arising from<br />
premises which are used wholly or mainly for<br />
trade, business, sport, recreation or<br />
entertainment, excluding municipal and<br />
industrial waste<br />
ANNEX D. GLOSSARY OF TERMS<br />
151
WASTE NOT, WANT NOT<br />
152<br />
Community sector – including charities,<br />
campaign organisations and <strong>not</strong>-for-profit<br />
companies<br />
Composting – an aerobic, biological process in<br />
which organic wastes, such as garden and<br />
kitchen waste are converted into a stable<br />
granular material which can be applied to land<br />
to improve soil structure and enrich the nutrient<br />
content of the soil<br />
Construction and demolition waste –<br />
arises from the construction, repair,<br />
maintenance and demolition of buildings and<br />
structures. It mostly includes brick, concrete,<br />
hardcore, subsoil and topsoil, but it can also<br />
contain quantities of timber, metal, plastics and<br />
(occasionally) special (hazardous) waste<br />
materials<br />
Controlled waste – comprised of household,<br />
industrial, commercial and clinical waste which<br />
require a waste management licence for<br />
treatment, transfer or disposal. The main<br />
exempted categories comprise mine, quarry and<br />
farm wastes. Radioactive and explosive wastes<br />
are controlled by other legislation and<br />
procedures<br />
Decoupling – removal of the linkage between<br />
economic growth and environmental damage<br />
DEFRA – Department for the Environment,<br />
Food and Rural Affairs<br />
Delivery structures – mechanisms or<br />
frameworks to achieve the desired outcomes<br />
Dredged spoils – sediments left over from<br />
dredging operation from estuaries or coastal<br />
areas<br />
DTI – Department of Trade and Industry<br />
Duty of Care – applies to anyone who<br />
imports, produces, carries, keeps, treats or<br />
disposes of waste. Everyone subject to the duty<br />
of care has a legal obligation to comply with it<br />
and there are severe penalties for failing to do<br />
so. The Duty of Care does <strong>not</strong> apply to waste<br />
collection from households<br />
EC Directive – a European Community legal<br />
instruction, which is binding on all Member<br />
<strong>States</strong>, but must be implemented through the<br />
legislation of national governments within a<br />
prescribed timescale<br />
Eco-design – the process of producing more<br />
goods using fewer resources and causing less<br />
pollution, both in manufacturing and disposal<br />
ELV – End of Life Vehicle: a vehicle which is<br />
waste within the meaning of Article 1 of the<br />
<strong>Waste</strong> Framework Directive<br />
Energy recovery from waste – includes a<br />
number of established and emerging<br />
technologies, though most energy recovery is<br />
through incineration technologies. Many wastes<br />
are combustible, with relatively high calorific<br />
values – this energy can be recovered through<br />
(for instance) incineration with electricity<br />
generation<br />
Environment Agency (EA) – established in<br />
April 1996, combining the functions of former<br />
local waste regulation authorities, the National<br />
Rivers Authority and Her Majesty’s Inspectorate<br />
of Pollution. Intended to promote a more<br />
integrated approach to waste management and<br />
consistency in waste regulation. The Agency<br />
also conducts national surveys of waste arisings<br />
and waste facilities<br />
Envirowise – aims to demonstrate the benefits<br />
of managing resource use and reducing<br />
environmental impact to companies across the<br />
whole of the UK<br />
ESA – Environmental Services Association<br />
Feedstock – raw material required for a<br />
process<br />
Gasification – The thermal breakdown of<br />
hydrocarbons into a gas via partial oxidation<br />
under the application of heat
Green waste – Vegetation and plant matter<br />
from household gardens, local authority parks<br />
and gardens and commercial landscaped<br />
gardens<br />
Home composting – compost can be made at<br />
home using a traditional compost heap, a<br />
purpose designed container, or a wormery<br />
Household waste – this includes waste from<br />
household collection rounds, waste from<br />
services such as street sweepings, bulky waste<br />
collection, litter collection, hazardous household<br />
waste collection and separate garden waste<br />
collection, waste from civic amenity sites and<br />
wastes separately collected for recycling or<br />
composting through bring or drop-off schemes,<br />
kerbside schemes and at civic amenity sites<br />
Incineration – is the controlled burning of<br />
waste, either to reduce its volume, or its<br />
toxicity. Energy recovery from incineration can<br />
be made by utilising the calorific value of paper,<br />
plastic, etc. to produce heat or power. Current<br />
flue-gas emission standards are very high. Ash<br />
residues still tend to be disposed of to landfill<br />
Integrated Planning Pollution and<br />
Control (IPPC) – is designed to prevent or,<br />
where that is <strong>not</strong> possible, to reduce pollution<br />
from a range of industrial and other<br />
installations, including some waste management<br />
facilities, by means of integrated permitting<br />
processes based on the application of best<br />
available techniques<br />
In-vessel (composting) – this is the<br />
controlled biological decomposition and<br />
stabilisation of organic material in vessels that<br />
are usually enclosed affording an enhanced level<br />
of process and emission control<br />
Kerbside collection – any regular collection<br />
of recyclables from premises, including<br />
collections from commercial or industrial<br />
premises as well as from households. Excludes<br />
collection services delivered on demand<br />
Land use planning – the Town and Country<br />
Planning system regulates the development and<br />
use of land in the public interest, and has an<br />
important role to play in achieving sustainable<br />
waste management<br />
Industrial waste – waste from any factory and<br />
from any premises occupied by an industry<br />
(excluding mines and quarries)<br />
Inert waste – waste which, when deposited<br />
into a waste disposal site, does <strong>not</strong> undergo any<br />
significant physical, chemical or biological<br />
transformations and which complies with the<br />
criteria set out in Annex III of the EC Directive<br />
on the Landfill of <strong>Waste</strong><br />
Integrated waste management – involves a<br />
number of key elements, including: recognising<br />
each step in the waste management process as<br />
part of a whole; involving all key players in the<br />
decision-making process; and utilising a mixture<br />
of waste management options within the locally<br />
determined sustainable waste management<br />
system<br />
Landfill sites – are areas of land in which<br />
waste is deposited. Landfill sites are often<br />
located in disused quarries or mines. In areas<br />
where there are limited, or no ready-made<br />
voids, the practice of landraising is sometimes<br />
carried out, where some or all of the waste is<br />
deposited above ground, and the landscape is<br />
contoured<br />
Landspreading – is the spreading of certain<br />
types of waste onto agricultural land for soil<br />
conditioning purposes. Sewage sludge and<br />
wastes from the food, brewery and paper pulp<br />
industries can be used for this purpose<br />
LAs – Local Authorities<br />
LGA – Local Government Association<br />
ANNEX D. GLOSSARY OF TERMS<br />
153
WASTE NOT, WANT NOT<br />
154<br />
Licensed site – a waste disposal or treatment<br />
facility which is licensed under the<br />
Environmental Protection Act for that function<br />
Life cycle assessment – can provide a basis<br />
for making strategic decisions on the ways in<br />
which particular wastes in a given set of<br />
circumstances can be most effectively managed,<br />
in line with the principles of the Best Practicable<br />
Environmental Option, the <strong>Waste</strong> Hierarchy and<br />
the proximity principle<br />
MORI – Market & Opinion Research<br />
International<br />
Minimisation – see reduction<br />
Mineral voids – spaces available through<br />
mining or quarrying activities<br />
Municipal waste – this includes household<br />
waste and any other wastes collected by a<br />
<strong>Waste</strong> Collection Authority, or its agents, such<br />
as municipal parks and gardens waste, beach<br />
cleansing waste, commercial or industrial waste,<br />
and waste resulting from the clearance of flytipped<br />
materials<br />
ODPM – Office of the Deputy Prime Minister<br />
OGC – Office of Government Commerce<br />
Open windrow (composting) –<br />
biodegradable waste is arranged into long, low,<br />
rows and turned periodically to aerate waste as<br />
it degrades<br />
Planning Policy Guidance Notes (PPGs)<br />
and Mineral Planning Guidance Notes<br />
(MPGs) – Government Policy Statements on a<br />
variety of planning issues, including waste<br />
planning issues, to be taken as material<br />
considerations, where relevant, in deciding<br />
planning applications<br />
Producer responsibility – is about producers<br />
and others involved in the distribution and sale<br />
of goods taking greater responsibility for those<br />
goods at the end of the product’s life<br />
Proximity principle – suggests that waste<br />
should generally be disposed of as near to its<br />
place of production as possible<br />
Putrescible – material with a tendency to<br />
decay, e.g. biodegradable material such as<br />
garden and kitchen waste<br />
Pyrolysis – process in which organic waste is<br />
heated in the absence of oxygen to produce a<br />
mixture of gaseous and liquid fuels and a solid<br />
inert residue<br />
Recycling – involves the reprocessing of<br />
wastes, either into the same product or a<br />
different one. Many non-hazardous industrial<br />
wastes such as paper, glass, cardboard, plastics<br />
and scrap metals can be recycled. Special<br />
wastes, such as solvents can also be recycled by<br />
specialist companies, or by in-house equipment<br />
Reduction – achieving as much waste<br />
reduction as possible is a priority action.<br />
Reduction can be accomplished within a<br />
manufacturing process involving the review of<br />
production processes to optimise utilisation of<br />
raw (and secondary) materials and recirculation<br />
processes. It can be cost effective, both in terms<br />
of lower disposal costs, reduced demand for raw<br />
materials and energy costs. It can be carried out<br />
by householders through actions such as home<br />
composting, reusing products and buying<br />
goods with reduced packaging<br />
Re-use – can be practised by the commercial<br />
sector with the use of products designed to be<br />
used a number of times, such as reusable<br />
packaging. Householders can purchase products<br />
that use refillable containers, or re-use plastic<br />
bags. The processes contribute to sustainable<br />
development and can save raw materials,<br />
energy and transport costs<br />
DTI’s Renewables Obligation – this was<br />
introduced in 2002 and creates a market in<br />
tradable renewable energy certificates for which<br />
each supplier of electricity must demonstrate<br />
compliance with increasing government targets<br />
for renewable electricity generation
Ring fenced (funds) – a method of allocating<br />
or reserving funds for a specific purpose or<br />
activity<br />
Self-sufficiency – dealing with wastes within<br />
the region or country where they arise<br />
Separate collection – kerbside schemes<br />
where materials for recycling are collected either<br />
by a different vehicle or at a different time to<br />
the ordinary household waste collection<br />
Special waste – is defined by the Special<br />
<strong>Waste</strong> Regulations 1996<br />
Sustainable development – development<br />
which is sustainable is that which can meet the<br />
needs of the present without compromising the<br />
ability of future generations to meet their own<br />
needs<br />
Sustainable waste management – means<br />
using material resources efficiently, to cut down<br />
on the amount of waste we produce. And<br />
where waste is generated, dealing with it in a<br />
way that actively contributes to the economic,<br />
social and environmental goals of sustainable<br />
development<br />
<strong>Waste</strong> arisings – the amount of waste<br />
generated in a given locality over a given period<br />
of time<br />
<strong>Waste</strong> Collection Authority – a local<br />
authority charged with the collection of waste<br />
from each household in its area on a regular<br />
basis. Can also collect, if requested, commercial<br />
and industrial wastes from the private sector<br />
<strong>Waste</strong> Disposal Authority – a local authority<br />
charged with providing disposal sites to which it<br />
directs the <strong>Waste</strong> Collection Authorities for the<br />
disposal of their controlled waste, and with<br />
providing civic amenity facilities<br />
<strong>Waste</strong> Hierarchy – suggests that: the most<br />
effective environmental solution may often be<br />
to reduce the amount of waste generated –<br />
reduction; where further reduction is <strong>not</strong><br />
practicable, products and materials can<br />
sometimes be used again, either for the same or<br />
a different purpose – re-use; failing that, value<br />
should be recovered from waste, through<br />
recycling, composting or energy recovery from<br />
waste; only if none of the above offer an<br />
appropriate solution should waste be disposed of<br />
Treatment – involves the chemical or<br />
biological processing of certain types of waste<br />
for the purposes of rendering them harmless,<br />
reducing volumes before landfilling, or recycling<br />
certain wastes<br />
Unitary Authority – a local authority which<br />
has the responsibilities of both <strong>Waste</strong> Collection<br />
and <strong>Waste</strong> Disposal Authorities<br />
<strong>Waste</strong> – is the wide ranging term<br />
encompassing most un<strong>want</strong>ed materials and is<br />
defined by the Environmental Protection Act<br />
1990. <strong>Waste</strong> includes any scrap material,<br />
effluent or un<strong>want</strong>ed surplus substance or<br />
article which requires to be disposed of because<br />
it is broken, worn out, contaminated or<br />
otherwise spoiled. Explosives and radioactive<br />
wastes are excluded<br />
<strong>Waste</strong> management industry – the<br />
businesses (and <strong>not</strong>-for-profit organisations)<br />
involved in the collection, management and<br />
disposal of waste<br />
<strong>Waste</strong> management licencing – licences are<br />
required by anyone who proposes to deposit,<br />
recover or dispose of waste. The licencing<br />
system is separate from, but complementary to,<br />
the land use planning system. The purpose of a<br />
licence and the conditions attached to it is to<br />
ensure that the waste operation which it<br />
authorises is carried out in a way which protects<br />
the environment and human health<br />
<strong>Waste</strong> streams – <strong>Waste</strong> generated from<br />
different sources<br />
ANNEX D. GLOSSARY OF TERMS<br />
155
<strong>Waste</strong> Strategy 2000 – Government vision of<br />
sustainable waste management in England and<br />
Wales until 2020 (Wales has subsequently<br />
produced its own strategy)<br />
<strong>Waste</strong> transfer station – a site to which<br />
waste is delivered for sorting prior to transfer to<br />
a<strong>not</strong>her place for recycling, treatment or<br />
disposal<br />
WEEE – <strong>Waste</strong> Electrical and Electronic<br />
Equipment<br />
WRAP – <strong>Waste</strong> and Resources Action<br />
Programme<br />
WASTE NOT, WANT NOT<br />
156
Strategy Unit<br />
Cabinet Office<br />
Fourth Floor<br />
Admiralty Arch<br />
The Mall<br />
London SW1A 2WH<br />
Telephone 020 7276 1881<br />
Fax 020 7276 1407<br />
E-mail strategy@cabinet-office.x.gsi.gov.uk<br />
© Crown copyright 2002<br />
Publication date November 2002<br />
The cover is printed on Evolution. It is 75% recycled de-inked post consumer waste,<br />
and is totally chlorine free and fully recyclable. The text is printed on Cyclus.<br />
It is 100% recycled and is chlorine free.<br />
All inks are environmentally friendly and vegetable based.<br />
The text in this document may be reproduced free of charge in any format or media without requiring specific<br />
permission. This is subject to the material <strong>not</strong> being used in a derogatory manner or in a misleading context.<br />
The source of the material must be acknowledged as Crown copyright and the title of the document must be<br />
included when being reproduced as part of a<strong>not</strong>her publication or service.