Hygrothermal aging of a filled epoxy resin - Schneider Electric
Hygrothermal aging of a filled epoxy resin - Schneider Electric
Hygrothermal aging of a filled epoxy resin - Schneider Electric

You also want an ePaper? Increase the reach of your titles
YUMPU automatically turns print PDFs into web optimized ePapers that Google loves.
<strong>Schneider</strong> <strong>Electric</strong> 2007 - Conferences publications<br />
mass <strong>of</strong> 6% measured for the un<strong>filled</strong> samples, this<br />
value leads to a filler content <strong>of</strong> 58% which corresponds<br />
well with the “rated” filler content <strong>of</strong> 60%. To simplify<br />
the comparisons, the variations <strong>of</strong> the residual masses<br />
were neutralized in the results displayed in Figure 3.<br />
This shows the relative mass losses between the initial<br />
mass values <strong>of</strong> the samples and the residual masses.<br />
A mass loss between 50°C and 200°C can be observed,<br />
as in un<strong>filled</strong> samples. In these cases, the variations<br />
correspond well with the water uptake measured before.<br />
The <strong>resin</strong> decomposition can be observed in the same<br />
temperature range as above. As shown in the zoom in<br />
Figure 3, decomposition started at lower temperatures<br />
for longer conditioning periods. This is clear if we<br />
compare the curves for 50 and 70 days, which fit the<br />
curve <strong>of</strong> 14 days until about 200°C and decrease faster<br />
between 200°C and 300°C. This indicates an evolution<br />
<strong>of</strong> the material produced by the hygrothermal<br />
conditioning after about 50 days. Since this effect was<br />
not encountered in samples without fillers, the<br />
<strong>epoxy</strong>/silica interface regions are necessarily involved.<br />
We have already mentioned that the mass measurements<br />
suggest an accumulation <strong>of</strong> matter close to these<br />
interfaces. We may consider that this evolution is due to<br />
an hydrolysis <strong>of</strong> the filler/matrix interface regions which<br />
creates a degraded inter-phase region. Since the filler<br />
content is large, this degraded region may also fill the<br />
whole gap between neighbouring fillers and constitute<br />
“weak” path between them. This hydrolysis occuring<br />
after about 50 days is probably correlated with the<br />
increase <strong>of</strong> the mass uptake observed at the same time.<br />
The possible explanation <strong>of</strong> this is as follows: free space<br />
is created by the hydrolytic reactions consisting mainly<br />
in the attack <strong>of</strong> the ester linkages and creation <strong>of</strong> acid<br />
groups [4]. This allows extra water molecules to<br />
accumulate between the filler and the degraded region.<br />
However, the extra quantity <strong>of</strong> water involved in this<br />
mechanism would be low in comparison with the total<br />
quantity <strong>of</strong> absorbed water, which was almost entirely<br />
lost between 50°C and 150°C. Further experiments are<br />
under way to confirm this hypothesis.<br />
DMA results<br />
The dynamic mechanical analysis was carried out on<br />
four <strong>filled</strong> and four un<strong>filled</strong> samples after 0, 5, 14 and<br />
50 days <strong>of</strong> conditioning. The evolution <strong>of</strong> the elastic<br />
moduli E’ is displayed in Figure 4a. The magnitudes for<br />
the <strong>filled</strong> samples were about three times larger in the<br />
glassy state and five times larger in the rubbery state.<br />
The elastic modulus decreased during conditioning,<br />
especially in the glassy state. In practice, water<br />
molecules break the hydrogen bonds established inside<br />
the network. The bound water increases also the<br />
mobility <strong>of</strong> the polymer chains and causes a decrease <strong>of</strong><br />
the elastic modulus. This is the well-known waterinduced<br />
plasticization effect.<br />
In the rubbery state, we would expect the effect to be<br />
less marked since the chains are already mobile. Thus in<br />
this case, the modulus E’ depends theoretically on the<br />
density <strong>of</strong> cross-links in the <strong>epoxy</strong> network [14].<br />
Nevertheless, the conditioning induced a decrease <strong>of</strong> the<br />
elastic moduli E’ for the <strong>filled</strong> samples. For un<strong>filled</strong><br />
samples, the measurements were conducted at the lower<br />
limit <strong>of</strong> sensitivity <strong>of</strong> the DMA instrument. Such a<br />
decrease <strong>of</strong> the rubbery modulus has already been<br />
observed in [15]. It is not due to the plasticization but<br />
may be attributed to a degradation <strong>of</strong> the polymer,<br />
which probably results from hydrolysis <strong>of</strong> the <strong>resin</strong>.<br />
(a)<br />
M(Minitial-Mfinal)%<br />
100<br />
90<br />
80<br />
70<br />
60<br />
50<br />
40<br />
30<br />
20<br />
10<br />
0<br />
REF<br />
5 days<br />
14 days<br />
50 days<br />
70 days<br />
REF<br />
5 days<br />
14 days<br />
50 days<br />
70 days<br />
0 100 200 300 400 500 600<br />
T(°C)<br />
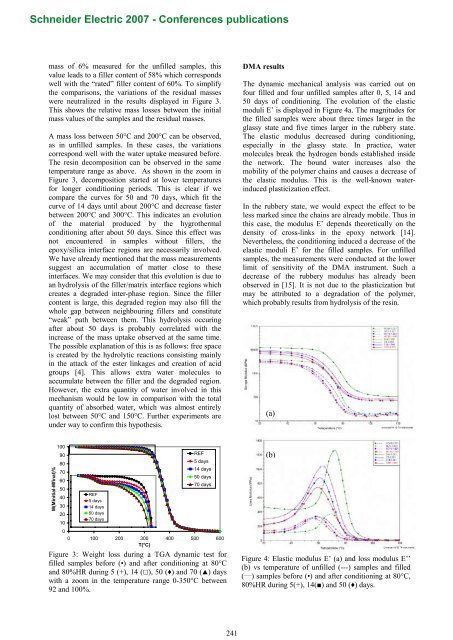
Figure 3: Weight loss during a TGA dynamic test for<br />
<strong>filled</strong> samples before (•) and after conditioning at 80°C<br />
and 80%HR during 5 (+), 14 (), 50 () and 70 () days<br />
with a zoom in the temperature range 0-350°C between<br />
92 and 100%.<br />
(b)<br />
Figure 4: Elastic modulus E’ (a) and loss modulus E’’<br />
(b) vs temperature <strong>of</strong> un<strong>filled</strong> (---) samples and <strong>filled</strong><br />
( ___ ) samples before (•) and after conditioning at 80°C,<br />
80%HR during 5(+), 14() and 50 () days.<br />
241