

Climate change assessments Review of the processes and ...
Climate change assessments Review of the processes and ...
Climate change assessments Review of the processes and ...

Create successful ePaper yourself
Turn your PDF publications into a flip-book with our unique Google optimized e-Paper software.
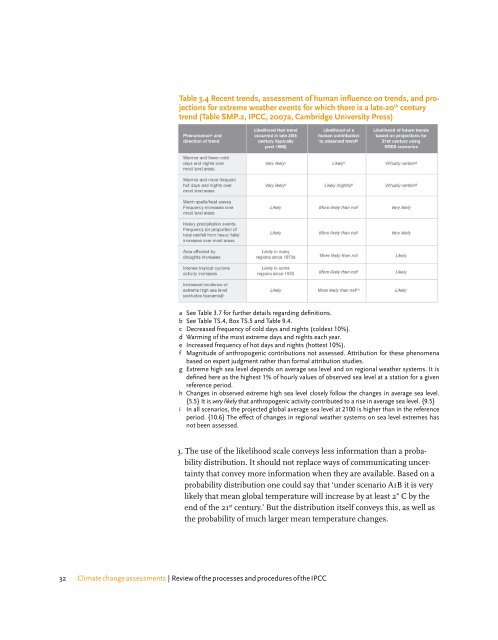
Table 3.4 Recent trends, assessment <strong>of</strong> human influence on trends, <strong>and</strong> projections<br />
for extreme wea<strong>the</strong>r events for which <strong>the</strong>re is a late-20 th century<br />
trend (Table SMP.2, IPCC, 2007a, Cambridge University Press)<br />
a See Table 3.7 for fur<strong>the</strong>r details regarding definitions.<br />
b See Table TS.4, Box TS.5 <strong>and</strong> Table 9.4.<br />
c Decreased frequency <strong>of</strong> cold days <strong>and</strong> nights (coldest 10%).<br />
d Warming <strong>of</strong> <strong>the</strong> most extreme days <strong>and</strong> nights each year.<br />
e Increased frequency <strong>of</strong> hot days <strong>and</strong> nights (hottest 10%).<br />
f Magnitude <strong>of</strong> anthropogenic contributions not assessed. Attribution for <strong>the</strong>se phenomena<br />
based on expert judgment ra<strong>the</strong>r than formal attribution studies.<br />
g Extreme high sea level depends on average sea level <strong>and</strong> on regional wea<strong>the</strong>r systems. It is<br />
defined here as <strong>the</strong> highest 1% <strong>of</strong> hourly values <strong>of</strong> observed sea level at a station for a given<br />
reference period.<br />
h Changes in observed extreme high sea level closely follow <strong>the</strong> <strong>change</strong>s in average sea level.<br />
{5.5} It is very likely that anthropogenic activity contributed to a rise in average sea level. {9.5}<br />
i In all scenarios, <strong>the</strong> projected global average sea level at 2100 is higher than in <strong>the</strong> reference<br />
period. {10.6} The effect <strong>of</strong> <strong>change</strong>s in regional wea<strong>the</strong>r systems on sea level extremes has<br />
not been assessed.<br />
3. The use <strong>of</strong> <strong>the</strong> likelihood scale conveys less information than a probability<br />
distribution. It should not replace ways <strong>of</strong> communicating uncertainty<br />
that convey more information when <strong>the</strong>y are available. Based on a<br />
probability distribution one could say that ‘under scenario A1B it is very<br />
likely that mean global temperature will increase by at least 2° C by <strong>the</strong><br />
end <strong>of</strong> <strong>the</strong> 21 st century.’ But <strong>the</strong> distribution itself conveys this, as well as<br />
<strong>the</strong> probability <strong>of</strong> much larger mean temperature <strong>change</strong>s.<br />
32 <strong>Climate</strong> <strong>change</strong> <strong>assessments</strong> | <strong>Review</strong> <strong>of</strong> <strong>the</strong> <strong>processes</strong> <strong>and</strong> procedures <strong>of</strong> <strong>the</strong> IPCC


