ISRA VISION Buy EUR 26.00 - ISRA VISION AG
ISRA VISION Buy EUR 26.00 - ISRA VISION AG
ISRA VISION Buy EUR 26.00 - ISRA VISION AG

Create successful ePaper yourself
Turn your PDF publications into a flip-book with our unique Google optimized e-Paper software.
<strong>ISRA</strong> <strong>VISION</strong><br />
(CDAX, Technology)<br />
<strong>Buy</strong><br />
<strong>EUR</strong> <strong>26.00</strong><br />
Price <strong>EUR</strong> 21.32<br />
Upside 22.0 %<br />
Value Indicators: <strong>EUR</strong> Share data: Description:<br />
DCF: 26.59<br />
FCF-Value Potential: 25.81<br />
Bloomberg:<br />
Reuters:<br />
ISIN:<br />
ISR GR<br />
ISRG<br />
DE0005488100<br />
Machine vision systems, optical robot<br />
guidance systems.<br />
Market Snapshot: <strong>EUR</strong> m Shareholders: Risk Profile (WRe): 2011/12e<br />
Market cap: 93.2 Freefloat 70.0 % Beta: 1.4<br />
No. of shares (m): 4.4 CEO 25.0 % Price / Book:<br />
0.9 x<br />
EV: 126.1 Vision GbR 5.0 % Equity Ratio: 59 %<br />
Freefloat MC: 65.3 Fidelity 10.1 % Net Fin. Debt /<br />
1.4 x<br />
Ø Trad. Vol. (30d):<br />
113.65 th CI Investments 5.1 % EBITDA: Net Debt / EBITDA:<br />
1.4 x<br />
Growth in automation at a reasonable price; Initiate with <strong>Buy</strong><br />
<strong>ISRA</strong> <strong>VISION</strong> (Intelligent Systems Robotics and Automation) focuses on machine vision solutions for industrial customers.<br />
Broadly speaking, <strong>ISRA</strong> <strong>VISION</strong>’s systems are used to inspect welds, surfaces, printed pattern, plastic foil and folded carton, identify<br />
work-pieces, guide robots or check completeness. The vision systems, which typically consist of a camera, a computer and application<br />
specific software, are able to learn to recognise recurring defects, categorise them and allow for a systematic rectification, resulting in<br />
improved up-time, higher yield and cost savings for customers. As a result, these systems typically pay off for the customer within less<br />
than six months. <strong>ISRA</strong> <strong>VISION</strong>’s core competence (called BrainWARE®, developed internally) lies in the combination of soft- and<br />
hardware, incorporating industry-specific process know-how, algorithms to process vision data and an optimal system design to<br />
produce quality data reliably and quickly.<br />
<strong>ISRA</strong> <strong>VISION</strong>’s more than 6,000 reference installations and its relatively large size in niche markets, claiming double-digit market<br />
shares, differentiates the company from competitors. <strong>ISRA</strong> <strong>VISION</strong>’s focus has resulted in a global number one market position in<br />
surface inspection, exceeding that of Cognex (focus on machine vision systems for the semiconductor and electronics industry) and a<br />
top European market position in 3D machine vision. Last but not least, as system uptime is critical for customers, <strong>ISRA</strong> <strong>VISION</strong>’s<br />
service network is a very important prerequisite to winning an order.<br />
Average EBIT growth of 13% (C<strong>AG</strong>R 2011/12E-2013/13E) going forward looks plausible, driven by substantial cost savings<br />
through machine vision technology, a rising trend towards industry automation, supplying healthy long-term growth prospects. The<br />
company’s track record of generating double-digit profitable growth is impressive. Earnings are additionally defended by <strong>ISRA</strong><br />
<strong>VISION</strong>’s broad exposure by regions, applications and customers (no single customer accounts for more than 2% of sales). Hence,<br />
EBIT margins in the past held up very well on double-digit levels, even in the crisis year 2008/09. Apart from the attractive organic<br />
growth prospects, <strong>ISRA</strong> <strong>VISION</strong> looks set to remain acquisitive in order to apply its know-how to other industries and establish a track<br />
record within new target markets faster.<br />
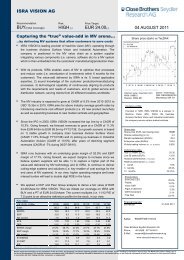
Valuation is attractive, too, trading at 1.4x EV/Sales vis-a-vis 18.7% EBIT margin 2012/13e, 8.4x P/E, 0.8x PTB. A multi stage DCFmodel,<br />
peer group comparison and FCF Value Potential points to a fair value between <strong>EUR</strong> 23 and <strong>EUR</strong> 28 per share. In view of the<br />
company’s proven track record of generating profitable growth in the attractive and growing niche for machine vision technology, we<br />
initiate coverage with BUY, price target <strong>EUR</strong> 26 based on FCF Value Potential in 2013E.<br />
Rel. Performance vs CDAX:<br />
1 month: 0.5 %<br />
6 months: 9.3 %<br />
Year to date: 17.7 %<br />
Trailing 12 months: 14.0 %<br />
Company events:<br />
26.10.12 RS Hamburg<br />
14.12.12 Prel. 2011/2012<br />
31.01.13 2011/2012<br />
28.02.13 Q1<br />
Roland Rapelius<br />
rrapelius@warburg-research.com<br />
+49 (0)40-309537-220<br />
FY End: 30.9.<br />
in <strong>EUR</strong> m<br />
C<strong>AG</strong>R<br />
(10/11-13/14e) 2007/08 2008/09 2009/10 2010/11 2011/12e 2012/13e 2013/14e<br />
Sales 10.8 % 68.3 58.2 64.8 75.2 82.9 92.1 102.4<br />
Change Sales yoy n.a. -14.8 % 11.5 % 15.9 % 10.3 % 11.1 % 11.1 %<br />
Gross profit margin 52.4 % 51.6 % 52.9 % 53.5 % 52.5 % 51.9 % 52.1 %<br />
EBITDA 9.8 % 18.6 15.2 17.6 21.4 22.8 25.2 28.4<br />
Margin 27.2 % 26.1 % 27.2 % 28.5 % 27.5 % 27.4 % 27.7 %<br />
EBIT 11.3 % 12.9 9.3 11.4 14.1 15.4 17.2 19.5<br />
Margin 18.9 % 15.9 % 17.6 % 18.8 % 18.6 % 18.7 % 19.0 %<br />
Net income 12.1 % 7.6 6.5 6.9 9.1 9.9 11.2 12.8<br />
EPS 11.8 % 1.76 1.52 1.61 2.09 2.27 2.56 2.92<br />
EPS adj. 11.8 % 1.76 1.52 1.61 2.09 2.27 2.56 2.92<br />
DPS 13.2 % 0.15 0.15 0.20 0.20 0.25 0.26 0.29<br />
Dividend Yield 1.3 % 1.8 % 1.5 % 1.1 % 1.2 % 1.2 % 1.4 %<br />
FCFPS -0.61 1.75 -0.15 -0.17 -0.45 0.69 0.44<br />
EV / Sales 1.2 x 1.0 x 1.3 x 1.4 x 1.5 x 1.3 x 1.2 x<br />
EV / EBITDA 4.3 x 3.9 x 4.9 x 5.0 x 5.5 x 4.9 x 4.4 x<br />
EV / EBIT 6.1 x 6.3 x 7.5 x 7.5 x 8.2 x 7.2 x 6.3 x<br />
P / E 6.8 x 5.4 x 8.3 x 8.4 x 9.4 x 8.3 x 7.3 x<br />
P / E adj. 6.8 x 5.4 x 8.3 x 8.4 x 9.4 x 8.3 x 7.3 x<br />
FCF Yield Potential 12.1 % 12.6 % 9.1 % 9.5 % 8.8 % 9.8 % 11.1 %<br />
Net Debt 27.6 23.8 28.3 30.0 32.9 31.0 30.3<br />
ROE 20.4 % 8.4 % 8.2 % 9.8 % 9.7 % 9.9 % 10.3 %<br />
ROCE (NOPAT) 17.7 % 6.9 % 6.8 % 8.0 % 7.9 % 8.2 % 8.7 %<br />
Guidance: At least <strong>EUR</strong> 80m sales in 2011/12.<br />
F U L L N O T E Published 25.10.2012 1
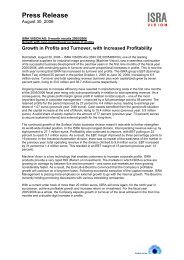
<strong>ISRA</strong> <strong>VISION</strong><br />
Sales development<br />
in <strong>EUR</strong> m<br />
Sales by regions<br />
2011; in %<br />
EBIT development<br />
in <strong>EUR</strong> m<br />
Source: Warburg Research<br />
Source: Warburg Research<br />
Source: Warburg Research<br />
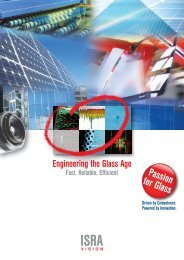
Company Background<br />
• Global leader in concentrated niche markets for optical surface inspection systems such as flat glass inspection, metals inspection or<br />
paper inspection. European leader in 3D machine vision.<br />
• These systems have very short amortisation periods of typically less than 6 months due to significant cost savings and yield<br />
improvements.<br />
• <strong>ISRA</strong> <strong>VISION</strong>'s track record of generating 2-digit sales growth and 2-digit EBIT margins is impressive driven by a largely untapped<br />
market (penetration only c. 15-20%) and a strong trend towards automation.<br />
• Management’s interest are aligned with shareholder’s interests as the CEO owns 25% of the company.<br />
Competitive Quality<br />
• Strong competitive position based on <strong>ISRA</strong> <strong>VISION</strong>'s relatively large size as well as over 6,000 reference installations, differentiating<br />
the company from competition.<br />
• Key customers are large, globally active blue chip industrial companies who value the one-stop-shop approach which few apart from<br />
the larger suppliers can deliver<br />
• Strong global sales and service network, which is constantly extended<br />
• Competitive defence due to high R&D expenditure<br />
• Diversification by technology, industry and region limits the dependency in weak economic periods, as evidenced by the company’s<br />
double-digit EBIT margin even in crisis year 2008/09.<br />
EBT development<br />
in <strong>EUR</strong> m<br />
Sales by segments<br />
2011; in %<br />
Net income development<br />
in <strong>EUR</strong> m<br />
Source: Warburg Research<br />
Source: Warburg Research<br />
Source: Warburg Research<br />
F U L L N O T E Published 25.10.2012 2
<strong>ISRA</strong> <strong>VISION</strong><br />
Investment Case 5<br />
Business Model 5<br />
Competitive Landscape 8<br />
Growth 11<br />
Valuation 16<br />
DCF Model 16<br />
Free Cash Flow Value Potential 18<br />
Peer-group comparison 19<br />
Newsflow 20<br />
Company & Products 21<br />
Product Range 21<br />
New product developments 24<br />
<strong>ISRA</strong> <strong>VISION</strong>’s History at a Glance 25<br />
Management background and shareholder structure 25<br />
Financials 27<br />
F U L L N O T E Published 25.10.2012 3
<strong>ISRA</strong> <strong>VISION</strong><br />
Company Profile<br />
Industrial Automation<br />
(19% of 2010/11 sales)<br />
Surface Vision<br />
(81% of 2010/11 sales)<br />
Products<br />
3D machine vision for robot guidance and<br />
Automation of optical surface inspection for<br />
positioning, assembly (e.g. car glass or tires),<br />
continuous industrial production processes at high<br />
handling or paint finishing. Service Incorporates accounts for ca. quality 10% of sales; avg. speeds selling (e.g. price metals, per system paper, € glass, 100,000 plastics).<br />
vision systems.<br />
Market positions<br />
End markets<br />
Customers<br />
Worldwide number one supplier of surface inspection systems for continuous production processes. European<br />
number one in 3D machine vision. Strong position in glass, metal, plastics/non-woven and automotive as well as a<br />
position among the top three in paper and solar glass<br />
Ranked from low to high market share: Print, Solar, Plastic, Paper, Automotive, Metal, Glass, Specialty Paper<br />
Blue-chip customer base with no single customer accounting for >2% of sales, including Daimler, VW, Ford, GM,<br />
Nissan, Hyundai, Renault, Pilkington, Schott, Q.Cells, First Solar, Nippon Steel, Bao Steel, posco, ThyssenKrupp,<br />
ArcelorMittal, ChinaSteel MAN, M-real, Kimberly-Clark, StoraEnso, International Paper, manroland, Du Pont, Bayer<br />
Competitors<br />
Raw Materials<br />
Fragmented market – mainly small competitors – Some overlap with Cognex, Perceptron, Advanced Vision<br />
Technology, Dr. Schenk, GP Solar, Vitronic, BST/Elexis, KLA Tencor, Orbotech, VAI/Voestalpine<br />
Mainly commodities including personal computers, digital cameras, components<br />
Source: <strong>ISRA</strong>, Warburg Research<br />
F U L L N O T E Published 25.10.2012 4
<strong>ISRA</strong> <strong>VISION</strong><br />
Investment Case<br />
Business Model<br />
A focus on niche markets in automation technology<br />
<strong>ISRA</strong> <strong>VISION</strong> is highly focused on the niche of machine vision solutions for automation in<br />
manufacturing and quality control.<br />
Generally speaking, machine vision technology is used to inspect welds, surfaces,<br />
printed pattern and folded carton, identify work-pieces, guide robots or check<br />
completeness. <strong>ISRA</strong> <strong>VISION</strong>’s systems are able to learn to recognise recurring defects,<br />
categorise them and allow for a systematic rectification, resulting in improved up-time<br />
and cost savings. Also, defective parts are prevented from proceeding to subsequent<br />
manufacturing stages, thus enabling a 100% quality target in a cost effective way. <strong>ISRA</strong><br />
<strong>VISION</strong>’s core competence (called BrainWARE®, developed internally) lies in the<br />
combination of soft- and hardware, incorporating industry-specific process know-how,<br />
algorithms to process vision data and an optimal system design to produce quality data<br />
reliably and quickly. Most hardware components are commodities such as personal<br />
computers and cameras, bought from the market and the final assembly is done inhouse<br />
on all relevant continents.<br />
As such, <strong>ISRA</strong> <strong>VISION</strong>’s products help customers to solve two important<br />
problems: to reduce costs through automation and yield management and to increase<br />
quality through fewer defects.<br />
The application specific machine vision systems are focusing on:<br />
• Automation of quality inspection<br />
• Automation of production<br />
• Yield enhancing production & management decision intelligence<br />
Company structure<br />
Industrial Automation<br />
Robot Vision<br />
Quality Vision<br />
Surface Vision<br />
automotive<br />
glass, print, paper/non-woven, plastics,<br />
metal, solar cells & modules<br />
Source: <strong>ISRA</strong> <strong>VISION</strong>, Warburg Research<br />
The business model is highly scalable. The combination of hard- and software knowhow<br />
incorporating intelligent detection algorithms in order to produce fast and reliable<br />
surface quality data can be applied to various end markets. Therefore, a high scalability<br />
of the business model – driving bottom-line growth – is achieved by transferring its<br />
technological expertise to new markets.<br />
Moreover, important success factors are industry-specific reference installations<br />
as well as a positive track record in a specific industry. These were important factors for<br />
<strong>ISRA</strong> <strong>VISION</strong>’s acquisitions of Parsytec in 2007 (metals and paper surface inspection<br />
systems) and Graphikon in 2010 (wafer based solar cells and modules surface<br />
inspection systems). Both companies are fully integrated and contribute important<br />
industry-specific know-how to <strong>ISRA</strong> <strong>VISION</strong>. Just recently <strong>ISRA</strong> <strong>VISION</strong> acquired 3D<br />
F U L L N O T E Published 25.10.2012 5
<strong>ISRA</strong> <strong>VISION</strong><br />
Shape, a small company active in 3D measurement of objects and surfaces.<br />
<strong>ISRA</strong> <strong>VISION</strong> – Diversification limits risk of dependencies<br />
Multi-Branch Strategy<br />
Robot Vision<br />
Surface Vision<br />
Quality Vision<br />
Metal<br />
Paper<br />
Print<br />
Plastics<br />
Glass<br />
Solar<br />
Automotive<br />
Europe<br />
Americas<br />
Asia<br />
Technologies Industries Regions<br />
Source: <strong>ISRA</strong> <strong>VISION</strong>, Warburg Research<br />
Within these target industries, the company has built up substantial expertise, customer<br />
relations and reference installations, differentiating the company from competitors. This<br />
focus and differentiation have resulted in strong global market positions with high doubledigit<br />
shares in its target markets.<br />
Reporting divisions<br />
<strong>ISRA</strong> <strong>VISION</strong> operates in two divisions:<br />
• Surface Vision (81% of 2010/11 sales): Optical surface inspection systems help<br />
locate, visualise, classify and evaluate defects. It is applied mainly to sheet and<br />
continuous web products such as flat glass, solar, paper, plastic, non-wovens and<br />
metal. These materials are checked for defects during the production process,<br />
preventing defective parts from proceeding to subsequent manufacturing steps. <strong>ISRA</strong><br />
<strong>VISION</strong> claims global market and technology leadership in surface inspection systems<br />
for continuous production processes. Originally established as a second-tier division,<br />
surface vision quickly emerged as the most important division for the company.<br />
Surface Vision: Foil inspection system<br />
Source: <strong>ISRA</strong> <strong>VISION</strong><br />
• Industrial Automation (19% of 2010/2011 sales): Robot vision/guidance systems are<br />
able to recognise and adjust the position of objects in pinpoint precision (2D or 3D).<br />
F U L L N O T E Published 25.10.2012 6
<strong>ISRA</strong> <strong>VISION</strong><br />
These systems are mainly supplied to the automobile industry, machine tool<br />
manufacturers, plant and system manufacturers and the original equipment<br />
manufacturers (OEM). The main contributors to this division are robot vision and quality<br />
vision systems. The latter can be considered as an add-on for existing customers in the<br />
automotive, glass, print and packaging industry. <strong>ISRA</strong> <strong>VISION</strong> claims a leading position<br />
for 3D machine vision and robot guidance solutions and market leadership in Europe.<br />
Technological requirements are demanding - for example a robot that inserts car<br />
windshields at a tolerance level of less than 1mm or mounts a wheel without scratching<br />
the car body. Just recently Industrial Automation revenues took a huge leap with order<br />
entries from a German premium car manufacturer.<br />
Industrial Automation: Car assembly<br />
Source: <strong>ISRA</strong> <strong>VISION</strong><br />
Customers & customer value<br />
Machine vision systems help to maximise yield. When pricing the finished products<br />
according to level of quality, machine vision systems are crucial. They generate quality<br />
data that customers use to maximise their revenues. That way, for example, a steel<br />
producer is able to identify different sheet steel qualities which can then be sold at<br />
different price levels to maximise the yield. For example, in automotive, steel quality is<br />
important because lower grades can be sold to mass producers while higher grades are<br />
sold to German premium manufacturers.<br />
A large service network matters as uptime is crucial. End customers - i.e. mainly<br />
large, globally active blue chip industrial companies - value a one-stop-shop approach<br />
and a broad product portfolio, setting <strong>ISRA</strong> <strong>VISION</strong> apart from smaller players. <strong>ISRA</strong><br />
<strong>VISION</strong>’s global sales and service network supplies significant competitive strength as<br />
system uptime is critical. A large sales and service network cannot be run economically<br />
by a smaller competitor. <strong>ISRA</strong> <strong>VISION</strong>’s maintenance service contributes ca. 10% to<br />
total sales.<br />
Short amortisation period of typically less than six months. Solutions offered by<br />
<strong>ISRA</strong> <strong>VISION</strong> provide customers with high added value relative to an average system<br />
price of <strong>EUR</strong> 100,000: cost reduction, quality improvement, better yield management and<br />
advanced production methods. For surface vision systems, apart from efficiency and<br />
quality gains, the customer benefits from process monitoring and upstream feedback for<br />
analysis and further process improvement. Typically, for surface vision systems<br />
amortisation is achieved in less than six months.<br />
In the robot vision segment the customer’s benefit lies in the automation which<br />
reduces or even eliminates manual work, increases flexibility and makes the assembly<br />
more accurate, resulting in higher quality and efficiency overall. Considering the total<br />
costs of a manufacturing cell or a complete production system, the costs of a machine<br />
vision system account for typically only a fraction of total costs while the value added to<br />
the process is significant.<br />
F U L L N O T E Published 25.10.2012 7
<strong>ISRA</strong> <strong>VISION</strong><br />
<strong>ISRA</strong> <strong>VISION</strong> boasts a total of over 6,000 reference installations. These installations<br />
are valued by customers in view of a system’s long lifetime and high total system costs<br />
of several million Euros compared to only <strong>EUR</strong> 100k for a machine vision system. These<br />
references are required to be specific with respect to a customer’s industry – such as<br />
metals, glass, plastic, solar, paper, print etc. and automotive – and with respect to a<br />
certain process step within this industry (e.g. pre-dryer, dryer, reeler etc. in a paper<br />
manufacturing process).<br />
Blue chip customer-list without overdependence. With the various and diverse<br />
application areas of the product portfolio, a broad variety of industries are supplied by<br />
<strong>ISRA</strong> <strong>VISION</strong>. The customer list includes mainly globally producing, blue-chip industrials<br />
including Daimler, Audi, VW, Ford, GM, Nissan, Hyundai, Renault, Porsche, Volvo,<br />
Saint-Gobain, NSG Group, Pilkington, Asahi Glass, Schott, Bosch, Q.Cells, Solarwatt,<br />
Epcos, aleo, First Solar, JFE, Nippon Steel, Bao Steel, posco, riva, Corus,<br />
ThyssenKrupp, ArcelorMittal, ChinaSteel, Constantia Packaging, MAN, UPM, M-real,<br />
Kimberly-Clark, StoraEnso, International Paper, manroland, Du Pont, Bayer. No single<br />
customer accounts for more than 2% of sales. <strong>ISRA</strong> <strong>VISION</strong> maintains long-term<br />
(contractual) relationships with several customers, providing a high revenue visibility.<br />
Regional split<br />
<strong>ISRA</strong> <strong>VISION</strong> is headquartered in Darmstadt, Germany and is represented by its<br />
international subsidiaries and offices worldwide. Marketing, finance, R&D, production<br />
and purchase are located in Darmstadt. The site in Herten/Germany is <strong>ISRA</strong> <strong>VISION</strong>’s<br />
main assembly site, also incorporating R&D activities. The company has an almost<br />
balanced global revenue breakdown because of early international expansion, such as<br />
<strong>ISRA</strong> <strong>VISION</strong>, Lansing, Michigan/USA or <strong>ISRA</strong> <strong>VISION</strong> France in Lyon.<br />
<strong>ISRA</strong> <strong>VISION</strong> - Regional sales breakdown<br />
Asia/ROW<br />
32.4%<br />
Germany<br />
26.7%<br />
Asia/ROW<br />
37.7%<br />
Germany<br />
23.2%<br />
2010/11 2009/10<br />
Americas<br />
21.7%<br />
Europe excl.<br />
Germany<br />
19.3%<br />
Americas<br />
15.5%<br />
Europe excl.<br />
Germany<br />
23.6%<br />
Source: <strong>ISRA</strong> <strong>VISION</strong>, Warburg Research<br />
The company is represented in 25 locations in 15 countries worldwide. Recently a<br />
site in Moscow, Russia was added while a site in Indonesia is being planned. About 75%<br />
of the workforce is located in Europe, about 15% in Asia and 10% in America.<br />
Competitive Landscape<br />
The highly fragmented machine vision market is characterised by a large number of<br />
smaller players. The average size of a European machine vision company is 29<br />
employees (<strong>ISRA</strong> <strong>VISION</strong> had 454 employees on average in 9M 2011/12). <strong>ISRA</strong><br />
<strong>VISION</strong>’s competitors vary depending on market segment, application niche and<br />
geographic market.<br />
Compared to smaller competitors, differentiation is based on size which enables<br />
<strong>ISRA</strong> <strong>VISION</strong> to offer important services, a complete range of solutions e.g. inspection<br />
systems at several relevant stages of a production process, and the respective industryrelated<br />
know-how. Larger, listed competitors include Cognex (US, 2x larger based on<br />
total revenues, however, in surface inspection which is <strong>ISRA</strong> <strong>VISION</strong>’s largest division,<br />
F U L L N O T E Published 25.10.2012 8
<strong>ISRA</strong> <strong>VISION</strong><br />
Cognex generated only 15% of total sales or <strong>EUR</strong> 31m in 2011).<br />
Compared to that, <strong>ISRA</strong> <strong>VISION</strong> is ca. 70% larger based on 2010/11 sales). Other listed<br />
peers include Perceptron (US), AVT (Israel) and Basler (Germany). Basler focuses<br />
mainly on digital cameras and as such is not fully comparable. Also in respect to the<br />
other companies, a direct comparison should not be over-interpreted as competitors are<br />
encountered in no more than one market.<br />
Peer group overview<br />
Country<br />
Cognex Perceptron AVT<br />
US<br />
Basler<br />
(focus on cameras)<br />
US Israel Germany<br />
Market cap<br />
Employees<br />
Avg. EBIT margin<br />
2006-2011<br />
C<strong>AG</strong>R sales<br />
2006-2011<br />
€1.2bn €37m €21.7m €38.8m<br />
955 229 202 294<br />
14.9% 0.7% -0.4% 3.76%<br />
6.19% 0.48% 10.06% 1.1%<br />
Business<br />
model<br />
• Offers complete<br />
machinevision systems<br />
as well as single<br />
omponents<br />
• Two divisions: Modular<br />
Vision Systems and<br />
Surface Inspection<br />
Systems<br />
• MVS are us ed for<br />
automation of the<br />
manufacturing process<br />
• SIS provide surface<br />
inspection for materials<br />
proc essed such as<br />
metals, paper, plastics<br />
• Competes with <strong>ISRA</strong> in<br />
almost every segment<br />
(see graphic below)<br />
• Claims a #1 position as<br />
a supplier of the<br />
semiconductor and<br />
electronics industries<br />
• Two business units:<br />
Industrial and<br />
Commercial Products<br />
• Industrial Business Unit<br />
provides highlyconfigurable<br />
measurement solutions<br />
to monitor quali ty<br />
• IBS supplies primarily to<br />
the automotive sector<br />
• Commercial Products<br />
Busines s Unit offers<br />
inspection products and<br />
various accessories to<br />
plumbers, electricians,<br />
mechanics etc as well<br />
as do-it-yourself<br />
homeowner<br />
• Offers value-added<br />
services in the field of<br />
training, maintenace,<br />
consulting and software<br />
• Provides products for<br />
automatic inspection of<br />
printed materials, press<br />
and color control and<br />
reporting software<br />
• Competes with <strong>ISRA</strong> in<br />
the print and paper<br />
market<br />
• Main product<br />
automatically detect<br />
defects and deviations<br />
• Offers installation<br />
trai ning and support<br />
services<br />
• Operates directly and<br />
through dis tributors in<br />
Europe and the US<br />
• Manufactures digital<br />
camers for industrial<br />
applications , medical<br />
devices, traffic systems<br />
and video surveillance<br />
• Claims to be the #2<br />
camera supplier<br />
worldwide<br />
• Two segments:<br />
Components (83.7% of<br />
total sales) and<br />
Solutions (16.3%)<br />
• Competes with <strong>ISRA</strong> in<br />
terms of optical<br />
inspection solutions for<br />
glass (incl. solar panels)<br />
Source: Company data, Bloomberg, Warburg Research<br />
Compared to its peer group of listed competitors, <strong>ISRA</strong> <strong>VISION</strong> generated the<br />
highest average sales growth (C<strong>AG</strong>R 2006-2011). Average EBIT margins over the<br />
past five fiscal years were also impressive and more resilient than its peers, even in the<br />
crisis year of 2009, supported by a broad diversification by regions, industries and<br />
customers.<br />
F U L L N O T E Published 25.10.2012 9
<strong>ISRA</strong> <strong>VISION</strong><br />
Peer group – EBIT margin development<br />
30%<br />
20%<br />
10%<br />
0%<br />
-10%<br />
2006 2007 2008 2009 2010 2011<br />
-20%<br />
Cognex Perceptron AVT Basler <strong>ISRA</strong><br />
Source: Bloomberg, Warburg Research<br />
Perceptron as <strong>ISRA</strong> <strong>VISION</strong>’s closest comparable peer in automotive, is expecting<br />
additional growth in the United States. Basler, which mainly focuses on its Components<br />
segment, reported a harsh decline of 67% of sales in the relevant Solutions segment,<br />
which was due to excess capacities in the LCD industry, resulting in a capex decrease.<br />
In terms of market share, <strong>ISRA</strong> <strong>VISION</strong> claims the strongest positioning in the<br />
following industries (ranked from low to high):<br />
- Print<br />
- Solar<br />
- Plastic<br />
- Paper<br />
- Automotive<br />
- Metal<br />
- Glass<br />
- Specialty Paper<br />
High R&D supplies competitive defence against smaller competitors. <strong>ISRA</strong><br />
<strong>VISION</strong>’s size allows the company to spend high amounts on R&D (12.9% of 2010/11<br />
sales, cost of sales accounting) to support its technological expertise. These sums are<br />
unlikely to be matched by smaller competitors. Among the listed competitors, only<br />
Cognex’s R&D budget is higher in absolute terms but the product mix and end market<br />
focus (mainly on semiconductor and electronics) differ from those of <strong>ISRA</strong> <strong>VISION</strong>.<br />
Therefore direct comparisons are limited. The development of technological innovations<br />
is one of <strong>ISRA</strong> <strong>VISION</strong>’s key strengths. The company focuses on creating additional<br />
value and achieving a quick return-on-investment for customers. This makes a high<br />
contribution to the mix of the company’s technology, market and cost leadership position.<br />
<strong>ISRA</strong> <strong>VISION</strong> profits from ongoing market consolidation. Customers, which are<br />
mainly global manufacturers, prefer to be served by global suppliers and value the onestop-shop<br />
approach offered by <strong>ISRA</strong> <strong>VISION</strong>. Within this environment, the company<br />
should profit from overall consolidation and should increase its market share. Through<br />
the acquisitions of Parsytec and Graphikon <strong>ISRA</strong> <strong>VISION</strong> gained market share<br />
inorganically, especially in the metal, print and solar industry.<br />
F U L L N O T E Published 25.10.2012 10
<strong>ISRA</strong> <strong>VISION</strong><br />
Growth<br />
A high-growth company with favourable market outlook<br />
<strong>ISRA</strong> <strong>VISION</strong> exhibits an impressive track record: Over the last decade the company<br />
grew profitably with double-digit sales growth rates and double-digit EBIT margins.<br />
Coupled with a sound balance sheet (57% equity ratio, 31% net gearing) <strong>ISRA</strong> <strong>VISION</strong><br />
signals financial health and stability which is important for its industrial customers. The<br />
C<strong>AG</strong>R from 2001 to 2011 was 15%, generating double-digit EBIT margins even in crisis<br />
years.<br />
<strong>ISRA</strong> <strong>VISION</strong> - Revenue and EBIT development (<strong>EUR</strong> m)<br />
100<br />
25%<br />
80<br />
20%<br />
60<br />
15%<br />
40<br />
10%<br />
20<br />
5%<br />
0<br />
0%<br />
00/01<br />
01/02<br />
02/03<br />
03/04<br />
04/05<br />
05/06<br />
06/07<br />
07/08<br />
08/09<br />
09/10<br />
10/11<br />
11/12E<br />
12/13E<br />
Sales EBIT EBIT margin<br />
Source: <strong>ISRA</strong> <strong>VISION</strong>, Warburg Research<br />
<strong>ISRA</strong> <strong>VISION</strong> - Segment revenue growth (<strong>EUR</strong> m)<br />
30<br />
30%<br />
20<br />
20%<br />
10<br />
10%<br />
0<br />
0%<br />
-10<br />
Q1/09<br />
Q2/09<br />
Q3/09<br />
Q4/09<br />
Q1/10<br />
Q2/10<br />
Q3/10<br />
Q4/10<br />
Q1/11<br />
Q2/11<br />
Q3/11<br />
Q4/11<br />
Q1/12<br />
Q2/12<br />
Q3/12<br />
-10%<br />
-20<br />
-20%<br />
-30<br />
-30%<br />
Surface Vision Industrial Automation Total change in % (y-o-y)<br />
Source: <strong>ISRA</strong> <strong>VISION</strong>, Warburg Research<br />
The Industrial Automation segment (18.5% of 2010/11 sales) benefits from several<br />
trends in the automotive industry. The industry is faced with a rising need for efficiency<br />
increases in the mature markets, the need for new, local production sites in emerging<br />
markets such as Brazil and China, and generally a high degree of competitiveness,<br />
which is driving the need for ever higher quality standards and cost advantages. This<br />
year’s impressive Q3 figures in Industrial Automation were driven by some big orders by<br />
German premium car manufacturers.<br />
Order backlog on record levels: The total order backlog rose gradually to <strong>EUR</strong> 55m<br />
per end of Q3 with a 50% increase in the Industrial Automation segment in the first nine<br />
F U L L N O T E Published 25.10.2012 11
<strong>ISRA</strong> <strong>VISION</strong><br />
months of 2011/12.<br />
<strong>ISRA</strong> <strong>VISION</strong> - Order backlog (<strong>EUR</strong> m)<br />
60<br />
50<br />
40<br />
30<br />
20<br />
10<br />
0<br />
Q1/10<br />
Q2/10<br />
Q3/10<br />
Q4/10<br />
Q1/11<br />
Q2/11<br />
Q3/11<br />
Q4/11<br />
Q1/12<br />
Q2/12<br />
Q3/12<br />
Source: <strong>ISRA</strong> <strong>VISION</strong>, Warburg Research<br />
Management’s medium-term financial targets include a sales volume of more than <strong>EUR</strong><br />
100m (like-for-like) with at least stable margins. The gross margin should stay at 60%<br />
minimum, based on total cost accounting, and an EBT margin target of 20% which is a<br />
high level in comparison to peers. For 2011/12 <strong>ISRA</strong> <strong>VISION</strong> is aiming to reach sales of<br />
more than <strong>EUR</strong> 80m (WRe: <strong>EUR</strong> 83). Taking acquisitions into account, we see sales<br />
volume climbing beyond the <strong>EUR</strong> 100m threshold in the medium term.<br />
We expect average sales growth of 11% and EBIT growth of 13% (C<strong>AG</strong>R 2012e-<br />
2014e) as a result of…<br />
• …rising quality requirements and a rising need for manufacturing efficiency driving the<br />
need for automation and quality inspection systems in several customer industries.<br />
• …an extension of sales activities and geographical presence.<br />
• …a bigger product portfolio: Several products are nearing market launch and lowbudget<br />
products will be introduced soon. With “Plug & Automate” <strong>ISRA</strong> <strong>VISION</strong> enters<br />
the do-it-yourself terrain. The new generic product family is a ready-to-use automation<br />
technology for the factory floor.<br />
• …<strong>ISRA</strong> <strong>VISION</strong>’s cost leadership position, which will help to maintain and increase<br />
profitability levels.<br />
• …balance sheet improvements: Increasing equity ratio and unused credit lines<br />
translate into a solid capital endowment for further growth.<br />
<strong>ISRA</strong> <strong>VISION</strong>’s growth is diversified by regions and customer industries. During the<br />
economic crisis in 2008/09, <strong>ISRA</strong> <strong>VISION</strong>’s revenues declined 15% which is only one<br />
third compared to the German engineering sector decline of 45% (VDMA). This is the<br />
result of a broad sales exposure to uncorrelated end markets and regions:<br />
F U L L N O T E Published 25.10.2012 12
<strong>ISRA</strong> <strong>VISION</strong><br />
<strong>ISRA</strong> <strong>VISION</strong> - regional sales breakdown 2010/11<br />
Asia/ROW<br />
32,4%<br />
Germany<br />
26,7%<br />
Americas<br />
21,7%<br />
Europe excl.<br />
Germany<br />
19,3%<br />
Source: <strong>ISRA</strong> <strong>VISION</strong>, Warburg Research<br />
<strong>ISRA</strong> <strong>VISION</strong> - sales split by customer industries 2010/11<br />
Paper<br />
17%<br />
Print<br />
5%<br />
Automotive<br />
16%<br />
Metal<br />
19%<br />
Glass<br />
20%<br />
Plastics<br />
23%<br />
Source: <strong>ISRA</strong> <strong>VISION</strong>, Warburg Research<br />
<strong>ISRA</strong> Vision - Divisional split<br />
in <strong>EUR</strong> m 2008 2009 2010 2011 2012e 2013e 2014e<br />
Industrial Automation<br />
Sales Industrial Automation 15.8 10.9 11.5 14.6 19.4 21.6 24.1<br />
EBIT Industrial Automation 3.0 1.3 1.9 2.5 3.4 3.8 4.4<br />
margin 19.2% 12.3% 16.3% 17.5% 17.5% 17.7% 18.2%<br />
Surface Vision<br />
Sales Surface Vision 52.4 47.3 53.3 60.6 63.5 70.5 78.2<br />
EBIT Surface Vision 9.9 7.9 9.6 11.6 12.0 13.4 15.1<br />
margin 18.9% 16.8% 18.0% 19.1% 18.9% 19.0% 19.3%<br />
Group<br />
Sales 68.3 58.2 64.8 75.2 82.9 92.1 102.4<br />
EBIT 12.9 9.3 11.4 14.1 15.4 17.2 19.5<br />
margin 18.9% 15.9% 17.6% 18.8% 18.6% 18.7% 19.0%<br />
Sources: <strong>ISRA</strong> Vision (historical data), Warburg Research (estimates)<br />
Growth drivers and market dynamics<br />
10% average market growth expected by 2015: The total turnover for the global<br />
machine vision market was estimated at USD 11.2bn in 2010. Until 2015, the market is<br />
expected to grow to nearly USD 18bn (C<strong>AG</strong>R 10%, BCC Research).The potential size of<br />
the market for machine vision technology that <strong>ISRA</strong> <strong>VISION</strong> focuses on is estimated at<br />
<strong>EUR</strong> 3.2bn sales per year. In terms of application, surface vision technology accounts for<br />
more than 50% of the market, followed by robot vision and quality vision systems.<br />
F U L L N O T E Published 25.10.2012 13
<strong>ISRA</strong> <strong>VISION</strong><br />
Addressable market has niche character with size of less than <strong>EUR</strong> 1bn: The actual<br />
addressable market size is assumed to be between <strong>EUR</strong> 480m – <strong>EUR</strong> 640m sales per<br />
year, based on the assumption that currently not even 20% of the potentially<br />
addressable market is yet penetrated. However, other industry sources estimate that<br />
only 10% of the potentially addressable market for machine vision technology is yet<br />
penetrated, mainly because some sectors have easier tasks to perform than others and<br />
certain industries including automotive and electronics were able to adopt automation<br />
technologies earlier than others.<br />
VDMA in July 2012 said it expects 5% market growth this year after 20% yoy in<br />
2011 which varies by subsector. The VDMA, the German association for engineering<br />
and plant engineering, expects the market for industrial machine vision systems and<br />
components to grow by 5% yoy in 2012 in terms of revenues of suppliers located in<br />
Germany with customers located in Germany and abroad. In 2011, revenues reached<br />
<strong>EUR</strong> 1.5bn for the first time. After 2009 the worldwide automation trend continued even<br />
more dynamically. Rationalisation, productivity improvements, shorter and faster cycle<br />
times and quality demands all require automation and surface inspection.<br />
Machine Vision turnover of German suppliers (<strong>EUR</strong> m)<br />
1,800<br />
1,600<br />
1,400<br />
1,200<br />
1,000<br />
800<br />
600<br />
400<br />
200<br />
0<br />
9% C<strong>AG</strong>R (00-12E)<br />
2000 2001 2002 2003 2004 2005 2006 2007 2008 2009 2010 2011 2012E<br />
Source: VDMA, Warburg Research<br />
Growth is supported by a low degree of automation. <strong>ISRA</strong> <strong>VISION</strong> is expanding in<br />
both high growth areas such as Eastern Europe, Asia and South America and already<br />
established markets including Japan. Global car manufacturers are expanding their<br />
manufacturing capacities in China, underscored by the statements of Dürr, a supplier of<br />
capital goods to the automotive industry, (mainly paint shops and automation solutions)<br />
in its recent capital markets day in China.<br />
South Korea, Thailand, and Malaysia offer further potential to increase the degree of<br />
automation in its industrial applications, according to the VDMA. The US still has a<br />
relatively small degree of automation in production facilities and could offer some growth<br />
opportunities.<br />
In first nine months of FY 11/12, the US was the fastest growing region for <strong>ISRA</strong><br />
<strong>VISION</strong>. Europe, however, is expected to remain the most important market, with growth<br />
opportunities especially in Eastern countries. Even though Germany and Japan are the<br />
highest automated countries, they have always been lucrative for <strong>ISRA</strong> <strong>VISION</strong> and are<br />
likely to maintain their position as cash cow markets.<br />
New VDMA figures support our growth scenario. 2011 VDMA figures (published in<br />
2012) again illustrate that Asia is the fastest growing region for German machine vision<br />
suppliers. In absolute terms, Asia caught up with Europe and looks set to outperform the<br />
European market.<br />
Americas, especially North America, made a huge step forward, according to VDMA,<br />
with strong growth of 35% in 2011, which is also perceptible in <strong>ISRA</strong> <strong>VISION</strong>’s latest<br />
F U L L N O T E Published 25.10.2012 14
<strong>ISRA</strong> <strong>VISION</strong><br />
results. Germany disappointed in 2010 with a 5% decline compared to 2008 but bounced<br />
back in 2011 with an impressive 20% increase yoy. We compare 2010 to 2008 because<br />
of the low base in 2009. Again, these numbers refer to the regional sales split of<br />
suppliers located in Germany only.<br />
Market - Machine vision sales development by regions<br />
50%<br />
40%<br />
40%<br />
35%<br />
30%<br />
28%<br />
20%<br />
20%<br />
10%<br />
0%<br />
-10%<br />
Germany<br />
-5%<br />
2%<br />
9%<br />
Europe (excl.<br />
Germany)<br />
8%<br />
Asia<br />
Americas<br />
2010 vs 2008 2011 vs 2010<br />
Source: VDMA, Warburg Research<br />
Industry-specific investment patterns play a key role for <strong>ISRA</strong> <strong>VISION</strong>. Especially<br />
customers who are engaged in highly competitive environments and low-margin<br />
businesses could spur growth for <strong>ISRA</strong> <strong>VISION</strong>. Also, new quality standards and the<br />
commitment to green technology could build momentum. Below we have briefly<br />
summarised recent macro- and micro-trends for <strong>ISRA</strong> <strong>VISION</strong>’s relevant industries.<br />
Industry-specific market dynamics<br />
Automotive<br />
Metal<br />
Glass<br />
• Large order increases from premium car manufacturers,<br />
especially in Germ any and China, driven by regional<br />
expansion, rising quality requirem ents and efficienc y gains.<br />
• Developm ent of new models goes hand in hand with<br />
pressur e on higher efficienc y and higher quality<br />
• com petition is on high levels which could trigger<br />
investm ents in m argin-im prov ing technology<br />
• Introduction of new surface vis ion sys tem s for the<br />
production/processing of steel and alum inium<br />
• Growth perceptible from USA<br />
• Risk: Low raw material prices (iron ore at alm ost three year<br />
low) do not apply enough pressure on m argins<br />
• Three new innovations about to be launched<br />
• Including a new generation of surface vision systems for<br />
inspection of automobile- and floatglass<br />
• P rosperous especially in China and Japan (new sales<br />
team )<br />
Print<br />
Plastics<br />
Solar<br />
Paper<br />
• S trong dynam ics<br />
• DRUPA 2012 triggered momentum : gain of new valuable<br />
contacts<br />
• Good results lately<br />
• New applications<br />
• Increased marketing activ ities in USA and ASIA could pay<br />
off<br />
• Recent downturn perceptible<br />
• W eak demand expected to continue in the short term<br />
• Chance: China‘s m anufacturers generate very low yields<br />
and are forced to im prove m argins; inc reas ing quality<br />
requirement could also play a role<br />
• Impressive growth in Q2 and Q3 11/12<br />
• S pecialty paper (bank notes) prosperous business unit<br />
• Introduction of low-budget products should further stimulate<br />
the market<br />
Source: <strong>ISRA</strong> <strong>VISION</strong>, Warburg Research<br />
F U L L N O T E Published 25.10.2012 15
<strong>ISRA</strong> <strong>VISION</strong><br />
Valuation<br />
Valuation based on a multi-stage DCF Model, FCF Value Potential and Peer Group<br />
Comparison yields the following range of a fair value per share.<br />
Valuation summary – fair value (<strong>EUR</strong> per share)<br />
DCF Model 25.0 - 28.3<br />
Free Cash Flow Value Potential 22.5 - 25.8<br />
Peer Group Comparison 23.4 - 24.3<br />
Sources: <strong>ISRA</strong> <strong>VISION</strong> (reported data), Warburg Research (estimates)<br />
DCF Model<br />
A DCF-model yields a fair value per share between <strong>EUR</strong> 25 and <strong>EUR</strong> 28<br />
Our key model assumptions are as follows:<br />
• Sales growth in the foreseeable future looks set to remain at low doubledigit<br />
levels on the back of an ongoing trend towards automation and the<br />
need to increase manufacturing efficiency and quality standards.<br />
• EBT margins at high levels near 20% look plausible driven by sales growth<br />
and operating leverage. Margins look set to erode gradually over time<br />
anticipating increasing competitiveness, partly defended by the company’s<br />
R&D and innovative products.<br />
• Working capital requirements are expected to remain at high levels owing<br />
to the customer structure.<br />
• Capex requirements are expected to remain at levels between 10% and<br />
12% of sales in the foreseeable future, mainly driven by capex for internally<br />
produced and capitalised assets while capex for PPE is expected to<br />
account for possibly between <strong>EUR</strong> 0.5m to <strong>EUR</strong> 1m going forward.<br />
Reason: the product portfolio determines most of <strong>ISRA</strong> <strong>VISION</strong>’s asset<br />
value whereas PPE requirements are limited.<br />
F U L L N O T E Published 25.10.2012 16
<strong>ISRA</strong> <strong>VISION</strong><br />
DCF Model<br />
Detailed forecast period Transitional period Term. Value<br />
Figures in <strong>EUR</strong> m 11/12e 12/13e 13/14e 14/15e 15/16e 16/17e 17/18e 18/19e 19/20e 20/21e 21/22e 22/23e 23/24e<br />
Sales 82.9 92.1 102.4 110.5 119.4 128.9 139.3 147.6 156.5 164.3 172.5 179.4 184.8<br />
Sales change 10.3 % 11.1 % 11.1 % 8.0 % 8.0 % 8.0 % 8.0 % 6.0 % 6.0 % 5.0 % 5.0 % 4.0 % 3.0 % 2.0 %<br />
EBIT 15.4 17.2 19.5 21.0 22.7 24.5 25.8 27.3 28.2 28.8 29.3 28.7 27.7<br />
EBIT-margin 18.6 % 18.7 % 19.0 % 19.0 % 19.0 % 19.0 % 18.5 % 18.5 % 18.0 % 17.5 % 17.0 % 16.0 % 15.0 %<br />
Tax rate (EBT) 31.0 % 31.0 % 31.0 % 31.0 % 31.0 % 31.0 % 31.0 % 31.0 % 31.0 % 31.0 % 31.0 % 31.0 % 31.0 %<br />
NOPAT 10.6 11.9 13.4 14.5 15.7 16.9 17.8 18.8 19.4 19.8 20.2 19.8 19.1<br />
Depreciation 7.4 8.0 8.9 9.6 10.3 11.2 12.1 12.8 13.6 14.2 14.9 15.5 16.0<br />
in % of Sales 8.9 % 8.7 % 8.7 % 8.7 % 8.7 % 8.7 % 8.7 % 8.7 % 8.7 % 8.7 % 8.7 % 8.7 % 8.7 %<br />
Changes in provisions 0.0 0.1 0.1 0.2 0.2 0.2 0.2 0.2 0.2 0.2 0.2 0.1 0.1<br />
Change in Liquidity from<br />
- Working Capital 9.0 5.9 8.4 6.8 7.3 7.9 8.5 6.9 7.3 6.5 6.8 5.7 4.4<br />
- Capex 10.3 10.4 11.4 12.4 13.3 12.9 13.9 14.0 14.7 15.4 16.2 16.9 16.1<br />
Capex in % of Sales 12.4 % 11.3 % 11.2 % 11.2 % 11.2 % 10.0 % 10.0 % 9.5 % 9.4 % 9.4 % 9.4 % 9.4 % 8.7 %<br />
Other 0.0 0.0 0.0 0.0 0.0 0.0 0.0 0.0 0.0 0.0 0.0 0.0 0.0<br />
Free Cash Flow (WACC<br />
Model)<br />
-1.3 3.6 2.5 5.1 5.6 7.5 7.6 10.9 11.1 12.3 12.3 12.9 14.7 16<br />
PV of FCF -1.3 3.3 2.1 4.0 4.0 4.9 4.6 6.1 5.8 5.9 5.4 5.2 5.5 92<br />
share of PVs 2.79 % 34.90 % 62.32 %<br />
Model parameter<br />
Valuation (m)<br />
Derivation of WACC: Derivation of Beta: Present values 2023/24e 55<br />
Terminal Value 92<br />
Debt ratio 30.00 % Financial Strength 1.20 Financial liabilities 34<br />
Cost of debt 2.9 % Liquidity 1.60 Pension liabilities 2<br />
Market return 9.00 % Cyclicality 1.20 Hybrid capital 0<br />
Risk free rate 4.00 % Transparency 1.20 Minority interest 1<br />
Others 1.60 Market val. of investments 0<br />
Liquidity 6 No. of shares (m) 4.4<br />
WACC 8.44 % Beta 1.36 Equity Value 116 Value per share (<strong>EUR</strong>) 26.59<br />
Sensitivity Value per Share (<strong>EUR</strong>)<br />
Terminal Growth<br />
Delta EBIT-margin<br />
Beta (WACC) 1.25 % 1.50 % 1.75 % 2.00 % 2.25 % 2.50 % 2.75 % Beta (WACC) -1.5 pp -1.0 pp -0.5 pp 0.0 +0.5 pp +1.0 pp +1.5 pp<br />
1.65 (9.4 %) 19.53 19.99 20.49 21.01 21.58 22.18 22.83 1.65 (9.4 %) 16.65 18.10 19.56 21.01 22.47 23.93 25.38<br />
1.50 (8.9 %) 21.80 22.35 22.95 23.59 24.28 25.02 25.82 1.50 (8.9 %) 18.89 20.46 22.02 23.59 25.16 26.72 28.29<br />
1.43 (8.7 %) 23.05 23.67 24.32 25.03 25.79 26.62 27.51 1.43 (8.7 %) 20.15 21.77 23.40 25.03 26.66 28.29 29.92<br />
1.36 (8.4 %) 24.40 25.08 25.81 26.59 27.44 28.36 29.35 1.36 (8.4 %) 21.50 23.20 24.89 26.59 28.28 29.98 31.68<br />
1.29 (8.2 %) 25.85 26.60 27.41 28.28 29.22 30.25 31.37 1.29 (8.2 %) 22.98 24.75 26.51 28.28 30.05 31.81 33.58<br />
1.22 (7.9 %) 27.42 28.25 29.15 30.12 31.18 32.33 33.59 1.22 (7.9 %) 24.58 26.43 28.27 30.12 31.96 33.81 35.66<br />
1.07 (7.4 %) 30.96 31.99 33.10 34.32 35.66 37.14 38.77 1.07 (7.4 %) 28.25 30.28 32.30 34.32 36.35 38.37 40.40<br />
Sources: <strong>ISRA</strong> <strong>VISION</strong>, Warburg Research<br />
F U L L N O T E Published 25.10.2012 17
<strong>ISRA</strong> <strong>VISION</strong><br />
Free Cash Flow Value Potential<br />
Fair value between <strong>EUR</strong> 23 to <strong>EUR</strong> 26 per share looks reasonable<br />
Smaller companies rarely bear sufficient resemblance to peers in terms of geographical exposure,<br />
size or competitive strength and long-term returns often are flawed by the lack of sufficient visibility.<br />
Therefore, a Free Cash Flow based valuation has additionally been conducted.<br />
The “FCF Value Potential" reflects the ability of the company to generate sustainable free cash flows.<br />
It is based on the "FCF potential" - a FCF "ex growth" figure - which assumes unchanged working<br />
capital and pure maintenance capex. A value indication is derived by discounting the “FCF potential”<br />
of a given year with the weighted costs of capital.<br />
Free Cash Flow Value Potential – <strong>ISRA</strong> <strong>VISION</strong><br />
Figures in <strong>EUR</strong> m 2008 2009 2010 2011 2012e 2013e 2014e<br />
Net Income before minorities 8.0 6.4 7.0 9.1 10.0 11.3 12.8<br />
+ Depreciation + Amortisation 5.7 5.9 6.2 7.3 7.4 8.0 8.9<br />
- Net Interest Income -1.6 -1.0 -0.9 -1.0 -0.9 -0.9 -0.9<br />
- Maintenance Capex 5.7 5.9 6.2 7.3 7.2 8.0 8.9<br />
+ Others 0.0 0.0 0.0 0.0 0.0 0.0 0.0<br />
= Free Cash Flow Potential 9.6 7.4 7.8 10.1 11.1 12.1 13.7<br />
Free Cash Flow Yield Potential 7.6% 5.9% 6.2% 8.0% 8.6% 9.6% 10.9%<br />
WACC 8.4% 8.4% 8.4% 8.4% 8.4% 8.4% 8.4%<br />
= Enterprise Value 126.0 126.0 126.0 126.0 128.9 127.0 126.3<br />
= Fair Enterprise Value 113.7 87.9 92.9 119.9 131.3 143.9 162.4<br />
- Net Debt (Cash) 28.1 28.1 28.1 28.1 30.9 29.0 28.2<br />
- Pension Liabilities 2.0 2.0 2.0 2.0 2.0 2.0 2.1<br />
- Others 0.0 0.0 0.0 0.0 0.0 0.0 0.0<br />
- Market value of minorities 0.0 0.0 0.0 0.0 0.0 0.0 0.0<br />
+ Market value of investments 0.0 0.0 0.0 0.0 0.0 0.0 0.0<br />
= Fair Market Capitalisation 83.7 57.9 62.9 89.9 98.5 112.9 132.1<br />
No. of shares (m) 4.4 4.4 4.4 4.4 4.4 4.4 4.4<br />
= Fair value per share (<strong>EUR</strong>) 19.13 13.24 14.39 20.56 22.52 25.81 30.22<br />
premium (-) / discount (+) in % -12.8% -39.7% -34.4% -6.3% 2.6% 17.6% 37.7%<br />
Sensitivity Fair value per Share (<strong>EUR</strong>)<br />
WACC<br />
9.9% 15.21 10.21 11.19 16.42 17.98 20.85 24.61<br />
9.4% 16.38 11.11 12.14 17.66 19.34 22.33 26.28<br />
8.9% 17.68 12.12 13.20 19.03 20.84 23.97 28.14<br />
8.4% 19.13 13.24 14.39 20.56 22.52 25.81 30.22<br />
7.9% 20.77 14.51 15.73 22.29 24.41 27.89 32.56<br />
7.4% 22.63 15.95 17.25 24.25 26.56 30.24 35.21<br />
6.9% 24.76 17.59 18.99 26.49 29.01 32.93 38.25<br />
Sources: <strong>ISRA</strong> <strong>VISION</strong>, Warburg Research<br />
F U L L N O T E Published 25.10.2012 18
<strong>ISRA</strong> <strong>VISION</strong><br />
Peer-group comparison<br />
Fair value indication between <strong>EUR</strong> 23 and <strong>EUR</strong> 24 per share<br />
Based on EV/EBIT and EV/EBITDA 2012E, respectively, the peer group comparison<br />
yields a fair value between <strong>EUR</strong> 23 and <strong>EUR</strong> 24 per share.<br />
That said, a peer group comparison is not very relevant, in our view, as a peer with a<br />
comparable business model, similar end market exposure by industries, market position,<br />
and market capitalisation does not seem to be on offer.<br />
Peergroup overview<br />
Peergroup - Key Figures<br />
<strong>ISRA</strong> Vision LC Price MC EV<br />
EPS Sales EBITDA EBIT<br />
in LC in LC m in LC m 12e 13e 14e 12e 13e 14e 12e 13e 14e 12e 13e 14e<br />
Cognex USD 35.73 1,532.0 1,141.3 1.53 1.92 n.a. 327.0 364.3 393.0 98.1 119.0 112.0 81.5 101.4 98.1<br />
Perceptron USD 5.66 47.9 20.3 0.30 0.45 0.51 61.0 60.5 65.0 4.6 6.7 7.7 n.a. n.a. n.a.<br />
AVT <strong>EUR</strong> 4.10 21.8 14.0 0.66 0.71 0.66 41.0 42.5 45.5 4.3 n.a. n.a. 3.8 5.1 5.5<br />
Basler <strong>EUR</strong> 11.76 41.2 61.1 1.08 1.24 1.37 55.4 60.3 66.4 13.8 15.2 15.0 6.5 7.3 7.9<br />
<strong>ISRA</strong> Vision <strong>EUR</strong> 21.95 96.0 128.9 2.27 2.56 2.92 82.9 92.1 102.4 22.8 25.2 28.4 15.4 17.2 19.5<br />
Source: Bloomberg, Warburg Research<br />
Peergroup – Valuation Multiples<br />
Peergroup<br />
<strong>ISRA</strong> Vision LC Price MC EV<br />
P / E EV / EBITDA EV / EBIT<br />
in LC in LC m in LC m 12e 13e 14e 12e 13e 14e 12e 13e 14e<br />
Cognex USD 35.73 1,532.0 1,141.3 23.38 18.63 n.a. 11.63 9.59 10.19 14.00 11.26 11.63<br />
Perceptron USD 5.66 47.9 20.3 18.87 12.72 11.21 4.41 3.03 2.65 n.a. n.a. n.a.<br />
AVT <strong>EUR</strong> 4.10 21.8 14.0 6.17 5.76 6.21 3.25 n.a. n.a. 3.69 2.73 2.52<br />
Basler <strong>EUR</strong> 11.76 41.2 61.1 10.89 9.52 8.62 4.44 4.03 4.09 9.40 8.37 7.73<br />
Average 14.83 11.66 8.68 5.93 5.55 5.64 9.03 7.45 7.30<br />
Median 14.88 11.12 8.62 4.43 4.03 4.09 9.40 8.37 7.73<br />
<strong>ISRA</strong> Vision <strong>EUR</strong> 21.95 96.0 128.9 9.67 8.57 7.52 5.66 5.11 4.54 8.37 7.48 6.61<br />
Valuation difference to Average 53% 36% 15% 5% 9% 24% 8% 0% 10%<br />
Fair value per share based on Average 33.66 29.84 25.34 23.39 24.48 29.08 24.28 21.83 25.01<br />
Source: Bloomberg, Warburg Research<br />
F U L L N O T E Published 25.10.2012 19
<strong>ISRA</strong> <strong>VISION</strong><br />
Newsflow<br />
Solid Q3 results, outlook confirmed: Q3 results reported on August 31 were solid with<br />
9M sales growth of 11% yoy mainly driven by new orders in the industrial automation<br />
segment. EBIT margins increased slightly, owing to operating leverage. Cash flow from<br />
operations improved to <strong>EUR</strong> 10.5m in 9M (from <strong>EUR</strong> 4.1m in 9M 10/11) mainly driven by<br />
working capital management.<br />
Order backlog per end of Q3 increased to c. <strong>EUR</strong> 55m which is impressive (<strong>EUR</strong><br />
40m in 9M 10/11). The equity ratio of 58% (vs. 57% at the end of Q3 last year) is very<br />
solid. Against this backdrop, management reiterated its outlook for 2011/12 with a sales<br />
target of at least <strong>EUR</strong> 80m (WRe: <strong>EUR</strong> 83m).<br />
<strong>ISRA</strong> <strong>VISION</strong> – Q3 2011/12 results (FY ends 30.09.)<br />
in <strong>EUR</strong> m Q3/12 Q3/11 yoy 9M/12 9M/11 yoy<br />
Sales 20.3 19.0 6.9% 57.6 51.7 11.5%<br />
Gross profit 11.1 10.6 5.5% 31.4 28.3 10.9%<br />
margin 54.8% 55.5% 54.6% 54.8%<br />
EBIT 3.8 3.4 9.1% 10.7 9.6 12.1%<br />
margin 18.5% 18.1% 18.6% 18.5%<br />
EPS in <strong>EUR</strong> 0.56 0.51 9.8% 1.58 1.41 12.1%<br />
Sources: <strong>ISRA</strong> <strong>VISION</strong>, Warburg Research<br />
Smaller acquisition in September 2012: on September 5, the company announced the<br />
acquisition of 3D-Shape, a smaller 3D machine vision specialist (sales of c. <strong>EUR</strong> 1.5m)<br />
supplying in-depth knowledge of 3D shape measurement of objects and surfaces. The<br />
technology can be applied in the fields of quality control and precision measurement.<br />
Next datapoint: preliminary Q4 2011/2012 results due on December 14, 2012.<br />
<strong>ISRA</strong> Vision - Event activity chart<br />
0.50<br />
0.43<br />
Volume (Shrs. in Mil.) 15-Oct-2010 to 18-Oct-2012 High: 22.75 Low: 14.56 Last: 22.18 Price (<strong>EUR</strong>)<br />
1<br />
25.00<br />
23.14<br />
0.36<br />
0.29<br />
0.21<br />
0.14<br />
0.07<br />
3<br />
2<br />
21.29<br />
19.43<br />
17.57<br />
15.71<br />
13.86<br />
0.00<br />
1.11 4.11 7.11 10.11 1.12 4.12 7.12 10.12<br />
12.00<br />
Volume(Left) Price (Right) Event<br />
Date Event Type Event Description Source Impact(%)*<br />
1 05-Sep-12 Deal Activity <strong>ISRA</strong> <strong>VISION</strong> <strong>AG</strong> acquired 3D-Shape GmbH for an undisclosed amount. The... Mergerstat 4,09<br />
2 21-Mrz-12 Corporate Actions Ex-date for dividend payment of €0.25 Pricing -2,54<br />
3 30-Mrz-11 Corporate Actions Ex-date for dividend payment of €0.20 Pricing -4,00<br />
*As a default, the impact column displays the percentage price change of the stock based on three days prior and three days after the event took place.<br />
Sources: FactSet, Warburg Research<br />
F U L L N O T E Published 25.10.2012 20
<strong>ISRA</strong> <strong>VISION</strong><br />
Company & Products<br />
Product Range<br />
<strong>ISRA</strong> <strong>VISION</strong> reports in two divisions: Surface Vision (81.5% of sales in 2010/11) and<br />
Industrial Automation (18.5% of sales). To take a closer look at the technology, however,<br />
it is reasonable to further divide the Industrial Automation segment into Robot Vision and<br />
Quality Inspection.<br />
Surface Vision<br />
Today’s quality standards demand high quality levels with regard to complex surfaces.<br />
These can be homogenous, patterned, printed, coated and colored. <strong>ISRA</strong> <strong>VISION</strong> offers<br />
inspection solutions for glass, plastics/non-wovens, painted finished parts, paper and<br />
print products. Customers gain flexibility through <strong>ISRA</strong> <strong>VISION</strong>’s basic concept of<br />
standard modules and components developed in-house. This concept classifies,<br />
visualises and archives the detected defects. With the help of intelligent software,<br />
defects do not proceed to subsequent production steps thus helping to produce in a costeffective<br />
way.<br />
Surface Vision: Metal inspection<br />
Source: <strong>ISRA</strong> <strong>VISION</strong><br />
Characteristics:<br />
• Image database of defects<br />
• Real-time image processing<br />
• Teaching Process (see graphic below)<br />
• Statistical evaluation of the results<br />
• User-friendly configuration<br />
• Easy integration into existing process cycles<br />
• System can be controlled and monitored.<br />
F U L L N O T E Published 25.10.2012 21
<strong>ISRA</strong> <strong>VISION</strong><br />
Automatic generation of training data<br />
Type A<br />
High confidence<br />
ok<br />
Classifier<br />
Type B<br />
Evaluation of<br />
classification<br />
Low confidence<br />
Type ?<br />
Unknown<br />
Training<br />
unknown<br />
uncertain<br />
Teacher<br />
Ask teacher<br />
Source: <strong>ISRA</strong> <strong>VISION</strong>, Warburg Research<br />
EPROMI / Expert5i modules<br />
Quality data provided by surface inspection systems is crucial to manufacturers but<br />
alone not sufficient to improve processes. EPROMI – Enterprise PROduction<br />
Management Intelligence – is a software suite that enables customers to have access to<br />
all relevant information and its evaluation, thereby supporting management decisions.<br />
With EPROMI production management can exercise direct control over operations in the<br />
production hall. Data is provided in a clear and compact format and can be connected to<br />
business management data such as order and resource planning. The so-called Expert5i<br />
modules then analyse and weigh-up all of the information and generate knowledgebased<br />
suggestions for the decision makers. Combining the information in different ways<br />
reveals correlations and unleashes optimisation potential for processes. The tool also<br />
works in a preventative way: if problems are likely to occur, operators will receive early<br />
warnings and relevant intervention options.<br />
Robot Vision<br />
Robot guidance has been the core competence since <strong>ISRA</strong> <strong>VISION</strong> was founded in<br />
1985. Nowadays, robotic technology has become an important economic factor in<br />
industrial automation and provides a huge number of application opportunities. Ever<br />
since, the company has been regularly introducing technology to new markets. An<br />
example is Floatscan 5D for glass inspection which enables five inspection steps in a<br />
single product, thereby contributing to cost-effective production.<br />
Robot Vision gives industrial robots intelligent eyes. With these eyes, robots can<br />
recognise and adjust the position of objects with pinpoint precision. It provides the<br />
handling system with information on where the component to be moved is located. <strong>ISRA</strong><br />
<strong>VISION</strong> offers a broad range of robot vision products – from simple pick & place<br />
applications to complex 3D tasks.<br />
F U L L N O T E Published 25.10.2012 22
<strong>ISRA</strong> <strong>VISION</strong><br />
Robot Vision: Multiple eyes for the three dimensional world<br />
Source: <strong>ISRA</strong> <strong>VISION</strong>, Warburg Research<br />
Technologies:<br />
• Fast and precise position determination of components using robust algorithms<br />
• Coordination between the camera system, the robot, the object and the cell<br />
• Resistance to transmission errors between the image processor and the robot via<br />
several interfaces and protocols<br />
• Add-ons: quality measurement, inspection and documentation of the results<br />
• Simplification of the software and the interface to make it user-friendly<br />
Core components:<br />
• High-performance frame grabbers (developed in-house)<br />
• Sensors for robot-suited miniature cameras, stereo sensors and 3D form matching<br />
sensors<br />
• Supporting technology: easy-to-use software with components for measuring,<br />
inspecting, communication, data archiving and user support<br />
New product line: “Plug & Automate”<br />
With “Plug & Automate” <strong>ISRA</strong> <strong>VISION</strong> steps into the do-it-yourself terrain. The new<br />
generic product family is a ready-to-use automation technology for the factory floor.<br />
Customers can use the tools for various tasks (robot guidance, measurement technology<br />
and quality assurance). The sensors already incorporate all common communication and<br />
robot interfaces. Depending on the budget and the need, customers are able to buy<br />
sensors, the software suite or the entire package. The clear and simply designed<br />
software (based on Windows 8) has a tablet-like touch control. The easy<br />
parameterisation approach makes programming and thereby experts redundant.<br />
Revenue contribution is not expected before 2012/2013.<br />
F U L L N O T E Published 25.10.2012 23
<strong>ISRA</strong> <strong>VISION</strong><br />
Plug & Automate<br />
Source: <strong>ISRA</strong> <strong>VISION</strong>, Warburg Research<br />
Quality Inspection<br />
Quality inspection systems involve the inspection of presence, contours and<br />
measurements, the assurance of complete assembly and right positions and the<br />
verification of article or production codes. An example of a quality inspection solution<br />
offered by <strong>ISRA</strong> <strong>VISION</strong> is the inspection of placed rivets in the aerospace production.<br />
New product developments<br />
For <strong>ISRA</strong> <strong>VISION</strong>, the focus of new technology lies on the generation of higher ROI and<br />
added value for customers. In the last two years the company has launched more than<br />
20 new innovations, emphasising its technological leadership. In the first nine month of<br />
2011/12 <strong>ISRA</strong> <strong>VISION</strong> invested a total of <strong>EUR</strong> 9.4m in R&D, thereof <strong>EUR</strong> 6.4m for new<br />
products which are nearing market launch. Some technologies, which will most likely<br />
contribute to <strong>ISRA</strong> <strong>VISION</strong>’s growth story in the next quarters, are briefly described<br />
below.<br />
Floatscan 5D<br />
Floatscan 5D is a next generation inspection system with patented high-speed LED<br />
technology for float glass production. It includes five optical channels in one sensor. The<br />
multi-modal lighting system is able to carry out different lighting effects, making multiple<br />
angle arrangements redundant. It detects a far greater number defects than conventional<br />
systems due to higher light intensity. On top of this, it not only locates the defects but<br />
assess where and why the defects occurred. The upgraded software provides a greater<br />
differential defect classification. Floatscan 5D has a high potential as even smallest<br />
defects in the float glass production can cause serious problems in higher processing<br />
steps. It is estimated that with this technology customers can save up to <strong>EUR</strong> 1m per<br />
year.<br />
PrintSTAR (extended portfolio)<br />
PrintSTAR is the world-leading inspection system in the print industry that enables both<br />
quality and process control. Recently, <strong>ISRA</strong> <strong>VISION</strong> launched the third generation series.<br />
It offers new features in that it provides in-line PDF verification in colour using a single<br />
reference image. This image is compared with the “golden master” produced during the<br />
first print run. It is now possible to compare printed sheets with the proofed master sheet<br />
during the actual running production. In case of deviations between the PDF and the<br />
print image, the defect can be corrected before expensive machine time and paper is<br />
wasted. With the new series, gaps in the digital inspection chain are eliminated.<br />
F U L L N O T E Published 25.10.2012 24
<strong>ISRA</strong> <strong>VISION</strong><br />
PATTERNSCAN<br />
The PATTERNSCAN system offers a 100% optical in-line inspection of pattern glass for<br />
the solar industry. The system is equipped with <strong>ISRA</strong> <strong>VISION</strong>’s new multi-mode and<br />
multi-view lighting technologies. The extremely fast and switchable LEDs enable as yet<br />
unequalled inspection performances by detecting even smallest defects and scratches.<br />
The low operating cost and technical requirements make it an interesting tool to increase<br />
yields and save material, which is crucial in the competitive solar industry. Less than one<br />
year after market launch, PATTERNSCAN was already sold 50 times to solar panel<br />
manufacturers (primarily in Asia).<br />
Surface Master<br />
The Surface Master is a product line for the metal industry, providing surface inspection,<br />
quality assessment, process monitoring and statistical analysis for decision making. The<br />
defect recognition rate is >98% and system availability >99.8%. It contains an industryleading<br />
multi-stage classifier which, in case of detection, immediately takes action to<br />
correct and improve the production process. According to <strong>ISRA</strong> <strong>VISION</strong>, newest lighting<br />
and fastest camera technology, highest resolution and image quality coupled with the<br />
shortest pay-back period makes Surface Master systems a must-have for metal<br />
manufacturers. The first roll-outs took place in Q3 2011/12.<br />
Acquisition of 3D Shape<br />
Most recently, <strong>ISRA</strong> <strong>VISION</strong> has acquired a smaller 3D machine vision specialist called<br />
‘3D Shape’. While its size (sales of c. <strong>EUR</strong> 1.5m) is not meaningful, the in-depth knowhow<br />
in 3D technology strengthens <strong>ISRA</strong> <strong>VISION</strong>’s own product portfolio. 3D Shape was<br />
founded as a university spin-off and focuses on 3D shape measurement of objects and<br />
surfaces. The technology can be applied in the fields of quality control and precision<br />
measurement. According to <strong>ISRA</strong> <strong>VISION</strong>, 3D Shape boasts important customer<br />
relationships in the glass, semiconductor – opening up additional growth potential -,<br />
medical and automotive industry.<br />
<strong>ISRA</strong> <strong>VISION</strong>’s History at a Glance<br />
Company history<br />
Foundation of <strong>ISRA</strong><br />
Systemtechnik GmbH<br />
at the Technical<br />
University of<br />
Darmstadt, Germany<br />
by Enis Ersü and other<br />
experts<br />
<strong>ISRA</strong> supervised<br />
TEXAUGE, a commercial<br />
and scientific project for<br />
fast surface texture<br />
inspection<br />
After the creation of<br />
<strong>ISRA</strong> Vision <strong>AG</strong>, the<br />
company went<br />
public; Volkswagen<br />
achieved equipment<br />
for the Transparent<br />
Factory<br />
<strong>ISRA</strong> was<br />
awarded as<br />
one of the Top<br />
100 most<br />
innovative<br />
German SMEs.<br />
Integration of<br />
Parsytec<br />
Integration of<br />
Graphikon GmbH<br />
solar market<br />
penetration<br />
1985 1988<br />
1996 1997 2000<br />
2001-<br />
2006<br />
2007 2010<br />
First system for<br />
automotive<br />
development obtained<br />
the Hessian<br />
Innovation Award<br />
Enis Ersü, CEO,<br />
carried out a spin-off<br />
and founded the <strong>ISRA</strong><br />
Vision GmbH; first 3D<br />
robot vision system<br />
followed<br />
Several acquisitions<br />
and co-operations were<br />
placed. Long-term<br />
contractual agreements<br />
were signed<br />
Expansion to<br />
Shanghai. Today<br />
<strong>ISRA</strong> is represented<br />
in 15 countries<br />
Source: <strong>ISRA</strong> <strong>VISION</strong>, Warburg Research<br />
Management background and shareholder structure<br />
The major shareholder, Mr. Enis Ersü, is the founder and CEO of <strong>ISRA</strong> <strong>VISION</strong>. The free<br />
float of ca. 70% is calculated excluding the stake of the CEO and Vision GbR is an<br />
investment vehicle of <strong>ISRA</strong> <strong>VISION</strong> employees. Other shareholdings are included in the<br />
F U L L N O T E Published 25.10.2012 25
<strong>ISRA</strong> <strong>VISION</strong><br />
free float. The company is publicly listed in the Prime Standard of the Frankfurt Stock<br />
Exchange. At the moment, the company has 4.4m shares outstanding.<br />
Shareholder structure<br />
Fidelity; 10.1%<br />
Enis Ers ü; 25.2%<br />
CI Inves tments; 5.1%<br />
Vision GbR; 5.0%<br />
Argos; 3.3%<br />
Panamera Found.; 3.2%<br />
DW S Inv.; 3.1%<br />
Other; 42.2%<br />
Source: Bloomberg, Warburg Research<br />
<strong>ISRA</strong> <strong>VISION</strong> – Management team<br />
Enis Ersü<br />
• CEO since 1998 founded <strong>ISRA</strong> Vision GmbH (transformed from a<br />
university spin-off)<br />
• Studied engineering at the Technical University of Darmstadt<br />
• Former VDMA chairman (machine vision division)<br />
Hans-Jürgen Christ<br />
• Co-CEO and CEO of Parsytec<br />
• Head of sales<br />
• Studied engineering at the Technical University of Darmstadt<br />
Werner Rothermel<br />
• Member of the exec. board<br />
• Head of production and<br />
engineering<br />
• Graduated engineer<br />
Dr. Johannes Giet<br />
• Member of the exec. board<br />
• Head of research<br />
• Expert in Surface Vision<br />
systems<br />
Martin Heinrich<br />
• Head of finance<br />
• Former financial officer at<br />
IS RA<br />
Source: <strong>ISRA</strong> <strong>VISION</strong>, Warburg Research<br />
F U L L N O T E Published 25.10.2012 26
<strong>ISRA</strong> <strong>VISION</strong><br />
Financials<br />
High gross margins set the stage for operating leverage<br />
The basis for operating leverage is supplied by high gross margins at levels of 60%<br />
based on total cost accounting and of 53% based on cost of sales accounting. The<br />
company’s operating cost base is relatively lean, mainly driven by SG&A and R&D costs.<br />
In the mid-term, the following cost structure looks plausible, in our view:<br />
• Sales and marketing expenses look set to remain below 18% of sales on average as<br />
the distribution of the product is mainly done directly. General and administration<br />
should stay at ca. 5% of sales<br />
• Since the machine vision market offers largely untapped potential, driven by the need<br />
to constantly invest in new product developments and increase efficiency, total R&D<br />
costs are assumed at around 12% of sales.<br />
• Depreciation and amortisation should stay at around levels of 9% of sales (included in<br />
cost of sales)<br />
• The financial result is assumed around 1% of sales, driven by low interest rates and low<br />
net debt levels of <strong>EUR</strong> 28m per end of 2010/11, expected to decline going forward.<br />
• EBIT margins look set to increase from 18.8% last year to levels of 20% in the short to<br />
mid term, driven by degression of fixed costs.<br />
Operating Leverage – <strong>ISRA</strong> Vision<br />
2.5<br />
2.0<br />
1.5<br />
1.0<br />
0.5<br />
0.0<br />
2009 2010 2011 2012e 2013e 2014e<br />
Operating Leverage<br />
OPEX / Sales<br />
Gross margin<br />
EBIT margin<br />
40.0%<br />
35.0%<br />
30.0%<br />
25.0%<br />
20.0%<br />
15.0%<br />
10.0%<br />
5.0%<br />
0.0%<br />
Sources: <strong>ISRA</strong> Vision (historical data), Warburg Research (forecasts)<br />
Strong balance sheet<br />
<strong>ISRA</strong> <strong>VISION</strong>’s total assets of <strong>EUR</strong> 179m at the end of Q3 2011/12 are mainly<br />
• Fixed assets (<strong>EUR</strong> 95.5m, 53% of total assets), thereof intangible assets of <strong>EUR</strong> 84m<br />
(47% of total asset), of which goodwill accounts for <strong>EUR</strong> 37m or 21% of total assets<br />
mainly resulting from acquisitions, internally produced and capitalised assets and<br />
software and licenses.<br />
• Accounts receivable and Inventory account for 40% of total assets.<br />
• Assets are financed to a large extent by equity (<strong>EUR</strong> 103m, 57% equity ratio).<br />
• The book value of equity looks set to increase from <strong>EUR</strong> 98m per end of 2010/11<br />
towards <strong>EUR</strong> 130m as of end 2013/14e.<br />
F U L L N O T E Published 25.10.2012 27
<strong>ISRA</strong> <strong>VISION</strong><br />
Balance Sheet Quality – <strong>ISRA</strong> Vision<br />
140,0<br />
120,0<br />
100,0<br />
80,0<br />
60,0<br />
40,0<br />
20,0<br />
0,0<br />
2008 2009 2010 2011 2012e 2013e 2014e<br />
40,0%<br />
35,0%<br />
30,0%<br />
25,0%<br />
20,0%<br />
15,0%<br />
10,0%<br />
5,0%<br />
0,0%<br />
Net Debt Book value of Equity Net Gearing<br />
Sources: <strong>ISRA</strong> Vision (historical data), Warburg Research (forecasts)<br />
Returns analysis<br />
Returns on capital employed look set to increase going forward, driven by an expected<br />
increase in EBIT margins as well as an expected increase in capital turnover on the back<br />
of ongoing sales growth. Cyclicality of returns should be limited owing to <strong>ISRA</strong> <strong>VISION</strong>’s<br />
broad sales exposure, diversified by industries, regions and customers which should limit<br />
overdependence.<br />
ROCE Development – <strong>ISRA</strong> Vision<br />
25.0%<br />
20.0%<br />
15.0%<br />
10.0%<br />
5.0%<br />
0.0%<br />
2008 2009 2010 2011 2012e 2013e 2014e<br />
0.64<br />
0.62<br />
0.60<br />
0.58<br />
0.56<br />
0.54<br />
0.52<br />
0.50<br />
0.48<br />
0.46<br />
ROCE EBIT-margin Capital Employed Turnover<br />
Sources: <strong>ISRA</strong> Vision (historical data), Warburg Research (forecasts)<br />
F U L L N O T E Published 25.10.2012 28
<strong>ISRA</strong> <strong>VISION</strong><br />
DCF model<br />
Detailed forecast period Transitional period Term. Value<br />
Figures in <strong>EUR</strong> m 11/12e 12/13e 13/14e 14/15e 15/16e 16/17e 17/18e 18/19e 19/20e 20/21e 21/22e 22/23e 23/24e<br />
Sales 82.9 92.1 102.4 110.5 119.4 128.9 139.3 147.6 156.5 164.3 172.5 179.4 184.8<br />
Sales change 10.3 % 11.1 % 11.1 % 8.0 % 8.0 % 8.0 % 8.0 % 6.0 % 6.0 % 5.0 % 5.0 % 4.0 % 3.0 % 2.0 %<br />
EBIT 15.4 17.2 19.5 21.0 22.7 24.5 25.8 27.3 28.2 28.8 29.3 28.7 27.7<br />
EBIT-margin 18.6 % 18.7 % 19.0 % 19.0 % 19.0 % 19.0 % 18.5 % 18.5 % 18.0 % 17.5 % 17.0 % 16.0 % 15.0 %<br />
Tax rate (EBT) 31.0 % 31.0 % 31.0 % 31.0 % 31.0 % 31.0 % 31.0 % 31.0 % 31.0 % 31.0 % 31.0 % 31.0 % 31.0 %<br />
NOPAT 10.6 11.9 13.4 14.5 15.7 16.9 17.8 18.8 19.4 19.8 20.2 19.8 19.1<br />
Depreciation 7.4 8.0 8.9 9.6 10.3 11.2 12.1 12.8 13.6 14.2 14.9 15.5 16.0<br />
in % of Sales 8.9 % 8.7 % 8.7 % 8.7 % 8.7 % 8.7 % 8.7 % 8.7 % 8.7 % 8.7 % 8.7 % 8.7 % 8.7 %<br />
Changes in provisions 0.0 0.1 0.1 0.2 0.2 0.2 0.2 0.2 0.2 0.2 0.2 0.1 0.1<br />
Change in Liquidity from<br />
- Working Capital 9.0 5.9 8.4 6.8 7.3 7.9 8.5 6.9 7.3 6.5 6.8 5.7 4.4<br />
- Capex 10.3 10.4 11.4 12.4 13.3 12.9 13.9 14.0 14.7 15.4 16.2 16.9 16.1<br />
Capex in % of Sales 12.4 % 11.3 % 11.2 % 11.2 % 11.2 % 10.0 % 10.0 % 9.5 % 9.4 % 9.4 % 9.4 % 9.4 % 8.7 %<br />
Other 0.0 0.0 0.0 0.0 0.0 0.0 0.0 0.0 0.0 0.0 0.0 0.0 0.0<br />
Free Cash Flow (WACC<br />
Model)<br />
-1.3 3.6 2.5 5.1 5.6 7.5 7.6 10.9 11.1 12.3 12.3 12.9 14.7 16<br />
PV of FCF -1.3 3.3 2.1 4.0 4.0 4.9 4.6 6.1 5.8 5.9 5.4 5.2 5.5 92<br />
share of PVs 2.79 % 34.90 % 62.32 %<br />
Model parameter<br />
Valuation (m)<br />
Derivation of WACC: Derivation of Beta: Present values 2023/24e 55<br />
Terminal Value 92<br />
Debt ratio 30.00 % Financial Strength 1.20 Financial liabilities 34<br />
Cost of debt 2.9 % Liquidity 1.60 Pension liabilities 2<br />
Market return 9.00 % Cyclicality 1.20 Hybrid capital 0<br />
Risk free rate 4.00 % Transparency 1.20 Minority interest 1<br />
Others 1.60 Market val. of investments 0<br />
Liquidity 6 No. of shares (m) 4.4<br />
WACC 8.44 % Beta 1.36 Equity Value 116 Value per share (<strong>EUR</strong>) 26.59<br />
Sensitivity Value per Share (<strong>EUR</strong>)<br />
Terminal Growth<br />
Delta EBIT-margin<br />
Beta (WACC) 1.25 % 1.50 % 1.75 % 2.00 % 2.25 % 2.50 % 2.75 % Beta (WACC) -1.5 pp -1.0 pp -0.5 pp 0.0 +0.5 pp +1.0 pp +1.5 pp<br />
1.65 (9.4 %) 19.53 19.99 20.49 21.01 21.58 22.18 22.83 1.65 (9.4 %) 16.65 18.10 19.56 21.01 22.47 23.93 25.38<br />
1.50 (8.9 %) 21.80 22.35 22.95 23.59 24.28 25.02 25.82 1.50 (8.9 %) 18.89 20.46 22.02 23.59 25.16 26.72 28.29<br />
1.43 (8.7 %) 23.05 23.67 24.32 25.03 25.79 26.62 27.51 1.43 (8.7 %) 20.15 21.77 23.40 25.03 26.66 28.29 29.92<br />
1.36 (8.4 %) 24.40 25.08 25.81 26.59 27.44 28.36 29.35 1.36 (8.4 %) 21.50 23.20 24.89 26.59 28.28 29.98 31.68<br />
1.29 (8.2 %) 25.85 26.60 27.41 28.28 29.22 30.25 31.37 1.29 (8.2 %) 22.98 24.75 26.51 28.28 30.05 31.81 33.58<br />
1.22 (7.9 %) 27.42 28.25 29.15 30.12 31.18 32.33 33.59 1.22 (7.9 %) 24.58 26.43 28.27 30.12 31.96 33.81 35.66<br />
1.07 (7.4 %) 30.96 31.99 33.10 34.32 35.66 37.14 38.77 1.07 (7.4 %) 28.25 30.28 32.30 34.32 36.35 38.37 40.40<br />
• Sales growth looks set to remain clearly above GDP growth driven by automation trend and need to increase efficiency<br />
• EBIT margins assumed to remain at high levels driven by sales growth and operating leverage<br />
• Margins look set to erode slightly thereafter assuming increased competitiveness, partly defended by the company’s R&D<br />
• Working capital requirements are expected to remain at high levels owing to the customer structure<br />
F U L L N O T E Published 25.10.2012 29
<strong>ISRA</strong> <strong>VISION</strong><br />
Free Cash Flow Value Potential<br />
Warburg Research's valuation tool "FCF Value Potential" reflects the ability of the company to generate sustainable free cash flows. It is based on the<br />
"FCF potential" - a FCF "ex growth" figure - which assumes unchanged working capital and pure maintenance capex. A value indication is derived by<br />
discounting the “FCF potential” of a given year with the weighted costs of capital. The fluctuating value indications over time add a timing element to the<br />
DCF model (our preferred valuation tool).<br />
in <strong>EUR</strong> m 2007/08 2008/09 2009/10 2010/11 2011/12e 2012/13e 2013/14e<br />
Net Income before minorities 8.0 6.4 7.0 9.1 10.0 11.3 12.8<br />
+ Depreciation + Amortisation 5.7 5.9 6.2 7.3 7.4 8.0 8.9<br />
- Net Interest Income -1.6 -1.0 -0.9 -1.0 -0.9 -0.9 -0.9<br />
- Maintenance Capex 5.7 5.9 6.2 7.3 7.2 8.0 8.9<br />
+ Other 0.0 0.0 0.0 0.0 0.0 0.0 0.0<br />
= Free Cash Flow Potential 9.6 7.4 7.8 10.1 11.1 12.1 13.7<br />
Free Cash Flow Yield Potential 12.1 % 12.6 % 9.1 % 9.5 % 8.8 % 9.8 % 11.1 %<br />
WACC 8.44 % 8.44 % 8.44 % 8.44 % 8.44 % 8.44 % 8.44 %<br />
= Enterprise Value (EV) 79.1 58.7 86.0 106.4 126.1 124.3 123.5<br />
= Fair Enterprise Value 113.7 87.9 92.9 119.9 131.3 143.9 162.4<br />
- Net Debt (Cash) 28.1 28.1 28.1 28.1 30.9 29.0 28.2<br />
- Pension Liabilities 2.0 2.0 2.0 2.0 2.0 2.0 2.1<br />
- Other 0.0 0.0 0.0 0.0 0.0 0.0 0.0<br />
- Market value of minorities 0.0 0.0 0.0 0.0 0.0 0.0 0.0<br />
+ Market value of investments 0.0 0.0 0.0 0.0 0.0 0.0 0.0<br />
= Fair Market Capitalisation 83.7 57.9 62.9 89.9 98.5 112.9 132.1<br />
No. of shares (total) (m) 4.4 4.4 4.4 4.4 4.4 4.4 4.4<br />
= Fair value per share (<strong>EUR</strong>) 19.13 13.24 14.39 20.56 22.52 25.81 30.22<br />
premium (-) / discount (+) in % 5.6 % 21.1 % 41.7 %<br />
Sensitivity Fair value per Share (<strong>EUR</strong>)<br />
9.94 % 15.21 10.21 11.19 16.42 17.98 20.85 24.61<br />
9.44 % 16.38 11.11 12.14 17.66 19.34 22.33 26.28<br />
8.94 % 17.68 12.12 13.20 19.03 20.84 23.97 28.14<br />
WACC 8.44 % 19.13 13.24 14.39 20.56 22.52 25.81 30.22<br />
7.94 % 20.77 14.51 15.73 22.29 24.41 27.89 32.56<br />
7.44 % 22.63 15.94 17.25 24.25 26.56 30.24 35.21<br />
6.94 % 24.76 17.59 18.99 26.49 29.01 32.93 38.25<br />
• A high market share in its targeted niche markets supply a certain level of defence against new entrants<br />
• The beta takes into account the low liquidity<br />
F U L L N O T E Published 25.10.2012 30
<strong>ISRA</strong> <strong>VISION</strong><br />
Valuation<br />
2007/08 2008/09 2009/10 2010/11 2011/12e 2012/13e 2013/14e<br />
Price / Book 0.7 x 0.4 x 0.7 x 0.8 x 0.9 x 0.8 x 0.7 x<br />
Book value per share ex intangibles 1.11 2.09 1.65 3.25 5.00 6.74 8.71<br />
EV / Sales 1.2 x 1.0 x 1.3 x 1.4 x 1.5 x 1.3 x 1.2 x<br />
EV / EBITDA 4.3 x 3.9 x 4.9 x 5.0 x 5.5 x 4.9 x 4.4 x<br />
EV / EBIT 6.1 x 6.3 x 7.5 x 7.5 x 8.2 x 7.2 x 6.3 x<br />
EV / EBIT adj.* n.a. n.a. n.a. n.a. n.a. n.a. n.a.<br />
P / FCF n.a. 4.9 x n.a. n.a. n.a. 31.1 x 48.9 x<br />
P / E 6.8 x 5.4 x 8.3 x 8.4 x 9.4 x 8.3 x 7.3 x<br />
P / E adj.* 6.8 x 5.4 x 8.3 x 8.4 x 9.4 x 8.3 x 7.3 x<br />
Dividend Yield 1.3 % 1.8 % 1.5 % 1.1 % 1.2 % 1.2 % 1.4 %<br />
Free Cash Flow Yield Potential 12.1 % 12.6 % 9.1 % 9.5 % 8.8 % 9.8 % 11.1 %<br />
*Adjustments made for: -<br />
F U L L N O T E Published 25.10.2012 31
<strong>ISRA</strong> <strong>VISION</strong><br />
Consolidated profit and loss<br />
In <strong>EUR</strong> m 2007/08 2008/09 2009/10 2010/11 2011/12e 2012/13e 2013/14e<br />
Sales 68.3 58.2 64.8 75.2 82.9 92.1 102.4<br />
Change Sales yoy n.a. -14.8 % 11.5 % 15.9 % 10.3 % 11.1 % 11.1 %<br />
COGS 32.5 28.2 30.5 34.9 39.4 44.3 49.0<br />
Gross profit 35.8 30.0 34.3 40.2 43.5 47.8 53.4<br />
Gross margin 52.4 % 51.6 % 52.9 % 53.5 % 52.5 % 51.9 % 52.1 %<br />
Research and development 7.5 7.7 8.3 9.7 10.3 11.1 12.3<br />
Sales and marketing 11.1 10.3 11.5 13.7 14.6 16.0 17.7<br />
Administration expenses 4.4 3.8 3.8 4.2 4.4 4.8 5.3<br />
Other operating expenses 0.0 0.0 0.0 0.0 0.0 0.0 0.0<br />
Other operating income 0.2 1.0 0.8 1.4 1.2 1.3 1.4<br />
Unfrequent items 0.0 0.0 0.0 0.0 0.0 0.0 0.0<br />
EBITDA 18.6 15.2 17.6 21.4 22.8 25.2 28.4<br />
Margin 27.2 % 26.1 % 27.2 % 28.5 % 27.5 % 27.4 % 27.7 %<br />
Depreciation of fixed assets 0.6 0.6 0.6 0.6 0.8 1.3 1.4<br />
EBITA 18.0 14.6 17.0 20.8 21.9 23.9 26.9<br />
Amortisation of intangible fixed assets 5.0 5.4 5.5 6.7 6.6 6.7 7.4<br />
Goodwill amortization 0.0 0.0 0.0 0.0 0.0 0.0 0.0<br />
EBIT 12.9 9.3 11.4 14.1 15.4 17.2 19.5<br />
Margin 18.9 % 15.9 % 17.6 % 18.8 % 18.6 % 18.7 % 19.0 %<br />
EBIT adj. 12.9 9.3 11.4 14.1 15.4 17.2 19.5<br />
Interest income 0.4 0.1 0.1 0.1 0.1 0.1 0.1<br />
Interest expenses 2.0 1.1 0.9 1.1 1.0 1.0 1.0<br />
Other financial income (loss) 0.0 0.0 0.0 0.0 0.0 0.0 0.0<br />
EBT 11.3 8.3 10.6 13.2 14.5 16.3 18.6<br />
Margin 16.6 % 14.2 % 16.3 % 17.5 % 17.5 % 17.7 % 18.2 %<br />
Total taxes 3.3 1.8 3.6 4.0 4.5 5.1 5.8<br />
Net income from continuing operations 8.0 6.4 7.0 9.1 10.0 11.3 12.8<br />
Income from discontinued operations (net of tax) 0.0 0.0 0.0 0.0 0.0 0.0 0.0<br />
Net income before minorities 8.0 6.4 7.0 9.1 10.0 11.3 12.8<br />
Minority interest 0.4 0.0 0.1 0.1 0.1 0.1 0.1<br />
Net income 7.6 6.5 6.9 9.1 9.9 11.2 12.8<br />
Margin 11.1 % 11.1 % 10.6 % 12.1 % 12.0 % 12.1 % 12.5 %<br />
Number of shares, average 4.3 4.3 4.3 4.3 4.4 4.4 4.4<br />
EPS 1.76 1.52 1.61 2.09 2.27 2.56 2.92<br />
EPS adj. 1.76 1.52 1.61 2.09 2.27 2.56 2.92<br />
*Adjustments made for:<br />
Guidance: At least <strong>EUR</strong> 80m sales in 2011/12.<br />
Financial Ratios<br />
2007/08 2008/09 2009/10 2010/11 2011/12e 2012/13e 2013/14e<br />
Total Operating Costs / Sales 33.5 % 35.6 % 35.3 % 34.7 % 33.9 % 33.2 % 33.1 %<br />
Operating Leverage n.a. 1.9 x 2.0 x 1.5 x 0.9 x 1.1 x 1.2 x<br />
EBITDA / Interest expenses 9.3 x 13.4 x 18.7 x 19.6 x 22.3 x 24.7 x 27.8 x<br />
Tax rate (EBT) 29.5 % 22.3 % 34.1 % 30.5 % 31.0 % 31.0 % 31.0 %<br />
Dividend Payout Ratio 8.1 % 10.0 % 12.4 % 9.5 % 10.9 % 9.9 % 9.9 %<br />
Sales per Employee 183,565 153,438 168,878 171,584 176,732 183,801 191,153<br />
Sales, EBITDA<br />
in <strong>EUR</strong> m<br />
Operating Performance<br />
in %<br />
Performance per Share<br />
Source: Warburg Research<br />
Source: Warburg Research<br />
Source: Warburg Research<br />
F U L L N O T E Published 25.10.2012 32
<strong>ISRA</strong> <strong>VISION</strong><br />
Consolidated balance sheet<br />
In <strong>EUR</strong> m 2007/08 2008/09 2009/10 2010/11 2011/12e 2012/13e 2013/14e<br />
Assets<br />
Goodwill and other intangible assets 69.7 71.5 80.4 82.8 85.5 88.2 91.2<br />
thereof other intangible assets 0.0 0.0 0.0 0.0 0.0 0.0 0.0<br />
thereof Goodwill 38.7 37.6 37.3 36.5 36.5 36.5 36.5<br />
Property, plant and equipment 2.6 2.7 2.8 3.5 3.8 3.5 3.1<br />
Financial assets 0.0 0.9 1.2 1.1 1.1 1.1 1.1<br />
Other long-term assets 0.0 0.0 0.0 0.0 0.0 0.0 0.0<br />
Fixed assets 72.3 75.1 84.4 87.5 90.4 92.8 95.4<br />
Inventories 17.2 15.1 14.1 18.8 23.0 23.6 26.2<br />
Accounts receivable 37.8 37.1 46.9 50.3 56.3 62.6 69.5<br />
Liquid assets 12.6 7.2 8.0 5.8 3.0 4.9 5.7<br />
Other short-term assets 9.8 7.4 7.5 8.0 9.5 9.8 9.9<br />
Current assets 77.4 66.7 76.6 82.9 91.7 100.9 111.3<br />
Total Assets 149.7 141.8 160.9 170.4 182.1 193.7 206.7<br />
Liabilities and shareholders' equity<br />
Subscribed capital 4.3 4.4 4.4 4.4 4.4 4.4 4.4<br />
Capital reserve 25.4 31.7 38.1 44.9 54.4 62.1 71.5<br />
Retained earnings 37.2 37.8 38.1 38.6 38.6 38.6 38.6<br />
Other equity components 7.6 6.5 7.0 9.1 10.0 12.6 14.8<br />
Shareholder's equity 74.5 80.4 87.5 96.9 107.3 117.6 129.2<br />
Minority interest 1.2 0.8 0.8 0.8 0.8 0.8 0.8<br />
Total equity 75.7 81.2 88.3 97.7 108.2 118.5 130.1<br />
Provisions 3.6 4.5 3.2 4.3 4.3 4.3 4.4<br />
thereof provisions for pensions and similar obligations 1.8 1.8 1.9 2.0 2.0 2.0 2.1<br />
Financial liabilites (total) 38.4 29.2 34.5 33.9 33.9 33.9 33.9<br />
thereof short-term financial liabilities 13.5 2.2 11.3 14.4 14.4 14.4 14.4<br />
Accounts payable 8.3 5.3 7.1 8.0 9.1 10.1 11.2<br />
Other liabilities 23.8 21.6 27.9 26.6 26.7 26.9 27.1<br />
Liabilities 74.0 60.6 72.7 72.7 74.0 75.2 76.6<br />
Total liabilities and shareholders' equity 149.7 141.8 160.9 170.4 182.1 193.7 206.7<br />
Financial Ratios<br />
2007/08 2008/09 2009/10 2010/11 2011/12e 2012/13e 2013/14e<br />
Efficiency of Capital Employment<br />
Operating Assets Turnover 1.4 x 1.2 x 1.1 x 1.2 x 1.1 x 1.2 x 1.2 x<br />
Capital Employed Turnover 0.7 x 0.6 x 0.6 x 0.6 x 0.6 x 0.6 x 0.6 x<br />
ROA 10.5 % 8.6 % 8.2 % 10.4 % 11.0 % 12.1 % 13.4 %<br />
Return on Capital<br />
ROCE (NOPAT) 17.7 % 6.9 % 6.8 % 8.0 % 7.9 % 8.2 % 8.7 %<br />
ROE 20.4 % 8.4 % 8.2 % 9.8 % 9.7 % 9.9 % 10.3 %<br />
Adj. ROE 20.4 % 8.4 % 8.2 % 9.8 % 9.7 % 9.9 % 10.3 %<br />
Balance sheet quality<br />
Net Debt 27.6 23.8 28.3 30.0 32.9 31.0 30.3<br />
Net Financial Debt 25.8 22.0 26.5 28.1 30.9 29.0 28.2<br />
Net Gearing 36.4 % 29.3 % 32.1 % 30.7 % 30.4 % 26.2 % 23.3 %<br />
Net Fin. Debt / EBITDA 138.7 % 144.7 % 150.3 % 131.1 % 135.8 % 115.1 % 99.5 %<br />
Book Value / Share 17.3 18.9 20.4 22.3 24.5 26.9 29.6<br />
Book value per share ex intangibles 1.1 2.1 1.6 3.2 5.0 6.7 8.7<br />
ROCE Development<br />
Net debt<br />
in <strong>EUR</strong> m<br />
Book Value per Share<br />
in <strong>EUR</strong><br />
Source: Warburg Research<br />
Source: Warburg Research<br />
Source: Warburg Research<br />
F U L L N O T E Published 25.10.2012 33
<strong>ISRA</strong> <strong>VISION</strong><br />
Consolidated cash flow statement<br />
In <strong>EUR</strong> m 2007/08 2008/09 2009/10 2010/11 2011/12e 2012/13e 2013/14e<br />
Net income 8.0 6.4 7.0 9.1 10.0 11.3 12.8<br />
Depreciation of fixed assets 0.6 0.6 0.6 0.6 0.8 1.3 1.4<br />
Amortisation of goodwill 0.0 0.0 0.0 0.0 0.0 0.0 0.0<br />
Amortisation of intangible assets 5.0 5.4 5.5 6.7 6.6 6.7 7.4<br />
Increase/decrease in long-term provisions -1.8 0.2 -0.2 -0.2 0.0 0.1 0.1<br />
Other non-cash income and expenses 2.6 4.1 5.4 3.2 0.0 0.0 0.0<br />
Cash Flow 14.4 16.7 18.3 19.5 17.4 19.3 21.8<br />
Increase / decrease in inventory -1.3 2.2 0.4 -4.7 -4.2 -0.6 -2.6<br />
Increase / decrease in accounts receivable -7.9 2.0 -10.9 -3.1 -6.0 -6.3 -6.9<br />
Increase / decrease in accounts payable 1.1 -4.5 -0.2 -1.5 1.1 1.0 1.1<br />
Increase / decrease in other working capital positions 0.0 0.0 0.0 0.0 0.0 0.0 0.0<br />
Increase / decrease in working capital (total) -8.1 -0.3 -10.6 -9.3 -9.0 -5.9 -8.4<br />
Net cash provided by operating activities 6.4 16.4 7.7 10.1 8.3 13.4 13.4<br />
Investments in intangible assets -13.0 -8.6 -8.2 -9.9 -9.2 -9.4 -10.4<br />
Investments in property, plant and equipment -0.7 -0.7 -0.6 -1.1 -1.1 -1.0 -1.0<br />
Payments for acquisitions -13.5 -1.9 -1.6 0.0 0.0 0.0 0.0<br />
Financial investments 0.0 0.0 0.2 0.0 0.0 0.0 0.0<br />
Income from asset disposals 0.0 0.0 0.0 0.0 0.0 0.0 0.0<br />
Net cash provided by investing activities -22.5 -10.8 -10.2 -10.9 -10.3 -10.4 -11.4<br />
Change in financial liabilities 9.0 -9.2 4.7 -0.6 0.0 0.0 0.0<br />
Dividends paid -0.7 -0.6 -0.7 -0.9 -0.9 -1.1 -1.1<br />
Purchase of own shares -0.5 -0.6 -0.6 -0.2 0.0 0.0 0.0<br />
Capital measures 0.0 0.0 0.0 0.0 0.0 0.0 0.0<br />
Other -1.5 -0.4 -0.4 0.5 0.0 0.0 0.0<br />
Net cash provided by financing activities 6.3 -10.8 3.0 -1.2 -0.9 -1.1 -1.1<br />
Change in liquid funds -9.8 -5.3 0.5 -1.9 -2.8 1.9 0.8<br />
Effects of exchange-rate changes on cash 0.0 -0.1 0.3 -0.3 0.0 0.0 0.0<br />
Cash and cash equivalent at end of period 12.5 7.2 8.0 5.8 3.0 4.9 5.7<br />
Financial Ratios<br />
2007/08 2008/09 2009/10 2010/11 2011/12e 2012/13e 2013/14e<br />
Cash Flow<br />
Free Cash Flow -2.6 7.4 -0.6 -0.7 -2.0 3.0 1.9<br />
Free Cash Flow / Sales -10.6 % 12.1 % -1.6 % -1.2 % -2.4 % 3.3 % 1.9 %<br />
Free Cash Flow Potential 9.6 7.4 7.8 10.1 11.1 12.1 13.7<br />
Free Cash Flow / Sales -10.6 % 12.1 % -1.6 % -1.2 % -2.4 % 3.3 % 1.9 %<br />
Free Cash Flow / Net Profit -95.6 % 109.3 % -15.3 % -9.7 % -19.7 % 26.8 % 15.0 %<br />
Interest Received / Avg. Cash 6.4 % 1.4 % 0.8 % 1.4 % 2.7 % 3.1 % 2.3 %<br />
Interest Paid / Avg. Debt 10.4 % 3.4 % 3.0 % 3.2 % 3.0 % 3.0 % 3.0 %<br />
Management of Funds<br />
Investment ratio 19.9 % 16.0 % 13.5 % 14.6 % 12.4 % 11.3 % 11.2 %<br />
Maint. Capex / Sales 8.3 % 10.2 % 9.5 % 9.7 % 8.7 % 8.7 % 8.7 %<br />
Capex / Dep 240.3 % 156.9 % 141.9 % 151.5 % 139.6 % 130.3 % 129.1 %<br />
Avg. Working Capital / Sales 33.8 % 79.6 % 77.4 % 76.6 % 79.2 % 79.4 % 78.5 %<br />
Trade Debtors / Trade Creditors 456.0 % 695.3 % 664.1 % 631.7 % 618.7 % 619.8 % 620.5 %<br />
Inventory Turnover 1.9 x 1.9 x 2.2 x 1.9 x 1.7 x 1.9 x 1.9 x<br />
Receivables collection period (days) 202 233 264 244 248 248 248<br />
Payables payment period (days) 93 69 84 83 84 83 83<br />
Cash conversion cycle (Days) 201 246 207 245 273 243 244<br />
CAPEX and Cash Flow<br />
in <strong>EUR</strong> m<br />
Free Cash Flow Generation<br />
Working Capital<br />
Source: Warburg Research<br />
Source: Warburg Research<br />
Source: Warburg Research<br />
F U L L N O T E Published 25.10.2012 34
<strong>ISRA</strong> <strong>VISION</strong><br />
LEGAL DISCLAIMER<br />
This research report was prepared by the Warburg Research GmbH, a subsidiary of the M.M.Warburg & CO KGaA and is passed on<br />
by the M.M.Warburg & CO KGaA. It contains selected information and does not purport to be complete. The report is based on<br />
publicly available information and data ("the information") believed to be accurate and complete. Warburg Research GmbH neither<br />
does examine the information to be accurate and complete, nor guarantees its accuracy and completeness. Possible errors or<br />
incompleteness of the information do not constitute grounds for liability of M.M.Warburg & CO KGaA or Warburg Research GmbH for<br />
damages of any kind whatsoever, and M.M.Warburg & CO KGaA and Warburg Research GmbH are not liable for indirect and/or direct<br />
and/or consequential damages. In particular, neither M.M.Warburg & CO KGaA nor Warburg Research GmbH are liable for the<br />
statements, plans or other details contained in these analyses concerning the examined companies, their affiliated companies,<br />
strategies, economic situations, market and competitive situations, regulatory environment, etc. Although due care has been taken in<br />
compiling this research report, it cannot be excluded that it is incomplete or contains errors. M.M.Warburg & CO KGaA and Warburg<br />
Research GmbH, their shareholders and employees are not liable for the accuracy and completeness of the statements, estimations<br />
and the conclusions derived from the information contained in this document. Provided a research report is being transmitted in<br />
connection with an existing contractual relationship, i.e. financial advisory or similar services, the liability of M.M.Warburg & CO KGaA<br />
and Warburg Research GmbH shall be restricted to gross negligence and wilful misconduct. In case of failure in essential tasks,<br />
M.M.Warburg & CO KGaA and Warburg Research GmbH are liable for normal negligence. In any case, the liability of M.M.Warburg &<br />
CO KGaA and Warburg Research GmbH is limited to typical, expectable damages. This research report does not constitute an offer or<br />
a solicitation of an offer for the purchase or sale of any security. Partners, directors or employees of M.M.Warburg & CO KGaA,<br />
Warburg Research GmbH or affiliated companies may serve in a position of responsibility, i.e. on the board of directors of companies<br />
mentioned in the report. Opinions expressed in this report are subject to change without notice. All rights reserved.<br />
COPYRIGHT NOTICE<br />
This work including all its parts is protected by copyright. Any use beyond the limits provided by copyright law without permission is<br />
prohibited and punishable. This applies, in particular, to reproductions, translations, microfilming, and storage and processing on<br />
electronic media of the entire content or parts thereof.<br />
DISCLOSURE ACCORDING TO § 34B OF THE GERMAN SECURITIES TRADING ACT AND FINANV<br />
The valuation underlying the rating of the company analysed in this report is based on generally accepted and widely used methods of<br />
fundamental valuation, such as the DCF model, Free Cash Flow Value Potential, peer group comparison and – where applicable – a<br />
sum-of-the-parts model.<br />
M.M.Warburg & CO KGaA and Warburg Research GmbH have set up internal organisational and administrative arrangements to<br />
prevent and avoid possible conflicts of interest and, where applicable, to disclose them.<br />
Valuations, ratings and price targets for the companies analysed by Warburg Research GmbH are subject to constant reviews and<br />
may therefore change, if any of the fundamental factors underlying these items do change.<br />
All share prices given in this equity analysis are closing prices on the date given in the analysis, except where stated otherwise.<br />
Neither Warburg Research GmbH’s analysts nor M.M.Warburg & CO KGaA’s analysts do receive any payments directly or indirectly<br />
from any investment banking activity of M.M.Warburg Bank or an affiliated company.<br />
M.M.Warburg & CO KGaA and Warburg Research GmbH are under supervision of the BaFin – German Federal Financial Supervisory<br />
Authority.<br />
SOURCES<br />
All data and consensus estimates have been obtained from FactSet except where stated otherwise.<br />
F U L L N O T E Published 25.10.2012 35
<strong>ISRA</strong> <strong>VISION</strong><br />
Section 34b of the German Securities Trading Act in combination with the FinAnV requires an enterprise preparing a<br />
securities analysis to point out possible conflicts of interest with respect to the company that is the subject of the analysis.<br />
A conflict of interest is assumed, in particular, when the enterprise preparing the analysis …<br />
-1- … or companies affiliated with this enterprise holds 5% or more of the share capital of the analysed company<br />
-2-<br />
-3-<br />
-4-<br />
… or companies affiliated with this enterprise was a member in a consortium which acquired the shares of the<br />
analysed company within the last twelve months<br />
… or companies affiliated with this enterprise manages the securities of the analysed company on the basis of<br />
an existing contract<br />
… or companies affiliated with this enterprise over the previous 12 months has been providing investment<br />
banking services for the analysed company for which a compensation has been or will be paid<br />
-5- … effected an agreement with the analysed company for the preparation of the financial analysis<br />
-6- … or companies affiliated with this enterprise regularly trade in shares or derivatives of the analysed company<br />
-7-<br />
… or the analyst responsible for this company has other important financial interests in relation to the analysed<br />
company such as e.g. the performance of mandates for the analysed company<br />
Company Disclosure Link to the historical price targets and rating changes (last 12 months)<br />
<strong>ISRA</strong> <strong>VISION</strong> 5 http://www.mmwarburg.com/disclaimer/disclaimer_en/DE0005488100.htm<br />
F U L L N O T E Published 25.10.2012 36
<strong>ISRA</strong> <strong>VISION</strong><br />
INVESTMENT RECOMMENDATION<br />
Investment recommendation: expected direction of the share price development of the financial instrument up to the given price target<br />
in the opinion of the analyst who covers this financial instrument.<br />
-B- <strong>Buy</strong>: The price of the analysed financial instrument is expected to rise over the next 12 months.<br />
-H-<br />
Hold:<br />
The price of the analysed financial instrument is expected to remain mostly flat over the<br />
next 12 months.<br />
-S- Sell: The price of the analysed financial instrument is expected to fall over the next 12 months.<br />
“-“ Rating suspended: The available information currently does not permit an evaluation of the company.<br />
WARBURG RESEARCH GMBH – RESEARCH UNIVERSE BY RATING<br />
Rating Number of stocks % of Universe<br />
<strong>Buy</strong> 107 57<br />
Hold 69 37<br />
Sell 10 5<br />
Rating suspended 3 2<br />
Total 189 100<br />
WARBURG RESEARCH GMBH – ANALYSED RESEARCH UNIVERSE BY RATING …<br />
… Looking only at companies for which a disclosure according to § 34b of the Germany Securities Trading Act and the<br />
FinAnV has to be made.<br />
Rating Number of stocks % of Universe<br />
<strong>Buy</strong> 95 59<br />
Hold 55 34<br />
Sell 9 6<br />
Rating suspended 2 1<br />
Total 161 100<br />
PRICE AND RATING HISTORY <strong>ISRA</strong> <strong>VISION</strong> AS OF 25.10.2012<br />
The chart has markings if Warburg Research GmbH<br />
changed its rating in the last 12 months. Every marking<br />
represents the date and closing price on the day of the<br />
rating change.<br />
F U L L N O T E Published 25.10.2012 37
<strong>ISRA</strong> <strong>VISION</strong><br />
RESEARCH<br />
Christian Bruns +49 40 309537-253 Henner Rüschmeier +49 40 309537-270<br />
Head of Research cbruns@warburg-research.com Head of Research hrueschmeier@warburg-research.com<br />
Christian Cohrs +49 40 309537-175 Roland Rapelius +49 40 309537-220<br />
Engineering, Logistics ccohrs@warburg-research.com Engineering, Logistics rrapelius@warburg-research.com<br />
Felix Ellmann +49 40 309537-120 Jochen Reichert +49 40 309537-130<br />
Software, IT fellmann@warburg-research.com Telco, Internet, Media jreichert@warburg-research.com<br />
Jörg Philipp Frey +49 40 309537-258 Christopher Rodler +49 40 309537-290<br />
Retail, Consumer Goods jfrey@warburg-research.com Utilities crodler@warburg-research.com<br />
Ulrich Huwald +49 40 309537-255 Malte Schaumann +49 40 309537-170<br />
Health Care, Pharma uhuwald@warburg-research.com Technology mschaumann@warburg-research.com<br />
Thilo Kleibauer +49 40 309537-257 Susanne Schwartze +49 40 309537-155<br />
Retail, Consumer Goods tkleibauer@warburg-research.com Telco, Internet, Media sschwartze@warburg-research.com<br />
Torsten Klingner +49 40 309537-260 Oliver Schwarz +49 40 309537-250<br />
Real Estate tklingner@warburg-research.com Chemicals oschwarz@warburg-research.com<br />
Eggert Kuls +49 40 309537-256 Marc-René Tonn +49 40 309537-259<br />
Engineering ekuls@warburg-research.com Automobiles, Car Suppliers mtonn@warburg-research.com<br />
Frank Laser +49 40 309537-235 Björn Voss +49 40 309537-254<br />
Construction, Industrials flaser@warburg-research.com Steel, Car Suppliers bvoss@warburg-research.com<br />
Andreas Pläsier +49 40 309537-246 Andreas Wolf +49 40 309537-140<br />
Banks, Financial Services aplaesier@warburg-research.com Software, IT awolf@warburg-research.com<br />
Malte Räther +49 40 309537-185 Stephan Wulf +49 40 309537-150<br />
Technology, Telco, Internet mraether@warburg-research.com Utilities swulf@warburg-research.com<br />
SALES<br />
SALES TRADING<br />
Holger Nass +49 40 3282-2669 Oliver Merckel +49 40 3282-2634<br />
Head of Equity Sales, USA hnass@mmwarburg.com Head of Sales Trading omerckel@mmwarburg.com<br />
Klaus Schilling +49 40 3282-2664 Gudrun Bolsen +49 40 3282-2679<br />
Dep. Head of Equity Sales, GER kschilling@mmwarburg.com Sales Trading gbolsen@mmwarburg.com<br />
Christian Alisch +49 40 3282-2667 Bastian Quast +49 40 3282-2701<br />
Scandinavia, Spain calisch@mmwarburg.com Sales Trading bquast@mmwarburg.com<br />
Robert Conredel +49 40 3282-2633 Patrick Schepelmann +49 40 3282-2700<br />
Germany rconredel@mmwarburg.com Sales Trading pschepelmann@mmwarburg.com<br />
Matthias Fritsch +49 40 3282-2696 Thekla Struve +49 40 3282-2668<br />
United Kingdom mfritsch@mmwarburg.com Sales Trading tstruve@mmwarburg.com<br />
Marie-Therese Grübner +49 40 3282-2630 Jörg Treptow +49 40 3262-2658<br />
France mgruebner@mmwarburg.com Sales Trading jtreptow@mmwarburg.com<br />
Michael Kriszun +49 40 3282-2695<br />
United Kingdom mkriszun@mmwarburg.com Support<br />
Marc Niemann +49 40 3282-2660 Katharina Bruns +49 40 3282-2694<br />
Germany mniemann@mmwarburg.com Roadshow/Marketing kbruns@mmwarburg.com<br />
Dirk Rosenfelder +49 40 3282-2692<br />
Austria, Switzerland<br />
drosenfelder@mmwarburg.com<br />
Julian Straube +49 40 3282-2666<br />
Small & Mid Caps<br />
jstraube@mmwarburg.com<br />
Philipp Stumpfegger +49 40 3282-2635<br />
Australia, United Kingdom<br />
pstumpfegger@mmwarburg.com<br />
MACRO RESEARCH<br />
Carsten Klude +49 40 3282-2572<br />
Macro Research<br />
cklude@mmwarburg.com<br />
Matthias Thiel +49 40 3282-2401<br />
Macro Research<br />
mthiel@mmwarburg.com<br />
Dr. Christian Jasperneite +49 40 3282-2439<br />
Investment Strategy<br />
cjasperneite@mmwarburg.com<br />
Our research can be found under:<br />
Warburg Research research.mmwarburg.com/en/index.html Thomson www.thomson.com<br />
Bloomberg MMWA GO Reuters www.knowledge.reuters.com<br />
FactSet www.factset.com Capital IQ www.capitaliq.com<br />
For access please contact:<br />
Andrea Carstensen +49 40 3282-2632 Kerstin Muthig +49 40 3282-2703<br />
Sales Assistance acarstensen@mmwarburg.com Sales Assistance kmuthig@mmwarburg.com<br />
F U L L N O T E Published 25.10.2012 38