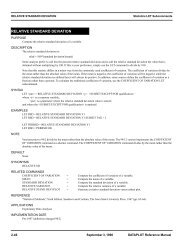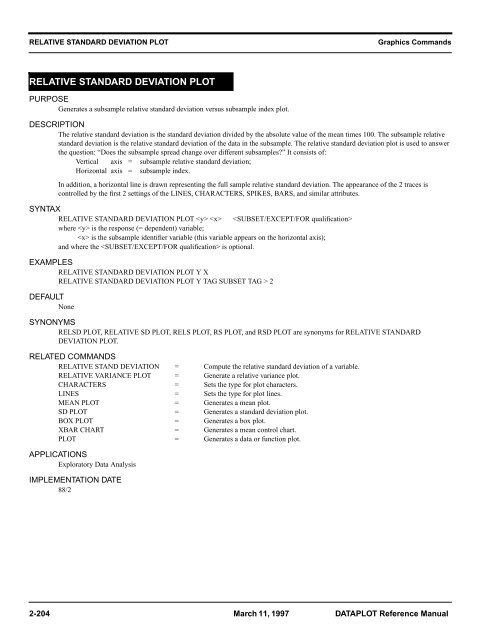
RELATIVE STANDARD DEVIATION PLOT
RELATIVE STANDARD DEVIATION PLOT
RELATIVE STANDARD DEVIATION PLOT

You also want an ePaper? Increase the reach of your titles
YUMPU automatically turns print PDFs into web optimized ePapers that Google loves.
<strong>RELATIVE</strong> <strong>STANDARD</strong> <strong>DEVIATION</strong> <strong>PLOT</strong><br />
Graphics Commands<br />
<strong>RELATIVE</strong> <strong>STANDARD</strong> <strong>DEVIATION</strong> <strong>PLOT</strong><br />
PURPOSE<br />
Generates a subsample relative standard deviation versus subsample index plot.<br />
DESCRIPTION<br />
The relative standard deviation is the standard deviation divided by the absolute value of the mean times 100. The subsample relative<br />
standard deviation is the relative standard deviation of the data in the subsample. The relative standard deviation plot is used to answer<br />
the question: “Does the subsample spread change over different subsamples?” It consists of:<br />
Vertical axis = subsample relative standard deviation;<br />
Horizontal axis = subsample index.<br />
In addition, a horizontal line is drawn representing the full sample relative standard deviation. The appearance of the 2 traces is<br />
controlled by the first 2 settings of the LINES, CHARACTERS, SPIKES, BARS, and similar attributes.<br />
SYNTAX<br />
<strong>RELATIVE</strong> <strong>STANDARD</strong> <strong>DEVIATION</strong> <strong>PLOT</strong> <br />
where is the response (= dependent) variable;<br />
is the subsample identifier variable (this variable appears on the horizontal axis);<br />
and where the is optional.<br />
EXAMPLES<br />
<strong>RELATIVE</strong> <strong>STANDARD</strong> <strong>DEVIATION</strong> <strong>PLOT</strong> Y X<br />
<strong>RELATIVE</strong> <strong>STANDARD</strong> <strong>DEVIATION</strong> <strong>PLOT</strong> Y TAG SUBSET TAG > 2<br />
DEFAULT<br />
None<br />
SYNONYMS<br />
RELSD <strong>PLOT</strong>, <strong>RELATIVE</strong> SD <strong>PLOT</strong>, RELS <strong>PLOT</strong>, RS <strong>PLOT</strong>, and RSD <strong>PLOT</strong> are synonyms for <strong>RELATIVE</strong> <strong>STANDARD</strong><br />
<strong>DEVIATION</strong> <strong>PLOT</strong>.<br />
RELATED COMMANDS<br />
<strong>RELATIVE</strong> STAND <strong>DEVIATION</strong> = Compute the relative standard deviation of a variable.<br />
<strong>RELATIVE</strong> VARIANCE <strong>PLOT</strong> = Generate a relative variance plot.<br />
CHARACTERS = Sets the type for plot characters.<br />
LINES = Sets the type for plot lines.<br />
MEAN <strong>PLOT</strong> = Generates a mean plot.<br />
SD <strong>PLOT</strong> = Generates a standard deviation plot.<br />
BOX <strong>PLOT</strong> = Generates a box plot.<br />
XBAR CHART = Generates a mean control chart.<br />
<strong>PLOT</strong> = Generates a data or function plot.<br />
APPLICATIONS<br />
Exploratory Data Analysis<br />
IMPLEMENTATION DATE<br />
88/2<br />
2-204 March 11, 1997 DATA<strong>PLOT</strong> Reference Manual
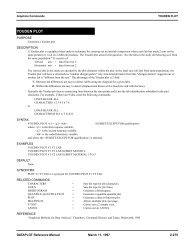
Graphics Commands<br />
<strong>RELATIVE</strong> <strong>STANDARD</strong> <strong>DEVIATION</strong> <strong>PLOT</strong><br />
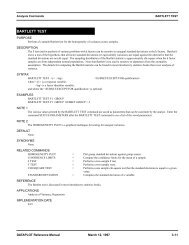
PROGRAM<br />
SKIP 25<br />
READ GEAR.DAT DIAMETER BATCH<br />
LINE BLANK DASH<br />
CHARACTER X BLANK<br />
XTIC OFFSET 0.2 0.2<br />
Y1LABEL <strong>RELATIVE</strong> <strong>STANDARD</strong> <strong>DEVIATION</strong><br />
X1LABEL SAMPLE BATCH<br />
TITLE AUTOMATIC<br />
RELSD <strong>PLOT</strong> DIAMETER BATCH<br />
1<br />
RELSD <strong>PLOT</strong> DIAMETER BATCH<br />
X<br />
<strong>RELATIVE</strong> <strong>STANDARD</strong> <strong>DEVIATION</strong><br />
0.9<br />
0.8<br />
0.7<br />
0.6<br />
0.5<br />
0.4<br />
X<br />
X<br />
X<br />
X<br />
X<br />
X<br />
X<br />
X<br />
X<br />
0.3<br />
1 2 3 4 5 6 7 8 9 10<br />
SAMPLE BATCH<br />
DATA<strong>PLOT</strong> Reference Manual March 11, 1997 2-205