pdf download
pdf download
pdf download

You also want an ePaper? Increase the reach of your titles
YUMPU automatically turns print PDFs into web optimized ePapers that Google loves.
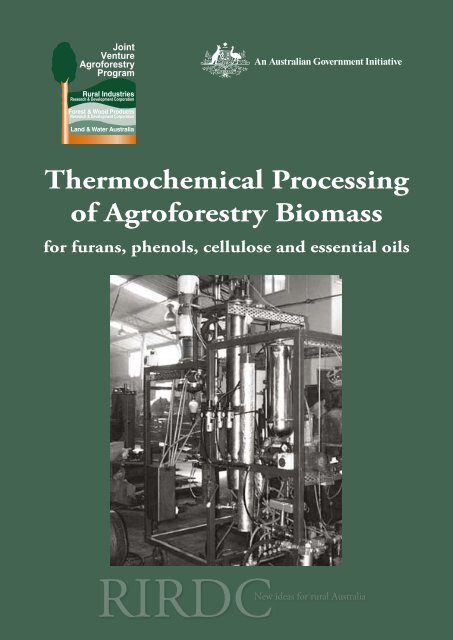
Thermochemical Processing<br />
of Agroforestry Biomass<br />
for furans, phenols, cellulose and essential oils<br />
RIRDCNew ideas for rural Australia
Thermochemical<br />
processing of<br />
agroforestry biomass<br />
for furans, phenols,<br />
cellulose and<br />
essential oils<br />
A report for the RIRDC/Land & Water<br />
Australia/FWPRDC<br />
Joint Venture Agroforestry Program<br />
by David Butt<br />
November 2006<br />
RIRDC Publication No 06/121<br />
RIRDC Project No PN99.2006
© 2006 Rural Industries Research and Development Corporation.<br />
All rights reserved.<br />
ISBN 1 74151 384 7<br />
ISSN 1440-6845<br />
Thermochemical processing of agroforestry biomass for furans, phenols, cellulose and essential oils<br />
Publication No. 06/121<br />
Project No. PN99.2006.<br />
The information contained in this publication is intended for general use to assist public knowledge and discussion<br />
and to help improve the development of sustainable industries. The information should not be relied upon for the<br />
purpose of a particular matter. Specialist and/or appropriate legal advice should be obtained before any action or<br />
decision is taken on the basis of any material in this document. The Commonwealth of Australia, Rural Industries<br />
Research and Development Corporation, the authors or contributors do not assume liability of any kind<br />
whatsoever resulting from any person's use or reliance upon the content of this document.<br />
This publication is copyright. However, RIRDC encourages wide dissemination of its research, providing the<br />
Corporation is clearly acknowledged. For any other enquiries concerning reproduction, contact the Publications<br />
Manager on phone 02 6272 3186.<br />
Researcher Contact Details<br />
David Butt<br />
University of Melbourne<br />
Water Street<br />
Creswick VIC 3355<br />
Phone: (03) 5321 4102<br />
Fax: (03) 5321 4194<br />
Email: davidb@unimelb.edu.au<br />
In submitting this report, the researcher has agreed to RIRDC publishing this material in its edited form.<br />
RIRDC Contact Details<br />
Rural Industries Research and Development Corporation<br />
Level 2, 15 National Cct<br />
42 Macquarie Street<br />
BARTON ACT 2600<br />
PO Box 4776<br />
KINGSTON ACT 2604<br />
Phone: 02 6272 4819<br />
Fax: 02 6272 5877<br />
Email:<br />
rirdc@rirdc.gov.au.<br />
Website:<br />
http://www.rirdc.gov.au<br />
Published in November 2006<br />
Printed on environmentally friendly paper by Canprint<br />
i
Foreword<br />
From antiquity, commodities such as methanol and acetic acid have been obtained from the pyrolysis,<br />
or destructive distillation, of wood. However, the advent of petroleum based chemical industries in the<br />
twentieth century practically eliminated the pyrolysis industry. In recent years, rising oil prices and<br />
environmental concerns have inspired renewed interest in wood pyrolysis. Also, there is a need for<br />
commercial solutions to encourage broadscale woody perennial revegetation to mitigate dryland<br />
salinity and other natural resource issues. This provides the incentive for evaluation of alternative<br />
value-adding technologies from wood. One such value-adding technology is the derivation of<br />
chemicals through pyrolysis.<br />
A serious problem which has plagued the development of a full fledged chemical industry based on<br />
wood pyrolysis has been the extreme complexity and thermal instability of the product mixture.<br />
Researchers at the University of Melbourne have previously focused upon strategies for minimising<br />
such phenomena from softwood pyrolysis and have developed a two-stage low temperature fast<br />
pyrolysis process for the derivation of furfural, phenols and crude cellulose.<br />
The aim of this research was to optimise the fast pyrolysis process on Australian hardwood and then to<br />
assess the effect of scale through construction and optimisation of a development scale process plant.<br />
A second aim was to improve the viability of Eucalyptus oil extraction through improvement of<br />
recovery efficiency. Eucalyptus oil is high-value and is derived from some Australian agroforestry<br />
species. However, the efficiency of oil recovery depends on the distillation technique. To move<br />
beyond the traditional pharmaceutical market, more efficient extraction is required in order to compete<br />
with industrial solvents derived from other materials.<br />
This publication provides a summary of the analysis techniques and research findings. The project<br />
found that substantial improvements in yield of essential oils could be obtained by relatively simple<br />
changes to existing extraction techniques. For low-temperature fast pyrolysis of hardwood, it was<br />
concluded that certain parameters strongly influence the yield of high-value chemicals. However, the<br />
actual yields were probably too low to ensure commercial viability of the process at this stage. Future<br />
research will involve further optimisation to improve product yields, while maintaining a high degree<br />
of selectivity, and thereby improve the commercial prospect.<br />
This project was funded by the Natural Heritage Trust through the Forest and Wood Products<br />
Research and Development Corporation (FWPRDC) and the Joint Venture Agroforestry Program<br />
(JVAP). JVAP is supported by three R&D Corporations — Rural Industries Research and<br />
Development Corporation (RIRDC), Land & Water Australia, and FWPRDC, together with the<br />
Murray-Darling Basin Commission. These agencies are funded principally by the Australian<br />
Government.<br />
This report, a new addition to RIRDC’s diverse range of over 1500 research publications, forms part of<br />
our Agroforestry and Farm Forestry R&D program, which aims to integrate sustainable and productive<br />
agroforestry within Australian farming systems.<br />
Most of our publications are available for viewing, <strong>download</strong>ing or purchasing online through our<br />
website:<br />
• <strong>download</strong>s at www.rirdc.gov.au/reports/Index.htm<br />
• purchases at www.rirdc.gov.au/eshop<br />
Peter O’Brien<br />
Managing Director<br />
Rural Industries Research and Development Corporation<br />
ii
Table of contents<br />
1<br />
2<br />
3<br />
4<br />
5<br />
6<br />
7<br />
8<br />
9<br />
10<br />
11<br />
Foreword<br />
Table of contents<br />
List of figures<br />
List of tables<br />
Executive summary<br />
Introduction<br />
Objectives<br />
Methodology<br />
Analysis of pyrolysis products<br />
Influence of selected operational parameters on stage 1 of the pyrolysis process<br />
Influence of selected operational parameters on stage 2 of the pyrolysis process<br />
Optimisation of essential oil recovery processes<br />
Process development unit: fabrication and commissioning<br />
Assessment of any health risks in relation to the process and the oil produced<br />
Passivation/isolation of liquid pyrolysis product<br />
Market analysis<br />
Appendix 1<br />
Appendix 2<br />
Appendix 3<br />
Appendix 4<br />
Appendix 5<br />
Appendix 6<br />
Appendix 7<br />
References<br />
Page<br />
ii<br />
iii<br />
iv<br />
vi<br />
ix<br />
1<br />
14<br />
15<br />
33<br />
45<br />
58<br />
64<br />
67<br />
80<br />
89<br />
90<br />
104<br />
106<br />
108<br />
119<br />
131<br />
143<br />
145<br />
147<br />
iii
List of figures<br />
1.1.2.1<br />
1.2.1<br />
Schematic description of the pyrolysis and combustion of cellulose<br />
Approximate annual production of lignin from Kraft and Sulphite pulping<br />
(millions of tons).<br />
Structure of 1,8-cineole.<br />
Page<br />
5<br />
11<br />
1.2.2<br />
3.2.1.1<br />
3.2.1.2<br />
3.2.1.3<br />
3.2.1.4<br />
3.7.1.1<br />
3.7.1.2<br />
5.1.1<br />
5.2.1<br />
5.2.2<br />
5.2.3<br />
5.3.1<br />
5.3.2<br />
5.3.3<br />
5.4.1.1<br />
5.4.1.2<br />
5.4.1.3<br />
5.4.2.1<br />
Structure of the major constituents of industrial Eucalyptus oils.<br />
Main components of the bench scale fast pyrolysis system.<br />
Diagram of the configuration of the major components of the fast<br />
pyrolysis unit.<br />
Photograph of the assembled fast pyrolysis unit.<br />
Schematic of the gas supply configuration for the fast pyrolysis unit.<br />
Type of apparatus used for the extraction of Eucalyptus oil by simple<br />
conventional distillation.<br />
Diagram of the various oil recovery apparatus that were employed.<br />
Comparison of furfuryls yield with the combined yield of all<br />
hemicellulose derived compounds.<br />
Yield of furfuryl compounds based on the mass of feed converted to<br />
volatiles.<br />
Yield of furfuryl compounds based on the mass of feed processed<br />
Comparison of the relative yields of hemicellulose and lignin derived<br />
compounds with reprocessing.<br />
Yield of furfural and furfuryl alcohol based on the mass of feed converted<br />
to volatiles.<br />
Total estimated yield of hemicellulose derived compounds based on the<br />
mass of wood converted to volatile material.<br />
Relative yield of phenols and hemicellulose derived compounds.<br />
Yield of furfural and furfuryl alcohol based on the mass of volatile<br />
product.<br />
Estimated yield of hemicellulose derived compounds based on the mass of<br />
volatile product.<br />
Comparison of the relative yield of phenols and hemicellulose derived<br />
compounds.<br />
Yield of furfural and furfuryl alcohol based on the mass of volatile<br />
product.<br />
12<br />
17<br />
19<br />
19<br />
20<br />
31<br />
31<br />
46<br />
47<br />
47<br />
48<br />
49<br />
49<br />
50<br />
51<br />
51<br />
52<br />
52<br />
iv
5.4.2.2<br />
5.4.2.3<br />
5.5.1<br />
5.5.2<br />
5.6.1<br />
5.6.2<br />
6.1.1<br />
6.1.2<br />
6.1.3<br />
6.2.1.1<br />
6.2.1.2<br />
6.2.1.3<br />
6.2.2.1<br />
6.2.2.2<br />
6.2.2.3<br />
7.1.1<br />
7.1.2<br />
7.2.2<br />
8.1.1<br />
8.1.2<br />
8.1.3<br />
8.1.4<br />
Comparison of furfuryl yield with the yield of all hemicellulose derived<br />
products<br />
Comparison of the relative yield of phenols with and hemicellulose<br />
derived monomeric compounds.<br />
Yield of furfural and furfuryl alcohol based on the mass of volatile<br />
product.<br />
Comparison of furfuryl yield with the yield of all hemicellulose derived<br />
products<br />
Yield of furfural and furfuryl alcohol based on the mass of volatile<br />
product.<br />
Comparison of furfuryl yield with the yield of all hemicellulose derived<br />
products<br />
Yield of main phenols based on mass of volatile product.<br />
Absolute yield of the main phenols.<br />
Comparison of the total phenolic yield with the yield of the main phenols.<br />
Yield of main phenols based on mass of volatile product.<br />
Comparison of the total phenolic yield with the yield of the main phenols.<br />
Comparison of the relative yield of phenols and carbohydrate derived<br />
compounds.<br />
Yield of main phenols based on mass of volatile product.<br />
Comparison of the total phenolic yield with the yield of the main phenols.<br />
Comparison of the relative yield of phenols and carbohydrate derived<br />
compounds.<br />
Proportion of cineole, based on total present within leaves, recovered with<br />
different product recovery techniques.<br />
Proportion of cineole in oil recovered by different techniques.<br />
Proportion of cineole, based on total present within leaves, recovered with<br />
different product recovery techniques.<br />
Photograph of the Process Development Unit.<br />
Cross section diagram of the reactor showing the main components.<br />
Cross section diagram of the preheater.<br />
Diagram of the feeder system<br />
53<br />
53<br />
54<br />
54<br />
56<br />
56<br />
58<br />
58<br />
59<br />
60<br />
60<br />
60<br />
61<br />
62<br />
62<br />
64<br />
65<br />
65<br />
67<br />
68<br />
68<br />
69<br />
v
8.1.5<br />
8.1.6<br />
8.1.7<br />
8.1.8<br />
8.1.9<br />
8.3.1<br />
Cross section diagram of the quench system.<br />
Diagram of the solid residue collection system<br />
Diagram of the first electrostatic precipitator system<br />
Diagram of the second electrostatic precipitator system<br />
Diagram of the heating oil system with two-stage oil cooling system.<br />
Diagram of the steam distillation PDU<br />
69<br />
70<br />
70<br />
71<br />
71<br />
78<br />
List of Tables<br />
1.2.1<br />
1.2.2<br />
3.6.1<br />
3.6.2<br />
4.1.1.1<br />
4.1.3.1<br />
4.1.4.1<br />
4.2.1.1<br />
4.2.3.1<br />
4.2.4.1<br />
4.3.1<br />
4.4.1.1<br />
4.4.2.1<br />
4.4.3.1<br />
World trade of essential oils.<br />
Estimated Eucalyptus oil production in Australia.<br />
Experimental design for stage 1 pyrolysis experiments.<br />
Experimental design for stage 2 pyrolysis experiments.<br />
Computer library matching data for compounds derived from the<br />
pyrolysis of lignin.<br />
Lignin derived compounds identified by use of RRT data provided in the<br />
literature.<br />
Summary of lignin derived compounds identified in the samples.<br />
Computer library matching data for compounds derived from the<br />
pyrolysis of wood derived polysaccharides.<br />
Polysaccharide derived compounds identified, or characterised, by<br />
comparison with RRT data provided in the literature.<br />
Summary of polysaccharide derived compounds identified in the samples.<br />
Compounds from the pyrolysis of hardwood that were quantified, as well<br />
as the corresponding dominant mass spectra ion for each.<br />
Cellulose determinations of hardwood pyrolytic residues by the Seifert<br />
technique.<br />
Chlorite holocellulose determinations in hardwood pyrolysis residues.<br />
Hypochlorite holocellulose determinations of hardwood pyrolytic<br />
residues.<br />
Page<br />
11<br />
12<br />
29<br />
30<br />
33<br />
35<br />
36<br />
37<br />
37<br />
38<br />
39<br />
41<br />
42<br />
43<br />
vi
4.4.4.1<br />
5.1.1<br />
5.2.1<br />
5.3.1<br />
5.4.1.1<br />
5.4.2.1<br />
5.5.1<br />
5.6.1<br />
6.2.1.1<br />
6.2.2.1<br />
8.2.1.1<br />
8.2.1.2<br />
8.2.1.3<br />
8.2.2.1<br />
8.2.2.2<br />
8.2.2.3<br />
8.2.3.1<br />
8.2.3.2<br />
8.2.3.3<br />
8.3.1<br />
Viscosity of hardwood holocellulose samples.<br />
Comparison of cellulose and hemicellulose proportions in the solid<br />
residue from the trials of experiment 1.1<br />
Comparison of cellulose and hemicellulose proportions in the solid<br />
residue from the trials of experiment 1.2.<br />
Comparison of cellulose and hemicellulose proportions in the solid<br />
residue from the trials of experiment 1.3.<br />
Comparison of cellulose and hemicellulose proportions in the solid<br />
residue from the trials of experiment 1.4A.<br />
Comparison of cellulose and hemicellulose proportions in the solid<br />
residue from the trials of experiment 1.4B.<br />
Comparison of cellulose and hemicellulose proportions in the solid<br />
residue from the trials of experiment 1.5.<br />
Comparison of cellulose and hemicellulose proportions in the solid<br />
residue from the trials of experiment 1.6.<br />
Comparison of cellulose and hemicellulose proportions in the solid<br />
residue from the trials of experiment 2.2A.<br />
Comparison of cellulose and hemicellulose proportions in the solid<br />
residue from the trials of experiment 2.2B.<br />
Parameters that were employed for the investigation of reactor<br />
temperature.<br />
System parameters associated with reactor temperature investigation.<br />
Yield of solid residue for trials associated with investigation of reaction<br />
temperature.<br />
Parameters that were employed for the investigation of sand bed mass.<br />
System parameters associated with sand bed mass investigation.<br />
Products derived from the pyrolysis of hemicellulose<br />
Yield of solid residue for trials associated with investigation of sand bed<br />
mass.<br />
Parameters that were employed for the investigation of carrier gas flow<br />
rate.<br />
System parameters associated with carrier gas flow rate investigation.<br />
Yield of solid residue for trials associated with investigation of carrier gas<br />
flow rate.<br />
Comparison of simple distillation and distillation with cohobation on the<br />
44<br />
46<br />
48<br />
50<br />
52<br />
54<br />
55<br />
57<br />
61<br />
63<br />
73<br />
73<br />
74<br />
75<br />
75<br />
76<br />
76<br />
77<br />
77<br />
78<br />
vii
9.1.1<br />
9.1.2<br />
9.2.1.<br />
11.1.2.1<br />
11.1.3.1<br />
11.1.3.2<br />
11.2.3.1<br />
11.3.4.1<br />
11.3.4.2<br />
11.5.1.1<br />
pilot scale.<br />
Toxicity information on lignin derived compounds.<br />
Toxicity information on hemicellulose/cellulose derived compounds.<br />
Example MSDS for a ‘typical’ pyrolysis oil.<br />
World production of furfural in 2001.<br />
World consumption of furfural in 2001.<br />
Market prices of furfural in 2001.<br />
World consumption of furfuryl alcohol in 2001.<br />
Main producers of isoeugenol in the US and Europe.<br />
Combined quantities of eugenol and isoeugenol imported into the US.<br />
Australian market for pulp (cellulose based) products.<br />
81<br />
82<br />
83<br />
92<br />
92<br />
93<br />
94<br />
97<br />
97<br />
101<br />
viii
Executive summary<br />
What the report is about<br />
Optimisation of extraction techniques is an important step in developing processes where virtually the<br />
whole tree could be utilised for the derivation of high-value products, such as Eucalyptus oil, furfural,<br />
phenols and crude cellulose. Eucalyptus oil is a flavour agent and pharmaceutical commodity. Furfural<br />
and phenols are important, high quality, resin components. Cellulose is used to make paper. Together,<br />
the combined current worldwide consumption of these commodities is around 250 billion dollars<br />
annually.<br />
This report evaluates, through testing at the bench scale and subsequent experimentation, the<br />
thermochemical processing of agroforestry biomass for furans, phenols, cellulose and essential oils.<br />
The core of the research involved evaluation and optimisation of a two-stage fast pyrolysis process for<br />
the derivation of furfural, phenols and a cellulose rich residue. A second aim was to improve the<br />
efficiency of extraction of Eucalyptus oil. The report also includes a brief review of the literature on<br />
pyroloysis and eucalypt oil research, the fabrication and commission of process development units for<br />
both the two-stage pyrolysis and steam distillation processes, a preliminary assessment of any health<br />
risks in relation to both the process and the oil produced, and a review of market prospects.<br />
Who the report is targeted at<br />
This research will assist the design of hardwood pyrolysis analytical techniques, and inform those<br />
seeking to evaluate new products and commercial options for integrated utilisation of the whole tree.<br />
Background and aims<br />
Industrially, Eucalyptus oil is extracted from the leaf component of certain species of eucalypt by<br />
steam distillation. However, this process contains a number of inefficiencies which reduce process<br />
performance. An aspect of the research was to evaluate techniques to minimise these inefficiencies and<br />
thereby improve the viability of the process.<br />
Pyrolysis is the decomposition of wood by the action of heat and has been used for centuries for the<br />
derivation of various commodities such as charcoal, acetic acid and methanol. However, the massive<br />
exploitation of petroleum resources in the middle of the twentieth century provided cheap alternatives<br />
to pyrolysis-derived products and consequently the pyrolysis industry, which had advanced relatively<br />
little since antiquity, virtually ceased to exist. In recent years, rising oil prices and the increasing<br />
problem of greenhouse gas emissions have prompted renewed interest in pyrolysis research.<br />
The yields of products obtained from pyrolysis depend on the type of material being pyrolysed and the<br />
actual reaction conditions employed. This research project involved adapting a pyrolysis technology,<br />
developed at the University of Melbourne on softwood, for utilisation with hardwood. The technology<br />
comprises a two-stage process that capitalises on the natural differences in thermal stability between<br />
the major wood components, hemicellulose, lignin and cellulose. In the first stage, the hemicellulose<br />
component is selectively pyrolysed, yielding furfural and a solid residue. The lignin component of the<br />
solid residue is then selectively pyrolysed in the second stage yielding phenols and a solid residue<br />
consisting of crude cellulose. The selectivity is achieved by careful selection of processing parameters.<br />
Historically, the main problem associated with pyrolysis has been the difficulty of refining the<br />
decomposition products. That is, the pyrolysis of wood typically yields four product phases; a charred<br />
residue, non-condensable gases and an aqueous and tar phase. Most of the high-value chemicals are<br />
associated with the liquid phases, which are, unfortunately, very complex as well as thermally<br />
unstable. This means that conventional refining techniques, such as distillation, cannot be applied<br />
without costly pre-treatments. Furthermore, the yield of any particular compound within the liquid<br />
phases is generally so low as to render extraction uneconomic. The pyrolysis process developed at the<br />
University of Melbourne is designed to reduce the complexity typical of the liquid product and thereby<br />
ix
simplify refinement and improve process viability. This is achieved by use of rapid rates of heat<br />
transfer, reactive reaction atmosphere and short substrate residence times.<br />
Furfural is the industrial source of furfuryl alcohol. Furfuryl alcohol is a high quality resin component<br />
whose current market value is around AU$1,500/tonne. At present, furfuryl alcohol is derived from the<br />
acid hydrolysis of agricultural wastes, a process that is both chemical and energy intensive. Phenols<br />
are also high quality resin components whose current market value starts at around AU$1,000/ton. At<br />
present, phenols are derived from petroleum. The low-cost pyrolytic derivation of furfural and phenols<br />
from agroforestry biomass would add substantial value to this resource as well as provide an<br />
alternative supply of adhesives for the Australian wood panels industry, a very large consumer of such<br />
materials.<br />
Evaluation and optimisation of the fast pyrolysis process on hardwood<br />
Methods<br />
The evaluation of the process on hardwoods was initially performed at the bench scale, using<br />
Eucalyptus regnans. The research involved investigating the influence of the main operational<br />
parameters on the yield of furfural and phenols. The parameters investigated were reaction<br />
temperature, carrier gas composition and reactor configuration. Furan and phenol analyses were<br />
performed by gas chromatography mass spectroscopy (GCMS) and the solid residues were analysed<br />
for cellulose and holocellulose (cellulose + hemicellulose).<br />
Reaction temperature is undoubtedly the most important parameter in wood pyrolysis. For this reason,<br />
three separate sets of trials were conducted in which temperature was investigated. In the first<br />
experiment, the influence of reaction temperature on furfuryls production was evaluated whereas in the<br />
latter two experiments the corresponding influence on phenols production was evaluated.<br />
The size, or mass, of the sand bed in a fluidised bed reactor is known to influence the heat transfer<br />
process and substrate residence time. The fluid bed mass was investigated under two sets of conditions<br />
typical of Stage 1.<br />
Results<br />
The composition of the reaction atmosphere with respect to oxygen content was found to be very<br />
important for the low temperature pyrolysis of softwood. The influence of carrier gas composition was<br />
evaluated for both Stage 1 and Stage 2 type conditions. For Stage 1 of the process, which is<br />
characterised by reaction temperatures within the range of 240-280 o C, the yield of furfural increased<br />
with increasing oxygen content in the carrier gas. However, the overall extent of hemicellulose<br />
conversion to volatile products decreased with increasing oxygen content. Thus, under conditions for<br />
which the oxygen content in the carrier gas was maximal, furfural accounted for approximately 40% of<br />
the monomeric hemicellulose decomposition products, whereas under condition for which oxygen was<br />
absent in the carrier gas, furfural accounted for only about 5% of the monomeric hemicellulose<br />
decomposition product. Similarly, the yield of phenols was proportional to the amount of oxygen<br />
present in the reaction atmosphere, although the proportion of the monomeric lignin derived product<br />
accounted for by phenols tended to decrease with increasing oxygen content in the carrier gas. These<br />
results were in general agreement with those obtained for softwood.<br />
For Stage 1 of the process, the yield of furfural decreased substantially with increasing reaction<br />
temperature, possibly due to increased reactivity of furfural to oligomer formation with increasing<br />
temperature. For the corresponding Stage 2 experiments, the main difference between each was the<br />
proportion of oxygen in the carrier gas. In one experiment, the carrier gas was composed entirely of air<br />
whereas in the other, only a small quantity of air was supplied. The effect of temperature on phenols<br />
yield was similar for each experiment, although it was much more pronounced for the experiment in<br />
which the concentration of oxygen in the carrier gas was higher. That is, the yield of phenols achieved<br />
a local maximum in each experiment, although the actual yield was approximately 1,000% greater for<br />
the experiment in which the oxygen concentration in the carrier gas was higher, a finding that was in<br />
close agreement with the results obtained from softwood.<br />
x
Under the conditions that resulted in maximum phenols yield for Experiments 6.2A and B, the<br />
proportion of holocellulose in the residue decreased by about 10-15% compared to the feed material,<br />
whereas the corresponding proportion of cellulose increased by approximately 5%. These results<br />
indicate that the most of the non-phenolic material present in the liquid product is derived from<br />
hemicellulose rather than cellulose and therefore this material may be minimised with improved<br />
efficiency of Stage 1, thereby further improving the selectivity of lignin degradation in Stage 2. These<br />
results were similar to those obtained for softwood.<br />
In both fluid bed mass experiments, the selectivity of the process towards hemicellulose degradation,<br />
and furfuryl compound formation, was maximal for the lowest fluid bed mass investigated (150g) and<br />
decreased with increasing bed mass. These results were in agreement with those obtained for<br />
softwood. The influence of fluid bed particle size on the yield of furfuryls for conditions typical of<br />
Stage 1 was not pronounced and the cellulose and holocellulose proportions in the solid residues were<br />
virtually identical.<br />
Overall, the nature of the influence of the investigated operational parameters on the pyrolysis process<br />
for hardwood was very similar to that for softwoods. For example, molecular oxygen in the reaction<br />
atmosphere substantially increased the phenolic yield and certain narrow temperature ranges favoured<br />
phenolic compound formation whereas others did not. The phenolic compounds themselves were<br />
markedly different from those obtained from softwoods as they tended to be syringyl in nature. In<br />
contrast to pyrolysis of softwood, the magnitude of the influence of the investigated parameters was<br />
not as pronounced for hardwoods. This may be because hardwood is a more refractory material. While<br />
the influences of the various parameters were well defined, the overall absolute yields on the bench<br />
scale were relatively low. That is, the absolute yield of furfural was generally less than 1% and the<br />
corresponding total absolute yield of low molecular weight phenols were generally less than 2%.<br />
It is believed that the process achieves extensive lignin and hemicellulose depolymerisation, based on<br />
the 10-20% of wood mass converted to volatiles and on the increase in cellulose content of the residue.<br />
However, it appears that the processes that lead to formation of individual monomeric phenolic and<br />
furfurylic compounds are not sufficiently progressed by the time the material exits the reactor. That is,<br />
about 90% of the wood mass that is converted to volatiles by the pyrolysis treatment is not detectable<br />
by GCMS and is therefore most likely comprised of low molecular weight oligomers of lignin and<br />
hemicellulose. In order to liberate more mono-phenolic and mono-furfurylic compounds from this<br />
material, its further degradation is required. Based on the volatility of this material, an indicator of its<br />
relatively low molecular weight, the degree of the required further degradation is quite small. These<br />
experiments were conducted on a bench scale apparatus and therefore the residence time of materials<br />
within the heated zone was relatively short due to the small dimensions of the reactor. It would be<br />
expected that a larger unit would overcome much of this inherent limitation.<br />
The cellulose and holocellulose contents of the raw hardwood feed were 40.4 and 78% respectively.<br />
The hemicellulose content was therefore 37.6%. The greatest extent of hemicellulose removal from<br />
Stage 1 of the process was nearly 50% compared to the initial amount present. The greatest extent of<br />
hemicellulose removal after both stages was approximately 80%. Therefore, it may be concluded that<br />
the process is effective in hemicellulose removal, although there is room for improvement in the<br />
efficiency of Stage 1. Further removal may be achieved by either reprocessing or increasing the<br />
residence time of the feed within the reactor, parameters that are readily achievable in a larger unit, as<br />
opposed to the bench scale unit employed in this study. The greatest amount of cellulose present in the<br />
residues was 51.4%, which corresponds to an increase of 27% compared to the initial amount present.<br />
Scaling of the process will increase the residence time and therefore it is expected that on the larger<br />
scale, even greater proportions of cellulose may be achieved.<br />
It was found that hydrogenation of the pyrolysis liquids enabled them to be distilled, although<br />
individual compounds could not be isolated due to their structural similarity. Hydrogenation is a<br />
standard industrial process for the passivation or de-oxygenation of organic compounds.<br />
xi
Health hazards of pyrolysis products<br />
Methods and results<br />
Material safety data sheets (MSDSs) were obtained for all identified products in which they were<br />
available. It was found that a number of the compounds did not have an MSDS. This is probably due<br />
to their lack of commercial use. For those that did have MSDSs, all were either non-toxic or irritants.<br />
Furfural, the main derivative of furfuryl alcohol, is a suspected carcinogen based on laboratory tests on<br />
rodents.<br />
Process development fast pyrolysis unit<br />
Methods and results<br />
A process development fast pyrolysis unit was designed and fabricated. The unit is capable of<br />
processing up to 10 kg of feed per hour. The purpose of the unit was to evaluate the process on a larger<br />
scale and provide sufficient quantities of oil for product evaluation. At this point in time the unit has<br />
been commissioned and operated over all envisaged processing conditions. A detailed analysis of the<br />
products from the fast pyrolysis unit has not yet been achieved with hardwoods.<br />
Derivation of essential oil from Eucalyptus leaves<br />
Methods<br />
Essential oils may be defined simply as volatile organic, condensable compounds obtained from<br />
plants. Different species produce different essential oils, and such oils may be concentrated in the<br />
flowers, fruit, leaves, roots, seeds and even the bark of plants. Eucalyptus leaves contain essential oil<br />
and it is this oil that gives the leaves their characteristic fragrance. From the time of European<br />
settlement, there has been considerable interest in the properties of essential oils of indigenous<br />
Australian plants, and in particular Eucalyptus plants.<br />
Steam distillation is the simplest method of extracting the oil from the leaves of Eucalyptus species.<br />
However, past research has demonstrated that the efficiency of oil recovery is strongly dependent on<br />
the distillation technique and the method of oil collection. The present research involved investigation<br />
of some relatively simple modifications of the steam distillation process in order to improve the<br />
efficiency of oil recovery without significantly increasing the overall cost and complexity of the<br />
process.<br />
In most Eucalyptus species, two compounds predominate in the essential oil present within the leaves<br />
and these are cineole and α-pinene. For most species, cineole is the more abundant of the two.<br />
Moreover, the value of Eucalyptus essential oil is directly related to its cineole content. For these<br />
reasons, efficiency of steam distillation and oil recovery was evaluated according to cineole recovery.<br />
Two sets of bench-scale experiments were performed in order to evaluate the influence of steam<br />
distillation modifications on oil recovery. Oil analysis was performed by gas chromatography. Both<br />
sets of experiments were performed on leaves obtained from the species E. globulus, and were<br />
collected from the one location. In the first set of experiments, three oil recovery techniques were<br />
compared with simple condensation. These techniques were:<br />
1. Simple condensation and collection in pentane<br />
2. Collection using a Dean-Stark apparatus<br />
3. Collection using a Likens-Nickerson apparatus.<br />
Results<br />
Simple condensation was the least efficient with only about 60% of the cineole recovered. The Dean-<br />
Stark apparatus, a modification of simple condensation, performed only slightly better. Simple<br />
condensation, followed by recovery in pentane, increased the recovery to about 70%, indicating that<br />
with simple condensation, approximately 16% of the cineole is lost with the condensed steam. The<br />
Likens-Nickerson apparatus performed the best with recovery of about 77% of the cineole. This is a<br />
xii
net increase of 28% compared to simple condensation. The Likens-Nickerson apparatus involves the<br />
co-condensation of an appropriate solvent with the steam/oil from the distillation. For this study<br />
pentane was employed.<br />
These results indicate that by substitution of a simple condenser with a Likens-Nickerson type<br />
condenser, total oil recovery may be increased by 28% and oil quality by 63%. That is, according to<br />
the bench scale results, a significant quantitative and qualitative increase in oil yield may be achieved<br />
through incorporation of a Likens-Nickerson apparatus. The solvent that was used for this apparatus in<br />
the present study was pentane. Pentane may be readily separated from Eucalyptus oil by distillation<br />
and reused. The boiling point of pentane is less than 40 o C and it has a low heat capacity. This means<br />
that separation of pentane from the recovered Eucalyptus oil is efficient and requires relatively little<br />
energy.<br />
In the second set of bench scale experiments, the influence of cohobation (recycling of condensed<br />
steam) and collection of distillate in pentane was evaluated. The implementation of cohobation<br />
resulted in a substantial increase in cineole recovery compared to simple steam distillation where the<br />
condensed steam is discarded. This recovery was increased even further by collection of the condensed<br />
cineole in pentane. The combination of these techniques resulted in more than 82% recovery of the<br />
total cineole originally present within the leaves. Based on the findings of this experiment, it may be<br />
concluded that:<br />
1. Recycling the condensed steam is an excellent and simple way of significantly improving the<br />
efficiency of cineole recovery.<br />
2 Large losses of cineole occur with simple distillation and condensation through losses<br />
to both water (partial solublisation of product) and air (inefficiency of condenser).<br />
A pilot scale steam distillation unit was constructed and the influence of cohobation on oil recovery<br />
evaluated. It was found that on the pilot scale (10 kg leaf capacity), a 14% improvement in oil<br />
recovery was achieved by recycling of the steam condensate. The magnitude of this improvement was<br />
significant, but less than that obtained from the bench scale experiments. This was most likely due to<br />
usage of an under-powered steam generator, resulting in an insufficiency of steam production.<br />
Conclusions<br />
The project found that substantial improvements in yield of essential oils could be obtained by<br />
relatively simple changes to existing extraction techniques. With regard to low-temperature fast<br />
pyrolysis of hardwood, it was concluded from the research that certain parameters strongly influence<br />
the yield of high-value chemicals. However overall, the actual yields were probably too low to ensure<br />
commercial viability of the process at this stage. Future research will involve further optimisation to<br />
improve product yields, while maintaining a high degree of selectivity, and thereby improve the<br />
commercial prospect.<br />
The project provided valuable insights into the effect of process conditions on pyrolysis chemistry and<br />
key product yields, and highlighted how sensitive the pyrolysis process is to key reaction conditions.<br />
These conditions are important to consider in any scaling-up of the process. The chemical analyses on<br />
pyrolysis products could inform future establishment of product purification requirements. Although a<br />
preliminary review of health risk information was conducted, further research on compound<br />
identification and toxicity assessment is needed if a wood pyrolysis industry is ever seriously<br />
considered.<br />
For any pre-commercial feasibility analysis, the results of the bench scale analyses must be subject to<br />
technical and economic evaluation by a group with experience in process engineering, wood<br />
processing and wood-based chemicals. The evaluation also needs to ascertain whether the yields<br />
obtained in the bench scale unit can be successfully scaled up to a commercial process.<br />
xiii
Chapter 1: Introduction<br />
Agroforestry is becoming increasingly important as landowners endeavour to maximise their return on<br />
poor quality or low-rainfall effected land. Unfortunately, much of the agroforestry resource in<br />
Australia is thinly and remotely distributed, thereby rendering large scale processing infeasible due to<br />
the prohibitive logistical requirements. That is, much of the agroforestry hardwood resource cannot be<br />
exploited in the same manner as that of plantation softwood. An alternative approach to utilisation of<br />
this hardwood resource is required. The development of such an alternative approach formed the<br />
principal objective of this research.<br />
Trees are a renewable material and a net consumer of carbon dioxide. Therefore, properly managed<br />
utilisation of the agroforestry resource will have minimum negative environmental impact. The current<br />
research involved developing techniques in which virtually the whole tree could be utilised for the<br />
derivation of high-value products. These products included Eucalyptus oil, furfuryls, phenols and<br />
crude cellulose. Eucalyptus oil is used in the pharmaceutical industry. Furfuryls and phenols are<br />
important, high quality, resin components and cellulose is used to make paper. Together, the current<br />
worldwide consumption of these commodities is around 250 billion dollars annually. Eucalyptus oil<br />
may be extracted from the leaves of trees by steam distillation. The spent leaves may then be used<br />
either as a soil amendment or as a fuel to provide the process heat requirements. The furfuryls and<br />
phenols may be derived sequentially from the woody portion of the tree by low-temperature fast<br />
pyrolysis, yielding a residue consisting of crude cellulose. Pyrolysis is a process in which heat is used<br />
to decompose matter and has been used in the past for the production of charcoal and “liquid smoke”.<br />
The current research involved adapting a pyrolysis technology developed on softwoods for usage with<br />
hardwoods. This technology comprises a two-stage pyrolysis process that capitalises on the natural<br />
differences in thermal stability between the major wood components, hemicellulose, lignin and<br />
cellulose. In the first stage, the hemicellulose component is selectively pyrolysed, yielding furfuryls<br />
and a solid residue. The lignin component of the solid residue is then selectively pyrolysed in the<br />
second stage yielding phenols and a solid residue consisting of crude cellulose. The selectivity is<br />
achieved by careful selection of processing parameters.<br />
The derivation of these products by steam distillation and fast pyrolysis of the agroforestry resource is<br />
a promising application for this material. It could enable significant value adding to an otherwise<br />
commercially non-viable resource. This is because many of the logistical problems associated with<br />
conventional applications of agroforestry material are diminished due to the high-value of the products<br />
and the relatively low production costs.<br />
A review of the literature relating to pyrolysis and Eucalyptus oil research is provided in order to place<br />
the research in a scientific context.<br />
1.1. Brief review of wood pyrolysis at low temperatures and<br />
essential oil extraction<br />
The pyrolytic behaviour of biomass is dependent on numerous operational parameters, some of which<br />
include:<br />
• Reaction temperature<br />
• Rate and method of heat application to the substrate<br />
• Residence time of substrate in heated zone<br />
• Size and geometry of the substrate<br />
• Composition and pressure of the reaction atmosphere<br />
• Presence of moisture within the substrate<br />
• Presence of catalysts and extraneous material<br />
1
Due to the sensitivity of the pyrolytic process to these parameters (and other parameters such as<br />
substrate type, reactor type, method of product collection etc), comparison of inter-laboratory data has<br />
been very difficult. In fact, most workers agree that in biomass pyrolysis there are few absolutes. That<br />
is, any data generated at a laboratory must be operationally defined to such a rigorous degree that it<br />
cannot be readily applied elsewhere. A large amount of research has been focused specifically on the<br />
characterisation of the effect of numerous operational parameters on the pyrolysis process but there are<br />
still many doubts and unanswered questions. Wood is composed of three major components; lignin,<br />
cellulose and hemicellulose, each of which behaves differently under pyrolysis conditions. The<br />
pyrolysis of these components is reviewed separately.<br />
1.1.1 Lignin pyrolysis<br />
Lignin is an amorphous, three dimensional phenylpropane polymer which accounts for about 17-30%<br />
of wood mass. The pyrolysis of lignin typically yields phenols, along with some carboxylic acids.<br />
Such phenols may substitute for their petroleum derived counterparts currently employed in phenolformaldehyde<br />
type resins.<br />
Lignin may be directly pyrolysed in wood or it may firstly be extracted, such as when black liquors<br />
from pulping processes are pyrolysed 1-3 . When lignin is pyrolysed, the products are distributed<br />
amongst four phases, aqueous and non-aqueous liquid, gas, and carbonised solid residue. The<br />
composition and yield of these phases depend mainly upon temperature and heat flux (rate of heat<br />
transfer) 4-7,8 . A typical phase distribution from the pyrolysis of lignin is as follows 9 .<br />
• Volatiles: carbon monoxide, methane, carbon dioxide, and ethane (12%)<br />
• Liquid: water, methanol, acetone, acetic acid (20%)<br />
• Tar: phenolic compounds (15%)<br />
• Char: carbonaceous material (55%).<br />
The high oxygen content of oils derived from the pyrolysis of lignin, and biomass in general, means<br />
that they are typically very reactive 10 . This presents difficulties in post-pyrolysis processing as<br />
conventional refining techniques, such as distillation, may cause undesired polymerisation reactions.<br />
Moreover, pyrolysis oils are corrosive, due to the presence of organic acids, and therefore precautions<br />
must be taken with respect to storage and materials handling. Moreover, the low pH of pyrolysis oils<br />
further reduces their thermal stability as the high acidity may catalyse polymerisation reactions, even<br />
at relatively low temperatures. These difficulties may be overcome through various passivation<br />
techniques, such as hydrogenation.<br />
At low pyrolysis temperatures, the thermal stability of lignin is greater than that of hemicellulose but<br />
less than that of cellulose 11 . Therefore, it seems feasible that lignin could be pyrolysed without<br />
significant cellulose degradation. In reality, at temperatures below 350 o C under inert atmospheric<br />
12, 13<br />
conditions, the pyrolysis of lignin is generally quite slow and therefore extensive cellulose<br />
decomposition is likely to occur.<br />
The weakest type of inter-unit linkage within lignin is the β-O-4 bond, which can be cleaved at<br />
temperatures below 310 o C 14-16 , to yield volatile products including low molecular weight phenols 15 .<br />
Therefore, any commercial process involving exploitation of the low temperature pyrolysis of lignin<br />
must consider this reaction and its decomposition products. Other lignin inter-unit linkages, such as the<br />
direct coupling of aromatic rings, have greater thermal stability and some cannot be decomposed<br />
below 350 o C 17 . Thus, when lignin is exposed to relatively low reaction temperatures (240-380 o C) for<br />
extended periods of time (slow pyrolysis), extensive cleavage of β-O-4 and other oxygenated linkages<br />
occurs, liberating low molecular weight products or providing highly reactive sites for secondary<br />
reactions, such as the formation of new linkages through intramolecular condensation. The liberated<br />
low molecular weight products may volatilise and quickly escape the substrate matrix, with or without<br />
further decomposition, or they may react with activated sites on the substrate to form new cross-links.<br />
2
As pyrolysis continues, the lignin substrate condenses. Oxygen is lost through formation of low<br />
molecular weight phenols, water and organic acids, and the proportion of carbon to carbon bonds<br />
increases. The overall process is referred to as carbonisation. Condensation reactions are an example<br />
of a secondary pyrolysis process and typically produce extremely complex product mixtures.<br />
Furthermore, condensation of lignin and lignin decomposition products may also occur with their<br />
cellulose counterparts, further complicating the product mixture 18,19 . Because increased product<br />
complexity leads to increased post-processing costs (such as product isolation and purification), as<br />
well as lower yields of individual compounds, it would be desirable to design a pyrolysis process<br />
whereby the occurrence of such condensation reactions is minimised.<br />
When lignin is heated, different decomposition reactions predominate at different temperatures and<br />
heating rates 20,21 . These phenomena may be exploited in order to maximise the yield of specific<br />
decomposition products. At low rates of heating, char yields are maximal and liquid yields relatively<br />
low. As the heating rate is increased, the yield of liquid product also increases 1,4,7,10,22,23,24,25,26,27 . As the<br />
yield of phenols is roughly correlated with the overall liquid yield from lignin pyrolysis, it follows that<br />
high rates of heating are necessary for the maximisation of phenolic compound yield 1,.28 . Heating rates<br />
greater than about 100 o C/sec produce best results 1,5,22-25,29-31 , especially when product quenching is<br />
rapid. Rapid product removal and quenching is more likely to prevent secondary decomposition<br />
reactions, of which phenols are highly susceptible 25 . This may be achieved by use of vacuum or with<br />
various inert “carrier gases” such as nitrogen 1,7 .<br />
The utilisation of rapid heating combined with short substrate residence times is referred to as fast- or<br />
flash-pyrolysis. The principal objective of lignin fast pyrolysis research has been to maximise the yield<br />
of low molecular weight phenols 1,4,24,31 . Up to 85% of the lignin in lignocellulosic material may be<br />
converted to condensable compounds, of aromatic character, under fast pyrolysis conditions 31 .<br />
However, the complexity and thermal instability of this product is such that conventional fractionation<br />
techniques are unsuitable. Moreover, much of the phenolic product consists of low molecular weight<br />
oligomeric material.<br />
The yield of phenolic compounds from the pyrolysis of lignin, under an inert atmosphere, increases<br />
with increasing reaction temperature for all heating rates 4 . However, there are limits. At temperatures<br />
greater than 650 o C, the yield of gas increases at the expense of liquid product due to extensive<br />
cracking 25 . Moreover, as temperature increases, the complexity of the liquid product increases, a<br />
phenomenon only partially mitigated through fast pyrolysis. For temperatures below 350 o C, the short<br />
substrate residence time of fast pyrolysis results in relatively little decomposition. It would therefore<br />
seem that the optimal temperature lies in the range of 350-650 o C 24,25 , unless other reaction parameters<br />
could be determined which either accelerate the rate of reaction at low temperatures or prevent the<br />
formation of gases, through cracking, at higher temperatures. Some workers have reported that<br />
maximum yield of phenols occurs at around 500 o C under fast pyrolysis conditions 4,24 , regardless of the<br />
nature of the lignocellulosic feedstock, when the process is performed under an inert atmosphere 19,32 .<br />
The substrate residence time influences the phenolic product 26,29 . The residence time is merely the time<br />
in which the feedstock particles are subjected to elevated temperatures. Low residence times yield<br />
mainly substituted guaiacols, whereas longer residence times yield the corresponding catechols 4 . In<br />
like manner, the residence time of product vapours within the heated zone influences product<br />
composition 1,26,34,35 . That is, primary pyrolysis products may further degrade if not rapidly quenched<br />
upon formation 36,37 , resulting in increased char and gas yields, as well as further complicating the<br />
liquid product mixture 10,38,39 . Short residence times can only be practicably achieved through very high<br />
rates of heating and are therefore associated with fast pyrolysis 1,4,23,25,26,40,41 . Fast pyrolysis processes<br />
involving movement of particles through a reactor generally decline in performance with increasing<br />
particle size. This is because the residence time increases with increasing particle size, thereby<br />
increasing the likelihood of undesirable secondary degradation processes 24,42 .<br />
3
It has been found that the composition and pressure of the reaction atmosphere dramatically affects the<br />
behaviour of the degradation reactions 43 . Thus, at different reaction pressures, different degradation<br />
pathways predominate 36,44,45 . The most commonly employed definition of pyrolysis is that it is the<br />
thermal degradation of matter in the absence of oxygen 41 . In order to comply with this definition, and<br />
to prevent combustion at higher temperatures, pyrolysis is normally performed in an atmosphere of<br />
inert gas, such as nitrogen, helium, argon or flue gases (mixture of H 2 0, CO 2 and CO) 8,17,21,46-48 . The<br />
use of such gases in fast pyrolysis, especially around atmospheric pressures, has been not so much to<br />
provide a specific reaction atmosphere but rather to provide a mechanism for transport of materials<br />
through the reactor as well as provide the necessary agitation in order to achieve fluidisation of the<br />
reactor bed 8,17,28,47,49,50,51 . Inert gases have also been used to enable the application of pressure to the<br />
substrate without involvement of the gases in the actual pyrolysis 8,36,45,46,48 . This has been done over a<br />
wide range of pressures.<br />
Relatively little work has been performed using reactive atmospheres. Hydrogeno-pyrolysis involves<br />
utilisation of high pressure hydrogen in the reaction atmosphere in order to create a product<br />
compositionally comparable with petroleum. Oxygen may also be incorporated in the reaction<br />
atmosphere. At low pyrolysis temperatures, the presence of oxygen increases the rate of<br />
decomposition by oxidation of the lignocellulosic substrate. At higher temperatures the inclusion of<br />
oxygen results in combustion of the volatile primary products 43 .<br />
When various lignin preparations are heated in the presence of oxygen, three degradation processes<br />
occur at relatively discrete temperatures. The final process is combustion and typically commences at<br />
around 380 o C 21 . The exothermic processes associated with the pyrolysis of lignin at sub-combustion<br />
temperatures are significantly amplified when pyrolysis is conducted in an atmosphere of oxygen<br />
compared to an atmosphere of nitrogen, implying a substantial increase in reaction rate. Moreover,<br />
compared to nitrogen, the presence of oxygen alters the temperatures at which exothermic processes<br />
occur. The reasons for these phenomena are believed to be due to variations in the nature of the<br />
product formed from the first exothermic process due to involvement of oxygen in the pyrolysis 49 . At<br />
low pyrolysis temperatures, the presence of oxygen in the reaction atmosphere promotes free radical<br />
initiated cross-linking and chain splitting reactions within lignin and hemicelluloses. The cleavage of<br />
lignin inter-unit bonds is believed to form carbonylic and carboxylic acid groups, which may then<br />
serve as intermediates in the subsequent cross-linking reactions 52 .<br />
Air has been utilised as a reaction atmosphere for a number of pyrolysis processes. These include<br />
gasification via the fluidised bed technique and the entrained flow process 8,24 , although little research<br />
has focused on elucidation of the mechanism of oxygen interaction in the latter process 8,53 . The<br />
entrained flow process, also known as the Tech Air process, involves a pneumatic up-flow entrained<br />
fast pyrolysis gasification reactor incorporating air. The yields of the various phases are 23% char,<br />
25% oil, 68% non-condensable gases and 33% water. The total yield exceeds 100% due to<br />
assimilation of nitrogen and oxygen from the process air. The major gaseous products from the process<br />
are hydrogen, methane, carbon dioxide and carbon monoxide. The even distribution of air throughout<br />
the reactor was considered to be an important requirement for optimum performance. A maximum<br />
yield of the desired products (oil and char) was obtained at the lower air to feed ratios. The reactor<br />
temperature could range between 177 to 260 o C at the top with a maximum bed temperature of 539 to<br />
926 o C 53,54 .<br />
1.1.2 Cellulose pyrolysis<br />
Cellulose pyrolysis has received the most attention of the three major wood components 18,56 .<br />
Shafizadeh is perhaps the greatest contributor to the knowledge of cellulose pyrolysis with studies on<br />
the mechanisms and reaction products, as well as the effect of additives and operational conditions 43,55-<br />
58 . Shafizadeh developed a global degradation scheme, depicted in Figure 1.1.2.1, to outline the major<br />
processes associated with the pyrolysis and combustion of cellulose 55 .<br />
4
Comparable to lignin, the pyrolysis of cellulose also yields four product phases, although the relative<br />
yields and composition differ significantly. Much of the interest in cellulose pyrolysis has involved<br />
optimisation of the yield of certain decomposition products, such as levoglucosan and other<br />
hydrolysable sugars 59,57,58 , as well as in the area of flame retardant development as much of the<br />
flammable gases associated with wood pyrolysis are associated with cellulose.<br />
CO, CO2, H2O, C<br />
O2<br />
Glowing ignition<br />
Cellulose<br />
Levoglucosan<br />
Polymers<br />
Combustable volatiles<br />
O2<br />
Flaming combustion<br />
Pyrolysis<br />
Combustion<br />
Figure 1.1.2.1. Schematic description of the pyrolysis and combustion of cellulose<br />
At temperatures below 300 o C, the overall rate of cellulose pyrolysis under an inert atmosphere is quite<br />
low 9 . For example, based on the formation of carbon dioxide and hydrogen, cellulose pyrolysis may<br />
commence at temperatures as low as 70 o C, albeit at an extremely low rate 60 .<br />
Differential Thermal Analysis (DTA) has revealed that when cellulose is heated, the first processes to<br />
occur are loss of bound moisture, followed by dehydration reactions 9,43,49 . The loss of bound water<br />
occurs at 100 o C whereas dehydration reactions occur between 170 and 220 o C depending on the nature<br />
of the cellulose 49,61 . The initial degradation processes to occur in cellulose pyrolysis are reduction in<br />
the degree of polymerisation, formation of free radicals, and dehydration and elimination reactions that<br />
yield water, carbon monoxide, carbon dioxide and 1,6-anhydro-3,4-dideoxy-β-D-glycero-hex-3-<br />
enopyranos-2-ulose (levoglucosenone) 43,61 as well as other furan derivatives 9,56,62,63 . Based on such<br />
phenomena, the following reaction sequence has been proposed by Chatterjee and Conrad 64 for the<br />
pyrolysis of cellulose below 300 o C:<br />
1. Initiation: formation of free radicals<br />
2. Propagation<br />
3. Product formation<br />
X-ray diffraction and viscosity measurements have revealed that a substantial reduction in cellulose<br />
depolymerisation may occur without significant mass loss 61 . That is, in the early stages of pyrolysis,<br />
the degree of polymerisation decreases from about 2,000 to approximately 200 with less than 15%<br />
mass loss. The mass loss is associated with cross-linking condensation reactions within the amorphous<br />
regions of the cellulose. A number of theories have been proposed to describe cellulose<br />
depolymerisation. One theory suggests that bond scission occurs at “strain points” located at the<br />
crystalline-amorphous interfaces 61,65,66 . A second theory suggests that the depolymerisation is<br />
random 63 , whereas a third theory suggests that depolymerisation occurs along the cellulose chain in a<br />
manner analogous to “unzipping” 67 , or a chain reaction process.<br />
For reaction temperatures between 310 and 375 o C, the rate of mass loss from the pyrolysis of cellulose<br />
is quite high 6,9,68 and proceeds exothermically 49 . Thermogravimetric analysis has indicated that this<br />
process results is 26-38% conversion of the original cellulose into volatile compounds 6 . The main<br />
processes occurring within this temperature range are rapid cleavage of the glycosidic bond<br />
(depolymerisation), followed by various rearrangement reactions of the subsequent volatile products,<br />
to yield 1,6-anhydro-β-D-glucopyranose (levoglucosan), 1,6-anhydro-β-D-glocofuranose, water,<br />
5
carbon dioxide, carbon monoxide 9,11,43,55,56,57,69 and other tarry degradation products containing<br />
carbonyl, carboxyl and hydroperoxide groups 9,69 . The pyrolysis products associated with levoglucosan<br />
are very similar to those obtained from the pyrolysis of cellulose itself, implying that levoglucosan is<br />
the dominant stable intermediate in cellulose pyrolysis 69,70,71 . If not quenched rapidly, the 1,6-anhydro<br />
sugar products may condense to yield new oligo- and polysaccharides, which may then dehydrate and<br />
decompose to yield 3-deoxy-D-erythro-hexosulose, various furan compounds and some aldehydes 56 .<br />
There is some overlap in the occurrence of the depolymerisation, dehydration and condensation<br />
reactions, although the latter reactions commence at lower temperatures 43 .<br />
There is some uncertainty as to whether pyrolysis of cellulose at 300 o C occurs according to a<br />
homolytic or heterolytic process 56 because evidence has been generated which supports both<br />
possibilities. The homolytic process involves the homolytic cleavage of the glycosidic bond, followed<br />
by depolymerisation via a free radical mechanism 72 , whereas the heterolytic process involves<br />
transglycosylation via a heterolytic mechanism where depolymerisation occurs by a carbonium ion<br />
intermediate 68 . A review of the evidence for the homolytic pathway has been developed by Golova 73 .<br />
Golova suggested that in the crystalline regions of cellulose, homolytic bond cleavage predominates,<br />
whereas in the amorphous regions heterolytic reactions predominate. The heterolytic degradation<br />
mechanism involves a transglycosylation reaction, which incorporates one of the free hydroxyl<br />
groups 57 and also involves free radicals 9 . The mechanism involves the intramolecular substitution of<br />
the glycosidic linkage by a free hydroxyl group. The conformation of the molecule must change to<br />
facilitate transglycosylation and at temperatures above 300 o C, the molecule is sufficiently activated to<br />
readily undergo such changes 61 .<br />
The overall activation energy for cellulose pyrolysis is maximal at temperatures below 300 o C,<br />
apparently due to the complex degradation reactions that occur at such temperatures 11 . At temperatures<br />
above 300 o C, the activation energy is quite variable and has been found to range between 21 to 50<br />
kcal/mol 11, 55,74,75 , although values as high as 150 kcal/mol have been obtained 49 . It has been suggested<br />
that the high variability in activation energy is due to the presence of less stable linkages that occur at<br />
random intervals along the cellulose chain 76 . An alternative explanation, based on TGA analyses of<br />
various types of cellulose, asserts that the wide variation in observed activation energies is due to a<br />
morphological phenomenon at the molecular level, such as the degree of crystallinity 11,49 . That is, a<br />
low degree of crystallinity would exhibit low activation energy.<br />
The main reactions associated with cellulose pyrolysis are believed to be controlled by the rate of heat<br />
transfer rather than by kinetic parameters. That is, as the applied temperature increases, the substrate<br />
temperature would remain relatively unchanged, although the decomposition reactions would occur at<br />
a faster rate. Furthermore, much of the applied energy would be consumed by volatilisation of the low<br />
molecular weight products 3 .<br />
Various liquid and gas chromatographic techniques have been utilised for the identification of<br />
cellulose pyrolysis products and reaction intermediates 3,9,56,69-71,77-79 . Identification of the volatile<br />
cellulose degradation products has been complicated by the presence of a large number of homologous<br />
compounds and structural isomers, which yield very similar mass spectra. Furthermore, most of the<br />
carbohydrate type products do not yield molecular ions by electron impact ionisation, thereby further<br />
complicating product identification 78 .<br />
The relationship between char yield and temperature is similar for the pyrolysis of lignin and cellulose.<br />
Moreover, the relationship between the char elemental composition and temperature is also similar.<br />
That is, for both lignin and cellulose, the ratio of hydrogen to carbon increases with increasing<br />
temperature as the corresponding ratio of oxygen to carbon decreases 55 .<br />
The pyrolysis of cellulose is influenced by the pressure and composition of the reaction<br />
atmosphere 55,49,56,57 . The yield of char increases with increasing pressure whereas the corresponding<br />
yields of condensable compounds decrease. The yield of carbon dioxide and hydrogen increase with<br />
6
increasing pressure whereas the yield of carbon monoxide, methane, ethane and ethene decrease with<br />
increasing pressure 68 .<br />
When cellulose is heated to 370 o C at different heating rates under a nitrogen atmosphere, although the<br />
resultant condensable product is complicated, there is relatively little variation in product<br />
composition 77 . That is, the mechanism of cellulose degradation at 370 o C is independent of heating<br />
rate 61 under an atmosphere of nitrogen. Pyrolysis of cellulose under vacuum results in a high yield of<br />
condensable product, especially levoglucosan, compared to pyrolysis conducted under inert pressure 9 ,<br />
a phenomenon ascribed to the rapid removal, and subsequent prevention of secondary decomposition,<br />
of primary products 9,56 . When cellulose is heated under a vacuum, the yield of condensable product<br />
increases from 60 to 80% over the temperature range 300 to 500 o C 43,47,69 . The corresponding char yield<br />
decreases significantly. Likewise, when cellulose is heated in nitrogen at atmospheric pressure, the<br />
yield of condensable product also increases over the same temperature range, albeit to a much lower<br />
extent than it does under a vacuum. Thus, in comparison to pyrolysis conducted under vacuum, the<br />
effect of nitrogen (that is, elevated pressure) reduces the yield of condensable product as well as<br />
reduces the rate in which the yield of this product increases with increasing reaction temperature 56,57 .<br />
The pyrolysis of cellulose in air at temperatures below 310 o C occurs more rapidly than it does in<br />
nitrogen. This is because the activation energy for cellulose pyrolysis is lower in the presence of<br />
oxygen, a fact ascribed to the di-radical character of molecular oxygen which enables it to facilitate<br />
decomposition via free radical mechanisms 55 . At temperatures above 310 o C, the rate of cellulose<br />
pyrolysis is the same for both atmosphere types 43,77 . The formation of carbonyl, carboxyl and<br />
hydroperoxide groups in compounds associated with the tarry residue is greater under air than under<br />
an inert atmosphere due to increased secondary decomposition of primary products 56 . Similarly, the<br />
formation of carbon dioxide and carbon monoxide are greater under air than under an inert<br />
atmosphere, due to decarboxylation and decarbonylation reactions of the aforementioned secondary<br />
products 55 .<br />
1.1.3 Hemicellulose pyrolysis<br />
The contemporary name for hemicelluloses are cross-linking glycans. Hemicelluloses comprise all of<br />
the non-cellulosic polysaccharides and related substances in wood, such as the polyuronides, mannan,<br />
xylan and araban, and are often referred to as pentosans, hexosans or wood polyoses 68 . Hardwood<br />
hemicelluloses are composed mainly of xylose whereas softwood hemicelluloses are composed mainly<br />
of glucomannans 55 .<br />
The pyrolysis of hemicellulose and related carbohydrates has been reviewed by a number of<br />
workers 68,80-82 , although compared with cellulose, there is still very little data available. This is<br />
probably due to the relative complexity and lower abundance of hemicellulose compared to cellulose.<br />
For example, there is still no systematic definition of hemicellulose and no satisfactory, or<br />
representative, routine isolation techniques. The composition of hemicellulose varies significantly<br />
between species and consequently its thermolytic properties also vary between species. All these<br />
factors compound to complicate inter-laboratory data comparison.<br />
Of the three major wood components, hemicellulose is the least stable under pyrolytic conditions. The<br />
variation in thermal stability between hemicellulose and cellulose has been attributed to variations in<br />
chemical structure and morphology at the molecular level 11 , although the actual pyrolytic reactions of<br />
hemicellulose generally resemble those of cellulose 9,11,68,83,84 . The low thermal stability of<br />
hemicellulose is mainly associated with the presence of side chains and its non-crystalline open<br />
structure, properties that also account for its high susceptibility toward hydrolysis. That is, the<br />
structure of hemicellulose exhibits a much higher degree of amorphousness than does cellulose 9,11,21, 83 .<br />
The low thermal stability of hemicellulose is also due in part to an auto-oxidative process catalysed by<br />
the glucouronic acid side chains 11 .<br />
7
TGA studies have revealed that hemicellulose from hardwood has a much higher thermal stability than<br />
from softwood. This difference is associated with differences in structure and molecular weight 49 .<br />
Thus, the low temperature fast pyrolysis of hardwood is more difficult to achieve than it is for<br />
softwood.<br />
When hemicellulose is heated, the first process to occur is loss of free moisture 49 . Further heating<br />
results in an exothermic decomposition process commencing between 170-230 o C and finishing<br />
between 250-325 o C. The loss of free moisture is indicated by an endotherm at 100 o C 49 . Potassium<br />
xylan exhibits a small endotherm at around 170 o C 49,85 . This is believed to be due to a softening<br />
process, or a sort of crystal transition phenomenon, rather than dehydration, because xylan does not<br />
contain any primary hydroxyl groups. From Thermogravimetric and Differential Thermal Analyses,<br />
the exothermic decomposition of hemicellulose in wood, or as a preparation from wood, commences at<br />
170-230 o C and is complete at 250-325 o C 6,9,68,86,87 . The decomposition of hemicellulose in wood<br />
involves a 17-20% mass loss, indicating that formation of volatile compounds is the dominant<br />
process 6,9,49,88 .<br />
Like cellulose and lignin, the pyrolysis of hemicellulose yields the four product phases, noncondensable<br />
gases, char, aqueous condensate and tar. Moreover, the yield and composition of each<br />
phase is dependent upon the actual pyrolysis conditions 89,90 . A typical yield of the product phases from<br />
the slow, low temperature, pyrolysis of xylan is 31% char, 16% tar, 31% aqueous condensate, and 8%<br />
gas (as CO 2 ) 89 , although these figures can vary significantly, especially the tar yield.<br />
The tar phase has been shown to be composed primarily of oligosaccharidic material, with an average<br />
degree of polymerisation of 6-8, and some other compounds. It has been proposed that the tar<br />
component is derived through two main pathways. In one pathway oligosaccharidic material is<br />
produced directly from the hemicellulose by random glycosidic cleavage, and subsequent rapid<br />
removal of the polymeric fragments from the zone of pyrolysis. In the other pathway, the<br />
oligosaccharidic material is derived from condensation of products associated with the<br />
transglycosylation reaction 68,86 . Analytical evidence suggests that under slow pyrolysis conditions, the<br />
latter pathway predominates. That is, structural analysis of the tar fraction reveals that it is highly<br />
branched, a property consistent with condensation products rather than fragments derived from<br />
random bond scission of the hemicellulose 21 . Moreover, comparison by thin layer chromatography of<br />
the tar residue and its acid hydrolysis product confirm that the un-hydrolysed material was oligomeric<br />
in nature 86 , and when subjected to periodate oxidation, followed by reduction and acid hydrolysis, low<br />
oxidation values and high xylose to xylitol ratios are obtained. If the oligosaccharides contain only<br />
1→4 links, that is, if the oligosaccharides are fragments of the original hemicellulose, the amount of<br />
oxidant consumed should have been about 2 mols for the terminal units and 1 mol for the internal<br />
units. Therefore the low oxidation values obtained indicate the presence of other links and/or<br />
branching which have protected the xylose residues from oxidation, suggesting that the<br />
oligosaccharides are mainly condensation polymers from primary glycosyl pyrolysis products, rather<br />
than fragments from glycosidic cleavage of the hemicellulose chain 89 . In contrast, under fast pyrolysis<br />
conditions, a lower yield of tar would be expected, and the composition of the tar would be expected to<br />
comprise of a greater proportion of hemicellulose fragments derived directly from random bond<br />
scission of inter-unit linkages rather than oligosaccharidic material derived from secondary<br />
condensation reactions. This is because the residence time within the zone of pyrolysis of both<br />
feedstock and primary pyrolysis products is substantially lower under fast pyrolysis conditions.<br />
DTA studies have revealed that two exothermic decomposition pathways, operating in sequential<br />
order, occur in the low temperature pyrolysis of hemicellulose 49,84 . The activation energies are 11 and<br />
21 kcal/mol respectively, although higher activation energies have been reported from pyrolysis of<br />
hemicelluloses from different wood species 11 . It has been proposed that the first reaction pathway<br />
involves fragmentation into volatile short-chain segments, while the second pathway involves<br />
depolymerisation of the segments to yield low molecular weight compounds. Alternatively, the second<br />
process may involve a rapid, direct, decomposition of the volatile products from the first process 91 .<br />
8
The study of low temperature/long residence time hemicellulose pyrolysis is complicated when<br />
cellulose is present. Under such conditions the hemicellulose content of wood may appear to remain<br />
constant. This apparent contradiction arises because cellulose is gradually degraded into hexosan units,<br />
which are then associated with the hemicellulose fraction upon analysis 91 . Despite such difficulties, a<br />
number of reaction pathways have been proposed for the pyrolysis of xylan. In summary, such<br />
processes, which are dependent on reaction conditions, include dehydration, disproportionation,<br />
random condensation and direct fragmentation of the glycosyl unit derived from the thermal cleavage<br />
of the glycosidic bond 89,92,93 .<br />
The pyrolysis of hemicellulose involves random dehydration reactions, and cleavage of glycosidic<br />
bonds via a transglycosylation reaction, to yield monomeric glycosyl type compounds in a manner<br />
analogous to that of cellulose pyrolysis 11,9 . Condensation of the glycosyl residues may then occur,<br />
yielding oligosaccharidic material (tar), or decompose further yielding low molecular weight volatile<br />
compounds 9,93,94 . Such volatile compounds include furan derivatives, such as furfural, which are<br />
generally associated with dehydration of carbohydrates and therefore may be obtained in significant<br />
quantities from both cellulose and hemicellulose 95,96 . Evidence generated from model compound<br />
studies has also revealed that furfural, and numerous other compounds, may be produced from<br />
decomposition of oligomeric material (tar) obtained from condensation of glycosyl units from both<br />
cellulose and hemicellulose pyrolysis 89,97 . Thus, furfural may be derived from the pyrolysis of wood<br />
carbohydrates via at least two reaction pathways:<br />
1. Glycosidic cleavage followed by dehydration<br />
2. Decomposition of condensation products derived from transglycosylation reactions.<br />
A mechanism for the formation of furfural has been described 92 . The mechanism involves formation of<br />
3-deoxy-pentosone, a stable intermediate, which then undergoes dehydration to yield furfural, or 5-<br />
hydroxy-2-furfuraldehyde if the starting material was a hexose 98 .<br />
Another type of reaction involved in hemicellulose pyrolysis is fragmentation of glycosyl units. It has<br />
been reported that the rate of such fragmentation reactions increase more rapidly with increasing<br />
temperature compared to the rate of dehydration reactions, leading to the expectation that<br />
fragmentation predominates at higher temperatures 68 . Thus, it would be expected that the yield of<br />
furfural would be maximal at relatively low temperatures. Moreover, as the rate of cellulose pyrolysis<br />
is not significant below 300 o C, the yield of furfural from cellulose decomposition will be low at all<br />
temperatures. This is because at higher temperatures, where the rate of cellulose pyrolysis is<br />
significant, the rate of glycosyl fragmentation is high compared to its rate of dehydration.<br />
Under fast pyrolysis conditions, hemicellulose may be pyrolysed at temperatures exceeding 500 o C.<br />
However, at lower heating rates, the reaction temperature is considerably less, regardless of the applied<br />
temperature 68 . Moreover, high rates of heating result in lower yields of char, probably due to the<br />
predominance of transglycosylation and fragmentation reactions 99 .<br />
The pyrolysis of hemicellulose under nitrogen and oxygen enriched atmospheres has been investigated<br />
by DTA. The presence of oxygen does not seem to alter the temperature at which exothermic events<br />
occur, although it does result in an additional exothermic process 21,49 . Overall, the influence of<br />
atmosphere composition on the pyrolysis of hemicelluloses has received little attention.<br />
1.1.4 Pyrolysis research in Australia<br />
In Australia, very little research has been performed on the derivation of chemicals from the pyrolysis<br />
of native species. In fact, there is relatively little interest in biomass pyrolysis research within<br />
Australia. This is probably due to lack of incentive caused by low petrochemical commodity prices<br />
combined with Australia’s relatively lax greenhouse gas and renewable energies policies.<br />
9
There is a large project in Western Australia involving the thermochemical processing of an<br />
agroforestry resource. The project is being conducted by Western Power, a local electricity producer,<br />
and involves production of electricity and activated carbon from the pyrolysis of Mallee. A large pilot<br />
scale plant has been constructed at Narrogin, a small town approximately 170km south east of Perth.<br />
The technology behind the process was developed by Dr Paul Fung at the CSIRO Forest Products<br />
Laboratory, Clayton. If successful, the project will enable Western Power to fulfil its obligation in<br />
developing renewable energy streams that will amount to at least 2% of its total energy production, the<br />
target imposed under the Federal government’s renewable energy policy. Moreover, success of the<br />
project will also provide Western power with large quantities of activated carbon, an expensive<br />
commodity currently produced globally in relatively small quantities.<br />
During the oil crisis in the 1970s, the pyrolysis of coal and oil-shale was investigated in Australia at<br />
CSIRO. The objective of both streams of research was to produce liquid hydrocarbons from solid<br />
fossil fuels for use in transportation. The research was eventually abandoned due to a decline in the oil<br />
crisis and resultant reduction in crude oil prices.<br />
During the 1980s, the Chemical Engineering department of Melbourne University, under the<br />
leadership of Mike Connor, modelled various pyrolytic phenomena in wood particles 6,22 .<br />
The research embodied in the current project is a part of the Melbourne University, School of Forestry<br />
pyrolysis research program. This program began with an investigation into the low temperature fast<br />
pyrolysis of Radiata pine for phenols production. The research program involved development of a<br />
pyrolysis technology that minimised many of the characteristics which confound commercial<br />
utilisation of pyrolysis liquids. These detrimental characteristics include:<br />
• Low thermal stability<br />
• Extremely high complexity<br />
• Low yield of individual compounds<br />
• High tar content<br />
• Low pH<br />
The origin of these characteristics has been briefly reviewed and the low temperature, fast pyrolysis<br />
process developed at the University of Melbourne is designed to mitigate their negative influence on<br />
oil quality through elimination or minimisation of the processes which result is these characteristics.<br />
1.2 Review of essential oil extraction<br />
Essential oils may be defined simply as volatile organic, condensable compounds obtained from<br />
plants. Different species produce different essential oils, and such oils may be concentrated in the<br />
flowers, fruit, leaves, roots, seeds and even the bark of plants.<br />
In plants, essential oils are typically comprised of numerous compounds with perhaps one or two<br />
dominating the mixture. Often, these oils need to be modified in some way in order to meet specific<br />
commercial needs and this is usually achieved through blending, purification and fortification. The<br />
commercial usage of essential oils may be grouped into three categories and these are pharmaceutical,<br />
fragrances/flavours and industrial.<br />
The pharmaceutical properties of essential oils have been recognised since antiquity but only in the<br />
last 500 years or so have these properties been investigated with any scientific rigour. In the early<br />
sixteenth century, the Swiss medical reformer, Bombastus Paracelsus von Hohenheim (1493-1541),<br />
proposed that the medicinal properties of a plant are caused by some constituent, the quinta essentia,<br />
and that the goal of pharmacy should be the isolation of this substance. Today, the quinta essentia in<br />
medicinal products is referred to as the ‘active ingredient’ and is either derived from natural products,<br />
such as essential oils, or is synthesised. Many essential oils are highly aromatic and are therefore used<br />
10
as fragrances in their own right or as ingredients in perfume manufacture. Essential oils that possess<br />
characteristic flavours are used by the flavour industry. Industrial applications of essential oils include<br />
solvents, cleaners and raw material for the synthesis of substances not available or impractical to<br />
source from nature.<br />
Essential oils may be extracted from the plant by a variety of techniques. For example, steam<br />
distillation is the preferred method for isolating oils present within leaves, whereas pressing is the<br />
preferred technique for extracting oils associated with fruit or flowers.<br />
World trade of essential oils is difficult to determine. This is because essential oils may be traded as<br />
raw oil, refined/upgraded oil, or as a component of some manufactured product. Production figures are<br />
also difficult to obtain because oils of commercial significance are extracted from more than 300 plant<br />
species distributed throughout many different countries. However, some statistics are available. Table<br />
1.2.1 lists the world trade of essential oils, including fragrances (perfumes) and flavours.<br />
Table 1.2.1. World trade of essential oils. Source: United Nations International Trade Yearbook 1999 and 2002<br />
World Trade In Essential Oils, Perfumes And Flavours - US$ million<br />
1986 1990 1994 1998 2002 Est. 1986–98 Average % pa<br />
Exports<br />
Imports<br />
2,149<br />
2,008<br />
4,122<br />
4,206<br />
5,051<br />
6,811<br />
7,435<br />
4,802<br />
8,254<br />
5,316<br />
+10.9<br />
+10.7<br />
From examination of Table 1.2.1, it is apparent that the essential oil industry is a multibillion-dollar<br />
industry which is growing very rapidly. World production of essential oils is estimated to be between<br />
100,000-110,000 tons, not including turpentine oil.<br />
Eucalyptus leaves contain essential oil and it is this oil that gives the leaves their characteristic<br />
fragrance. From the time of European settlement, there has been considerable interest in the properties<br />
of essential oils of indigenous Australian plants, and in particular Eucalyptus plants.<br />
In 1788, the genus was named Eucalyptus by L’Heriter. The word is derived from the Greek words eu<br />
(well) and kalypto (I cover) and eludes to the observation that the flower-bud covers the stamens until<br />
they are fully developed. Medicinally, Eucalyptus oil is used for the treatment of bronchial ailments,<br />
where it works by stimulating mucous secretion, and as an antiseptic agent. The active therapeutic<br />
agent in Eucalyptus oil is 1,8-cineole, the structure of which is provided in Figure 1.2.1.<br />
OH<br />
1,8-Cineole<br />
Figure 1.2.1. Structure of 1,8-cineole<br />
As a treatment for bronchial ailments, Eucalyptus oil is generally used as an expectorant, where it is<br />
administered by inhalants, embrocations, liniments, soaps, gargles, lozenges and dentrices. Eucalyptus<br />
oil also has mild anaesthetic properties.<br />
11
The 1,8-cineole content of Eucalyptus oil varies considerably between species and can also vary<br />
considerably within species. For example, the proportion 1,8-cineole in the oil of E. oleosa is 20-50%,<br />
whereas the corresponding proportion in E. polybractea is 80-90%. Commercially, medicinal<br />
Eucalyptus oils must have a 1,8-cineole content greater than 70%. The quality, and consequent value,<br />
of a medicinal Eucalyptus oil is dependent on the 1,8-cineole content with low grade oils containing<br />
70-75% and higher grades containing 80-85% or higher.<br />
The amount of Eucalyptus essential oil used in perfumes and flavourings is very small, as most oils do<br />
not possess the necessary properties. Industrial Eucalyptus oils contain phellandrene and piperitone as<br />
the principal constituents. Oils rich in phellandrene are used as inexpensive disinfectants, domestic and<br />
industrial liquid soaps, and germicidal preparations. Piperitone rich oils are used as a raw material for<br />
the synthesis of menthol and thymol. Eucalyptus oil is also used in small quantities as an industrial<br />
solvent, an application that is expected to increase considerably as less environmentally-friendly<br />
industrial solvents are phased out. The structure of the main components of industrial Eucalyptus oils<br />
is displayed in Figure 1.2.2.<br />
O<br />
Figure 1.2.2. Structure of the major constituents of industrial Eucalyptus oils.<br />
An interesting industrial application for Eucalyptus oil that is currently under developed is as a liquid<br />
fuel component 100 , in the same way canola oil, or bio-diesel, is now being used as a diesel substitute.<br />
Such an application would massively increase the demand for low quality Eucalyptus oil and the<br />
challenge for producers would be to meet this demand at competitive prices.<br />
Total world production of Eucalyptus oil is about 3,000 tonnes per annum. At present, the main<br />
producers are Portugal (400 tonnes) and Spain (200 tonnes). Australian production accounts for less<br />
than 15% of the total world production, although most of this is high quality pharmaceutical grade oil.<br />
Table 1.2.2. Estimated Eucalyptus oil production in Australia 101 .<br />
Year Production (tonnes) Imports (tonnes)<br />
1947-48<br />
1948-49<br />
1949-50<br />
1950-51<br />
1951-52<br />
1952-53<br />
1977<br />
1987<br />
900<br />
560<br />
520<br />
780<br />
775<br />
540<br />
200<br />
140-160<br />
*<br />
*<br />
*<br />
*<br />
*<br />
*<br />
75<br />
270<br />
Detailed statistics of Australian Eucalyptus oil production are not available. This is because a common<br />
practice in Australia is to import inexpensive, low quality, oils and blend them with Australian<br />
12
produced high quality oils, thereby creating a higher value product. It is estimated that in Australia,<br />
about 60 tonnes of pure 1,8-cineole, worth approximately $850,000, are produced annually. The<br />
estimated total Eucalyptus oil production in Australia is displayed in Table 1.2.2.<br />
Examination of Table 1.2.2 reveals that production of Eucalyptus oil in Australia has been steadily<br />
declining in recent decades. This has been ascribed to lack of local demand, cheap imports and a<br />
backward industry. Very little has changed since 1947 in Australia with regard to production<br />
technology. There are many undeveloped countries that employ equivalent technologies for the<br />
extraction of essential oils but overcome the inherent inefficiencies, such as poor oil recovery, of<br />
obsolescence through cheap labour costs. In Australia, this is not possible and therefore, without<br />
modernisation or improvement of oil recovery, the local industry will always struggle to compete.<br />
The agroforestry resource is widely, and often remotely, distributed and therefore any extraction<br />
technology must be inexpensive and simple to maintain if it is to be viable. Moreover, as much of the<br />
agroforestry resource is situated in low rainfall areas, any extraction process must utilise only small<br />
amounts of water. This requirement negates the feasibility of most currently employed steam<br />
distillation techniques as such techniques involve prolific water usage. Thus, in order to develop a<br />
viable oil recovery process, the present research involved exploring relatively simple techniques for<br />
improving oil recovery that require minimum water usage. Therefore, in the context of<br />
thermochemical processing of agroforestry biomass, the purpose of the essential oil research was to:<br />
1. Adopt a whole-tree approach through incorporation of essential oil extraction with other value<br />
adding processes, thereby enabling a mutual offsetting of production costs.<br />
2. Exploration of cost-effective techniques to improve oil recovery.<br />
The objective of the essential oil research was to develop a method for the extraction and<br />
characterisation of essential oils from the leaves of Eucalyptus trees. Initial, developmental research<br />
was to be conducted on the bench scale, followed by evaluation on the process development scale. The<br />
motive for the research was to provide an additional commodity stream from the thermochemical<br />
processing of low-value agroforestry material, the other streams being the pyrolytic derivation of<br />
furfuryls/phenols and cellulose. It was expected that such an integrated approach would enable<br />
essential oils to be produced at significantly lower costs than is currently possible. This is because<br />
much of the production costs are shared between other high-value commodities.<br />
Earlier research conducted under the supervision of Dr Barry Shearer established that there is a<br />
significant seasonal variation in the yield of Eucalyptus oil, probably related to variation in rainfall and<br />
temperature, and optimisation of any commercial process should acknowledge this. This earlier<br />
research also revealed that there is even a significant variation in Eucalyptus oil content between trees<br />
of the same species from the same site. Therefore, in order to establish the potential yield of oil that<br />
may be obtained from a property, a large representative sample must be collected and the average yield<br />
determined. This type of research was not of interest in the present study. Rather, the primary<br />
objective of the present study was to determine which oil recovery techniques provided the ‘best’ oil<br />
yield with respect to both quality and quantity.<br />
13
Chapter 2: Objectives<br />
The overall aim of the research was to develop a thermochemical technology for the processing of<br />
agroforestry biomass to the value-added products, furfural, furfuryl alcohol, low molecular weight<br />
phenols, crude cellulose and Eucalyptus oil. The thermochemical technology has two components, a<br />
two-stage, low-temperature, fast pyrolysis process and an improved steam distillation process. The<br />
pyrolysis technology was originally developed at the University of Melbourne for application to<br />
softwood species, such as Radiata pine, but has never been applied to hardwood previous to this<br />
research. The steam distillation research involved evaluating relatively simple techniques through<br />
which the efficiency of conventional steam distillation may be improved.<br />
The objectives of the project were as follows:<br />
1. Develop and optimise a two-stage, bench scale fast pyrolysis process for the derivation of<br />
furfuryls, phenols and cellulose.<br />
2. Develop a bench scale gasification unit for production of low BTU gases.<br />
3. Perform detailed chemical analyses on pyrolysis products in order to facilitate process<br />
optimisation as well as provide the necessary data for development of suitable purification<br />
processes.<br />
4. Evaluate any heath risks associated with the products based on current knowledge of the<br />
toxicology of individual components.<br />
5. Develop and optimise a bench scale steam distillation unit for recovery of essential oils from<br />
leaves.<br />
6. Develop and optimise a process development scale unit integrating both pyrolysis and steam<br />
distillation processes.<br />
7. Prepare mathematical models of engineering and thermochemical properties of the process<br />
development unit to facilitate construction of a pilot scale plant.<br />
8. Perform a market analysis detailing the supply and demand situation of the end products.<br />
The report addresses each objective in the following sections:<br />
Objective 1:<br />
Objective 2:<br />
Objective 3:<br />
Objective 4:<br />
Objective 5:<br />
Objective 6:<br />
Objective 7:<br />
Objective 8:<br />
Chapter 3:Methodolgy<br />
Chapter 4: Analysis of Pyrolysis Products<br />
Chapter 5: Influence of Selected Operational Parameters on Stage 1 of the Pyrolysis<br />
Process<br />
Chapter 6: Influence of Selected Operational Parameters on Stage 2 of the Pyrolysis<br />
Process<br />
Chapter 8: Process Development Units: Fabrication and Commissioning<br />
Chapter 4: Analysis of Pyrolysis Products<br />
Chapter 10: Passivation/Isolation of Liquid Pyrolysis Product<br />
Chapter 9: Assessment of Any health Risks in Relation to the Process and the Oil<br />
Produced<br />
Chapter 7: Optimisation of Essential Oil Recovery Processes<br />
Chapter 8: Process Development Units: Fabrication and Commissioning<br />
Not able to be completed<br />
Chapter 11: Market Analysis<br />
14
Chapter 3: Methodology<br />
This chapter summarises the methodology employed for the research.<br />
3.1 Feedstock and material preparation for bench scale pyrolysis<br />
experiments<br />
3.1.1 Selection of feedstock<br />
The feedstock that was used for the fast pyrolysis research was the sapwood component of kiln dried<br />
mountain ash (E. regnans). Feedstock analysis was performed as per the methodology described in<br />
Section 3.5. These analyses gave an estimate of the cellulose, hemicellulose and lignin content of the<br />
feed. Although mountain ash is not a species commonly associated with agroforestry, it is nevertheless<br />
typical of eucalypts with respect to its chemical structure. The chemical structure is perhaps the main<br />
wood parameter influencing the final product composition and does not vary significantly between<br />
species, except at the softwood/hardwood level.<br />
3.1.2 Size reduction of feedstock<br />
A belt sander, equipped with a dust collection bag, was used to produce fine particles from the<br />
feedstock. The sandpaper was 80 gauge. The abrasive surface was composed of aluminium oxide. The<br />
sanding was conducted in a parallel orientation to the grain of the raw sapwood feedstock.<br />
3.1.3 Grading of feedstock<br />
The crude sander-dust was initially screened at 850 μm to produce two fractions. The coarse fraction<br />
was discarded, and the fine fraction further fractionated.<br />
A mechanical shaker, equipped with the appropriate sieves, was used to fractionate the fine fraction of<br />
sander-dust into three ranges of particle size: < 150, 150-210 and >210μm. The middle particle size<br />
range was the one that was employed. It was planned to look at other particle size ranges but the<br />
properties of the material would not permit larger particle size ranges from being fed, by entrainment,<br />
into the reactor. That is, larger particle size ranges formed “balls” that would not enter the inlet<br />
mechanism.<br />
3.1.4 Drying of feedstock and determination of moisture content<br />
The two levels of water content that were employed were the “as-received” moisture content and zero<br />
moisture.<br />
The oven drying of the feedstock was conducted in accordance with the guidelines presented by<br />
Browning 102 . A drying oven set to 105 o C was used to completely remove free moisture from the<br />
feedstock. Complete removal had occurred when constant mass was achieved.<br />
The ”as received” moisture content was determined by treatment of a known mass of feedstock at<br />
105 o C until constant mass was achieved. The difference in mass between the untreated and treated<br />
feedstock was equated to the mass of water initially present. The moisture content of the three samples<br />
was 8.55, 8.41 and 8.47%. The mean moisture content was 8.45%.<br />
15
3.1.5 Preparation of sand for the reactor<br />
Fine river sand was used for the experiments. The sand, obtained from a local merchant, was a slight<br />
shade of pink. The colour of the sand indicated the presence of potassium felspar. It was not expected<br />
that this would influence the experiments as no differentiation is recorded in the literature between<br />
sodium, potassium and calcium felspars on pyrolytic reactions. Approximately 1.5kg of sand was<br />
sieved through a 500 μm stainless steel mesh to remove particles that were too large. In order to<br />
destroy any organic material, the fine fraction was placed in a cylindrical stainless steel vessel and<br />
placed in the furnace for 2 hours at 600 o C. Upon cooling, the sand was manually sieved into the<br />
desired fractions.<br />
3.2 Description of the bench scale pyrolysis unit hardware<br />
A series of fast pyrolysis experiments were conducted on a bench scale apparatus. The apparatus was<br />
based on the fluidised bed method of heat transfer. Heating rates of greater than 500 o C/second have<br />
been claimed for this method 31 . The objective of the experiments was to determine the effect of certain<br />
operational parameters and feedstock properties on the pyrolysis of lignocellulose, primarily with<br />
respect to the yield of monomeric phenolic compounds and furfuryls.<br />
3.2.1 Major components of the fast pyrolysis unit<br />
Reactor and furnace<br />
The reactor was manufactured by RTI Ltd, a Canadian company that specialises in the production of<br />
small-scale pyrolysis apparatus. The reactor was manufactured from 316 grade stainless steel and was<br />
equipped with a type K thermocouple that enabled the temperature of the sand bed to be continuously<br />
monitored. At normal operating conditions (450-600 o C), the reactor can process up to 100g of feed<br />
material per hour. A cyclone was permanently attached to the outlet of the reactor in order to separate<br />
entrained char from the product gases. The char was collected in a vessel attached to the base of the<br />
cyclone. A diagram of the reactor is displayed in Figure 3.2.1.1.<br />
A 3.6 kW furnace, manufactured by Ceramic Engineering, was used to heat the reactor to the reaction<br />
temperatures. The furnace chamber was cylindrical in shape and was approximately 600mm in length<br />
and 100mm in diameter. The temperature of the furnace was controlled by a Eurotherm controller. A<br />
separate Eurotherm controller was used to monitor the reactor temperature. If the reactor temperature<br />
exceeded, or approached too rapidly, a preset value, the furnace elements were either switched off or<br />
the power was reduced.<br />
Feeder system<br />
A feeder was manufactured by RTI limited and was capable of delivering a steady stream of entrained<br />
feedstock particles into the reactor sand bed. The feeder consisted of a cylindrical Perspex vessel,<br />
approximately 200mm in length and 60mm in diameter, which served as a hopper.<br />
A 2mm I.D stainless steel tube, referred to as the entrainment tube, is positioned diametrically through<br />
the feeder and close to the base. A stream of gas, referred to as the feeder gas, is passed through this<br />
tube. A small hole, the size and orientation of which is dependent on the particle size and type of<br />
feedstock to be processed, is positioned midway between the inlet end and centre of the tube. For the<br />
present study, a hole of 1mm diameter was employed and was orientated downwards. A downward<br />
orientation permits a lower feed rate compared with an upward or sideways orientation.<br />
16
Feedstock inlet line<br />
Attach to Stirrer<br />
Cooling gas outlet<br />
Cooling gas inlet<br />
Top section<br />
Temperature<br />
probe<br />
To Quench system<br />
Feeder Gas Inlets<br />
Stirring Mechanism<br />
Bottom section<br />
Aperture for Sample<br />
Cyclone<br />
Reactor<br />
To Reactor<br />
Char pot<br />
B. Feeder system<br />
Base plate<br />
Carrier gas inlet<br />
A. Fluidised bed reactor<br />
To electrostatic<br />
precipitator<br />
C. Solid residue collector<br />
Solids trap<br />
Quench fluid<br />
Inlet from reactor<br />
D. Quench system<br />
Mesh<br />
Desiccant<br />
Inlet<br />
nozzle<br />
Cotton wool<br />
F. Moisture trap<br />
E. Electrostatic precipitator<br />
Figure 3.2.1.1. Main components of the bench scale fast pyrolysis system<br />
17
A mechanical stirrer, the purpose of which is to ensure that the feedstock remains in a fluid like state, a<br />
condition necessary for the steady entrainment of particles, is attached to the stirring mechanism. A<br />
second, independently controlled gas supply was located at the top of the feeder so that a slight<br />
overpressure of feeder gas could be applied. The overpressure encouraged particles to enter the<br />
entrainment tube.<br />
Feedstock particles, encouraged by the stirring mechanism and by the slight overpressure applied from<br />
the top, enter the entrainment tube via the small hole and become entrained in the stream of feeder gas<br />
and transported to the reactor. A diagram of the feeder is displayed in Figure 3.2.1.1. The feeding rate<br />
may be controlled by adjusting the stirrer speed or the flow rate of the top and bottom carrier gases.<br />
Solid residue collector and quench system<br />
Due to the small particle sizes of the feedstock, most of the partially pyrolysed material that exited the<br />
reactor could not be de-entrained by the cyclone. This material was collected in an apparatus that was<br />
manufactured specifically the purpose. The apparatus was referred to as the ‘solid residue collector’<br />
and comprised a stainless steel vessel with a lid that could be unscrewed. The entrained particles<br />
entered the vessel from the base and travelled up a tube that opened out approximately 5 mm below<br />
the lid. Baffles were built into the underside of the lid to deflect particles downwards and into the main<br />
section of the vessel. The very sudden reduction in speed that occurred when the particles entered the<br />
main area of the vessel resulted in de-entrainment. High on the walls of the vessel were a line of small<br />
holes that permitted the carrier and product gases to exit with minimal disturbance to the deposited<br />
solid residue. A diagram of the solid residue collector is displayed in Figures 3.2.1.1.<br />
The solid residue collector is located within the quench system that was manufactured for the purposes<br />
of the research. The gaseous products which exited the solid residue collector were quenched by<br />
passing through a volume of ice/salt cooled solvent. The quench solvent was methanol and<br />
approximately 150 ml were required for each experiment. The condensable products became<br />
dissolved in the methanol or were condensed into an aerosol which exited the quench system on the<br />
stream of carrier gas. A diagram of the quench system is displayed in Figure 3.2.1.1.<br />
Electrostatic precipitator<br />
An electrostatic precipitator, designed and manufactured by RTI limited, was used to deposit the<br />
aerosol material as it exited the quench system. The precipitator consisted of a glass tube with an inlet<br />
at the base and an outlet at the top. A stainless steel shaft, upon which was mounted the fine tungsten<br />
ionising electrodes, was centrally located and aligned parallel to the tube from the top. A thin stainless<br />
steel sleeve located on the inside edge of the tube comprised the collection electrode. A Brandenberg<br />
corona generator, which provided the charge for the electrodes, was operated at 10 kV and 0.05-<br />
0.10mA. The ionising electrode was negatively charged and the collection electrode, positively<br />
charged. When aerosols were passed through the electrostatic precipitator the ionising electrode<br />
induced a charge that caused the droplets to agglomerate. The larger droplets then deposited on the<br />
collection electrode. A diagram of the electrostatic precipitator is displayed in Figure 3.2.1.1.<br />
Moisture trap<br />
The final component in the product collection train was a moisture trap. This apparatus consisted of a<br />
cylindrical glass tube which connected directly to the outlet of the electrostatic precipitator. Indicating<br />
silica gel absorbent crystals were packed in the tube in order to absorb water vapour in the stream of<br />
carrier gas. Cotton or glass wool was placed on either side of the packed desiccant crystals. If the wool<br />
was stained at the completion of an experiment it was concluded that not all of the condensable<br />
material was collected in the quench system and electrostatic precipitator. A diagram of the moisture<br />
trap is displayed in Figure 3.2.1.1.<br />
18
Configuration of the fast pyrolysis unit<br />
The components of the fast pyrolysis unit were mounted on a metal frame that was fabricated for the<br />
purpose. The unit comprised of two major sections, the pyrolysis apparatus and the product collection<br />
train. The pyrolysis apparatus included the reactor and the furnace. The product collection train<br />
consisted of the cyclone, solid residue collector, quench system, electrostatic precipitator and moisture<br />
trap. The carrier, feeder and product gases that exited the unit were vented to the atmosphere. A<br />
diagram of the assembled components is displayed in Figure 3.2.1.2 and a photograph is displayed in<br />
Figure 3.2.1.3.<br />
Gas<br />
flowmeter<br />
Feeder<br />
Filter<br />
Electrostatic<br />
Precipitator<br />
Quench<br />
system<br />
Reactor<br />
Compressed gases<br />
Figure 3.2.1.2 Diagram of the configuration of the major components of the fast pyrolysis unit.<br />
Figure 3.2.1.3. Photograph of the assembled fast pyrolysis unit.<br />
19
A separate needle valve was employed for each gas in each application. That is, for both air and<br />
nitrogen, a separate needle valve controlled the carrier and feeder gas flows as well as the gas that<br />
provided the over pressure on the feeder. Fine control of the various flow rates of gas was provided by<br />
flow meters. The system was configured to permit blending of the air and nitrogen for the carrier gas.<br />
A schematic of the gas supply system is displayed in Figure 3.2.1.4.<br />
Flow meter<br />
Three way valve<br />
Needle valve<br />
Gas line for Air<br />
Gas line for Nitrogen<br />
Gas line for Air and/or Nitrogen<br />
Regulator<br />
To product collection<br />
systems<br />
Reactor<br />
To Feeder (top inlet)<br />
To Feeder (bottom inlet)<br />
To Cooling gas line<br />
N 2<br />
Air<br />
Figure 3.2.1.4. Schematic of the gas supply configuration for the fast pyrolysis unit.<br />
3.3 Procedure for pyrolysis experiments<br />
The bench scale fast pyrolysis unit was used to generate pyrolysis products under a range of<br />
operational parameters and feedstock types. The operational parameters that were considered included:<br />
• Reactor temperature<br />
• Carrier gas composition<br />
• Fluid bed particle size<br />
• Fluid bed mass<br />
• Feeder gas composition<br />
The primary objective of the pyrolysis experiments was to determine the influence of the main<br />
operational parameters on furfuryl and phenolic compound formation from hardwoods, as opposed to<br />
softwoods, which were investigated in earlier work.<br />
20
3.3.1 Procedure<br />
Cleaning, drying and weighing of materials and equipment<br />
Prior to assembly, components of the unit were cleaned and dried in order to remove contaminants that<br />
may interfere with the mass balances or with the pyrolysis process itself. An electronic balance (tare<br />
1200.00g ± 0.005g) was used to record the mass of each component. The masses measured prior to the<br />
run were referred to as initial masses and those recorded at the completion as final masses.<br />
The disassembled reactor, char pot and solid residue collector were washed with warm water and dried<br />
in an oven at 105 o C. The components were cooled to room temperature and the masses of the char pot<br />
and solid residue collector recorded.<br />
The disassembled quench apparatus and electrostatic precipitator were washed with methanol and<br />
dried in the air. The quench apparatus was not oven dried as the seals were not stable at 105 o C. The<br />
mass of the electrostatic precipitator was recorded.<br />
The moisture trap was placed in an oven for 2 hours at 105 o C, the time required to achieve constant<br />
mass. Immediately prior to assembly of the pyrolysis unit, the moisture trap was removed from the<br />
oven and its weight recorded.<br />
The feeder system was disassembled and emptied. A stream of high-pressure air was used to remove<br />
contaminants.<br />
Reactor assembly<br />
The required mass of sand for the fluidised bed was weighed and transferred to the reactor. A small<br />
amount of high temperature grease was applied to the thread and the top section of the reactor screwed<br />
into place.<br />
The sand masses that were used for the experiments were 150, 200, 250 or 300g.<br />
The assembled reactor was lowered into the furnace, clamped into position, and the reactor<br />
thermocouple and bottom section of the quench apparatus connected. The top of the reactor and the<br />
tube connecting the reactor to the bottom section of the quench apparatus were insulated with rock<br />
wool. The furnace was activated and the temperature set 23 o C above the desired reaction temperature.<br />
It was found that the furnace temperature had to be set 20 o C above the desired operating temperature,<br />
as an allowance for heat loss, and a further 3 o C as allowance for the slight cooling which occurred<br />
when the run was initiated.<br />
Feeder assembly<br />
Prepared feedstock was stored in sealed plastic containers until required. Immediately prior to the<br />
commencement of a run, the required feedstock was transferred from the plastic container to the<br />
disassembled feeder. The feeder was then reassembled and weighed.<br />
The feeder was clamped into position on the frame and the electronic stirrer attached. The gas inlet<br />
hoses were then attached to the feeder and secured with O-rings. The gas/feed hose that connected the<br />
feeder to the reactor was not connected to the reactor at this point.<br />
21
Product collection train assembly<br />
The cleaned electrostatic precipitator was mounted onto the frame and the electrode wires attached.<br />
The corona generator was activated and set to the operating voltage of 10kV. The flanged inlet and<br />
outlet nozzles were lightly greased with vacuum grease.<br />
The moisture trap was connected to the outlet of the electrostatic precipitator and the exhaust tube<br />
connected to the outlet of the moisture trap. The exhaust tube vented the gases outside the building.<br />
When the reactor was close to attaining the desired operating temperature the cooling section of the<br />
quench apparatus was charged with ice/salt and a small amount of water. A cork seal was placed over<br />
the cooling section, and the solid residue collector placed into position in the quench apparatus.<br />
Approximately 150ml of methanol was poured into the quench reservoir. The tube connecting the<br />
reactor to the feeder outlet was next installed and a small flow of gas was passed through the bottom<br />
feeder line. This small flow of gas was to prevent blockage of the feeder inlet line on the reactor as<br />
well as prevent blockage of the small aperture on the entrainment line. The inverted deflector cap<br />
(refer to Figure 3.2.1.1) was positioned inside the quench apparatus (over the solid residue collector)<br />
and was kept in position with weights. The ground glass flange on the bottom section of the quench<br />
apparatus was lightly greased with vacuum grease, prior to the top section being mounted and<br />
connected to the inlet nozzle of the electrostatic precipitator.<br />
Operation of the fast pyrolysis unit<br />
For each trial, or run, the operational and feedstock parameters were set prior to commencement of the<br />
run. When the reactor temperature was approximately 3 o C above that required, the run was initiated.<br />
The bottom feeder gas and carrier gas were adjusted with the appropriate flow meters in order to<br />
achieve the desired flow rates and the desired composition of reaction atmosphere. The stirrer was<br />
activated and set to the optimum speed. The run began when feedstock was introduced into the reactor<br />
and this occurred when a slight over pressure was applied to the feedstock from the top feeder gas line.<br />
A typical run was 10-30 minutes. At the completion of a run the furnace and stirrer were switched off<br />
and the top feeder gas flow rate set to zero. At approximately 5 minutes from termination of the run<br />
the carrier gas and bottom feeder gas flow rates were set to zero and the electrostatic precipitator<br />
deactivated.<br />
The product collection train was disassembled and the masses of the feeder, moisture trap, electrostatic<br />
precipitator and solid residue collector recorded.<br />
A pipette was used to transfer most of the quench fluid/product into a beaker. The quench apparatus<br />
was removed from the reactor and the coolant removed. The quench fluid reservoir was rinsed with<br />
methanol and the washings transferred to the beaker. The material collected in the electrostatic<br />
precipitator was also rinsed with methanol into the beaker. The contents of the beaker were filtered<br />
through a fine, pre-weighed, sintered glass funnel. The filter was then rinsed with a 20ml aliquot of<br />
methanol. A Bucci rotary evaporator was used to remove methanol from the filtrate until the volume<br />
remaining was between 10 and 20ml. The concentrated filtrate was transferred to a 25 ml volumetric<br />
flask and made up to the mark with methanol. The filtrate was stored in a labelled glass vial, away<br />
from light, to await analysis.<br />
Methanol was used to wash material from the tube connecting the quench apparatus to the reactor, into<br />
a pre-weighed beaker. It was observed that this material, and the material collected on the sintered<br />
glass funnel, was predominantly solid residue. For those experiments where the moisture content of<br />
the feedstock was zero, the beaker and funnel were placed in an oven at 105 o C to remove the<br />
methanol. However, where the feedstock was dried to “as received” moisture content, the methanol<br />
was removed by evaporation at room temperature. The distinction was made in order to reduce errors<br />
22
associated with moisture loss or gain. The beaker and funnel were then re-weighed and the masses of<br />
the residual material recorded as a fraction of the total solid residue for the run.<br />
Approximately 2 hours after termination of the run, the reactor was removed from the furnace and<br />
allowed to cool to room temperature. The char pot and reactor contents were removed and weighed.<br />
Both masses contributed to the total solid residue for the run.<br />
3.4 Analysis of liquid pyrolysis product<br />
3.4.1 Identification of compounds<br />
Identification of compounds within the liquid product was achieved by one or more of three<br />
techniques.<br />
GCMS library comparisons<br />
The mass spectrum of each compound in the samples was computer matched with the mass spectra of<br />
compounds from computer libraries. The search engine returned the library spectra that most closely<br />
resembled the sample spectra, along with a set of statistics. The statistics appeared as a value between<br />
1 and 1,000 and directly related to the quality of the matches. The statistics were:<br />
• Purity - checks intensity and presence of library entry peaks in target spectrum<br />
• Fit - checks for presence of library entry peaks in target mass spectrum<br />
• Reverse Fit - checks for presence of target peaks in library entry mass spectrum.<br />
When the Purity, Fit and Reverse Fit values were greater than 900 it was very likely that the sample<br />
compound was the same as that from the computer library. The computer libraries that were used were<br />
the NIST and WILEY.<br />
Due to the statistical nature of the computer library method, absolute certainty could not be achieved<br />
in the identification of compounds by this method alone. However, it was suitable as a means of<br />
characterising compounds into classes and for simplifying the task of compound identification by<br />
more rigorous methods.<br />
Reference standards<br />
Confirmation of the peak assignments generated from the computer library matching was achieved by<br />
reference standards where reference standards were available. Identification by reference standards<br />
was achieved by retention time comparison as well as by comparison of the mass spectra.<br />
Comparison with the literature<br />
Mass spectra and retention time data were compared with data reported in the literature to assist in<br />
compound identification. Elder and Soltes utilised published mass spectra data to facilitate<br />
identification of phenolic compounds obtained from the pyrolysis of pine 103 .<br />
In 1990, Faix and co-workers published results from a study on the identification of compounds from<br />
the pyrolysis of the lignin component of wood 104,105 . The study was conducted on a pyrolysis-GCMS<br />
apparatus and reference standards were used for identification of most of the 82 compounds that were<br />
detected in the liquid product. A DB-1701 (30m x 0.25mm I.D) capillary column was used for<br />
separation of the individual compounds. The published results describe the mass spectrum of each of<br />
the compounds that were detected as well as the corresponding relative retention times.<br />
23
In the current study, a DB-1701 column was also used for separation of the individual compounds. The<br />
order of elution of the compounds was therefore the same as that obtained by Faix et al. The operating<br />
conditions and column length were, however, different from those employed by Faix et al and<br />
therefore the retention and relative retention times were not identical. This is because the column<br />
length employed in the present study was 15m compared to 30m employed by Faix et al. Furthermore,<br />
Faix and co-workers used a Kratos MS 25 instrument whereas a Varian instrument was used in the<br />
current study. The Kratos instrument is a quadrapole type whereas the Varian machine is based on the<br />
ion trap concept. The consequence of this variation is that the mass spectra generated by the two<br />
instruments may vary.<br />
It was expected that many of the compounds listed in the work of Faix et al would also be present in<br />
the pyrolysis products of the current study. Partial confirmation of this expectation was achieved by<br />
use of a number of reference standards as well as by computer library matching. Mathematical models<br />
were generated in order to predict the relative retention times (RRTs) of lignin derived compounds<br />
within the samples from the RRTs published by Faix et al. If an unidentified peak within the<br />
chromatogram of a sample possessed a RRT that matched one of the predicted RRTs generated by the<br />
models then the mass spectrum of the peak was compared to that published in the literature. Positive<br />
identification of a compound was assumed if both the RRT and the mass spectrum matched those<br />
published within the literature. Obst employed a similar technique to Faix and co-workers and<br />
identified a number of compounds associated with pyrolysis of hardwood and softwood lignin as well<br />
as provided mass spectral data for each 106 . Comparison of this data with corresponding data obtained<br />
in the present study was also used to facilitate identification of phenolic compounds.<br />
3.4.2 Quantification of selected compounds<br />
All compound quantification data was derived from GCMS analysis of the liquid products.<br />
Quantification of the major compounds was achieved by comparison with solutions of reference<br />
standards and quantification of less significant compounds was achieved if standards were available.<br />
Peak areas obtained from the gas chromatograms were used to measure compound concentrations.<br />
Four solutions of known concentration were prepared for each compound and were analysed by<br />
GCMS under conditions identical to those in which the samples were analysed.<br />
An internal standard (geranyl acetate) was used to account for variation derived from the instrument<br />
and from the sample injection procedure. The variation was calculated by Equation 3.4.2.1.<br />
Where,<br />
PA a (n) = (α IS /α S ).β(n) 3.4.2.1<br />
PA a (n) = adjusted peak area for compound n,<br />
α IS = peak area of a standard solution of o-cresol (the internal standard) with<br />
a concentration, x. Once measured, this value was constant.<br />
α S = peak area of o-cresol in the sample with a concentration of x.<br />
β(n) = peak area of compound n in a sample.<br />
The value of x was 100 ppm. As the value of x was identical in both standard and sample solutions the<br />
actual value was irrelevant.<br />
For each of the parameters in the expression, the peak areas were derived from the total number of<br />
counts of the corresponding dominant ion. That is, quantification data was derived from the portion of<br />
the peak area attributable to the dominant ion fragment rather than to the total peak area. This method<br />
significantly reduces error associated with background noise.<br />
24
The yields of the quantified compounds were calculated by two methods. In the first method the yields<br />
were calculated as a percentage of the mass reduction when 10g of feedstock were processed. In the<br />
second method the yields were calculated as a percentage of 10g of feedstock. In actuality the total<br />
mass of feedstock processed in each of the experiments varied considerably. The standardisation of all<br />
results based on 10g of feedstock processed permitted direct comparisons between experiments. The<br />
calculation for the standardisation procedure for peak area is described in Equation 3.4.2.2. Note that<br />
the un-standardised peak area is the peak area that was adjusted according to equation 3.4.2.1.<br />
Where,<br />
PA s (n) = (10/M FP ).PA a (n) 3.4.2.2<br />
PA s (n)<br />
PA a (n)<br />
M FP<br />
= standardised peak area.<br />
= un-standardised peak area.<br />
= mass of feedstock processed.<br />
Thus, prior to the calculation of compound concentration, the integration data was corrected for<br />
sampling error, by use of an internal standard, and was standardised.<br />
3.5 Cellulose analysis in residues from low temperature pyrolysis<br />
The fast pyrolysis of lignocellulosic biomass currently being studied involves the sequential<br />
degradation of the hemicelluloses and lignin, leaving the cellulose component largely untouched as a<br />
recoverable residue. Prior to analysis, any extractable material present within the residues had to be<br />
removed.<br />
3.5.1 Preparation of hardwood pyrolytic residues for analysis<br />
Soxhlet extraction was used for the separation of compounds from mixtures by continuous solid-liquid<br />
extraction. Soxhlet extraction involves heating an appropriate solvent to reflux and the distillate<br />
collected in the Soxhlet comes into contact with the solid, effecting the extraction. After the Soxhlet<br />
fills to the level of the upper turn in the siphon arm, the solution empties into the boiling flask. This<br />
process is continued for as long as is necessary for effective extraction of the desired compounds,<br />
which are contained with solvent in the boiling flask.<br />
Hardwood pyrolytic residue (5 g) was weighed into a cellulose extraction thimble and the extractable<br />
compounds (products of pyrolysis absorbed by residue and less volatile terpenes) were removed by<br />
Soxhlet using methanol (80 cm 3 ) as the solvent. When the extraction was complete (10–15 cycles) the<br />
thimble was dried overnight (105ºC) and the washed residue weighed for use in subsequent cellulosic<br />
analyses. The cooled methanol extract was concentrated under vacuum by rotary evaporation at 40ºC<br />
and its components identified by GCMS.<br />
3.5.2 Measurement of cellulose by the Seifert technique<br />
One of the best available methods for determining cellulose in wood involves the hydrolysis of wood<br />
carbohydrates into their constituent sugars, followed by the separation of the sugars by liquid<br />
chromatography 107,108 . This technique yields important information about the composition of wood<br />
polysaccharides.<br />
A simpler, cheaper and more rapid gravimetric alternative involves an acid catalysed digestion with an<br />
organic solvent. The acid catalyses the hydrolysis of the lignin and the hemicelluloses, rendering them<br />
soluble in the organic solvent. The resultant cellulose residue can then be washed, dried and weighed.<br />
The Seifert technique 109 is an acid catalysed solvolysis that has been shown to produce similar results<br />
25
to the chromatographic method (considered the most accurate known technique) 110 . The Seifert<br />
cellulose contains some hemicellulose as a minor component and is more pure than perxoyacetic and<br />
nitric acid cellulose, but significantly darker in colour 110 .<br />
Cellulose residues were obtained from the pyrolytic residues using the technique described by<br />
Seifert 109,110 . Air dried pyrolytic residue (0.5 g oven dried) was added to a mixture of acetylacetone (3<br />
cm 3 ), 1,4-dioxane (1 cm 3 ) and concentrated hydrochloric acid (0.75 cm 3 ) in a 25 cm 3 round bottomed<br />
flask and refluxed for 30 minutes. After cooling, the cellulose residue was filtered under vacuum into<br />
preweighed sintered porous crucibles and washed sequentially with methanol (50 cm 3 ), hot water (150<br />
cm 3 ), methanol (50 cm 3 ) and acetone (50 cm 3 ). After oven drying (105°C) overnight, cellulose was<br />
determined in duplicate as a percentage of starting material.<br />
3.5.3 Preparation of chlorite holocellulose<br />
The isolation of preparations containing substantially the entire polysaccharide portion of the wood<br />
was accomplished by Ritter and Co-workers 111-113 , who delignified wood by alternate chlorination and<br />
extraction with alkaline alcoholic solutions. The product was called holocellulose to indicate that it<br />
included both the cellulose and hemicelluloses originally present in the wood. Ideally, holocellulose is<br />
defined as the extractive free wood minus the lignin, and the sum of holocellulose and lignin should<br />
equal 100%.<br />
Later workers developed procedures for preparation of holocellulose by delignification with acidified<br />
chlorite solutions. Complete delignification cannot be obtained without excessive loss of<br />
polysaccharides, and it is necessary to allow a few per cent of lignin to remain in the preparation. The<br />
yield of holocellulose or of its cellulose and hemicellulose components is not significantly affected by<br />
hydrolysis or oxidation if these reactions are sufficiently extensive to produce materials of very low<br />
molecular weight. However, some depolymerization of the cellulose occurs during delignification by<br />
the chlorite method.<br />
Air-dried pyrolytic residue (0.5 g), distilled water (16 cm 3 ), glacial acetic acid (0.05 cm 3 ) and sodium<br />
chlorite (0.15 g) were weighed into a 25 cm 3 Erlenmeyer flask according to the method of Wise 102,114 .<br />
A small Erlenmeyer flask was inverted in the neck of the reaction flask and the flask placed on an oil<br />
bath (adjusted to produce a reaction temperature of 70-80°C). The flask was heated for 1 hour at the<br />
reaction temperature, with the contents mixed by occasional swirling. Without cooling, glacial acetic<br />
acid (0.05 cm 3 ) was added followed by sodium chlorite (0.15 g). The heating was continued at 70-<br />
80°C for an additional hour. At the end of the second and third hours, the additions of acetic acid and<br />
sodium chlorite were repeated. At the end of the fourth hour of chloriting the flask was cooled to less<br />
than 10°C in an ice bath. The chlorite holocellulose was filtered on a coarse porosity fritted glass<br />
crucible and washed with hot water, washed with acetone and dried by aspiration of air through the<br />
crucible. The chlorite holocellulose was determined in duplicate as a percentage of the initial pyrolytic<br />
residue.<br />
3.5.4 Preparation of holocellulose by hypochlorite bleaching<br />
An alternative to the chloriting technique previously described is the hypochlorite method.<br />
Hypochlorite bleaching solutions oxidise and remove lignin from wood and other lignified material.<br />
An advantage of extraction with sodium sulphite solution is the characteristic red or brown colour<br />
formed with the chlorinated lignin (Mäule Reaction) which indicates the completeness of removal of<br />
lignin.<br />
Pyrolytic residue (0.5 g) was treated with 3% sodium sulphite solution (25 cm 3 ) and the mixture boiled<br />
and filtered 102,115 . The material was transferred to a beaker and made up to 25 cm 3 with water. Lithium<br />
hypochlorite solution (1.25 cm 3 containing 15% available chlorine) was added and the mixture<br />
allowed to stand for 10 minutes. The residue was filtered off and transferred to a beaker with water<br />
26
(12.5 cm 3 ) and 6% sodium sulphite solution (12.5 cm 3 ) and boiled for 20 minutes. The residue was<br />
filtered and washed, and the treatments with hypochlorite and sodium sulphite repeated after which the<br />
material was again suspended in water (12.5 cm 3 ), and hypochlorite solution (1.25 cm 3 containing 3%<br />
available chlorine) and 20% sulphuric acid (0.5 cm 3 ) were added. After standing for 10 minutes, the<br />
mixture was filtered, the residue made up with water (12.5 cm 3 ), and sodium sulphite solution was<br />
added as before. An intense purple coloration developed (Maule reaction). The treatments with acid<br />
hypochlorite and sodium sulphite were continued as long as the colour appeared on addition of the<br />
sodium sulphite solution. Finally the residue, comprising the holocellulose, was washed thoroughly<br />
with hot water and dried overnight at 105°C.<br />
3.5.5 Analysis of the properties of the cellulosic material derived from<br />
hardwood pyrolytic residues (determination of pulp viscosity (degree of<br />
polymerisation))<br />
The solution viscosity of a pulp gives an indication of the average degree of polymerisation of the<br />
cellulose. Such a test therefore gives a relative indication of the degradation (decrease in cellulose<br />
molecular weight) resulting from the pyrolysis, pulping and/or bleaching processes.<br />
Preparation of cupriethylenediamine solution 102,116<br />
Copper sulphate (250 g) was dissolved in 2000 cm 3 of hot distilled water. With vigorous stirring,<br />
ammonia (115 cm 3 ) was slowly added to the boiling solution until the mixture was faintly alkaline.<br />
The precipitate was allowed to settle before washing, by decantation, with 1000 cm 3 portions of<br />
distilled water (four with hot water and two with cold water). Cold water was added until the volume<br />
of the slurry reached 1500 cm 3 . After cooling to below 10°C, cold 20% sodium hydroxide (850 cm 3 )<br />
was added slowly with vigorous stirring. The precipitated cupric hydroxide was washed with distilled<br />
water, by decantation, until the washings were colourless to phenolphthalein indicator and gave no<br />
precipitation of sulphate upon addition of barium chloride solution.<br />
The cupric hydroxide slurries were transferred to a 1000 cm 3 reagent bottle using distilled water to<br />
make a total volume of 500 cm 3 . The bottle was equipped with a rubber stopper containing two holes,<br />
one fitted with a separatory funnel and the other with a glass tube extending nearly to the bottom of the<br />
bottle. With the reagent bottle immersed in an ice bath, a stream of nitrogen was passed through the<br />
glass tube for three hours and while the flow was continued, 70 % ethylenediamine (160 cm 3 ) was<br />
slowly added through the separatory funnel. Nitrogen was passed through the solution for a further<br />
hour and the mixture then let stand for 12 to 16 hours under a nitrogen atmosphere. The solution was<br />
filtered through a fritted-glass Büchner funnel and the resultant supernatant solution stored under<br />
nitrogen.<br />
Standardisation of cupriethylenediamine solution 102,116<br />
The cupric ion and ethylenediamine concentrations in the cupriethylenediamine solution were then<br />
calculated. A 25 cm 3 aliquot of the stock solution was diluted volumetrically to 250 cm 3 . Distilled<br />
water (100 cm 3 ), 2M sulphuric acid (35 cm 3 ), 10% potassium iodide (35 cm 3 ), 10% ammonium<br />
thiocyanate (25 cm 3 ) and starch indicator (5 cm 3 ) were added to an aliquot (25 cm 3 ) of the diluted<br />
solution. This solution was titrated with 0.1M sodium thiosulphate, previously standardised with<br />
potassium iodate, until the disappearance of the blue colour.<br />
Molarity of cupric ion = (titrant added (cm 3 ) x N of sodium thiosulpahte)/2.5<br />
Distilled water (100 cm 3 ) was added to a 25 cm 3 aliquot of the diluted solution and titrated to pH 3.5<br />
with standard 0.25M sulphuric acid.<br />
Molarity of ethylenediamine = (titrant added (cm 3 ) x N of acid x 0.333)/2.5<br />
27
The ethylenediamine to cupric ion ratio was 2.00 ± 0.04 and the cupric ion concentration 1.00 M ±<br />
0.02. If the ratio exceeded 2.04:1, fresh cupric hydroxide was added and the agitation and<br />
standardisation was repeated. If the ratio fell below 1.96:1, started with fresh cupric hydroxide and<br />
increased the volume of ethylenediamine accordingly.<br />
Determination of viscometry 102,116<br />
Air dried residue (equivalent to 0.2500g of moisture free pulp) was weighed into a dissolving bottle.<br />
Distilled water (25 cm 3 ) was pipetted into the bottle, which was then capped and shaken to wet out and<br />
disperse the sample. Air was removed from the container with a stream of nitrogen, and without<br />
cessation of the gas flow, cupriethylenediamine solution (25 cm 3 ) was pipetted into the vessel. The<br />
bottle was closed and shaken vigorously until the cellulose was completely dissolved (30 minutes).<br />
This preparation procedure gave a final solution concentration of 0.5% residue in 0.5 M<br />
cupriethylenediamine.<br />
A portion (7 cm 3 ) of the solution was transferred by pipette to a viscometer previously flushed with<br />
nitrogen and positioned within 1º of vertical in a water bath (25.0 ± 0.1ºC). After 5 minutes the<br />
solution was drawn into the bulb of the viscometer by applying pressure with nitrogen until the level<br />
was above the top mark of the bulb, and the solution allowed to drain down and wet the inner surfaces<br />
of the instrument. The efflux time was determined by drawing the solution above the upper calibration<br />
mark and measuring the time for the meniscus to pass between the two calibration marks (measured to<br />
0.1 sec.). The measurement was repeated twice and agreement was within ± 0.3%.<br />
The cupriethylenediamine solutions were drained from the viscometer immediately after the<br />
determination was complete. The tube was rinsed well with water to remove all traces of solution. The<br />
viscometer was soaked overnight in a sulphuric acid (2M) cleaning solution to remove all traces of<br />
contaminants. The viscometer was drained and rinsed with distilled water before drying in an oven<br />
(105 ± 2ºC).<br />
The degree of polymerisation of the hardwood holocellulose samples (as cupriethylenediamine (CED)<br />
viscosity of 0.5% pulp solutions by the capillary viscometer method) were calculated according to the<br />
following equations 116 :<br />
Kinematic viscosity (centistokes, cSt) = Efflux time (seconds) x Viscometer constant (cSt/sec)<br />
Viscosity (centipoise, cP) = Kinematic viscosity (centistokes, cSt) x Density of pulp solution (g/cm 3 ,<br />
1.052)<br />
3.6 Experimental design<br />
A series of experiments were conducted to investigate the influence of selected operational parameters<br />
on the derivation of furfuryl and phenolic compounds from the fast pyrolysis of Mountain ash. The<br />
experiments were divided into two sets. In the first set, Stage 1 type conditions were investigated and<br />
the emphasis was on furfuryl optimisation. In the second set, Stage 2 type conditions were investigated<br />
and the emphasis was on phenols optimisation. Each experiment within each set involved the<br />
investigation of one parameter while all other parameters remained constant. Thus, for each<br />
experiment, variation in the pyrolysis process may be attributed to variation of the particular<br />
parameter. The parameter values for each experiment are displayed in Tables 3.6.1 and 3.6.2 for the<br />
first and second set respectively.<br />
The bench scale unit employed in the study was too small, and the residence times too short, to<br />
achieve substantial degradation with a single pass. The purpose of the pyrolysis experiments was to<br />
elucidate and quantify the influence of each of the important, manipulatable, parameters on the process<br />
with respect to furfuryls and phenols production as well as hemicellulose and lignin removal.<br />
28
Table 3.6.1. Experimental design for stage 1 pyrolysis experiments.<br />
Temp.<br />
( o C)<br />
Feed Size<br />
(μ)<br />
Feed<br />
Type<br />
Sand<br />
Size<br />
(μ)<br />
Sand<br />
Mass<br />
(g)<br />
Carrier<br />
Gas F.R<br />
Carrier Gas<br />
(L/min)<br />
(L/min) Air/O 2 N 2<br />
Experiment 1.1: Low Temperature Pyrolysis for Furfuryls Production-Stage 1<br />
260 (1.1)<br />
250 (1.2)<br />
260 (1.3)<br />
250 (1.4)<br />
240 (1.5)<br />
150-210<br />
150-210<br />
150-210<br />
150-210<br />
150-210<br />
Air Dried<br />
Air Dried<br />
Air Dried<br />
Oven Dried<br />
Air Dried<br />
150-210<br />
150-250<br />
210-250<br />
150-250<br />
150-250<br />
150<br />
150<br />
150<br />
150<br />
150<br />
8<br />
8<br />
8<br />
8<br />
8<br />
8/0<br />
8/0<br />
8/0<br />
6.5/1.5<br />
5/3<br />
Experiment 1.2: Effect of Reprocessing on Furfuryl Production<br />
250<br />
250<br />
250<br />
150-210<br />
150-210<br />
150-210<br />
Oven dry<br />
Air dry<br />
Air dry<br />
150-250<br />
150-250<br />
150-250<br />
150<br />
150<br />
150<br />
Experiment 1.3: Effect of Reaction Temperature and Furfuryls Production<br />
275<br />
280<br />
285<br />
285<br />
150-210<br />
150-210<br />
150-210<br />
150-210<br />
Residue 1.3<br />
Residue 1.3<br />
Residue 1.3<br />
Residue 1.3<br />
150-250<br />
150-250<br />
150-250<br />
150-250<br />
150<br />
150<br />
150<br />
150<br />
7<br />
7<br />
7<br />
7<br />
Experiment 1.4A: Effect of Fluid Bed Mass on Furfuryls Production<br />
275<br />
275<br />
275<br />
150-210<br />
150-210<br />
150-210<br />
Residue 1.3<br />
Residue 1.3<br />
Residue 1.3<br />
150-250<br />
150-250<br />
150-250<br />
300<br />
300<br />
150<br />
7<br />
7<br />
7<br />
Experiment 1.4B: Effect of Fluid Bed Mass on Furfuryls Production<br />
270<br />
270<br />
270<br />
270<br />
150-210<br />
150-210<br />
150-210<br />
150-210<br />
Residue 1.5<br />
Residue 1.5<br />
Residue 1.5<br />
Residue 1.5<br />
250-310<br />
250-310<br />
250-310<br />
250-310<br />
150<br />
200<br />
250<br />
250<br />
8<br />
8<br />
8<br />
8<br />
Experiment 1.5: Effect of Fluid Bed Particle Size on Furfuryls Production<br />
7<br />
7<br />
7<br />
5/2<br />
5/5<br />
5/2<br />
7/0<br />
7/0<br />
7/0<br />
7/0<br />
7/0<br />
7/0<br />
7/0<br />
6.5/1.5<br />
6.5/1.5<br />
6.5/1.5<br />
6.5/1.5<br />
0<br />
0<br />
0<br />
0<br />
0<br />
0<br />
0<br />
0<br />
0<br />
0<br />
0<br />
0<br />
0<br />
0<br />
0<br />
0<br />
0<br />
0<br />
0<br />
270<br />
270<br />
270<br />
150-210<br />
150-210<br />
150-210<br />
Residue 1.5<br />
Residue 1.5<br />
Residue 1.5<br />
150-250<br />
250-310<br />
250-310<br />
150<br />
150<br />
150<br />
Experiment 1.6: Effect of Carrier Gas Composition on Furfuryls Production<br />
275<br />
275<br />
275<br />
275<br />
275<br />
150-210<br />
150-210<br />
150-210<br />
150-210<br />
150-210<br />
Residue 1.3<br />
Residue 1.3<br />
Residue 1.3<br />
Residue 1.3<br />
Residue 1.3<br />
150-250<br />
150-250<br />
150-250<br />
150-250<br />
150-250<br />
150<br />
150<br />
150<br />
150<br />
150<br />
7<br />
7<br />
7<br />
7<br />
7<br />
8<br />
8<br />
8<br />
6.5/1.5<br />
6.5/1.5<br />
6.5/1.5<br />
5/2<br />
7/0<br />
5/0<br />
0/0<br />
0/0<br />
0<br />
0<br />
0<br />
0<br />
0<br />
2<br />
7<br />
7<br />
29
Table 3.6.2. Experimental design for stage 2 pyrolysis experiments.<br />
Temp.<br />
( o C)<br />
Feed Size<br />
(μm)<br />
Feed<br />
Type<br />
Sand<br />
Size<br />
(μm)<br />
Sand<br />
Mass<br />
(g)<br />
Carrier<br />
Gas F.R<br />
Carrier Gas<br />
(L/min)<br />
(L/min) Air/O 2 N 2<br />
Experiment 2.1: Effect of Carrier Gas Composition on Phenols Production<br />
290<br />
290<br />
290<br />
290<br />
290<br />
150-210<br />
150-210<br />
150-210<br />
150-210<br />
150-210<br />
Residue 1.1<br />
Residue 1.1<br />
Residue 1.1<br />
Residue 1.1<br />
Residue 1.1<br />
150-210<br />
150-210<br />
150-210<br />
150-210<br />
150-210<br />
150<br />
150<br />
150<br />
150<br />
150<br />
8<br />
8<br />
8<br />
8<br />
8<br />
Experiment 2.2A: Effect of Temperature on Phenols Production<br />
290<br />
290<br />
295<br />
300<br />
300<br />
305<br />
150-210<br />
150-210<br />
150-210<br />
150-210<br />
150-210<br />
150-210<br />
Residue 1.1<br />
Residue 1.1<br />
Residue 1.1<br />
Residue 1.1<br />
Residue 1.1<br />
Residue 1.1<br />
150-210<br />
150-210<br />
150-210<br />
150-210<br />
150-210<br />
150-210<br />
150<br />
150<br />
150<br />
150<br />
150<br />
150<br />
8<br />
8<br />
8<br />
8<br />
8<br />
8<br />
8/0<br />
8/0<br />
4/0<br />
4/0<br />
0/0<br />
8/0<br />
8/0<br />
8/0<br />
8/0<br />
8/0<br />
8/0<br />
0<br />
0<br />
4<br />
4<br />
8<br />
0<br />
0<br />
0<br />
0<br />
0<br />
0<br />
Experiment 2.2B: Effect of Temperature on Phenols and Furfuryls Production<br />
290<br />
290<br />
295<br />
300<br />
305<br />
305<br />
315<br />
315<br />
325<br />
150-210<br />
150-210<br />
150-210<br />
150-210<br />
150-210<br />
150-210<br />
150-210<br />
150-210<br />
150-210<br />
Residue 1.2<br />
Residue 1.2<br />
Residue 1.2<br />
Residue 1.2<br />
Residue 1.2<br />
Residue 1.2<br />
Residue 1.2<br />
Residue 1.2<br />
Residue 1.2<br />
150-210<br />
150-210<br />
150-210<br />
150-210<br />
150-210<br />
150-210<br />
150-210<br />
150-210<br />
150-210<br />
150<br />
150<br />
150<br />
150<br />
150<br />
150<br />
150<br />
150<br />
150<br />
9<br />
9<br />
9<br />
9<br />
9<br />
9<br />
9<br />
9<br />
9<br />
2/0<br />
2/0<br />
2/0<br />
2/0<br />
2/0<br />
2/0<br />
2/0<br />
2/0<br />
2/0<br />
7<br />
7<br />
7<br />
7<br />
7<br />
7<br />
7<br />
7<br />
7<br />
3.7 Bench scale evaluation of essential oil recovery by steam<br />
distillation<br />
Two sets of experiments were performed in which various product recovery techniques were<br />
investigated in order to assess their relative efficiency in cineole recovery.<br />
3.7.1 Leaf collection and preparation<br />
Leaf samples were collected from a private property in Creswick. All leaves were taken from 1 tree<br />
and from one area of the tree. The tree was a Blue gum. This was to minimise variation in leaf oil<br />
composition between distillations, although some variation is to be expected. The objective of this<br />
study was to evaluate the efficiency of product collection and steam distillation techniques rather than<br />
on maximisation of specific leaf oil yields. Thus, based on the objectives of the research, the actual<br />
species of Eucalypt was irrelevant. That is, the selected species needed to merely be morphologically<br />
representative, or typical, of the agroforestry resource because absolute oil yields were not of interest<br />
and nor was variation within a particular species. All that mattered was that the variation of oil within<br />
the sample be reasonably uniform so that variations in yield may be attributed to recovery technique.<br />
The uniformity of the sample was maximised by the method of sample collection.<br />
For each recovery technique that was evaluated, four trials were conducted. For each trial, between<br />
700-1,000g of fresh leaves were prepared. This involved removing any branch material from the<br />
leaves. A small sub-sample (20-35g) was collected, weighed and transferred to a plastic bottle after<br />
cutting in half (to accelerate oil release). Approximately 100ml of ethanol was then added and the<br />
30
ottle sealed. The ethanol quantitatively extracts the Eucalyptus oil from the leaves and thereby the<br />
total amount of oil in the samples can be ascertained. The quantity of oil recovered by the various<br />
techniques investigated could then be compared with the total oil present in order to assess the<br />
efficiency of each. The balance of the leaves was weighed and the steam distillation performed.<br />
Experiment 1: optimisation of product collection technique from conventional<br />
distillation<br />
The objective of Experiment 1 was to evaluate the influence of certain modifications on essential oil<br />
recovery when conventional distillation is employed. The conventional distillation process involves<br />
combining the leaves with water in an appropriate vessel or heating the leaves with steam. The vessel<br />
is then heated externally for the duration of the distillation. As the distillation proceeds, water and<br />
extracted Eucalyptus oil evaporate and are collected using a simple water-cooled condenser. As the oil<br />
is not miscible with the water, it may be easily separated, and the water discarded. The inefficiencies<br />
of this process, with respect to oil recovery, relate to the fact that the oil is partially soluble in the<br />
water and therefore a proportion is lost when the water is discarded. Extractions were performed using<br />
this conventional simple distillation process in order to evaluate the efficiency of recovery for this<br />
technique, which was then used as the control upon which the modified techniques were compared. A<br />
diagram of the type of simple distillation apparatus that was used for this study is displayed in Figure<br />
3.7.1.1.<br />
Figure 3.7.1.1. Type of apparatus used for the extraction of Eucalyptus oil by simple conventional<br />
distillation.<br />
Modification 1: recovery of Eucalyptus oil using a Dean-Stark apparatus<br />
For these distillations, conventional distillation was employed as per the control. However, oil<br />
recovery was achieved by use of the Dean-Stark apparatus as opposed to the simple condenser used in<br />
the control. A diagram of the Dean-Stark apparatus is displayed in Figure 3.7.1.2.<br />
A<br />
B<br />
Figure 3.7.1.2. Diagram of the various oil recovery apparatus that were employed. A. Dean-Start<br />
apparatus B. Likens-Nickerson apparatus<br />
31
Modification 2: recovery of Eucalyptus oil in pentane<br />
For these distillations, conventional distillation was employed as per the control. However, oil<br />
recovery was achieved by passing the condensate through pentane followed by distillation. The<br />
pentane was contained in a separating funnel at the base of the condenser such that condensed<br />
water/oil would fall into the funnel. The water, being denser and immiscible with pentane, collected at<br />
the base of the separating funnel. The Eucalyptus oil however is highly soluble in nonpolar solvents<br />
and was therefore collected in the pentane. It was separated from the pentane by simple distillation.<br />
Modification 3: recovery of Eucalyptus oil using a Likens-Nickerson apparatus<br />
For these distillations, conventional distillation was employed as per the control. However, oil<br />
recovery was achieved by use of the Likens-Nickerson apparatus as opposed to the simple condenser<br />
used in the control. A diagram of the Likens-Nickerson apparatus is displayed in Figure 3.7.1.2. This<br />
apparatus permits co-condensation of the distillate with a suitable solvent, thereby achieving an<br />
extremely efficient product recovery. The solvent that was employed was pentane because of its low<br />
boiling point and subsequent ease of removal from the condensed Eucalyptus oils.<br />
Experiment 2: optimisation of bench scale steam distillation process<br />
Experiment 2 involved the evaluation of cohobation and collection of the condensate in pentane. It was<br />
hypothesised that recycling of the condensed steam would improve the recovery of oil because losses<br />
of oil from partial solublisation in the water would be minimised. It was expected that an even higher<br />
recovery of oil could be obtained when the product was also collected in pentane. This is because of<br />
the improved efficiency in separation of the oil from the water that was used.<br />
The product collection system that was employed was modification 2 of Experiment 1. For the trials in<br />
which cohobation was employed, the condensed steam was periodically returned to the boiler via an<br />
interlock.<br />
3.7.2 Product analysis<br />
The oil samples and ethanolic extractions were refrigerated until they could be analysed. Analysis was<br />
performed by gas chromatography using a flame ionisation detector. The instrument was a Varian<br />
Saturn 3800 gas chromatograph equipped with a 30 m DB-5 capillary column (0.25 mm I.D). Xylene<br />
was used as the internal standard.<br />
32
Chapter 4: Analysis of pyrolysis products<br />
The raw feed on which the trials were performed was analysed according to the methodology<br />
described in Chapter 3.5. The cellulose content was 40.5% and the Holocellulose was 77.8%. The<br />
hemicellulose content was therefore 37.3%. The lignin content, by difference, was approximately<br />
22.2%. The difference between cellulose and holocellulose does not accurately indicate hemicellulose<br />
content because some cellulose is inevitably present. However, the difference does provide an upper<br />
limit for the hemicellulose content.<br />
A total of 121 compounds were detected, of which 73 were identified or characterised. Thirteen of<br />
these were either extractives or of unknown origin. Generally, if compound identification was not<br />
achieved it was because of its poor mass spectra, a result of its extreme low concentration.<br />
4.1. Lignin derived compounds<br />
4.1.1 Identification by computer library matching<br />
Table 4.1.1.1 lists the compounds associated with lignin pyrolysis that were identified in the samples<br />
by computer library matching, along with the corresponding matching statistics.<br />
Table 4.1.1.1. Computer library matching data for compounds derived from the pyrolysis of lignin.<br />
Compound Name Purity For Fit Rev Fit<br />
Guaiacol<br />
Phenol<br />
4-Ethyl-2-methoxyphenol<br />
4-Vinylguaiacol<br />
Eugenol<br />
Syringol<br />
Isoeugenol<br />
Vanillin<br />
4-Hydroxy-3-methoxybenzoic acid<br />
Homovanillin<br />
Acetguaiacone<br />
2-Methoxy-1,4-benzenediol<br />
Guaiacyl acetone<br />
4-Allylsyringol<br />
2,5-Dimethoxybenzeneacetic acid<br />
3-Hydroxy-1-(4-hydroxy-3-methoxyphenyl)-1-propanone<br />
4-Propenylsyringol (trans)<br />
4-(4-Hydroxy-3-methoxyphenyl)-3-buten-2-one<br />
3-Hydroxy-4-methoxycinnamic acid<br />
Isomer of 3-Hydroxy-4-methoxycinnamic acid<br />
Syringaldehyde<br />
3,4,5-Trimethoxyphenol<br />
Acetosyringone<br />
Coniferaldehyde<br />
Benzeneacetic Acid, alpha-Phenyl-,Methyl Ester<br />
916<br />
929<br />
782<br />
823<br />
675<br />
895<br />
881<br />
950<br />
737<br />
859<br />
800<br />
823<br />
639<br />
714<br />
410<br />
556<br />
713<br />
544<br />
677<br />
840<br />
928<br />
813<br />
865<br />
714<br />
464<br />
955<br />
940<br />
843<br />
972<br />
833<br />
951<br />
962<br />
955<br />
822<br />
943<br />
920<br />
907<br />
802<br />
865<br />
708<br />
684<br />
923<br />
739<br />
838<br />
891<br />
986<br />
949<br />
932<br />
852<br />
742<br />
946<br />
966<br />
819<br />
902<br />
775<br />
931<br />
905<br />
966<br />
815<br />
883<br />
830<br />
861<br />
735<br />
768<br />
484<br />
706<br />
801<br />
584<br />
750<br />
909<br />
934<br />
820<br />
906<br />
801<br />
598<br />
Of the 36 phenolic compounds identified or characterised in the pyrolysis products, computer library<br />
matching of the GCMS data was used to identify 25 and all have been reported in the literature in<br />
association with lignin pyrolysis or are isomers of compounds known to be associated with lignin<br />
pyrolysis 1,4, 104,105 .<br />
33
4.1.2 Identification by comparison with reference standards<br />
Reference standards were used, when available, to confirm the computer library identification of the<br />
compounds derived from the pyrolysis of the lignin component of wood. The compounds in which<br />
reference standards were used to assist in identification were:<br />
• Guaiacol<br />
• Phenol<br />
• Eugenol<br />
• Isoeugenol<br />
• Vanillin<br />
• Syringol<br />
• Syringaldehyde<br />
Comparison of the retention time and mass spectrum of each standard was made with the<br />
corresponding sample compound. Confirmation was achieved when both parameters were identical or<br />
close to identical.<br />
4.1.3 Identification by comparison with literature retention times<br />
The procedure for this identification technique is described in Section 3.4.1. The relative retention<br />
times (RRT) of the compounds for which standards were available, or for which a very high computer<br />
library matching was obtained, were plotted against the corresponding relative retention times from the<br />
work of Faix and co-workers 104,105 , in order to determine what kind of relationship, or relationships,<br />
would adequately describe the data. These relationships were then modelled and the models were used<br />
to generate expected RRTs applicable to the present study based on the RRTs reported in the literature.<br />
If a peak, associated with an unidentified compound, was present at the predicted retention time, and if<br />
the respective mass spectra matched, then the peak assignment provided in the literature was also<br />
assigned to this compound. The lignin derived compounds identified by this technique are listed in<br />
Table 4.1.3.1.<br />
Eleven lignin-derived compounds present in the samples were identified by this technique but could<br />
not identified by computer library matching. A further 19 compounds were identified that were also<br />
identified by computer library matching.<br />
Thus, for the compounds listed in Table 4.1.3.1, positive identification was assumed. This assumption<br />
was based on the close similarity between the expected RRT and the actual RRT, as well as the<br />
similarity between the sample mass spectra and the mass spectra presented in the literature. This<br />
identification technique is also discussed elsewhere in detail 117 .<br />
34
Table 4.1.3.1. Lignin derived compounds identified by use of RRT data provided in the literature.<br />
Compound Name<br />
Guaiacol<br />
Phenol<br />
3-Methyl-2-aethoxyphenol<br />
4-Ethyl-2-methoxyphenol<br />
4-Vinylguaiacol<br />
Eugenol<br />
Syringol<br />
Isoeugenol<br />
Vanillin<br />
4-Hydroxy-3-methoxybenzoic acid<br />
3,4-Dimethoxybenzene-1,2-diol<br />
Homovanillin<br />
Acetguaiacone<br />
Guaiacyl acetone<br />
4-Vinylsyringol<br />
4-Allylsyringol<br />
Alpha-oxy-propioguaiacone<br />
4-Propenylsyringol (trans)<br />
Syringaldehyde<br />
3,4,5-Trimethoxyphenol<br />
Homosyringaldehyde<br />
Acetosyringone<br />
Coniferaldehyde<br />
Syringyl acetone<br />
Unknown (syringyl)<br />
Benzeneacetic acid, alpha-phenyl-,methyl ester<br />
Propiosyringone<br />
Alpha-oxy-propiosyringone<br />
4-(oxy-Allyl)-syringol<br />
Sinapaldehyde<br />
4.1.4 Summary of compounds identified in the samples from the pyrolysis of<br />
lignin<br />
Thirty six compounds were identified in the samples from the pyrolysis of the lignin component of. Of<br />
the 36 compounds, 7 were identified by all three of the identification techniques and a further 19 were<br />
identified by two techniques. The identified compounds, as well as the methods of identification, are<br />
summarised in Table 4.1.4.1.<br />
35
Table 4.1.4.1. Summary of lignin derived compounds identified in the samples. (Meth 1=computer<br />
matching, Meth 2 = reference standard, Meth 3 = RRT matching). 1 Compounds characterised by Faix and<br />
co-workers but not identified 104,105 .<br />
Compound Name<br />
Meth<br />
1<br />
Meth<br />
2<br />
Meth<br />
3<br />
Guaiacol<br />
Phenol<br />
3-methyl-2-methoxyphenol<br />
4-Ethyl-2-methoxyphenol<br />
4-Vinylguaiacol<br />
Eugenol<br />
Syringol<br />
Isoeugenol<br />
Vanillin<br />
4-Hydroxy-3-methoxybenzoic acid<br />
3,4-Dimethoxybenzene-1,2-diol<br />
Homovanillin<br />
Acetguaiacone<br />
2-Methoxy-1,4-benzenediol<br />
Guaiacyl acetone<br />
4-Vinylsyringol<br />
4-Allylsyringol<br />
2,5-Dimethoxybenzeneacetic acid<br />
3-Hydroxy-1-(4-hydroxy-3-methoxyphenyl)-1-Propanone<br />
Alpha-oxy-propioguaiacone<br />
4-Propenylsyringol (trans)<br />
4-(4-Hydroxy-3-methoxyphenyl)-3-buten-2-one<br />
3-Hydroxy-4-methoxycinnamic acid<br />
Isomer 1 of 3-Hydroxy-4-methoxycinnamic acid<br />
Syringaldehyde<br />
3,4,5-Trimethoxyphenol<br />
Homosyringaldehyde<br />
Acetosyringone<br />
Coniferaldehyde<br />
Syringyl acetone<br />
Unknown 1 (syringyl)<br />
Benzeneacetic acid, alpha-phenyl-,methyl ester<br />
Propiosyringone<br />
Alpha-oxy-propiosyringone<br />
4-(oxy-Allyl)-syringol<br />
Sinapaldehyde<br />
Yes<br />
Yes<br />
No<br />
Yes<br />
Yes<br />
Yes<br />
Yes<br />
Yes<br />
Yes<br />
Yes<br />
No<br />
Yes<br />
Yes<br />
Yes<br />
Yes<br />
No<br />
Yes<br />
Yes<br />
Yes<br />
No<br />
Yes<br />
Yes<br />
Yes<br />
Yes<br />
Yes<br />
Yes<br />
No<br />
Yes<br />
Yes<br />
No<br />
No<br />
Yes<br />
No<br />
No<br />
No<br />
No<br />
Yes<br />
Yes<br />
No<br />
No<br />
No<br />
Yes<br />
Yes<br />
Yes<br />
Yes<br />
No<br />
No<br />
No<br />
No<br />
No<br />
No<br />
No<br />
No<br />
No<br />
No<br />
No<br />
No<br />
No<br />
No<br />
No<br />
Yes<br />
No<br />
No<br />
No<br />
No<br />
No<br />
No<br />
No<br />
No<br />
No<br />
No<br />
No<br />
Yes<br />
Yes<br />
Yes<br />
Yes<br />
Yes<br />
Yes<br />
Yes<br />
Yes<br />
Yes<br />
Yes<br />
Yes<br />
Yes<br />
Yes<br />
No<br />
Yes<br />
Yes<br />
Yes<br />
No<br />
No<br />
Yes<br />
Yes<br />
No<br />
No<br />
No<br />
Yes<br />
Yes<br />
Yes<br />
Yes<br />
Yes<br />
Yes<br />
Yes<br />
Yes<br />
Yes<br />
Yes<br />
Yes<br />
Yes<br />
4.2 Cellulose and hemicellulose derived compounds<br />
4.2.1 Identification by computer library matching<br />
Computer library matching was used to identify or characterise 16 compounds associated with<br />
pyrolysis of the cellulose and hemicellulose (polysaccharide) component of wood. All of these<br />
compounds have been reported in the literature, or are structurally related to compounds reported in<br />
the literature, as being associated with cellulose and hemicellulose pyrolysis 1,4,104,105,118 . The identified<br />
compounds and the corresponding computer library matching statistics are displayed in Table 4.2.1.1.<br />
36
Table 4.2.1.1. Computer library matching data for compounds derived from the pyrolysis of wood derived<br />
polysaccharides.<br />
Compound Name Purity Forward<br />
Fit<br />
2,5-Dimethoxytetrahydrofuran<br />
851 861<br />
3-Furfuraldehyde<br />
832 854<br />
2-Furfuraldehyde<br />
937 960<br />
2-Propylfural<br />
721 900<br />
Furfuryl alcohol<br />
716 721<br />
Beta-methoxyurfuryl alcohol<br />
852 901<br />
4-cyclopentene-1,3-dione<br />
753 826<br />
2-Methyl-2-pentyl-oxirane<br />
613 613<br />
3-Furancarboxylic acid, methyl ester<br />
865 918<br />
5-methyl-2-furaldehyde<br />
965 970<br />
Furfural diethyl acetal<br />
836 841<br />
2-Furoic acid methyl ester<br />
621 829<br />
1,4:3,6-Dianhydroglucopyranose<br />
682 857<br />
5-Hydroxymethyl-2-furaldehyde<br />
857 864<br />
3-Hydroxy-2(5H)-furanone<br />
844 949<br />
Levoglucosan<br />
802 884<br />
Reverse<br />
Fit<br />
936<br />
878<br />
954<br />
742<br />
862<br />
877<br />
832<br />
739<br />
878<br />
977<br />
954<br />
707<br />
773<br />
915<br />
871<br />
854<br />
4.2.2 Identification by comparison with reference standards<br />
Reference standards were used, when available, to confirm the computer library identification of the<br />
compounds derived from the pyrolysis of the carbohydrate component of wood. The compounds in<br />
which reference standards were used to assist in identification were furfural and furfuryl alcohol.<br />
4.2.3 Identification by comparison with literature retention times<br />
A further 9 polysaccharide derived compounds were identified, or characterised, in the samples from<br />
information obtained from the literature and are listed in Table 4.2.3.1<br />
Table 4.2.3.1. Polysaccharide derived compounds identified, or characterised, by comparison with RRT<br />
data provided in the literature. 1 Compounds characterised by Faix and co-workers but not identified 78 . The<br />
number corresponds to the compound number as reported by Faix et al.<br />
Compound Name<br />
3-Furfuraldehyde<br />
2-Furfuraldehyde<br />
2-Propylfural<br />
Furfuryl alcohol<br />
5-methyl-2-furaldehyde<br />
2,3-Dihydroxy-1-ene-4-one<br />
2-Hydroxy-1-methyl-1-cyclopentene-3-one<br />
1,4:3,6-Dianhydromannofuranose<br />
Furan Derivative (Unknown compound 82) 1<br />
1,4:3,6-Dianhydroglucopyranose<br />
5-Hydroxymethyl-2-furaldehyde<br />
Gamma-lactone derivative (Unknown compound 87)<br />
Unknown compound 90 in paper<br />
Anhydro-pento-furanose (Unknown compound 92)<br />
3-Hydroxy-2(5H)-furanone<br />
Unknown (Unknown compound 94)<br />
Levoglucosan<br />
37
The retention times of the compounds for which standards were available, or for which a very high<br />
computer library matching was obtained, were plotted against the corresponding relative retention<br />
times from the work of Faix and co-workers 78 , in order to determine what kind of relationship, or<br />
relationships, would adequately describe the data (refer to corresponding section on phenols<br />
identification and to Butt 117 ).<br />
4.2.4 Summary of compounds identified in the samples from the pyrolysis of<br />
the polysaccharide component<br />
Twenty-four compounds were identified, or characterised, in the samples from the pyrolysis of the<br />
polysaccharide component of hardwood. Of the 24 compounds, only 2 were identified by all three of<br />
the techniques employed. A further 9 were identified by 2 of the techniques and 15 were identified by<br />
only one of the techniques. The identified compounds, as well as the methods of identification, are<br />
summarised in Table 4.2.4.1.<br />
Table 4.2.4.1. Summary of polysaccharide derived compounds identified in the samples. Method 1:<br />
Computer library matching, Method 2: Reference standard comparison, Method 3: Comparison with<br />
literature RRT. 1 Compounds characterised by Faix and co-workers but not identified. The number corresponds<br />
to the compound number as reported by Faix et al 78 .<br />
Compound Name Method 1 Method 2 Method 3<br />
2,5-Dimethoxytetrahydrofuran<br />
3-Furfuraldehyde<br />
2-Furfuraldehyde<br />
2-Propylfural<br />
Furfuryl alcohol<br />
Beta-methoxyfurfuryl alcohol<br />
4-cyclopentene-1,3-dione<br />
2-Methyl-2-pentyl-oxirane<br />
3-Furancarboxylic acid, methyl ester<br />
5-Methyl-2-furaldehyde<br />
2,3-Dihydroxy-1-ene-4-one<br />
Furfural diethyl acetal<br />
2-Hydroxy-1-methyl-1-cyclopentene-3-one<br />
2-Furoic acid methyl ester<br />
1,4:3,6-Dianhydromannofuranose<br />
Furan derivative (Compound 82)<br />
1,4:3,6-Dianhydroglucopyranose<br />
5-Hydroxymethyl-2-furaldehyde<br />
Gamma-lactone derivative (Unknown compound 87)<br />
Unknown compound 90<br />
Anhydro-pento-furanose (Unknown compound 92)<br />
3-Hydroxy-2(5H)-furanone<br />
Unknown (Unknown compound 94)<br />
Levoglucosan<br />
Yes<br />
Yes<br />
Yes<br />
Yes<br />
Yes<br />
Yes<br />
Yes<br />
Yes<br />
Yes<br />
Yes<br />
No<br />
Yes<br />
No<br />
Yes<br />
No<br />
No<br />
Yes<br />
Yes<br />
No<br />
No<br />
No<br />
Yes<br />
No<br />
Yes<br />
No<br />
No<br />
Yes<br />
No<br />
Yes<br />
No<br />
No<br />
No<br />
No<br />
No<br />
No<br />
No<br />
No<br />
No<br />
No<br />
No<br />
No<br />
No<br />
No<br />
No<br />
No<br />
No<br />
No<br />
No<br />
No<br />
Yes<br />
Yes<br />
Yes<br />
Yes<br />
No<br />
No<br />
No<br />
No<br />
Yes<br />
Yes<br />
No<br />
Yes<br />
No<br />
Yes<br />
Yes<br />
Yes<br />
Yes<br />
Yes<br />
Yes<br />
Yes<br />
Yes<br />
Yes<br />
Yes<br />
4.3 Quantification of selected compounds present within the liquid<br />
product of hardwood pyrolysis<br />
The experimental regimes that were employed in the present study were relatively mild and therefore a<br />
large proportion of solid residue was obtained that was comprised of partially pyrolysed feedstock.<br />
There was no charcoal present within this material although a small quantity of charcoal was present in<br />
the char pot at the completion of some of the trials. This was because the char pot was located within<br />
the reactor and therefore deposited material was exposed to elevated temperatures for the duration of<br />
the trial.<br />
38
The major compounds for which standards were available were quantified and are listed in Table<br />
4.3.1. The aromatic compounds in the samples were found to be predominantly phenolic in character.<br />
Table 4.3.1. Compounds from the pyrolysis of hardwood that were quantified, as well as the<br />
corresponding dominant mass spectra ion for each. 4 RIC = Quantification based on total ion count.<br />
Quantified Compounds<br />
Compounds Derived from the<br />
Pyrolysis of Lignin<br />
Guaiacol<br />
Phenol<br />
Eugenol<br />
Isoeugenol<br />
Vanillin<br />
Syringol<br />
Syringaldehyde<br />
Dominant Ion<br />
109<br />
94<br />
164<br />
164<br />
151<br />
154<br />
182<br />
Compounds Derived from the<br />
Pyrolysis of the Polysaccharides<br />
Furfural<br />
Furfuryl alcohol<br />
Furfuryl methyl acetal<br />
96<br />
81<br />
RIC 1<br />
It was observed that a small number of compounds accounted for a large proportion of the phenolic<br />
compound yield. These compounds included guaiacol, vanillin, eugenol and isoeugenol, syringol and<br />
syringaldehyde and standards were obtained. A standard was also obtained for phenol. Furfural and<br />
furfural methyl acetal (a derivative of furfural obtained through acetalation in the methanolic quench<br />
fluid) were important compounds and accounted for a large proportion of the carbohydrate yield in<br />
most of the samples produced. As the furfural methyl acetal was derived from furfural, its yield was<br />
added to that of furfural to obtain the total furfural yield.<br />
Calibration curves were generated from reference standard solutions. The calibration data was derived<br />
from the chromatogram peak area of the dominant ion observed for each of the quantified reference<br />
standards and adjusted according to the peak area of the associated internal standard (this standardises<br />
the chromatographic data and thereby compensates for between-sample variations in the<br />
chromatograph caused by between-sample variations in the GCMS analysis). It was observed from<br />
inspection of the calibration plots that the data was best represented by linear models. The SPSS<br />
computer package was used to generate the appropriate regression model for each calibration data set.<br />
The calibration models were used to determine the concentration of the respective compounds<br />
according to the quantification procedure described in the methodology. For furfural methyl acetal, no<br />
standard was available and so it was assumed that it’s response factor was the same as that for furfuryl<br />
alcohol (due to its closely related structure) and it was quantified by comparison with the internal<br />
standard. There was potentially a systematic error introduced here as the response factors of the two<br />
furfuryl compounds may not be the same (although they will be close) and the relationship between<br />
chromatograph peak area and concentration may not be linear for the acetal (although it is linear, or<br />
very close to linear for all other quantified compounds). The concentrations of each quantified<br />
compound were then converted to absolute masses. The yield of each of the quantified compounds was<br />
then calculated as:<br />
1. A function of the reduction in feedstock mass due to the thermal treatment, taking into account<br />
free moisture present before and after the treatment. The mass of water in the feedstock prior to<br />
the thermal treatment was determined, as was the mass of water in the solid residue after the<br />
39
treatment. The balance of the water, that is, the water that was evaporated from the feed during<br />
the treatment, was associated with the liquid and gaseous products. The mass of this water was<br />
subtracted from the total reduction of the feedstock mass as a consequence of the treatment. The<br />
resultant mass corresponded to the liquid and gaseous products as well as any volatilised<br />
extractives. The yield that was calculated as a function of this mass was referred to as the yield<br />
based on mass of volatile product. This yield provides an indication of the selectivity of the<br />
process with respect to the species in question.<br />
2. A function of the total mass of feedstock processed. This yield was referred to as the absolute<br />
yield.<br />
The reason that two types of yield were calculated for each compound was that the yield based of mass<br />
of feed processed does not provide a clear indication of the actual yield of each compound, as the<br />
degradation was only partially completed. That is, the conditions employed in the study were relatively<br />
mild, and the residence times of wood particles under such conditions sufficiently short, that the<br />
pyrolysis only proceeded to a limited extent. Therefore, the absolute yield was small. The residues<br />
from the process could possibly be processed a second or even a third time in order to complete the<br />
reactions but this possibility was not investigated in the present study, except at low temperatures.<br />
The volumes of the liquid products for each trial were made up to 50ml. The calculated masses were<br />
then doubled due to the difference between the injection volumes of the standards (2μl) and the<br />
samples (1μl). The concentrations, masses and yields for each quantified compound are displayed in<br />
Appendix 3. The raw integration data for the compounds detected in each of the trials is displayed in<br />
Appendix 4 for the lignin derived compounds and Appendix 5 for the polysaccharide derived<br />
compounds.<br />
4.4 Analysis of pyrolysis residues<br />
For a number of the trails, there was insufficient residue to perform the cellulose and holocellulose<br />
determinations.<br />
40
4.4.1 Cellulose determination by Seifert method<br />
The Seifert cellulose content of the hardwood pyrolytic residues ranged between 37% and 51%. The<br />
actual data for the residues that were analysed is provided in Table 4.4.1.1.<br />
Table 4.4.1.1. Cellulose determinations of hardwood pyrolytic residues by the Seifert technique.<br />
Sample 1st Determination<br />
(% Cellulose)<br />
2nd Determination<br />
(% Cellulose)<br />
Duplicate Mean<br />
(% Cellulose)<br />
Hardwood (150-210) 41.16<br />
39.78%<br />
40.47%<br />
Trial 6.4<br />
Trial 1.2A<br />
41.15<br />
41.89<br />
40.80<br />
42.57<br />
40.98<br />
42.23<br />
Trial 2A.1A<br />
Trial 2A.2<br />
Trial 2A.3A<br />
Trial 2A.4<br />
40.18<br />
40.13<br />
45.16<br />
43.60<br />
36.97<br />
43.68<br />
44.00<br />
43.74<br />
38.58<br />
41.91<br />
44.58<br />
43.67<br />
Trial 2B.1A<br />
Trial 2B.2<br />
Trial 2B.3<br />
Trial 2B.5A<br />
Trial 2B.6<br />
37.96<br />
43.31<br />
41.27<br />
44.61<br />
45.59<br />
35.79<br />
43.36<br />
48.45<br />
42.72<br />
46.28<br />
36.88<br />
43.34<br />
44.86<br />
43.67<br />
45.94<br />
Trial 2C.1<br />
Trial 2C.2<br />
Trial 2C.3A<br />
22.88<br />
50.21<br />
37.69<br />
22.61<br />
52.53<br />
37.19<br />
22.75<br />
51.37<br />
37.44<br />
Trial 3A.1A<br />
Trial 3A.2<br />
47.06<br />
22.88<br />
52.41<br />
22.61<br />
49.74<br />
22.75<br />
Trial 3B.1B<br />
Trial 3B.2<br />
Trial 3B.3<br />
41.90<br />
43.10<br />
39.62<br />
46.08<br />
43.32<br />
41.99<br />
43.99<br />
43.21<br />
40.80<br />
Trial 4A.1<br />
Trial 4A.2<br />
44.42<br />
22.88<br />
45.25<br />
22.61<br />
44.84<br />
22.75<br />
Trial 4B.1A<br />
40.18<br />
36.97<br />
38.58<br />
Trial 5.1<br />
Trial 5.2B<br />
45.51<br />
41.90<br />
46.30<br />
46.08<br />
45.91<br />
43.99<br />
Trial 6.1<br />
Trial 6.3<br />
Trial 6.4<br />
44.91<br />
31.18<br />
41.15<br />
55.30<br />
35.70<br />
40.80<br />
50.11<br />
33.44<br />
40.98<br />
41
4.4.2 Holocellulose determination by the chlorite method<br />
The chlorite holocellulose ranged between 54% and 79%. The determinations are summarised in Table<br />
4.4.2.1.<br />
Table 4.4.2.1. Chlorite holocellulose determinations in hardwood pyrolysis residues. *Limited, or<br />
insufficient, sample available for analysis.<br />
Sample 1st Determination<br />
(% Holocellulose)<br />
2nd Determination<br />
(% Holoellulose)<br />
Duplicate Mean<br />
(% Holocellulose)<br />
Hardwood (150-210) 79.93<br />
76.14<br />
78.04<br />
Trial 6.4<br />
Trial 1.2A<br />
79.79<br />
70.01<br />
79.89<br />
68.77<br />
79.84<br />
69.39<br />
Trial 2A.1A*<br />
Trial 2A.2<br />
Trial 2A.3A*<br />
Trial 2A.4*<br />
66.32<br />
64.83<br />
-<br />
-<br />
-<br />
65.09<br />
-<br />
-<br />
66.32<br />
64.96<br />
-<br />
-<br />
Trial 2B.1A<br />
Trial 2B.2<br />
Trial 2B.3<br />
Trial 2B.5A<br />
Trial 2B.6<br />
68.74<br />
69.95<br />
68.32<br />
70.31<br />
55.43<br />
68.39<br />
70.13<br />
64.76<br />
70.22<br />
53.51<br />
68.57<br />
70.04<br />
66.54<br />
70.27<br />
54.57<br />
Trial 2C.1<br />
Trial 2C.2<br />
Trial 2C.3A<br />
71.03<br />
74.24<br />
71.55<br />
71.83<br />
69.18<br />
70.83<br />
71.43<br />
71.71<br />
71.19<br />
Trial 3A.1A<br />
Trial 3A.2<br />
78.80<br />
71.03<br />
78.34<br />
71.83<br />
78.57<br />
71.43<br />
Trial 3B.1B<br />
Trial 3B.2<br />
Trial 3B.3<br />
73.11<br />
68.13<br />
71.26<br />
74.32<br />
68.24<br />
72.93<br />
73.72<br />
68.19<br />
72.10<br />
Trial 4A.1<br />
Trial 4A.2<br />
72.36<br />
71.03<br />
73.37<br />
71.83<br />
72.87<br />
71.43<br />
Trial 4B.1A<br />
66.32<br />
-<br />
66.32<br />
Trial 5.1<br />
Trial 5.2B<br />
70.77<br />
73.11<br />
72.39<br />
74.32<br />
71.58<br />
73.72<br />
Trial 6.1<br />
Trial 6.3<br />
Trial 6.4<br />
78.83<br />
78.16<br />
79.79<br />
79.22<br />
76.02<br />
79.89<br />
79.03<br />
77.09<br />
79.84<br />
42
4.4.3 Preparation of holocellulose by hypochlorite bleaching<br />
The hypochlorite holocellulose determinations ranged between 54% and 78%. The determinations are<br />
summarised in Table 4.4.3.1.<br />
Table 4.4.3.1. Hypochlorite holocellulose determinations of hardwood pyrolytic residues. *Limited, or<br />
insufficient, sample available for analysis.<br />
Sample 1st Determination<br />
(% Holocellulose)<br />
2nd Determination<br />
(% Holoellulose)<br />
Duplicate Mean<br />
(% Holocellulose)<br />
Hardwood (150-210) 79.32<br />
75.85<br />
77.59<br />
Trial 6.4<br />
Trial 1.2A<br />
78.97<br />
69.10<br />
78.81<br />
69.78<br />
78.89<br />
69.44<br />
Trial 2A.1A*<br />
Trial 2A.2<br />
Trial 2A.3A*<br />
Trial 2A.4*<br />
65.32<br />
63.78<br />
-<br />
-<br />
-<br />
65.17<br />
-<br />
-<br />
65.32<br />
64.48<br />
-<br />
-<br />
Trial 2B.1A<br />
Trial 2B.2<br />
Trial 2B.3<br />
Trial 2B.5A<br />
Trial 2B.6<br />
68.39<br />
68.24<br />
68.46<br />
69.24<br />
56.13<br />
68.56<br />
69.11<br />
64.82<br />
68.87<br />
53.28<br />
68.48<br />
68.68<br />
66.64<br />
69.06<br />
54.71<br />
Trial 2C.1<br />
Trial 2C.2<br />
Trial 2C.3A<br />
69.73<br />
73.49<br />
72.22<br />
70.14<br />
70.21<br />
68.45<br />
69.94<br />
71.85<br />
70.34<br />
Trial 3A.1A<br />
Trial 3A.2<br />
77.42<br />
69.73<br />
77.95<br />
70.14<br />
77.69<br />
69.94<br />
Trial 3B.1B<br />
Trial 3B.2<br />
Trial 3B.3<br />
71.31<br />
66.46<br />
71.75<br />
73.22<br />
67.07<br />
70.92<br />
72.27<br />
66.77<br />
71.34<br />
Trial 4A.1<br />
Trial 4A.2<br />
70.18<br />
69.73<br />
70.39<br />
70.14<br />
70.29<br />
69.94<br />
Trial 4B.1A<br />
65.32<br />
-<br />
-<br />
Trial 5.1<br />
Trial 5.2B<br />
68.42<br />
71.31<br />
68.86<br />
73.22<br />
68.64<br />
72.27<br />
Trial 6.1<br />
Trial 6.3<br />
Trial 6.4<br />
77.89<br />
76.45<br />
78.97<br />
79.18<br />
77.00<br />
78.81<br />
78.54<br />
76.73<br />
78.89<br />
43
4.4.4 Analysis of the properties of the cellulosic material derived from<br />
hardwood pyrolytic residues (Assessment of DP)<br />
The cellulose DP (Degree of polymerisation) measurement data is displayed in Table 4.4.4.1 as a<br />
function of viscosity.<br />
Table 4.4.4.1. Viscosity of hardwood holocellulose samples (as cupriethylenediamine (CED) viscosity of<br />
0.5% pulp solutions by the capillary viscometer method 11 ). * Limited, or insufficient, sample available for<br />
analysis.<br />
Sample<br />
Hardwood (150-210)<br />
Mean Efflux<br />
Time<br />
(secs.)<br />
244.57<br />
Viscometer<br />
Constant<br />
(cSt/sec)<br />
0.0151<br />
Kinematic<br />
Viscosity<br />
(centistokes,<br />
cSt)<br />
3.693<br />
Viscosity<br />
(centipoise, cP)<br />
3.89<br />
Trial 6.4<br />
Trial 1.2A<br />
171.37<br />
129.29<br />
0.0151<br />
0.0151<br />
2.588<br />
1.952<br />
2.72<br />
2.05<br />
Trial 2A.1A<br />
Trial 2A.2<br />
Trial 2A.3A*<br />
Trial 2A.4*<br />
130.00<br />
131.66<br />
-<br />
-<br />
0.0151<br />
0.0151<br />
0.0151<br />
0.0151<br />
1.963<br />
1.988<br />
-<br />
-<br />
2.07<br />
2.09<br />
-<br />
-<br />
Trial 2B.1A<br />
Trial 2B.2<br />
Trial 2B.3<br />
Trial 2B.5A<br />
Trial 2B.6<br />
161.36<br />
150.51<br />
148.38<br />
135.92<br />
133.54<br />
0.0151<br />
0.0151<br />
0.0151<br />
0.0151<br />
0.0151<br />
2.437<br />
2.273<br />
2.241<br />
2.052<br />
2.016<br />
2.56<br />
2.39<br />
2.36<br />
2.16<br />
2.12<br />
Trial 2C.1<br />
Trial 2C.2<br />
Trial 2C.3A<br />
143.64<br />
109.63<br />
146.51<br />
0.0151<br />
0.0151<br />
0.0151<br />
2.169<br />
1.655<br />
2.212<br />
2.28<br />
1.74<br />
2.33<br />
Trial 3A.1A<br />
Trial 3A.2<br />
129.57<br />
143.64<br />
0.0151<br />
0.0151<br />
1.957<br />
2.169<br />
2.06<br />
2.28<br />
Trial 3B.1B<br />
Trial 3B.2<br />
Trial 3B.3<br />
141.17<br />
138.74<br />
140.64<br />
0.0151<br />
0.0151<br />
0.0151<br />
2.132<br />
2.095<br />
2.124<br />
2.24<br />
2.20<br />
2.23<br />
Trial 4A.1<br />
Trial 4A.2<br />
139.41<br />
143.64<br />
0.0151<br />
0.0151<br />
2.105<br />
2.169<br />
2.21<br />
2.28<br />
Trial 4B.1A<br />
130.00<br />
0.0151<br />
1.963<br />
2.07<br />
Trial 5.1<br />
Trial 5.2B<br />
131.93<br />
141.17<br />
0.0151<br />
0.0151<br />
1.992<br />
2.132<br />
2.10<br />
2.24<br />
Trial 6.1<br />
Trial 6.3<br />
Trial 6.4<br />
137.65<br />
177.74<br />
171.37<br />
0.0151<br />
0.0151<br />
0.0151<br />
2.079<br />
2.684<br />
2.588<br />
2.19<br />
2.82<br />
2.72<br />
44
Chapter 5: Influence of selected<br />
operational parameters on stage 1 of the<br />
pyrolysis process<br />
This Chapter summarises the results of optimisation of Stage 1 of the pyrolysis process for furfuryls<br />
production. The first stage of the process is characterised by temperatures within the range of 240-<br />
285 o C. Within this temperature range, under fast pyrolysis conditions, the rate of lignin and cellulose<br />
pyrolysis is very low compared to that for hemicellulose. A series of experiments were conducted in<br />
order to evaluate the influence of selected operational parameters on furfural and furfuryl alcohol<br />
formation from Stage 1 of the process when applied to Australian hardwood, the results of which are<br />
discussed in this chapter.<br />
The chromatograph peak areas (PA) of all condensable lignin and hemicellulose derived pyrolysis<br />
products were standardised so that all trials could be compared. An estimation of the total yield of<br />
lignin and hemicellulose derived compounds from each sample was calculated according to the<br />
expression below.<br />
Total yield of ≅ Σ Standardised PA of all compounds x Total yield of<br />
compounds Σ standardised PA of quantified compounds quantified compounds<br />
These yields enable the selectivity of the process towards degradation of a particular wood component<br />
to be ascertained. The bench scale unit employed in the study was too small, and the substrate<br />
residence times too short, to achieve substantial degradation with a single pass and therefore two<br />
passes were performed. The first was performed under Stage 1 type conditions so as to achieve partial<br />
depolymerisation and thereby enable a large increase in the extent of degradation with the second pass.<br />
From a modelling and design perspective, this requirement complicates scaling of the process.<br />
Moreover, extrapolation of conversion phenomena is probably not reliable. That is, it is difficult to<br />
predict what yields further pyrolysis would have achieved if the reactor was more efficient. This is<br />
because the substrate is always changing during pyrolysis, especially in the latter stages where<br />
carbonisation reactions predominate. Therefore, if a relatively small proportion of a particular<br />
component has decomposed yielding a particular product distribution, then it is likely that further<br />
decomposition of that same component would result in a similar product distribution.<br />
The conditions employed in Stage 1 of the process do not result in complete evaporation of water from<br />
the substrate. Therefore, a sub-sample of the residue from each trial was separated for moisture content<br />
determination and the remainder stored in a sealed container. The difference in moisture content<br />
between the feed and residue corresponded to the water actually evaporated from the sample during<br />
pyrolysis and collected in the quench system as part of the liquid product.<br />
5.1 Experiment 1.1: low temperature pyrolysis for furfuryls<br />
production - stage 1<br />
In this experiment, a number of trials were conducted at temperatures between 240-260 o C under a<br />
range of operational conditions. The purpose of the experiment was to optimise Stage 1 of the<br />
pyrolysis process. That is, the purpose was to determine the operational conditions which result in<br />
maximal furfural and furfuryl alcohol yield. The rate of lignin and cellulose decomposition over the<br />
temperature range 240-260 o C is normally quite low under fast pyrolysis conditions. The rate of<br />
hemicellulose pyrolysis is much greater, although the extent to which it occurs is limited due to the<br />
short residence times associated with fast pyrolysis. The objectives of this experiment were to:<br />
45
1. Survey the influence of various operation parameters on furfural and furfuryl alcohol formation<br />
from the low temperature pyrolysis of hardwood.<br />
2. Prepare a range of materials for re-pyrolysis in order to evaluate the influence of pre-pyrolysis on<br />
the derivation of furfuryls and phenols. This was an important aspect for developing a combined,<br />
two-stage, low temperature-high temperature process.<br />
The parameter values that were employed in Experiment 1.1 are summarised in Table 3.6.1 and the<br />
mass balances for each trial are summarised in Appendix 1.<br />
The estimated total yield of hemicellulose derived compounds, based on the mass of wood converted<br />
to volatile compounds (the relative yield), from the trials of Experiment 1.1 is displayed in Figure<br />
5.1.1. It can be seen from this figure that under most conditions the yields varied little, except in Trial<br />
1 in which they was substantially greater. Furthermore, most of this material was accounted for by<br />
furfural and furfuryl alcohol, indicating that<br />
Yield (%m/m)<br />
the process is highly specific toward<br />
furfuryl compound formation under these<br />
conditions. It is noteworthy that in Trial 3,<br />
similar conditions were employed to those<br />
of Trial 1, yet the yields obtained were<br />
much less. The only difference between<br />
these trials was the fluid bed particle size<br />
range, a parameter that is less important<br />
with respect to furfuryls formation at<br />
higher temperatures. It would therefore<br />
seem that the efficiency of the fluid bed is<br />
quite sensitive to sand particle size over the<br />
temperature range investigated.<br />
The total estimated yield of phenols was 5.3% based on the mass of feed converted to volatiles for<br />
Trial 1. This is much greater than for the other trials of Experiment 1.1 where the phenol yield was<br />
negligible. Therefore, while the specificity of the process towards furfuryl formation from<br />
hemicelluloses is very high, the corresponding selectivity of the process towards hemicellulose<br />
pyrolysis is quite low, under the conditions of Trial 1. The condensable hemicellulose and lignin<br />
derived compounds accounted for less than 10% of the overall mass of feed converted to volatiles.<br />
This indicates that much of the volatile material was non-monomeric. That is, it was composed<br />
predominately of low molecular weight oligomeric material.<br />
For Trials 2 and 5, cellulose analyses were not performed. For Trials 1, 3 and 4, the cellulose<br />
analytical results are summarised in Table 5.1.1.<br />
Table 5.1.1. Comparison of cellulose and hemicellulose proportions in the solid residue from the trials of<br />
experiment 1.1. 1 Hemicellulose calculated by difference between holocellulose and cellulose.<br />
Trial<br />
Feed<br />
Figure 5.1.1. Comparison of furfuryls yield with the<br />
combined yield of all hemicellulose derived<br />
compounds. (yield based on mass of volatile products)<br />
0.35<br />
0.30<br />
0.25<br />
0.20<br />
0.15<br />
0.10<br />
0.05<br />
0.00<br />
1 2 3 4 5<br />
Furfural +Furfuryl alcohol<br />
Cellulose<br />
(by Seifert)<br />
(%)<br />
40.47<br />
Trial<br />
Total Hemicellulose Derived Compounds<br />
Holocellulose<br />
(by Chlorite)<br />
(%)<br />
78.04<br />
Holocellulose<br />
( by Hypochlorite)<br />
(%)<br />
77.59<br />
Hemicellulose 1<br />
(by Difference)<br />
(%)<br />
37.57<br />
Cellulose<br />
Viscosity<br />
(cP)<br />
3.89<br />
1<br />
3<br />
4<br />
50.11<br />
33.44<br />
40.98<br />
79.03<br />
77.09<br />
79.84<br />
78.54<br />
76.73<br />
78.89<br />
28.43<br />
43.29<br />
37.91<br />
2.19<br />
2.82<br />
2.72<br />
From Table 5.1.1 it can be seen that the extent of hemicellulose decomposition was greatest for Trial 1<br />
where a 25% reduction occurred compared to the raw feed. For the other trials, the proportion of<br />
46
hemicellulose actually increased, indicating that the process favoured decomposition of cellulose or<br />
lignin, rather than hemicellulose. The degree of polymerisation (DP) of cellulose, as indicated by<br />
viscosity, was lowest for Trial 1, even though the overall cellulose content was highest for this Trial.<br />
These results indicate that the rate of cellulose depolymerisation is not correlated with the rate of<br />
cellulose fragmentation into volatile compounds under the conditions of Trial 1.<br />
In conclusion, the yield of furfuryl compounds is strongly dependent on fluid bed particle size with<br />
maximum yields achieved when a particle size range of 150-210μm is employed. This particle size<br />
range also favours cellulose preservation, although the actual DP is significantly reduced. Thus, further<br />
work is needed to establish the relationship between fluid bed particle size and carrier gas flow rate,<br />
which determines the extent of fluidisation for a particular bed particle size, in order to fully<br />
understand the influence of the nature of the bed fluidisation on the pyrolysis process. The influence of<br />
pre-drying the feed provided no discernable advantage. Reaction temperature was not an important<br />
parameter over the temperature range investigated.<br />
5.2 Experiment 1.2: effect of reprocessing of solid residue on<br />
furfuryl production<br />
The objective of this experiment was to determine the effect of reprocessing of the solid residue under<br />
equivalent conditions on the yield of furfuryls, as well as determine the selectivity of each processing<br />
on hemicellulose degradation. In order to increase pyrolytic activity under the relatively low reaction<br />
temperature employed, oxygen was incorporated in the carrier gas. The reaction conditions employed<br />
in this experiment were selected so as to prevent degradation of non-hemicellulosic wood components.<br />
Yield (%m/m)<br />
Yield (%m/m)<br />
0.30<br />
0.25<br />
0.20<br />
0.15<br />
0.10<br />
0.05<br />
0.00<br />
0.05<br />
0.04<br />
0.03<br />
0.02<br />
0.01<br />
Figure 5.2.1. Yield of Furfuryl compounds based on the mass of feed<br />
converted to volatiles.<br />
0<br />
Furfural<br />
Furfuryl alcohol<br />
Furfuryl Compound<br />
First Processing Second Processing<br />
Figure 5.2.2. Yield of Furfuryl compounds based on the mass of feed<br />
converted to volatiles.<br />
Furfural<br />
First Processing<br />
Furfuryl Compound<br />
Second Processing<br />
Furfuryl alcohol<br />
It was expected that the yield of furfuryl<br />
compounds would be greater from<br />
pyrolysis of the residue than from pyrolysis<br />
of the raw feed because the first treatment<br />
would have caused significant<br />
depolymerisation of the hemicellulose<br />
polymer, thereby facilitating furfuryls<br />
production in the reprocessing.<br />
The operational parameters selected for the<br />
trials of Experiment 1.2 are summarised in<br />
Table 3.6.1 and the mass balances<br />
associated with each trial are summarised<br />
in Appendix 1.<br />
The yield based on mass of volatile product<br />
and absolute yield of furfural are displayed<br />
Figures 5.2.1 and 5.2.2 respectively. From<br />
examination of the figures it can be seen<br />
that the yield of these compounds was<br />
substantially greater from the second<br />
processing. This was in accordance with<br />
expectation. Overall however the yields are<br />
quite low. The quantified furfuryl<br />
compounds from the first processing<br />
accounted for 35% of the hemicellulose<br />
volatile compound yield and increased to<br />
75% upon reprocessing. The total relative<br />
yield of quantified phenols ranged between<br />
0.1 and 0.2%. This means that less than 1%<br />
47
of the material converted to volatile compounds was accounted for by low molecular weight<br />
compounds detectable by GCMS. The likely explanation for these observations is that much of the<br />
material converted to volatile compounds was composed of volatile oligomeric material, or tars.<br />
In Figure 5.2.3, the relative yield of hemicellulose derived compounds is compared with that of the<br />
phenolic compounds in order to assess the selectivity of the process towards hemicellulose<br />
decomposition, and subsequent volatile compound formation, under the conditions employed.<br />
Relative Yield<br />
1.0<br />
0.8<br />
0.6<br />
0.4<br />
0.2<br />
0.0<br />
Examination of Figure 5.2.3 indicates that<br />
for the first processing, the amount of<br />
condensable low molecular weight<br />
compounds was quite similar for both<br />
wood components. However, the amount of<br />
hemicellulose derived compounds was<br />
substantially greater than the corresponding<br />
amount of lignin derived compounds from<br />
the reprocessing of the residue. Moreover,<br />
the yield of lignin derived compounds was<br />
lower from the processing of the residue<br />
than from the processing of the raw feed,<br />
possibly due to increased refractivity of<br />
lignin as a result of condensation reactions<br />
during the first processing. Thus, the selectivity of the process towards hemicellulose degradation was<br />
very high for the second processing and poor for the first under the relatively mild conditions<br />
evaluated in this experiment.<br />
The intention of using relatively low pyrolysis temperatures in this experiment was to minimise both<br />
lignin and cellulose decomposition and thereby obtain a liquid decomposition product rich in furfuryls.<br />
However, the rate of hemicellulose decomposition, from which the furfuryls are derived, is still<br />
relatively low. To improve the rate of hemicellulose decomposition, and thereby improve the yield of<br />
furfuryl compounds, additional oxygen was incorporated into the carrier gas. Even at low pyrolysis<br />
temperatures oxygen is known to cause glycosidic bond cleavage which results in depolymerisation<br />
and it was therefore expected that the degree of polymerisation of hemicellulose and cellulose would<br />
have been substantially reduced as a result of the thermal treatment. This was indeed the case as is<br />
evident from the cellulose analytical data provided in Table 5.2.1.<br />
Table 5.2.1. Comparison of cellulose and hemicellulose proportions in the solid residue from the trials of<br />
experiment 1.2. 4 Hemicellulose calculated by difference between holocellulose and cellulose.<br />
Trial<br />
Feed<br />
Figure 5.2.3. Comparison of the relative yields of hemicellulose and<br />
lignin derived compounds with reprocessing<br />
First Processing<br />
(Trial 1)<br />
Lignin Derived Compounds<br />
Cellulose<br />
(by Seifert)<br />
(%)<br />
40.47<br />
Second Processing<br />
(Trial 2A)<br />
Holocellulose 2<br />
(by Chlorite)<br />
(%)<br />
78.04<br />
Second Processing<br />
(Trial 2B)<br />
Hemicellulose Derived Compounds<br />
Holocellulose<br />
( by Hypochlorite)<br />
(%)<br />
77.59<br />
Hemicellulose 1<br />
(by Difference)<br />
(%)<br />
37.57<br />
Cellulose<br />
Viscosity<br />
(cP)<br />
3.89<br />
1<br />
2A<br />
40.98<br />
42.23<br />
79.84<br />
69.39<br />
78.89<br />
69.44<br />
38.86<br />
27.16<br />
2.72<br />
2.05<br />
It is apparent from examination of Table 5.2.1 that the first processing achieved little with respect to<br />
hemicellulose removal, although the cellulose DP was somewhat reduced. However, the second<br />
processing resulted in 30% decrease in hemicellulose content, confirming the notion that<br />
depolymerisation of the hemicellulose in the first process facilitates volatile compound formation in<br />
re-pyrolysis. The DP of the cellulose also decreased significantly, although the actual proportion of<br />
cellulose in the residue increased.<br />
Overall, Experiment 1.2 confirmed the underlying principals of low temperature pyrolysis, such as<br />
maximisation of hemicellulose degradation and minimisation of lignin degradation, especially on<br />
48
eprocessing. However, the yields of furfuryl compounds were quite low. The low yield was despite a<br />
15% mass conversion to volatiles, suggesting that such volatiles are oligomeric in nature and therefore<br />
not easily detectable by GCMS. With increased residents times, such as would occur in a larger<br />
reactor, the overall extent of conversion achieved with reprocessing may be achievable with a single<br />
pass. This is because increased residence times would allow for further decomposition due to<br />
increased ‘time at temperature’. However, it would still be necessary to remove decomposition<br />
products as rapidly as possible in order to prevent their further decomposition or condensation to<br />
oligomeric products.<br />
5.3 Experiment 1.3: influence of reaction temperature on furfuryls<br />
production<br />
The influence on reaction temperature on the formation of furfuryl compounds under Stage 1 type<br />
conditions was investigated. The<br />
operational parameters associated with<br />
this Experiment are provided in Table<br />
3.6.1. The raw hardwood feed material<br />
was first pyrolysed under Stage 1 type<br />
conditions in order to increase the<br />
susceptibility of the residue to volatile<br />
compound formation. The mass<br />
balances associated with this experiment<br />
are summarised in Appendix 1.<br />
Overall, the extent of pyrolysis, as<br />
indicated by the amount of wood<br />
converted to volatile compounds, was<br />
relatively low and was doubtless a<br />
consequence of the low temperatures<br />
employed in this experiment. As<br />
expected, the amount of material<br />
converted to volatiles increased steadily<br />
with increasing temperature. The yield<br />
of furfural and furfuryl alcohol, as well<br />
as the estimated total yield of<br />
hemicellulose derived compounds, is<br />
displayed in Figures 5.3.1 and 5.3.2<br />
respectively. The actual quantification<br />
data is provided in Appendix 3.<br />
Yield (%m/m)<br />
Yield (%m/m)<br />
Figure 5.3.1. Yield of furfural and furfuryl alcohol<br />
based on the mass of feed converted to volatiles.<br />
Figure 5.3.2. Total estimated yield of hemicellulose<br />
derived compounds based on the mass of wood<br />
converted to volatile material.<br />
From examination of Figure 5.3.1, it can<br />
be seen that the relative yields of the quantified furfuryl compounds were low. The corresponding<br />
absolute yields ranged between 0.005 and 0.027%. The yield of furfural and furfuryl alcohol decreased<br />
markedly with increasing temperature, although the overall yield of hemicellulose derived compounds<br />
varied much less. This indicates that multiple reaction pathways were operative for the decomposition<br />
of hemicellulose, a finding that has been reported by other workers 134 . That is, the dominant reaction<br />
pathways for hemicellulose pyrolysis following depolymerisation are fragmentation/rearrangement<br />
and dehydration. Furfuryls are formed through the dehydration pathway, which is the rate limiting step<br />
in their formation, and therefore if the rate of competing degradation pathways was increased relative<br />
to that of the dehydration reaction through increasing reaction temperature, the net effect will be a<br />
reduction in furfuryls yield without a reduction in overall hemicellulose decomposition.<br />
0.25<br />
0.20<br />
0.15<br />
0.10<br />
0.05<br />
0.00<br />
1.5<br />
1.0<br />
0.5<br />
0.0<br />
275 280 285<br />
Temperature (oC)<br />
Furfural<br />
Furfuryl alcohol<br />
275 280 285<br />
Temperature (oC)<br />
49
The selectivity of the process towards hemicellulose decomposition is illustrated in Figure 5.3.3. This<br />
figure demonstrates that the rate of hemicellulose decomposition was approximately double that of<br />
lignin over the temperature range investigated.<br />
Relative Yield<br />
It was hypothesised that over the<br />
temperature range investigated, the<br />
selectivity of the process towards<br />
hemicellulose degradation would be quite<br />
high. This is because at temperatures<br />
below about 280 o C the rate of lignin<br />
pyrolysis compared to that for<br />
hemicellulose is quite low. Moreover, it<br />
was hypothesised that the inclusion of<br />
oxygen in the carrier gas would increase<br />
the rate of hemicellulose pyrolysis due to<br />
the accelerated rate of glycosidic bond<br />
scission. Examination of Figures 5.3.3<br />
and 5.6.1 provide strong evidence in<br />
support of these hypotheses, although the magnitude of these phenomena were relatively low.<br />
The cellulose analytical results are summarised in Table 5.3.1 for the trials of Experiment 1.3. For<br />
Trial 3B, insufficient residue was available for analysis.<br />
Table 5.3.1. Comparison of cellulose and hemicellulose proportions in the solid residue from the trials of<br />
experiment 1.3. 4 Hemicellulose calculated by difference between holocellulose and cellulose.<br />
Trial<br />
Wood<br />
Feed<br />
1.0<br />
0.8<br />
0.5<br />
0.3<br />
0.0<br />
Figure 5.3.3. Relative yield of phenols and<br />
hemicellulose derived compounds.<br />
Lignin Derived Compounds<br />
275 280 285<br />
Cellulose<br />
(by Seifert)<br />
(%)<br />
40.47<br />
33.44<br />
Temperature (oC)<br />
Hemicellulose Derived Compounds<br />
Holocellulose<br />
(by Chlorite)<br />
(%)<br />
78.04<br />
77.09<br />
Holocellulose<br />
( by Hypochlorite)<br />
(%)<br />
77.59<br />
76.73<br />
Hemicellulose 1<br />
(by Difference)<br />
(%)<br />
37.57<br />
43.29<br />
Cellulose<br />
Viscosity<br />
(cP)<br />
3.89<br />
2.82<br />
1<br />
2<br />
3A<br />
22.75<br />
51.37<br />
37.44<br />
71.43<br />
71.71<br />
71.19<br />
69.94<br />
71.85<br />
70.34<br />
48.68<br />
20.34<br />
33.75<br />
2.28<br />
1.74<br />
2.33<br />
The maximum extent of hemicellulose decomposition occurred at 280 o C. The proportion of<br />
hemicellulose in the feedstock was 43.29%. Therefore, pyrolysis at 280 o C under the conditions of<br />
Experiment 1.3 resulted in a 53% reduction in the proportion of hemicellulose in the residue compared<br />
to the feed. However, based on the GCMS analyses, most of this decomposed hemicellulose was not<br />
monomeric or low molecular weight. Again, this indicates that much of the hemicellulose pyrolysis<br />
product was composed of volatile oligomeric material. As expected, the cellulose DP decreased as a<br />
consequence of the thermal treatments, although not in the order expected.<br />
In conclusion, the furfuryl yield decreased with increasing reaction temperature. Hemicellulose<br />
decomposition was most efficient at 280 o C with more than 50% converted to volatiles. However, the<br />
volatiles were evidently comprised of small fragments of polymeric material, or tar, a phenomenon<br />
typical in wood pyrolysis. At temperatures above and below 280 o C, the efficiency of the process<br />
declines rapidly for pyrolysis conducted under the conditions employed in this experiment. This<br />
indicates that reaction temperature significantly influences the thermolytic properties of the bed. That<br />
is, the efficiency of the fluid bed to impart heat into the substrate is dependent on the interaction<br />
between reaction temperature and other process parameters, such as carrier gas density and viscosity.<br />
50
5.4 Experiment 1.4: effect of fluid bed mass on furfuryls production<br />
Two series of experiments were conducted in which the influence of fluid bed mass on Stage 1 of the<br />
process was investigated. It has been reported that the residence time of feed within the heated zone<br />
strongly influences the extent of degradation and therefore influences the yield and type of compounds<br />
in the product phases. The residence time may be varied by manipulation of certain feedstock and<br />
operational parameters. The residence time of feed particles within the fluid bed is proportional to the<br />
fluid bed volume and is therefore proportional to the fluid bed mass. Moreover, the bed mass also<br />
influences the fluidisation properties of the bed.<br />
In earlier work performed on softwood it was found that the fluid bed mass strongly influenced the<br />
yield of phenols. It was found that larger bed masses resulted in higher yields of phenols as well as a<br />
higher degree of selectivity towards lignin degradation 117 . The purpose of these experiments was to<br />
evaluate the influence of fluid bed mass on hemicellulose pyrolysis in hardwood. To achieve this,<br />
somewhat lower reaction temperatures were employed than were used in the earlier work so as to<br />
prevent lignin degradation and yet still retain a high rate of hemicellulose degradation.<br />
5.4.1 Experiment 1.4A: effect of fluid bed mass on furfuryls production<br />
In Experiment 1.4A, two fluid bed masses were investigated with all other parameters unchanged. The<br />
feed material was pre-pyrolysed at 260 o C in an atmosphere of air in order to increase its susceptibility<br />
to decomposition according to the findings of Experiment 1.2. The operational parameters employed<br />
in Experiment 1.4A are detailed in Table 3.6.1 and the mass balance associated with each trial is<br />
summarised in Appendix 1.<br />
The percentage of wood converted to volatiles was slightly higher for the higher bed mass. This was<br />
expected and is consistent with results obtained from softwood pyrolysis. The yield of the quantified<br />
furfuryls and the total estimated yield of<br />
Figure 5.4.1.1. Yield of furfural and furfuryl alcohol hemicellulose derived compounds are<br />
based on mass of volatile product.<br />
displayed in Figures 5.4.1.1 and 5.4.1.2<br />
0.25<br />
respectively.<br />
Yield (%m/m)<br />
Yield (%m/m)<br />
0.20<br />
0.15<br />
0.10<br />
0.05<br />
0.00<br />
150 300<br />
Fluid Bed Mass (g)<br />
Furfural<br />
Furfural alcohol<br />
Figure 5.4.1.2. Estimated yield of hemicellulose<br />
derived compounds based on the mass of volatile<br />
product.<br />
1.0<br />
0.8<br />
0.6<br />
0.4<br />
0.2<br />
0.0<br />
300 150<br />
Fluid Bed Mass (g)<br />
Examination of Figures 5.4.1.1 and<br />
5.4.1.2 indicate that hemicellulose<br />
pyrolysis is maximal for the lower bed<br />
mass. This suggests that the lower bed<br />
mass, and subsequent lower residence<br />
time, prevents secondary reactions of the<br />
furfuryl products. This result will be<br />
useful in further optimisation work of<br />
furfuryls production. The actual yields of<br />
the hemicellulose derived compounds<br />
were quite low compared to the mass of<br />
substrate volatilised, which indicates that<br />
much of the volatile product is in a<br />
condensable, non-monomeric or tar form.<br />
However, the findings of this experiment<br />
provide more information into the<br />
behaviour of hardwood pyrolysis at low<br />
temperatures and in the presence of<br />
oxygen. The selectivity of the process<br />
towards hemicellulose pyrolysis is<br />
displayed graphically in Figure 5.4.1.3.<br />
51
The effect of fluid bed mass on the<br />
selectivity of the pyrolysis process<br />
towards hemicellulose degradation, as<br />
illustrated in Figure 5.4.1.3, is maximal<br />
for the lower bed mass. For the higher bed<br />
mass, selectivity is poor and in fact<br />
supports the findings from earlier work 117<br />
that the selectivity of the pyrolysis process<br />
towards lignin degradation is maximal<br />
when higher bed masses are used.<br />
Relative Yield<br />
1.00<br />
0.75<br />
0.50<br />
0.25<br />
0.00<br />
Figure 5.4.1.3. Comparison of the relative yield of<br />
phenols and hemicellulose derived compounds.<br />
Lignin Derived Compounds<br />
300 150<br />
Fluid Bed Mass (g)<br />
Hemicellulose Derived Compounds<br />
The cellulose analytical results are summarised in Table 5.4.1.1 for the trials of Experiment 1.4A. Due<br />
to insufficient quantity of material, the analyses were not performed on Trial 1B. The extent of<br />
hemicellulose decomposition was substantially greater for the smaller bed bass. That is, the proportion<br />
of hemicellulose in the residue from Trial 1A (300g bed mass) was 55.82% whereas for Trial 2 (150g<br />
bed mass) it was just 20.06%, a reduction of nearly 54% compared to the original feedstock.<br />
Moreover, the proportions of cellulose in the solid residues were of similar magnitude but in reverse<br />
order. That is, the proportion of cellulose in the residue from Trial 1A (300g bed mass) was only<br />
22.75%, whereas for Trial 2 (150g bed mass) it was 51.37%, an increase of 27% compared to the<br />
original feedstock. A definite reduction in the DP of cellulose was exhibited for both bed masses,<br />
although for the smaller bed mass this did not equate to a corresponding rise in cellulose volatilisation.<br />
Table 5.4.1.1. Comparison of cellulose and hemicellulose proportions in the solid residue from the trials of<br />
experiment 1.4A. 4 Hemicellulose calculated by difference between holocellulose and cellulose.<br />
Trial<br />
Wood<br />
Feed<br />
Cellulose<br />
(by Seifert)<br />
(%)<br />
40.47<br />
33.44<br />
Holocellulose<br />
(by Chlorite)<br />
(%)<br />
78.04<br />
77.09<br />
Holocellulose<br />
( by Hypochlorite)<br />
(%)<br />
77.59<br />
76.73<br />
Hemicellulose 1<br />
(by difference)<br />
(%)<br />
37.57<br />
43.29<br />
Cellulose<br />
Viscosity<br />
(cP)<br />
3.89<br />
2.82<br />
1A<br />
2<br />
22.75<br />
51.37<br />
78.57<br />
71.43<br />
77.69<br />
69.94<br />
55.82<br />
20.06<br />
2.06<br />
2.28<br />
5.4.2 Experiment 1.4B: effect of fluid bed mass on furfuryls production<br />
In Experiment 1.4B, three fluid bed masses were investigated with all other parameters were<br />
unchanged. The feed material was first pyrolysed at 240 o C in the presence of oxygen enriched air in<br />
order to increase its susceptibility to decomposition according to the findings of Experiment 1.2. The<br />
Yield (%m/m)<br />
Figure 5.4.2.1. Yield of furfural and furfuryl alcohol<br />
based on the mass of volatile product.<br />
0.25<br />
0.20<br />
0.15<br />
0.10<br />
0.05<br />
0.00<br />
150 200 250<br />
Fluid Bed Mass (g)<br />
Furfural<br />
Furfuryl alcohol<br />
parameter values of the trials conducted<br />
in Experiment 1.4B are provided in<br />
Table 3.6.1 and the mass balances<br />
associated with each trial are<br />
summarised in Appendix 1.<br />
The amount of wood converted to<br />
volatiles varied little for different bed<br />
masses. This is in contrast to the<br />
findings of Experiment 1.4A in which<br />
the mass of wood converted to volatiles<br />
increased with increasing bed mass.<br />
This may be explained by the lower<br />
52
eaction temperature (270 o C compared to 275 o C) and higher carrier gas flow rate (8 l/min compared to<br />
7 l/min) employed in this experiment compared to Experiment 1.4A. The yields of the quantified<br />
furfuryl compounds and the estimated total yield of hemicellulose derived compounds are displayed in<br />
Figures 5.4.2.1 and 5.4.2.2 respectively.<br />
Examination of Figures 5.4.2.1 and 5.4.2.2 reveals that the influence of fluid bed mass on the yield of<br />
furfuryl compounds was the same for the trials conducted under the conditions of this experiment as<br />
for Experiment 1.4A. That is, the yield of furfuryls was maximal for the lowest bed mass. However,<br />
the overall extent of conversion of hemicellulose decomposition products to monomeric compounds<br />
was low. In Figure 5.4.2.2 the combined yield of furfural and furfuryl alcohol is compared with the<br />
total yield of hemicellulose derived compounds. It is evident from the figure that furfural and furfuryl<br />
alcohol accounted for most of this material. This means that under the conditions employed in<br />
Experiment 1.4B, the selectivity of the decomposition reactions of hemicellulose ultimately favours<br />
formation of furfuryls. This is a very promising result because if the same phenomena could be<br />
maintained with a higher degree of conversion the purity of the product would be quite high, thereby<br />
reducing refining costs.<br />
The influence of fluid bed mass on the<br />
selectivity of the pyrolysis towards<br />
decomposition and subsequent volatile<br />
compound formation of hemicellulose and<br />
lignin is clearly illustrated in Figure 5.13.<br />
That is, the selectivity of the process<br />
towards hemicellulose degradation<br />
increases with decreasing bed mass.<br />
Conversely, the selectivity of the process<br />
towards lignin degradation increases with<br />
increasing bed mass. These findings are in<br />
agreement with those of Experiment 1.4A.<br />
The enrichment of the reaction<br />
atmosphere with additional oxygen in<br />
Experiment 1.4B had the effect of<br />
increasing the selectivity of the process<br />
towards furfural, furfuryl alcohol and β-<br />
methoxyfurfuryl alcohol formation.<br />
Yield<br />
(%m/m)<br />
Relative Yield<br />
Figure 5.4.2.2. Comparison of furfuryls yield with<br />
the yield of all hemicellulose derived products.<br />
(yield based on mass of volatile products)<br />
0.5<br />
0.4<br />
0.3<br />
0.2<br />
0.1<br />
0.0<br />
150 200 250<br />
Fluid Bed Mass (g)<br />
Hemicellulose Derived Compounds<br />
Furfural + Furfuryl alcohol<br />
Figure 5.4.2.3. Comparison of the relative yield of<br />
phenols and hemicellulose derived monomeric<br />
compounds.<br />
1.00<br />
The cellulose analytical results are 0.50<br />
summarised in Table 5.4.2.1 for the trials 0.25<br />
of Experiment 1.4B. For Trial 1A, the 0.00<br />
analyses were not performed due to an<br />
150 200 250<br />
insufficient quantity of residue. The<br />
Fluid Bed Mass (g)<br />
proportion of cellulose in the solid residue<br />
Lignin Derived Compounds Hemicellulose Derived Compounds<br />
varied little with fluid bed mass for the<br />
trials of Experiment 1.4B. Moreover, the extent of cellulose DP reduction was almost identical for all<br />
trials. It would therefore seem that the rate of cellulose decomposition and volatilisation is independent<br />
of fluid bed mass under the conditions of Experiment 1.4B. The proportion of hemicellulose in the<br />
solid residue achieved the maximum for the intermediate bed mass (200g), although the corresponding<br />
mass of volatile compounds was not maximal. This suggests that while the rate of volatile fragment<br />
formation from hemicellulose is high, the corresponding rate of decomposition of these fragments is<br />
low compared to the smaller bed mass (150g).<br />
0.75<br />
53
Table 5.4.2.1. Comparison of cellulose and hemicellulose proportions in the solid residue from the trials of<br />
experiment 1.4B. NA Sample not available. 4 Hemicellulose calculated by difference between holocellulose and<br />
cellulose.<br />
Trial<br />
Wood<br />
Feed<br />
Cellulose<br />
(by Seifert)<br />
(%)<br />
40.47<br />
NA<br />
Holocellulose<br />
(by Chlorite)<br />
(%)<br />
78.04<br />
NA<br />
Holocellulose<br />
( by Hypochlorite)<br />
(%)<br />
77.59<br />
NA<br />
Hemicellulose 1<br />
(by difference)<br />
(%)<br />
37.57<br />
NA<br />
Cellulose<br />
Viscosity<br />
(cP)<br />
3.89<br />
NA<br />
1B<br />
2<br />
3<br />
43.99<br />
43.21<br />
40.80<br />
73.72<br />
68.19<br />
72.10<br />
72.27<br />
66.77<br />
71.34<br />
29.73<br />
24.98<br />
31.30<br />
2.24<br />
2.20<br />
2.23<br />
In conclusion, the extent of hemicellulose pyrolysis and the corresponding formation of furfuryl<br />
compounds were significantly influenced by fluid bed mass for both sets of conditions investigated in<br />
Experiment 1.4. It would seem that smaller bed masses favour furfuryl production whereas larger bed<br />
masses favour lignin decomposition and subsequent phenolic compound formation. This finding is in<br />
agreement with those obtained from the low temperature pyrolysis of softwood 118 .<br />
5.5 Experiment 1.5: effect of fluid bed particle size on furfuryls<br />
production<br />
The objective of this experiment was to determine the effect of fluid-bed particle size on furfuryl<br />
compound production from the low temperature fast pyrolysis of hardwood. The fluid bed particle size<br />
influences the fluidisation and heat transfer properties of the bed and may therefore influence the<br />
pyrolysis process. In this experiment, the<br />
fluid bed particle size range was varied<br />
with all other parameters unchanged. The<br />
differences between the products of each<br />
trial could then be ascribed to the<br />
influence of fluid-bed particle size range.<br />
Two particle size ranges were selected for<br />
the sand, 150-250 and 250-310 μm. The<br />
reaction temperature was 270 o C, in order<br />
to minimise lignin degradation yet still<br />
maintain an appreciable rate of<br />
hemicellulose degradation. The feed<br />
material was pre-pyrolysed at low<br />
temperature (under conditions equivalent<br />
to those employed for the pre-pyrolysis in<br />
Experiment 1.4B) in order to increase its<br />
susceptibility to thermochemical<br />
decomposition according to the findings<br />
of Experiment 1.2. The parameter values<br />
that were employed for the trials of<br />
Experiment 1.5 are provided in Table<br />
3.6.1 and the mass balances associated<br />
with each trial are summarised in<br />
Appendix 1.<br />
Yield (%n/m)<br />
Yield (%m/m)<br />
0.5<br />
0.4<br />
0.3<br />
0.2<br />
0.1<br />
0<br />
Figure 5.5.1. Yield of furfural and furfuryl alcohol<br />
based on mass of volatile product.<br />
150-250 250-310<br />
Fluid Bed Particle Size Range (microns)<br />
Furfural<br />
Furfuryl alcohol<br />
Figure 5.5.2. Comparison of furfuryls yield with yield<br />
of all hemicellose derived products (yield based on<br />
mass of volatile products)<br />
0.5<br />
0.4<br />
0.3<br />
0.2<br />
0.1<br />
0<br />
150-250 250-310<br />
Fluid Bed Particle Size Range (microns)<br />
Furfural + Furfuryl alcohol<br />
Hemicellulose Derived Compounds<br />
54
The total mass of volatile compounds was quite similar for both particle size ranges investigated. The<br />
effect of fluid bed particle size on the yield of furfural and furfuryl alcohol is displayed in Figure 5.5.1.<br />
It is apparent from examination of this figure that the yield of furfural and furfuryl alcohol was only<br />
weakly influence by fluid bed particle size. The absolute yields of these compounds were quite low<br />
and ranged between 0.024-0.032%. The selectivity of the process towards furfuryl formation from<br />
hemicellulose was quite high for both fluid bed particle size ranges, as illustrated in Figure 5.5.2.<br />
Therefore it may be concluded that dehydration and other furfuryl forming reactions, as opposed to<br />
anhydrosugar formation and fragmentation reactions, predominate under the conditions employed in<br />
this experiment. Moreover, the corresponding estimated total yield of phenols was substantially less<br />
than that of the furfuryls, which indicates that the selectivity of the process towards hemicellulose<br />
degradation under these conditions is quite good. The extent of feed material converted to volatiles<br />
was not reflected in the concentration of compounds detectable by GCMS. Therefore, while the rate of<br />
hemicellulose decomposition was high for all trials, the corresponding rate of monomeric compound<br />
formation from the volatilised material was low, which suggests that much of the liquid product<br />
consisted of oligomeric material, or tar. The cellulose analytical results are summarised in Table 5.5.1<br />
for the trials of Experiment 1.5. For Trial 2A, the analyses were not performed due to an insufficient<br />
quantity of residue.<br />
Table 5.5.1. Comparison of cellulose and hemicellulose proportions in the solid residue from the trials of<br />
experiment 1.5. NA Sample not available. 4 Hemicellulose calculated by difference between holocellulose and<br />
cellulose.<br />
Trial<br />
Wood<br />
Feed<br />
Cellulose<br />
(by Seifert)<br />
(%)<br />
40.47<br />
NA<br />
Holocellulose<br />
(by Chlorite)<br />
(%)<br />
78.04<br />
NA<br />
Holocellulose<br />
( by Hypochlorite)<br />
(%)<br />
77.59<br />
NA<br />
Hemicellulose 1<br />
(by Difference)<br />
(%)<br />
37.57<br />
NA<br />
Cellulose<br />
Viscosity<br />
(cP)<br />
3.89<br />
NA<br />
1<br />
2 B<br />
45.91<br />
43.99<br />
71.58<br />
73.72<br />
68.64<br />
72.27<br />
25.67<br />
29.73<br />
2.10<br />
2.24<br />
The data presented in Table 5.5.1 reveal that cellulose decomposition was not significantly influenced<br />
by fluid bed particle size for pyrolysis conducted under the condition of Experiment 1.5. That is, the<br />
proportion of cellulose in the solid residue and the extent of its depolymerisation were very similar for<br />
both particle size ranges. There was significant decomposition of hemicellulose evidenced by the low<br />
proportions in the solid residues compared to the starting material.<br />
In conclusion, the magnitude of influence of fluid bed particle size range on the process was relatively<br />
small, at least compared to that of reaction temperature and carrier gas composition. The nature of the<br />
influence was similar to that observed for softwoods, although the degree of influence was less. The<br />
extent of hemicellulose decomposition was high although the corresponding formation of low<br />
molecular weight condensable compounds was low.<br />
5.6 Experiment 1.6: effect of carrier gas composition on furfuryls<br />
production<br />
In this experiment, a number of trials were conducted at 275 o C in which the proportion of oxygen in<br />
the carrier gas was varied. Oxygen is known to catalyse various types of depolymerisation reactions<br />
within wood, such as transglycosylation in carbohydrates and aryl-ether cleavage within lignin. The<br />
objective of this experiment was to determine the influence of molecular oxygen on pyrolysis<br />
conducted under Stage 1 type conditions and on the yield of furfuryls. The reaction temperature<br />
selected is below that in which the rate of lignin pyrolysis is significant but in which the rate of<br />
hemicellulose pyrolysis is high. The feed material was pre-pyrolysed at low temperature in order to<br />
increase its susceptibility to thermochemical decomposition according to the findings of Experiment<br />
55
1.2. The parameter values employed in Experiment 1.6 are summarised in Chapter 3.6 the mass<br />
balances associated with each trial are summarised in Appendix 1.<br />
The extent of wood conversion to volatile products increased slightly as the proportion of oxygen in<br />
the carrier gas increased, as expected based on the catalytic depolymerisation properties of molecular<br />
under pyrolysis conditions. The yield<br />
Figure 5.6.1. Yield of furfural and furfuryl alcohol of the quantified furfuryl compounds<br />
based on the mass of volatile product.<br />
and the estimated yield of monomeric<br />
0.4<br />
hemicellulose derived compounds are<br />
0.3<br />
displayed in Figures 5.6.1 and 5.6.2<br />
respectively. From examination of<br />
0.2<br />
Figure 5.6.1, it can be seen that yield of<br />
0.1<br />
furfural increased substantially with<br />
0.0<br />
increasing oxygen content in the<br />
43 20 14 0 reaction atmosphere whereas the<br />
corresponding yield of furfuryl alcohol<br />
% Oxygen in Carrier Gas<br />
decreased.<br />
Yield (%m/m)<br />
Furfural<br />
Furfuryl alcohol<br />
In contrast to the yield of furfural, the overall yield of monomeric hemicellulose derived compounds<br />
substantially decreased as the oxygen content in the carrier gas increased. Examination of the<br />
integration data in Appendix 5 reveals that the compound, levoglucosan, is responsible for the latter<br />
observation. Levoglucosan is normally produced in large quantities from both cellulose and<br />
hemicellulose at temperatures between<br />
about 400-600 o C. Its formation below<br />
300 o C is seldom reported. However,<br />
for the trials of Experiment 1.6 it was<br />
produced in quite high yield, roughly<br />
1% based on the mass of wood<br />
processed. This result is probably a<br />
consequence of the pre-pyrolysis. That<br />
is, the polysaccharides had been<br />
depolymerised to such an extent that<br />
further pyrolysis under oxygen lean<br />
conditions favoured levoglucosan<br />
Yield (%m/m)<br />
8<br />
6<br />
4<br />
2<br />
0<br />
Figure 5.6.2. Comparison of furfuryls yield with<br />
yield of all hemicellulose derived products (yield<br />
based on mass of volatile product)<br />
43 20 14 0<br />
Furfural + Furfuryl alcohol<br />
% Oxygen in Carrier Gas<br />
Hemicellulose Derived Compounds<br />
formation rather than further depolymerisation. Levoglucosan is a valuable chemical in its own right<br />
and so this finding may be of potential interest in any future work. The increasing yield of monomeric<br />
hemicellulose derived compounds with decreasing oxygen content may also be caused by free radical<br />
initiated re-polymerisation reactions within the volatile product. This phenomenon has been reported<br />
by other workers 134 .<br />
Where sufficient quantities of reside were available, cellulose analyses were performed and are<br />
summarised in Table 5.6.1.<br />
56
Table 5.6.1. Comparison of cellulose and hemicellulose proportions in the solid residue from the trials of<br />
experiment 1.6. 1 Hemicellulose calculated by difference between holocellulose and cellulose.<br />
Trial<br />
Wood<br />
Feed<br />
Cellulose<br />
(by Seifert)<br />
(%)<br />
40.47<br />
33.44<br />
Holocellulose<br />
(by Chlorite)<br />
(%)<br />
78.04<br />
77.09<br />
Holocellulose<br />
( by Hypochlorite)<br />
(%)<br />
77.59<br />
76.73<br />
Hemicellulose 1<br />
(by Difference)<br />
(%)<br />
37.57<br />
NA<br />
Cellulose<br />
Viscosity<br />
(cP)<br />
3.89<br />
2.82<br />
1<br />
2<br />
44.84<br />
22.75<br />
72.87<br />
71.43<br />
70.29<br />
69.94<br />
25.67<br />
29.73<br />
2.21<br />
2.28<br />
For Trials 1 and 2, the proportion of oxygen in the carrier gas was 43 and 20% respectively. Therefore,<br />
the rate of cellulose volatilisation was inversely proportional to the oxygen content of the carrier gas<br />
whereas the corresponding cellulose DP followed the reverse pattern. In contrast, the extent of<br />
hemicellulose degradation increased with increasing oxygen content in the carrier gas. This peculiar<br />
finding indicates that the type of influence of oxygen on the pyrolysis of hardwood components varies<br />
considerably.<br />
In conclusion, the presence of oxygen in the carrier gas resulted in a modest increase in furfuryl<br />
compound formation for the conditions employed in Experiment 1.6. Moreover, as the concentration<br />
of oxygen in the carrier gas increased, the extent of hemicellulose decomposition increased<br />
significantly whereas the corresponding extent of cellulose decomposition decreased significantly. It<br />
would therefore seem that hemicellulose can be selectively degraded by use of an oxidizing<br />
atmosphere at low pyrolysis temperatures. However, much of the volatile product was in a nonmonomeric,<br />
or oligomeric, form and therefore was not detectable by GCMS. Levoglucosan was<br />
produced in significant yields when the oxygen concentrations were lowest, probably as a result of the<br />
pre-pyrolysis.<br />
57
Chapter 6: Influence of selected<br />
operational parameters on stage 2 of the<br />
pyrolysis process<br />
This Chapter summarises the results of optimisation of Stage 2 of the pyrolysis process for phenols<br />
production. The second stage of the process is characterised by temperatures within the range of 280-<br />
325 o C. Stage Within this temperature range, under fast pyrolysis conditions, the rate of lignin pyrolysis<br />
is substantially higher than that of cellulose, especially with incorporation of oxygen in the carrier gas.<br />
A series of experiments were conducted in which Stage 2 type conditions were investigated in order to<br />
determine optimum conditions for phenols production from pyrolysis of Australian hardwood.<br />
The chromatographic peak areas obtained from GCMS analysis of the condensable pyrolysis product<br />
from each trial were standardised according to the expression 5.1. In order to evaluate actual Stage 2<br />
phenomena, the feed material from each experiment was first pyrolysed under Stage 1 type conditions.<br />
6.1 Experiment 2.1: effect of carrier gas composition on phenols<br />
production<br />
It was found from earlier work 117 that inclusion of oxygen in the carrier gas significantly increased the<br />
yield of monomeric phenols from the low-temperature fast pyrolysis of softwood. In this experiment, a<br />
number of trials were conducted at 290 o C in which the proportion of oxygen in the carrier gas was<br />
varied. The reaction temperature selected is within the range where the rate of lignin pyrolysis is high<br />
Yield (%m/m)<br />
Yield (%m/m)<br />
5<br />
4<br />
3<br />
2<br />
1<br />
0<br />
0.8<br />
0.6<br />
0.4<br />
0.2<br />
0<br />
Figure 6.1.1. Yield of main phenols based on the<br />
mass of volatile product.<br />
20 10 0<br />
% Oxygen in Carrier Gas<br />
Guaiacol Phenol Vanillin Syringol Syringaldehyde<br />
Figure 6.1.2. Absolute yield of the main phenols.<br />
20 10 0<br />
% Oxygen in Carrier Gas<br />
Guaiacol Phenol Vanillin Syringol Syringaldehyde<br />
whereas that of cellulose is low. The<br />
objective of this experiment was to<br />
evaluate the influence of oxygen in the<br />
reaction atmosphere on the pyrolytic<br />
production of phenols from hardwood.<br />
The experiment was investigating<br />
Stage 2 of a two stage process and<br />
therefore the feed material was first<br />
pyrolysed under Stage 1 type<br />
conditions. The operational parameter<br />
values employed in Experiment 2.1 are<br />
provided in Tale 3.6.2 and the mass<br />
balances associated with each trial are<br />
summarised in Appendix 2.<br />
The effect of carrier gas composition<br />
on the yield of the main phenolic<br />
compounds, based of mass of feed<br />
converted to volatiles and on actual dry<br />
mass of feed processed, is displayed<br />
graphically in Figures 6.1.1 and 6.1.2<br />
respectively. The yield of the main<br />
phenols increased substantially with<br />
increasing molecular oxygen<br />
concentration in the carrier gas, a result<br />
also obtained from softwood.<br />
58
In Figure 6.1.3, the estimated total yield of phenols, based on the mass of volatile product, is compared<br />
with the combined yield of the major phenols. The five major phenols in the volatile product<br />
accounted for more than 50% of the total phenolic yield. The absolute yield of monomeric phenols is<br />
modest but definitely promising given that conventional higher-temperature (400-600 o C) pyrolysis<br />
processes do not produce substantially more free phenols.<br />
For all trials of Experiment 2.1, except<br />
Trial 1A, insufficient solid residue was<br />
available for cellulose analysis. The<br />
proportion of cellulose in Trial 1A was<br />
38.58%, which indicates that the<br />
selectivity of the process toward lignin<br />
degradation under these conditions is<br />
not high. This low selectivity is also<br />
reflected in the relatively large amount<br />
of polysaccharide derived material<br />
identified in the GCMS analysis of the<br />
liquid product. In contrast, for pyrolysis<br />
of radiata pine, the selectivity of the<br />
Yield (%m/m)<br />
Figure 6.1.3. Comparison of total phenolic yield with<br />
the yield of the main phenols (yield based on mass<br />
of volatile product)<br />
10<br />
8<br />
6<br />
4<br />
2<br />
0<br />
20 10 0<br />
% Oxygen in Carrier Gas<br />
Main Phenols<br />
Total Phenolic Yield<br />
process toward lignin degradation is quite high 117 . The difference in specificity of the process towards<br />
the different wood types may be a consequence of the pre-pyrolysis employed in this study, a step<br />
which was not employed with radiata pine.<br />
In conclusion, the yield of low molecular weight phenols was strongly correlated with oxygen<br />
concentration in the carrier gas for pyrolysis of pre-pyrolysed feed at 290 o C. With respect to phenols<br />
yield, pre-pyrolysis may not offer any advantage because similar results were obtained from softwood<br />
pyrolysis without pre-pyrolysis. Moreover, the selectivity of the process towards lignin decomposition<br />
was substantially greater for the softwood pyrolysis (where no pre-pyrolysis was used) compared to<br />
hardwood pyrolysis (where pre-pyrolysis was used). However, as the decomposition of lignin is Stage<br />
2 of the overall process, the results obtained from hardwood more truly represent the results of the<br />
process in its entirety. That is, from the perspective of Stage 2, Stage 1 is a pre-pyrolysis treatment<br />
anyway. Therefore, the selectivity of the process toward lignin may be improved by selecting prepyrolysis<br />
(or Stage 1) conditions that do not significantly depolymerise cellulose.<br />
6.2 Experiment 2.2: effect of reaction temperature on phenols<br />
production<br />
Temperature is perhaps the single most important parameter in pyrolysis. Two experiments were<br />
performed to investigate the influence of reaction temperature on phenols yield. In each experiment,<br />
different reaction conditions were investigated.<br />
6.2.1 Experiment 2.2A: effect of reaction temperature on phenols production<br />
The objective of this experiment was to determine the effect of reaction temperature on the yield of<br />
phenolic compounds from pyrolysis of residues obtained from low temperature thermochemical<br />
processing. A large quantity of raw feed material was pre-pyrolysed under Stage 1 type yielding<br />
sufficient residue to provide for the trials at higher temperatures. The temperatures investigated in<br />
Experiment 2.2A ranged between 290-305 o C in 5 o C increments. The actual parameters used in this<br />
experiment are displayed in Table 3.6.2 of the methodology.<br />
59
Yield (%m/m)<br />
6<br />
5<br />
4<br />
3<br />
2<br />
1<br />
0<br />
Figure 6.2.1.1. Yield of main phenols based on<br />
mass of volatile product.<br />
290 295 300 305<br />
Temperature (oC)<br />
Guaiacol Isoeugenol Vanillin Syringol Syringaldehyde<br />
Details of the mass balance associated<br />
with each trial are summarised in<br />
Appendix 2. The extent of volatile<br />
compound formation varied little over<br />
the temperature range investigated. The<br />
influence of temperature on the yield of<br />
the five main phenols is displayed<br />
graphically in Figure 6.2.1.1.<br />
Examination of Figure 6.2.1.1 reveals<br />
that the yield of main phenols, after<br />
achieving a maximum at 295 o C,<br />
decreased over the temperature range<br />
investigated. This is consistent with the<br />
observation that the mass of feed actually volatilised also decreased with temperature. This<br />
observation was not expected as increasing reaction temperature normally results in increased<br />
conversion. It is possible that under the conditions of this experiment, condensation and tar forming<br />
reactions, catalysed by molecular oxygen, a di-radical, began to occur within the lignin at the higher<br />
temperatures, thereby causing it to become more refractive resulting in a reduction of both mass<br />
converted to volatiles and yield of monomeric phenols. Evidence for this hypothesis is based on the<br />
fact that the rate of decrease is higher for the phenols yield than it is for the overall volatiles yield, an<br />
expected phenomenon based on this hypothesis. However, this phenomenon was not observed in<br />
softwood pyrolysis 117 .<br />
The yield, based on mass of feed converted to volatiles, of individual phenolic compounds ranged<br />
between 0 to 2.25%. The corresponding absolute yield ranged between and 0 to 0.366% respectively<br />
(refer to Appendix 3 for actual quantification data). Some of these figures were quite high given the<br />
overall complexity of the product and the low proportions of feed actually converted. The influence of<br />
reaction temperature on the combined<br />
yield of the main phenols and the total<br />
estimated phenolic yield are displayed in<br />
Figure 6.2.1.2. The complexity of the<br />
phenolic product increased with<br />
increasing temperature, as indicated by<br />
the decreasing proportion accounted for<br />
by the main phenols. The maximum<br />
yield of monomeric phenols occurred at<br />
295 o C and was approximately 11% of<br />
the volatile product, or 1.8% based on<br />
the oven-dried mass of wood processed.<br />
With further reprocessing under similar<br />
conditions it is possible that an even<br />
higher yield could be obtained, as<br />
occurred with the furfuryls in<br />
Experiment 1.2. The selectivity of the<br />
process towards lignin degradation was<br />
also maximal at 295 o C, as is evident<br />
from examination of Figure 6.2.1.3. In<br />
conjunction with the results of<br />
Experiment 2.1, these results indicate<br />
that the extent of lignin degradation, and<br />
subsequent phenolic compound<br />
formation, is dependent on interaction<br />
between reaction temperature and<br />
molecular oxygen concentration in the<br />
carrier gas.<br />
Yield (%m/m)<br />
Relative Yield<br />
Figure 6.2.1.2. Comparison of the total phenolic<br />
yield with the yield of the main phenols (yield based<br />
on mass of volatile product)<br />
12<br />
10<br />
8<br />
6<br />
4<br />
2<br />
0<br />
290 295 300 305<br />
Temperature (oC)<br />
1.0<br />
0.8<br />
0.6<br />
0.4<br />
0.2<br />
0.0<br />
Main Phenols<br />
Total Phenolic Yield<br />
Figure 6.2.1.3. Comparison of the relative yield of<br />
phenols and carbohydrate derived compounds<br />
290 295 300 305<br />
Temperature (oC)<br />
Carbohydrate Derived Products<br />
Phenols<br />
60
The cellulose analytical data are displayed Table 6.2.1.1 for the trials of Experiment 2.2A, except for<br />
Trials 1B and 3B where insufficient residue were available. It is evident tat under the conditions<br />
employed in Experiment 2.2A, the influence on Stage 2 type conditions on the residual hemicellulose<br />
in the feed was quite small. However, the corresponding cellulose content decreased as a result of the<br />
Stage 2 type treatments, although the actual cellulose DP varied little.<br />
Table 6.2.1.1. Comparison of cellulose and hemicellulose proportions in the solid residue from the trials of<br />
experiment 2.2A. 4 Hemicellulose calculated by difference between holocellulose and cellulose.<br />
Trial<br />
Wood<br />
Feed<br />
Cellulose<br />
(by Seifert)<br />
(%)<br />
40.47<br />
50.11<br />
Holocellulose<br />
(by Chlorite)<br />
(%)<br />
78.04<br />
79.03<br />
Holocellulose<br />
( by Hypochlorite)<br />
(%)<br />
77.59<br />
78.54<br />
Hemicellulose 1<br />
(by Difference)<br />
(%)<br />
37.57<br />
28.92<br />
Cellulose<br />
Viscosity<br />
(cP)<br />
3.89<br />
2.19<br />
1A<br />
2<br />
3A<br />
4<br />
38.58<br />
41.91<br />
44.58<br />
43.67<br />
66.32<br />
64.96<br />
-<br />
-<br />
65.32<br />
64.48<br />
-<br />
-<br />
27.74<br />
23.05<br />
-<br />
-<br />
2.07<br />
2.09<br />
-<br />
-<br />
In conclusion, the temperatures selected for the reprocessing of the residue from a low temperature<br />
pyrolysis were designed to maximise lignin degradation and simultaneously minimise cellulose<br />
degradation. That is, the rate of lignin pyrolysis at the temperatures investigated is known to be<br />
considerably higher than that of cellulose pyrolysis. It was found that maximum phenolic compound<br />
formation occurred at 295 o C. The absolute yield of phenols obtained at this temperature was still<br />
relatively low but promising, especially with the possibility of further processing, something that could<br />
not be achieved in this study due to the limited availability of feed material. At this temperature, the<br />
extent of cellulose decomposition was minimal based on the yield of polysaccharide derived products<br />
present in the liquid product, although the proportion of cellulose in the residue decreased, indicating<br />
that some cellulose decomposition occurred that did not result in monomeric condensable compound<br />
formation. This material is likely to be oligomeric condensation products or short fragments of<br />
cellulose, both of which are not detectable by GCMS.<br />
6.2.2 Experiment 2.2B: effect of reaction temperature on phenols production<br />
The objective of this experiment, as for Experiment 2.2A, was to determine the effect of reaction<br />
temperature on the yield of phenolic compounds from pyrolysis conducted under Stage 2 type<br />
conditions. In this experiment, a different set of operational parameters to Experiment 2.2A were<br />
investigated in order to further understand the interaction of temperature and processing conditions on<br />
phenols yield. For example, in this experiment, the proportion of oxygen in the carrier gas was reduced<br />
compared to Experiment 2.2A. A large<br />
Yield (%m/m)<br />
0.4<br />
0.3<br />
0.2<br />
0.1<br />
0<br />
Figure 6.2.2.1. Yield of main phenols based on<br />
mass of volatile product.<br />
290 295 300 305 315 325<br />
Temperature (oC)<br />
Eugenol Isouegenol Vanillin Syringol Syringaldehyde<br />
quantity of raw feed material was prepyrolysed<br />
under Stage 1 type conditions<br />
to provide sufficient residue for the trials<br />
of this experiment. The temperatures<br />
investigated ranged between 290-325 o C<br />
in mainly 5 o C increments. The<br />
operational parameters employed in this<br />
experiment are displayed in Table 3.6.2<br />
of the methodology and the mass<br />
balances associated with each trial are<br />
summarised in Appendix 2.<br />
61
The proportion of feed converted to volatiles increased substantially over the temperature range<br />
investigated, in contrast to the proportion of free water volatilised from the feed, which did not<br />
increase appreciably. The influence of temperature on the yields of the main phenolic products are<br />
displayed in Figure 6.2.2.1.<br />
Yield (%m/m)<br />
1.0<br />
0.8<br />
0.6<br />
0.4<br />
0.2<br />
0.0<br />
Figure 6.2.2.2. Comparison of the total phenolic<br />
yield with the yield of the main phenols (yield based<br />
on mass of volatile product)<br />
290 295 300 305 315 325<br />
Temperature (oC)<br />
Main Phenols<br />
Total Phenolic Yield<br />
The yields of the main phenols were<br />
generally quite low and were much lower<br />
than those obtained in Experiment 2.2A.<br />
The estimated total phenolic compound<br />
yield is compared with the combined<br />
yield of the main phenols in Figure<br />
6.2.2.2. Although the yields were low in<br />
this experiment, the complexity of the<br />
phenolic mixture was quite high, as<br />
evidenced by the relatively low<br />
proportion accounted for by the main<br />
phenols. In Experiment 2.2A, the yields<br />
of quantified phenols were considerably<br />
higher over a similar temperature range. This variation was most likely due to the much higher levels<br />
of oxygen in the reaction atmosphere in Experiment 2.2A compared to this experiment. It has been<br />
reported from an earlier study that for softwood, oxygen catalyses phenolic compound formation under<br />
relatively mild pyrolysis conditions, such as those employed in this study 117 . It is apparent based on<br />
comparison of the results of Experiment 2.2A and 2.2B that this finding applies to hardwoods as well.<br />
The selectivity of the process towards lignin degradation was similar for both Experiments 2.2A and<br />
2.2B, as is evident from comparison of Figures 6.2.1.3 and 6.2.2.3, although the magnitude of<br />
degradation was substantially higher in the former. Therefore, it would seem that the incorporation of<br />
oxygen in the carrier gas catalyses both lignin and cellulose degradation when the feed material has<br />
been pre-pyrolysed. In the absence of pre-pyrolysis the presence of oxygen in the reaction atmosphere<br />
results in high selectivity towards lignin degradation.<br />
The cellulose analytical data are displayed in Table 6.2.2.1 for the trials of Experiment 2.2B, except<br />
for Trials 1B and 5B where insufficient<br />
residue were available. The proportion of Figure 6.2.2.3. Comparison of the relative yield of<br />
phenols and carbohydrate derived compounds.<br />
cellulose in the solid residue generally<br />
1.00<br />
increased with temperature between 290<br />
and 325 o C. As expected, the DP of 0.75<br />
cellulose decreased steadily over the same<br />
0.50<br />
temperature range. The proportion of<br />
hemicellulose in the solid residue from the 0.25<br />
trials conducted at 325 o C was only 8.63%.<br />
0.00<br />
This would indicate that under the more<br />
290 295 300 305 315 325<br />
extreme conditions of Stage 2,<br />
Temperature (oC)<br />
hemicellulose pyrolysis becomes rapid.<br />
Relative Yield<br />
Carbohydrate Derived Compounds<br />
Phenols<br />
In conclusion, the maximum yield of phenols occurred at 300 o C for Experiment 2.2B. The presence of<br />
relatively low amounts of oxygen in the reaction atmosphere of Experiment 2.2B resulted in<br />
significantly lower yields of phenols compared to Experiment 2.2A where higher oxygen<br />
concentrations were employed. The actual molecular oxygen concentrations in the carrier gas for<br />
Experiments 2.2A and B were 20 and 4.5% respectively.<br />
62
Table 6.2.2.1. Comparison of cellulose and hemicellulose proportions in the solid residue from the trials of<br />
experiment 2.2B. 4 Hemicellulose calculated by difference between holocellulose and cellulose.<br />
Trial<br />
Wood<br />
Feed<br />
Cellulose<br />
(by Seifert)<br />
(%)<br />
40.47<br />
-<br />
Holocellulose<br />
(by Chlorite)<br />
(%)<br />
78.04<br />
-<br />
Holocellulose<br />
( by Hypochlorite)<br />
(%)<br />
77.59<br />
-<br />
Hemicellulose 1<br />
(by Difference)<br />
(%)<br />
37.57<br />
-<br />
Cellulose<br />
Viscosity<br />
(cP)<br />
3.89<br />
-<br />
1A<br />
2<br />
3<br />
5A<br />
6<br />
36.88<br />
43.34<br />
44.86<br />
43.67<br />
45.94<br />
68.57<br />
70.04<br />
66.54<br />
70.27<br />
54.57<br />
68.48<br />
68.68<br />
66.64<br />
69.06<br />
54.71<br />
31.69<br />
26.70<br />
21.68<br />
26.60<br />
8.63<br />
2.56<br />
2.39<br />
2.36<br />
2.16<br />
2.12<br />
6.3 General conclusions<br />
The incorporation of oxygen in the reaction atmosphere below 300 o C resulted in a 300% increase in<br />
low molecular weight phenols yield compared to reaction atmosphere devoid of oxygen. The oxygen<br />
was introduced as air. Therefore, from an economic perspective, the utilisation of air not only results<br />
in a substantial increase in phenols yield but is also much cheaper to supply. That is, provision of an<br />
un-reactive atmosphere is much more costly than provision of air.<br />
Overall, the monomeric phenolic yield was low and probably not economically viable. However, the<br />
solid-to-liquid conversion rates were satisfactory, indicating that the low yields were most likely due<br />
to the low rate of liberation of monomeric phenols from primary decomposition products resulting<br />
from the low temperatures and short residence times employed. This problem may be minimised by<br />
reactor design modification or by incorporation of cracking catalysts above the reaction bed. The latter<br />
approach has been applied successfully by other researchers in a two-stage process where oil vapours<br />
are conveyed from the reactor into a heated vessel containing a permeable catalyst matrix.<br />
63
Chapter 7: Optimisation of essential oil<br />
recovery processes<br />
This chapter summarises the results obtained from optimisation of Eucalyptus oil recovery techniques.<br />
The recovery efficiency achieved by industrial Eucalyptus oil extraction processes is not high. The<br />
purpose of these experiments was to optimise oil recovery through incorporation of relatively simple<br />
modifications to a bench scale version of a commercial type extraction process. The actual quantity of<br />
cineole in the leaves that were tested ranged between 1 and 3 % on a fresh green leaf basis. The leaves<br />
of this species therefore possessed an average to below average cineole component. The actual<br />
quantity of oil present within the leaves was not of interest in this research except to enable the<br />
efficiency of different oil recovery techniques to be evaluated. More important to the research was to<br />
determine which techniques result in maximum oil recovery. These techniques could then be<br />
retrofitted into existing industrial processes in order to improve oil yield without the requirement of<br />
completely new technology or large capital costs.<br />
7.1 Experiment 1: evaluation of the recovery efficiency of various<br />
techniques<br />
In this experiment, four condenser systems were evaluated for the recovery of oil from conventional<br />
steam distillation of Eucalyptus leaves. One system consisted of a simple condenser, as is used in most<br />
commercial plants. The other three systems involved condensation using a Dean-Stark Apparatus, a<br />
Nikers-Liken apparatus and separation of oil in pentane. The experimental data for Experiment 1 is<br />
summarised in Appendix 6. The mean proportion of cineole, expressed as a percentage, recovered<br />
from the leaves by each collection method is displayed in Figure 7.1.<br />
It can be seen from examination if Figure 7.1.1 that simple distillation, such as that currently employed<br />
by the Eucalyptus industry of central Victoria, recovers little more than half of the cineole present<br />
Figure 7.1.1. Proportion of cineole, based<br />
on total present within leaves, recovered with<br />
different product recovery techniques.<br />
100<br />
80<br />
60<br />
40<br />
20<br />
0<br />
Simple Dean-Stark<br />
Condensation Apparatus<br />
% Total Cineole<br />
Simple<br />
Condensation<br />
into Pentane<br />
Oil Recovery Technique<br />
Likens-<br />
Nickerson<br />
Apparatus<br />
within the leaves. Distillation with a<br />
Dean-Stark type apparatus enabled<br />
the recovery of slightly more cineole<br />
but not significantly more. The best<br />
recovery procedure was achieved<br />
using a Likens-Nickerson type<br />
system. This system resulted in 23.4%<br />
increase in the overall amount of<br />
cineole collected, or more than 75%<br />
of the cineole present within the<br />
leaves. These results were much the<br />
same for alpha-pinene.<br />
It was also important to evaluate the influence of the recovery technique on the quality of oil actually<br />
recovered. Oil quality, and hence oil value, is directly proportional to the cineole content. The mean<br />
proportion of cineole in the oils recovered by the various collection techniques that were investigated<br />
is displayed in Figure 7.1.2. It can be seen from examination of Figure 7.1.2 that simple distillation<br />
resulted in the lowest quality oil. The three modified techniques were all quite similar. The Likens-<br />
Nickerson system provided the best product with cineole accounting for 45% of the oil collected, an<br />
increase of 63% compared to simple steam distillation. Therefore, the Likens-Nickerson collection<br />
system resulted in the best product, both quantitatively and qualitatively.<br />
64
To operate a Likens-Nickerson type recovery unit on a commercial scale would not be difficult. The<br />
only additional requirement, apart from the modified condenser system, is a re-distillation unit for the<br />
% Cineole<br />
50<br />
40<br />
30<br />
20<br />
10<br />
0<br />
Figure 7.1.2. Proportion of cineole in oil recovered<br />
by different techniques.<br />
Dean-Stark<br />
Apparatus<br />
Simple<br />
Distillation<br />
Pentane in<br />
Separation<br />
Funnel<br />
Oil Recovery Technique<br />
Nikers-Liken<br />
Apparatus<br />
separation of the Eucalyptus oil from<br />
the pentane. The additional energy<br />
requirements of this system are small<br />
due to the low latent heat of<br />
vaporisation and low boiling point of<br />
pentane. Such systems are utilised by<br />
the dry cleaning industry and are<br />
simple, reliable and compact. This<br />
system would therefore be relatively<br />
easy to adapt to current oil recovery<br />
systems for operation in remote<br />
places, such as those typical for<br />
agroforestry resources. Finally,<br />
pentane itself is cheap and reusable.<br />
Alternatively, hexane or other higher<br />
hydrocarbons could be employed in regions where the ambient temperature is likely to exceed the<br />
boiling point of pentane.<br />
7.2 Experiment 2: evaluation of the efficiency of various<br />
modifications to the steam distillation process<br />
The purpose of Experiment 2 was to evaluate the effect of cohobation and simple solvent extraction<br />
with pentane on oil yield and quality. Cohobation involves reusing the condensed steam, rather than<br />
discarding it, in order to minimise oil loss through solubilisation in water. The experimental data for<br />
Experiment 2 is summarised in Appendix 7. The actual steam distillation performed was identical for<br />
all trials. There were four parameter combinations:<br />
• Product condensed with simple condenser<br />
• Product collected in pentane<br />
• Condensed steam returned to boiler<br />
• Condensed steam returned to boiler, product collected in pentane<br />
% Total Cineole<br />
Figure 7.2.2. Proportion of cineole, based on total<br />
present within leaves,recovered with different<br />
product recovery techniques<br />
100<br />
80<br />
60<br />
40<br />
20<br />
0<br />
No<br />
Cohobation,<br />
Simple<br />
Condenser<br />
No Cohobation,<br />
Cohobation, Simple<br />
Oil Collected Condenser<br />
in Pentane<br />
Distillation Technique<br />
Cohobation,<br />
Oil Collected<br />
in Pentane<br />
The mean proportion of cineole<br />
recovered, as a percentage of the total<br />
cineole content in the leaves, is<br />
displayed in Figure 7.2.2. The most<br />
efficient recovery technique was<br />
cohobation with product collected in<br />
pentane. This technique resulted in<br />
doubling of recovery efficiency. The<br />
influence of cohobation on oil yield was<br />
much greater than that of product<br />
collection in pentane. Examination of<br />
Figure 7.2.2 shows that there were<br />
differing improvements in the efficiency<br />
of cineole recovery by the various<br />
modifications. Simple steam distillation combined with simple condensing resulted in fairly poor<br />
recovery of cineole, poorer than was obtained for the corresponding trials in Experiment 1.<br />
65
The very large improvement in cineole recovery between simple distillation and distillation with<br />
cohobation reveals that:<br />
1. Recycling the condensed steam is an excellent and simple way of significantly improving the<br />
efficiency of cineole recovery.<br />
2. Large losses of cineole occur with simple distillation and condensation through losses to both<br />
water (partial solublisation of product) and air (inefficiency of condenser).<br />
Based on the results of Experiment 2, it may be concluded that loss of cineole in the discarded<br />
condensed steam is the most important inefficiency of the simple steam distillation/oil recovery<br />
system.<br />
7.3 Conclusions<br />
The efficiency of the conventional steam distillation technique, such as that currently employed by the<br />
Eucalyptus oil industry in North Central Victoria, is, evidently, not very efficient in the distillation and<br />
recovery of cineole, the most important component of Eucalyptus oil from a commercial perspective.<br />
It was found that recycling of the condensed steam (cohobation), along with collection of the distilled<br />
product with a Likens-Nickerson type apparatus (co-condensation and simultaneous solvent<br />
extraction), provided a substantial (approximately double) improvement in cineole recovery.<br />
Moreover, such systems may be easily retrofitted into existing plants or incorporated into the design of<br />
new plants.<br />
66
Chapter 8: Process development units:<br />
fabrication and commissioning<br />
A significant component of the project objectives was to construct, commission and optimise a process<br />
development scale unit (PDU) for both the two-stage pyrolysis and steam distillation processes, as<br />
well as integrate both units into a single system. This chapter summarises what was achieved with<br />
respect to these objectives.<br />
8.1 Fabrication of a fast pyrolysis process development unit<br />
A fast pyrolysis process development unit was designed, fabricated and commissioned. A photograph<br />
of the unit is provided in Figure 8.1.1. The reactor and quench system of the unit were designed with<br />
the assistance of RTI LTD, a Canadian company specialising in biomass conversion technologies. All<br />
other components were either designed in house and constructed by various engineering firms, or were<br />
purchased off the shelf. The entire unit was assembled by Moorhead Engineering, an Oberon (NSW)<br />
based company. This company also installed various senses and wiring.<br />
Unsurprisingly, the original prototype<br />
possessed certain aspects whose need for<br />
modification was only realised once the<br />
commissioning process began. After these<br />
modifications were performed, which<br />
occurred in a progressive manner, the unit<br />
could be operated safely and steadily. The<br />
entire commissioning process required<br />
approximately 9 months and more than 100<br />
test runs.<br />
Figure 8.1.1. Photograph of the Process Development Unit.<br />
67
A schematic diagram of each of the components of the process development unit is displayed in<br />
Figures 8.1.2 to 8.1.9.<br />
1. Feedstock inlet screw<br />
17<br />
10<br />
15<br />
2<br />
13<br />
2. Product and carrier gas outlet<br />
3. Distribution plate<br />
4. Carrier gas inlet line<br />
8<br />
5. Heating oil jacket<br />
6. Heating oil guiding veins<br />
5<br />
7. Heating oil inlet<br />
8. Heating oil outlet<br />
6<br />
9. Carrier gas inlet temperature controller<br />
10. Pressure release valve<br />
11. Emergency heating oil drainage line<br />
12. On/off valve for emergency drainage line<br />
1<br />
13. Emergency nitrogen gas cooling line<br />
14. Sand withdrawing flap<br />
3<br />
7<br />
14<br />
11<br />
12<br />
15. Temperature probe for sand bed<br />
16. Heated air line for cyclone<br />
17. Electronic flow meter<br />
16<br />
9<br />
Figure 8.1.2. Cross section diagram of the reactor showing<br />
the main components<br />
5<br />
4<br />
3<br />
2<br />
1<br />
1. Stainless steel pre-heater casing<br />
2. 11 kW heating elements<br />
3. Power supply for heating elements<br />
4. Temperature probe (over temperature)<br />
5. Carrier gas inlet<br />
6. Carrier gas outlet<br />
Figure 8.1.3. Cross section diagram of the pre-heater<br />
6<br />
68
1. K-tron Feeder<br />
12<br />
13<br />
8<br />
2. Aperture for twin screw<br />
3. AC motor for twin screws<br />
4. Twin screws<br />
5. Union linking sets of screws<br />
1<br />
6. AC motor for single screws<br />
7. Single screw that enters reactor<br />
10 11<br />
9<br />
8. Carrier gas line for over pressure to<br />
encourage feed to fall through aperture<br />
9. Carrier gas line for prevention of<br />
blockage in union<br />
10. Regulator for over pressure carrier gas<br />
line<br />
7<br />
5<br />
14<br />
4<br />
2<br />
6<br />
3<br />
15<br />
11. Regulator for blockage prevention line<br />
12. Pressure release valve<br />
13. Mesh grid to prevent foreign object<br />
being introduced into feeder when<br />
feedstock added<br />
14. Inspection window for feedstock flow<br />
Figure 8.1.4. Diagram of the feeder system.<br />
15. Power isolation switch for feeder<br />
motor<br />
14<br />
20<br />
3<br />
7<br />
12<br />
11<br />
21<br />
4<br />
1<br />
5<br />
15<br />
26<br />
13<br />
10<br />
16<br />
17<br />
8<br />
2<br />
28<br />
27<br />
22<br />
24<br />
6<br />
23<br />
9<br />
18<br />
19<br />
25<br />
29<br />
1. Stainless steel quench column<br />
2. Jacket for coolant<br />
3. Contact plates for quenching<br />
4. Carrier/condensable/non-condensable gases inlet line<br />
5. Quench column outlet 6. Quench fluid inlet line<br />
7. Coolant inlet line for quench column<br />
8. Coolant outlet line for quench column<br />
9. Chemical resistant pump for circulation of quench fluid<br />
10. Intake line for quench fluid<br />
11. Quench fluid level sensor low<br />
12. Quench fluid level sensor high<br />
13. Reservoir for quench fluid and condensed gases<br />
14. Outlet for carrier gas and non-condensable gases<br />
15. Probe for over-temperature control<br />
16. Drainage line 17. Solenoid operated drainage valve<br />
18. Flow sensor 19. Flow adjustment ball valve<br />
20. Inlet for electrostatic precipitator drain<br />
21. Concave stainless steel base<br />
22. 3-Way ball valve for addition of quench fluid<br />
23. Heat exchanger for cooling of quench fluid<br />
24. Coolant inlet line for quench fluid heat exchanger<br />
25. Coolant outlet line for quench fluid heat exchanger<br />
26. Product separator access plug<br />
27. Long bolts for securing end plates to glass tube<br />
28. Nuts for tensioning the long bolts<br />
29. Power isolation switch for quench motor<br />
Figure 8.1.5. Cross section diagram of the quench system<br />
69
14<br />
17<br />
19<br />
11<br />
12<br />
9 13<br />
15<br />
16<br />
10<br />
1. Glass solid residue collection vessel<br />
2. Stainless steel jacket around collection vessel<br />
3. Polyurithane seals (bottom seal perforated)<br />
4. Solid residue collector coolant inlet<br />
5. Solid residue collector coolant outlet<br />
3<br />
18<br />
1<br />
7<br />
8<br />
6<br />
2<br />
4<br />
6. 4 x Connector screws<br />
7. On/off ball valve<br />
8. Pressure gauge<br />
9. Cyclone<br />
10. Cyclone inlet<br />
11. Cyclone outlet<br />
12. Jacket for heated air<br />
16. Coolant inlet<br />
17. Coolant outlet<br />
18. Pressure sensor/alarm<br />
19. Temperature probe for reactor gas<br />
13. Hot air inlet (for heating of cyclone)<br />
5<br />
14. Hot air outlet<br />
15. Heat exchanger for cooling of solid residues<br />
Figure 8.6. Diagram of the solid residue collection system.<br />
8<br />
7<br />
1<br />
6<br />
3<br />
4<br />
2<br />
9<br />
9<br />
2<br />
4<br />
3<br />
1<br />
5<br />
1. Outer glass tube<br />
2. Inner glass tube<br />
3. Negative ionising electrode wires<br />
4. Positive collection plate<br />
5. Carrier gas/product inlet line to EP<br />
6. Stainless steel end plates (perforated)<br />
7. Long bolts to fasten end plates to tubes<br />
8. Nuts for long bolts<br />
9. Carrier gas/product gases outlet line<br />
10. Tap for draining of liquid product<br />
11. Liquid product outlet line<br />
11<br />
10<br />
Figure 8.1.7. Diagram of the 1 st electrostatic precipitator system<br />
70
3<br />
5<br />
4<br />
-<br />
+<br />
1. Cyclone shaped collection plate (positive)<br />
2. Tungsten ionising wires (negative)<br />
3. Plastic supports for tungsten wire<br />
4. Inlet tube for gases/aerosol product<br />
2<br />
5. Outlet tube for carrier and product gases<br />
1<br />
6. Outlet tube for precipitated product<br />
6<br />
Figure 8.1.8. Diagram of the 2 nd electrostatic precipitator<br />
6<br />
3<br />
4<br />
5<br />
2<br />
9<br />
8<br />
7<br />
1 Jacketed reactor<br />
2 Lauda circulation heater<br />
3 Oil pump<br />
4 Expansion vessel<br />
5 Heater elements<br />
6 Expansion overflow<br />
7 Lauda controller<br />
8 Heating oil outlet-to heating<br />
oil/brake fluid heat exchanger<br />
9 Heating oil inlet-from reactor<br />
10 Brake fluid pump<br />
1<br />
21<br />
18<br />
20<br />
19<br />
17<br />
16<br />
14<br />
15<br />
11<br />
13<br />
10<br />
Figure 8.1.9. Diagram of the heating oil system with two stage oil cooling system.<br />
12<br />
71
8.2 Evaluation of the fast pyrolysis PDU<br />
An objective of the research program was to compare the performance of the fast pyrolysis PDU with<br />
that of the bench scale unit in order to evaluate the effect of scaling. However, due to prohibitive<br />
budget and time constraints, a full comparison was not possible. The first step in the comparison and<br />
scaling process was the design and fabrication of the PDU. This was achieved, albeit at a substantially<br />
greater cost than was budgeted, with the assistance of Carter Holt Harvey Panels, who had taken an<br />
interest in the research. The second step involved commissioning of the PDU. The PDU is a very<br />
technical piece of plant which, because of the nature of the process, requires extremely precise process<br />
monitoring and control. Throughout the commissioning period a number of design modifications were<br />
necessary and these added further to the cost. The commissioning of the unit was completed and an<br />
operating manual prepared. However, further work could not be performed due to unavailability of<br />
funds.<br />
The commissioning process involved ensuring that the unit could be operated safely over all parameter<br />
ranges and that all subsystems performed as expected. It also involved testing all safety systems and<br />
ensuring each was sufficiently capable in the advent of an emergency. For example, fire is indicated by<br />
a sudden gas temperature increase. The emergency system involves detecting the temperature increase<br />
and automatically reacting to extinguish the fire. The commissioning process in this instance involves<br />
determining whether the emergency system can adequately and safely extinguish the fire. This phase<br />
of the commissioning process required approximately 6 months and necessitated various design<br />
modifications. At the completion of this phase of the commissioning period the operators were<br />
confident that the unit could be operated safely and that, based on process stability, results could be<br />
reproduced.<br />
The second phase of the commissioning process involved evaluation of the process over a range of<br />
parameter values to ensure that adequate mass balances could be achieved. The parameters<br />
investigated were:<br />
• Reactor temperature<br />
• Carrier gas flow rate<br />
• Sand bed mass<br />
The parameters, feedstock moisture content and sand particle size have not been investigated. The<br />
experimental design that was employed for the investigation of these parameters was identical in<br />
principle to that employed for the bench scale studies and for the same reasons. That is, a full factorial<br />
design was not practical. The feed material employed was Radiata pine. This is because there were<br />
insufficient quantities of hardwood feed available and no capacity to produce the required quantities.<br />
Moreover, Carter Holt Harvey Panels was able to supply any virtually any quantity of softwood feed<br />
and from the point of view of mass balance evaluation, the type of feed was not considered critical.<br />
Very few GCMS analyses of the process development samples were performed. This is because the<br />
samples contained significant quantities of hydrocarbons from the quench fluid, which prevented clean<br />
separation of compounds in the product, and because the emphasis of these trial runs during this phase<br />
of the research was commissioning, not process performance evaluation.<br />
8.2.1 Reactor temperature<br />
The conditions employed for the experiment in which reactor temperature was investigated are<br />
displayed in Table 8.2.1.1. The sand bed mass and particle size, feed particle size and carrier gas<br />
pressure were held constant while the temperature was varied from 240-275 o C. The pressure in the<br />
feeder, both at the base and at the top, was generally similar for all runs though some small variations<br />
occurred in order to regulate feedstock introduction.<br />
72
The feed material was obtained from the Carter Holt Harvey Tumut particleboard factory. Material<br />
from the fines that had passed through T1 (a dryer) was sieved into various fractions, of which the<br />
150-250 μm was employed for the investigation of reactor temperature.<br />
The set point and actual values for other parameters associated with each trial are displayed in Table<br />
8.2.1.2. The quench fluid that was employed was either white spirits or diesel.<br />
Table 8.2.1.1. Parameters that were employed for the investigation of reactor temperature.<br />
Temperature<br />
( o C)<br />
240<br />
240<br />
240<br />
250<br />
255<br />
255<br />
255<br />
255<br />
260<br />
260<br />
265<br />
270<br />
275<br />
275<br />
Sand<br />
Bed<br />
Mass (g)<br />
4000<br />
4000<br />
4000<br />
4000<br />
4000<br />
4000<br />
4000<br />
4000<br />
4000<br />
4000<br />
4000<br />
4000<br />
4000<br />
4000<br />
Sand<br />
Size<br />
(μm)<br />
250-500<br />
250-500<br />
250-500<br />
250-500<br />
250-500<br />
250-500<br />
250-500<br />
250-500<br />
250-500<br />
250-500<br />
250-500<br />
250-500<br />
250-500<br />
250-500<br />
Feed<br />
Size<br />
(μm)<br />
150-250<br />
150-250<br />
150-250<br />
150-250<br />
150-250<br />
150-250<br />
150-250<br />
150-250<br />
150-250<br />
150-250<br />
150-250<br />
150-250<br />
150-250<br />
150-250<br />
Carrier<br />
Gas<br />
Pressure<br />
(kPa)<br />
[m3/hr]<br />
50 [6.63]<br />
50 [5.20]<br />
50 [5.44]<br />
50 [5.04]<br />
50 [5.46]<br />
50 [4.93]<br />
50 [5.25]<br />
50 [6.13]<br />
50 [5.94]<br />
50 [5.05]<br />
50 [5.58]<br />
50 [5.52]<br />
50 [4.76]<br />
50 [5.12]<br />
Pressure<br />
in Feeder<br />
(Top)<br />
(kPa)<br />
35<br />
30<br />
30<br />
30<br />
35<br />
30<br />
35<br />
40<br />
35<br />
37<br />
30<br />
35<br />
30<br />
35<br />
Pressure in<br />
Feeder<br />
(Bottom)<br />
(kPa)<br />
40<br />
32<br />
35<br />
35<br />
40<br />
30<br />
30<br />
40<br />
35<br />
40<br />
35<br />
40<br />
35<br />
40<br />
Table 8.2.1.2. System parameters associated with reactor temperature investigation. a Eq. = Equilibrium.<br />
Temperature<br />
( o C)<br />
240<br />
240<br />
240<br />
250<br />
255<br />
255<br />
255<br />
255<br />
260<br />
260<br />
265<br />
270<br />
275<br />
275<br />
Preheater<br />
Set point<br />
( o C)<br />
261<br />
261<br />
261<br />
271<br />
280<br />
280<br />
279<br />
290<br />
282<br />
287<br />
288<br />
290<br />
298<br />
300<br />
Preheater<br />
at Eq a .<br />
( o C)<br />
259-269<br />
259-264<br />
263-273<br />
273-280<br />
284-288<br />
281-289<br />
277-286<br />
292-299<br />
284-290<br />
289-297<br />
289-298<br />
292-299<br />
300-309<br />
301-309<br />
Oil<br />
Heater<br />
Set<br />
point<br />
( o C)<br />
257<br />
257<br />
255<br />
265<br />
270<br />
270<br />
268<br />
286<br />
280<br />
272<br />
287<br />
290<br />
295<br />
295<br />
Oil<br />
Heater<br />
at Eq a .<br />
( o C)<br />
Product<br />
Separator<br />
at Eq a .<br />
( o C)<br />
Ambient<br />
Temperature<br />
( o C)<br />
The mass of solid residue that was obtained in each trial is displayed in Table 8.2.1.3, along with the<br />
corresponding percentage “yield”.<br />
251<br />
257<br />
253<br />
264<br />
270<br />
269<br />
267<br />
273<br />
280<br />
271<br />
284<br />
290<br />
292<br />
290<br />
26<br />
26<br />
26<br />
26<br />
24<br />
22<br />
26<br />
24<br />
22<br />
26<br />
27<br />
25<br />
26<br />
22<br />
29<br />
18<br />
13<br />
15<br />
16<br />
17<br />
20<br />
14<br />
14<br />
14<br />
17<br />
15<br />
15<br />
13<br />
73
Table 8.2.1.3. Yield of solid residue for trials associated with investigation of reaction temperature.<br />
Temperature<br />
( o C)<br />
240<br />
240<br />
240<br />
250<br />
255<br />
255<br />
255<br />
255<br />
260<br />
260<br />
265<br />
270<br />
275<br />
275<br />
Mass of Solid Residue<br />
(g)<br />
1740<br />
685<br />
765<br />
770<br />
630<br />
940<br />
380<br />
370<br />
380<br />
390<br />
380<br />
340<br />
290<br />
235<br />
Yield of Solid Residue Based on<br />
Mass of Feed Processed<br />
(%)<br />
87.0<br />
68.5<br />
78.9<br />
78.2<br />
63.0<br />
94.0<br />
76.0<br />
74.0<br />
76.0<br />
78.0<br />
76.0<br />
69.4<br />
67.4<br />
87.0<br />
Between 400g to 2000g of feed was processed in each trial. In general higher reaction temperatures<br />
resulted in a reduction in the amount of solid residue obtained. Moreover, the residue also became<br />
darker as the reaction temperature increased. The proportions of solid residue obtained over the<br />
temperature range investigated were quite similar to that obtained from the bench scale studies,<br />
indicating that effect of temperature on volatiles production did not change appreciably as a<br />
consequence of scaling.<br />
8.2.2 Sand bed mass<br />
The sand bed mass was investigated at two different temperatures. The conditions employed are<br />
displayed in Table 8.2.2.1. For both temperatures, the sand bed particle size and feed particle size, as<br />
well as the carrier gas pressure, were held constant while the sand bed mass was varied from 4 to 6 kg.<br />
The pressure in the feeder, both at the base and at the top, was generally similar for all runs though<br />
some small variations occurred in order to regulate feedstock introduction.<br />
The feed material was obtained from the Carter Holt Harvey Tumut particleboard factory. Material<br />
from the fines that had passed through T1 (a dryer) was sieved into various fractions, of which the<br />
150-250 μm was employed for the investigation of reactor temperature.<br />
The set point and actual values for other parameters associated with each trial are displayed in Table<br />
8.2.2.2. The quench fluid that was employed was either white spirits or diesel.<br />
Between 400g to 2000g of feed was processed in each trial. In general, larger sand beds resulted in an<br />
increase in the amount of solid residue obtained.<br />
74
Table 8.2.2.1. Parameters that were employed for the investigation of sand bed mass.<br />
Sand<br />
Bed<br />
Mass<br />
(g)<br />
4000<br />
4000<br />
4000<br />
4000<br />
5000<br />
5000<br />
6000<br />
6000<br />
6000<br />
Temperature<br />
( o C)<br />
255<br />
255<br />
255<br />
255<br />
255<br />
255<br />
255<br />
255<br />
255<br />
Sand<br />
Size<br />
(μm)<br />
250-500<br />
250-500<br />
250-500<br />
250-500<br />
250-500<br />
250-500<br />
250-500<br />
250-500<br />
250-500<br />
Feed<br />
Size<br />
(μm)<br />
150-250<br />
150-250<br />
150-250<br />
150-250<br />
150-250<br />
150-250<br />
150-250<br />
150-250<br />
150-250<br />
Carrier<br />
Gas<br />
Pressure<br />
(kPa)<br />
[m3/hr]<br />
50 [5.46]<br />
50 [4.93]<br />
50 [5.25]<br />
50 [6.13]<br />
50 [5.24]<br />
50[4.83]<br />
50 [4.65]<br />
50 [5.81]<br />
50 [5.43]<br />
Pressure<br />
in Feeder<br />
(Top)<br />
(kPa)<br />
35<br />
30<br />
35<br />
40<br />
37<br />
35<br />
35<br />
35<br />
30<br />
Pressure in<br />
Feeder<br />
(Bottom)<br />
(kPa)<br />
40<br />
30<br />
30<br />
40<br />
40<br />
38<br />
38<br />
35<br />
35<br />
4000<br />
5000<br />
5000<br />
6000<br />
6000<br />
265<br />
265<br />
265<br />
265<br />
265<br />
250-500<br />
250-500<br />
250-500<br />
250-500<br />
250-500<br />
150-250<br />
150-250<br />
150-250<br />
150-250<br />
150-250<br />
50 [5.58]<br />
50 [6.09]<br />
50 [6.30]<br />
50 [6.23]<br />
50 [5.74]<br />
30<br />
31<br />
35<br />
32<br />
30<br />
35<br />
38<br />
40<br />
37<br />
35<br />
Table 8.2.2.2. System parameters associated with sand bed mass investigation. a Eq. = Equilibrium.<br />
Sand Bed<br />
Mass<br />
(g) [ o C]<br />
4000 [255]<br />
4000 [255]<br />
4000 [255]<br />
4000 [255]<br />
5000 [255]<br />
5000 [255]<br />
6000 [255]<br />
6000 [255]<br />
6000 [255]<br />
Preheater<br />
Set point<br />
( o C)<br />
280<br />
280<br />
279<br />
290<br />
280<br />
280<br />
280<br />
280<br />
280<br />
Preheater<br />
at Eq a .<br />
( o C)<br />
284-288<br />
281-289<br />
277-286<br />
292-299<br />
281-289<br />
281-289<br />
280-290<br />
279-286<br />
282-288<br />
Oil<br />
Heater<br />
Set point<br />
( o C)<br />
270<br />
270<br />
268<br />
286<br />
270<br />
275<br />
272<br />
275<br />
277<br />
Oil<br />
Heater<br />
at Eq a .<br />
( o C)<br />
270<br />
269<br />
267<br />
273<br />
270<br />
272<br />
272<br />
274<br />
273<br />
Product<br />
Separator<br />
at Eq a .<br />
( o C)<br />
24<br />
22<br />
26<br />
24<br />
27<br />
27<br />
20<br />
19<br />
22<br />
Ambient<br />
Temperature<br />
( o C)<br />
16<br />
17<br />
20<br />
14<br />
13<br />
13<br />
12<br />
10<br />
11<br />
4000 [265]<br />
5000 [265]<br />
5000 [265]<br />
6000 [265]<br />
6000 [265]<br />
288<br />
290<br />
291<br />
292<br />
292<br />
289-298<br />
292-299<br />
293-300<br />
292-303<br />
292-305<br />
287<br />
290<br />
291<br />
290<br />
290<br />
284<br />
284<br />
281<br />
281<br />
283<br />
27<br />
26<br />
25<br />
28<br />
27<br />
17<br />
11<br />
11<br />
13<br />
13<br />
The mass of solid residue that was obtained in each trial is displayed in Table 8.2.2.3, along with the<br />
corresponding percentage “yield”.<br />
75
Table 8.2.2.3. Yield of solid residue for trials associated with investigation of sand bed mass.<br />
Sand Bed Mass<br />
(g) [ o C]<br />
4000 [255]<br />
4000 [255]<br />
4000 [255]<br />
4000 [255]<br />
5000 [255]<br />
5000 [255]<br />
6000 [255]<br />
6000 [255]<br />
6000 [255]<br />
Mass of Solid Residue<br />
(g)<br />
630<br />
940<br />
380<br />
370<br />
370<br />
350<br />
410<br />
290<br />
370<br />
Yield of Solid Residue Based on<br />
Mass of Feed Processed<br />
(%)<br />
63.0<br />
94.0<br />
76.0<br />
74.0<br />
74.0<br />
70.0<br />
82.0<br />
75.3<br />
74.0<br />
4000 [265]<br />
5000 [265]<br />
5000 [265]<br />
6000 [265]<br />
6000 [265]<br />
380<br />
375<br />
370<br />
405<br />
415<br />
76.0<br />
75.0<br />
74.0<br />
81.0<br />
83.0<br />
8.2.3 Carrier gas flow rate<br />
The carrier gas flow rate was measured as a function of pressure rather than actual flow rate as<br />
pressure was easier to set than flow rate. In like manner to sand bed mass, carrier gas flow rate was<br />
investigated at two different temperatures. The conditions employed are displayed in Table 8.2.3.1.<br />
For both temperatures, the sand bed particle size and mass, as well as the feed particle size, were held<br />
constant while the carrier gas pressure was varied between 35 to 60 kPa. The pressure in the feeder,<br />
both at the base and at the top, was generally similar for all runs though some small variations<br />
occurred in order to regulate feedstock introduction.<br />
Table 8.2.3.1. Parameters that were employed for the investigation of carrier gas flow rate.<br />
Carrier<br />
Gas<br />
Pressure<br />
(kPa)<br />
[m3/hr]<br />
35 [4.54]<br />
35 [4.42]<br />
40 [5.03]<br />
40 [5.12]<br />
50 [5.46]<br />
50 [4.93]<br />
50 [5.25]<br />
50 [6.13]<br />
60 [7.10]<br />
60 [6.07]<br />
Temperature<br />
( o C)<br />
255<br />
255<br />
255<br />
255<br />
255<br />
255<br />
255<br />
255<br />
255<br />
255<br />
Sand<br />
Size<br />
(μm)<br />
250-500<br />
250-500<br />
250-500<br />
250-500<br />
250-500<br />
250-500<br />
250-500<br />
250-500<br />
250-500<br />
250-500<br />
Feed<br />
Size<br />
(μm)<br />
150-250<br />
150-250<br />
150-250<br />
150-250<br />
150-250<br />
150-250<br />
150-250<br />
150-250<br />
150-250<br />
150-250<br />
Sand Bed<br />
Mass<br />
(g)<br />
4000<br />
4000<br />
4000<br />
4000<br />
4000<br />
4000<br />
4000<br />
4000<br />
4000<br />
4000<br />
Pressure<br />
in Feeder<br />
(Top)<br />
(kPa)<br />
24<br />
24<br />
25<br />
25<br />
35<br />
30<br />
35<br />
40<br />
39<br />
39<br />
Pressure in<br />
Feeder<br />
(Bottom)<br />
(kPa)<br />
28<br />
28<br />
30<br />
30<br />
40<br />
30<br />
30<br />
40<br />
41<br />
41<br />
40 [4.70]<br />
40 [4.81]<br />
50 [5.58]<br />
60 [6.98]<br />
60 [6.97]<br />
265<br />
265<br />
265<br />
265<br />
265<br />
250-500<br />
250-500<br />
250-500<br />
250-500<br />
250-500<br />
150-250<br />
150-250<br />
150-250<br />
150-250<br />
150-250<br />
4000<br />
4000<br />
4000<br />
4000<br />
4000<br />
25<br />
25<br />
30<br />
41<br />
39<br />
30<br />
30<br />
35<br />
39<br />
41<br />
76
The feed material was obtained from the Tumut particleboard factory. Material from the fines that had<br />
passed through T1 (a dryer) was sieved into various fractions, of which the 150-250 μm was employed<br />
for the investigation of reactor temperature. The set point and actual values for other parameters<br />
associated with each trial are displayed in Table 8.2.3.2. The quench fluid that was employed was<br />
either white spirits or diesel. Between 400g to 2000g of feed was processed in each trial. In general,<br />
higher carrier gas flow rates resulted in an increase in the amount of solid residue obtained. The mass<br />
of solid residue that was obtained in each trial is displayed in Table 8.2.3.3, along with the<br />
corresponding percentage “yield”.<br />
Table 8.2.3.2. System parameters associated with carrier gas flow rate investigation. a Eq. = Equilibrium.<br />
Carrier<br />
Gas Flow<br />
Rate<br />
(kPa)<br />
[m3/hr]<br />
35 [4.54]<br />
35 [4.42]<br />
40 [5.03]<br />
40 [5.12]<br />
50 [5.46]<br />
50 [4.93]<br />
50 [5.25]<br />
50 [6.13]<br />
60 [7.10]<br />
60 [6.07]<br />
Preheater<br />
Set point<br />
( o C)<br />
280<br />
280<br />
288<br />
288<br />
280<br />
280<br />
279<br />
290<br />
280<br />
280<br />
Preheater<br />
at Eq a .<br />
( o C)<br />
277-294<br />
282-290<br />
288-294<br />
285-295<br />
284-288<br />
281-289<br />
277-286<br />
292-299<br />
280-288<br />
280-289<br />
Oil<br />
Heater<br />
Set point<br />
( o C)<br />
280<br />
280<br />
280<br />
280<br />
270<br />
270<br />
268<br />
286<br />
280<br />
280<br />
Oil<br />
Heater<br />
at Eq a .<br />
( o C)<br />
278<br />
279<br />
275<br />
278<br />
270<br />
269<br />
267<br />
273<br />
277<br />
278<br />
Product<br />
Separator<br />
at Eq a .<br />
( o C)<br />
24<br />
22<br />
26<br />
25<br />
24<br />
22<br />
26<br />
24<br />
28<br />
26<br />
Ambient Temp.<br />
( o C)<br />
9<br />
9<br />
10<br />
12<br />
16<br />
17<br />
20<br />
14<br />
10<br />
11<br />
40 [4.70]<br />
40 [4.81]<br />
50 [5.58]<br />
60 [6.98]<br />
60 [6.97]<br />
290<br />
290<br />
288<br />
290<br />
290<br />
290-300<br />
293-302<br />
289-298<br />
287-298<br />
287-298<br />
290<br />
290<br />
287<br />
290<br />
290<br />
288<br />
290<br />
284<br />
289<br />
289<br />
22<br />
22<br />
27<br />
25<br />
28<br />
10<br />
10<br />
17<br />
11<br />
10<br />
Table 8.2.3.3. Yield of solid residue for trials associated with investigation of carrier gas flow rate.<br />
Carrier Gas Flow Rate<br />
(kPa) [m3/hr]<br />
35 [4.54]<br />
35 [4.42]<br />
40 [5.03]<br />
40 [5.12]<br />
50 [5.46]<br />
50 [4.93]<br />
50 [5.25]<br />
50 [6.13]<br />
60 [7.10]<br />
60 [6.07]<br />
40 [4.70]<br />
40 [4.81]<br />
50 [5.58]<br />
60 [6.98]<br />
60 [6.97]<br />
Mass of Solid Residue<br />
(g)<br />
385<br />
310<br />
~340<br />
405<br />
630<br />
940<br />
380<br />
370<br />
410<br />
410<br />
360<br />
370<br />
380<br />
390<br />
380<br />
Yield of Solid Residue Based on<br />
Mass of Feed Processed<br />
(%)<br />
77.0<br />
62.0<br />
68.0<br />
81.0<br />
63.0<br />
94.0<br />
76.0<br />
74.0<br />
82.0<br />
82.0<br />
72.0<br />
74.0<br />
76.0<br />
78.0<br />
76.0<br />
77
The influence of carrier gas flow rate and sand bed mass were generally similar to that obtained for the<br />
bench scale work, indicating that the effect of scaling of the process was relatively constant with<br />
respect to mass of feed volatilised.<br />
8.3 Evaluation of the steam distillation PDU<br />
A process development scale steam distillation plant was constructed and a number of trials<br />
performed. The unit consisted of a well insulated distillation vessel (stainless steel beer keg)<br />
connected to a large copper, water–cooled, condenser. Steam was provided by an electric steam<br />
generator. Cohobation was achieved in the same manner as per the bench scale experiments. A<br />
diagram of the unit is provided in Figure 8.9.<br />
Figure 8.3.1. Diagram of the steam distillation PDU<br />
A series of trials were conducted on the pilot scale unit in order to evaluate the effect of cohobation on<br />
total oil recovery. Leaf samples (approximately 20kg batches) were collected from a single tree and<br />
then thoroughly mixed. The mixed sample was then split into two equal parts and weighed. One<br />
sample was distilled without cohobation and the other with cohobation. This procedure was then<br />
repeated with another batch. Unfortunately, there were insufficient leaves on the tree from which the<br />
bench scale trials were performed for the pilot scale study and so a larger tree was sourced. The<br />
species used was messmate and the tree was located on a private property in Gordon, near Ballarat.<br />
Ideally, Blue gum would have been used for the pilot scale work but this did not occur for various<br />
logistical reasons. The results are summarised in Table 8.3.1.<br />
Table 8.3.1. Comparison of simple distillation and distillation with cohobation on the pilot scale.<br />
Trial Fresh Leaf<br />
Mass<br />
(kg)<br />
Method Total<br />
Time<br />
(min)<br />
Oil Volume<br />
(ml)<br />
Oil Yield (%)<br />
1A<br />
1B<br />
2A<br />
2B<br />
7.380<br />
7.382<br />
9.156<br />
9.156<br />
Simple Distillation<br />
Cohobation<br />
Simple Distillation<br />
Cohobation<br />
128<br />
131<br />
129<br />
131<br />
153<br />
173<br />
268<br />
310<br />
2.07<br />
2.34<br />
2.93<br />
3.39<br />
It can be seen from inspection of Table 8.10 that incorporation of cohobation on the pilot scale<br />
improves total oil recovery (14% increase in yield compared to simple distillation). Although this is<br />
not as much of an improvement as was obtained on the bench scale unit it is still significant. The lower<br />
78
overall yield may have been due to the fact that the steam generator was undersized and could not<br />
provide a constant supply of steam.<br />
The intention of the research program was to integrate the pilot scale essential oil recovery unit with<br />
the pyrolysis PDU. This was not achieved because of the difficulties in integrating control and feed<br />
systems. It would have been straight forward to spatially integrate the processes but they would have<br />
still been separate processes. The complexity of totally integrating two different types of<br />
thermochemical process on such a small scale would have been enormous and costly. Moreover, based<br />
on the fact that energy recovery efficiency increases with increasing scale, and because the PDUs were<br />
still small compared to a full scale plant, any process integration data would be of limited value to any<br />
future development of a full scale plant.<br />
8.4 Gasification unit<br />
A gasification system was to be incorporated in both the bench scale and PDU scale pyrolysis units.<br />
These systems were to be purchased off-the-shelf because such gasification technology is<br />
commercially available. The purpose of the gasification unit was to supply clean fuel for the<br />
distillation process from lignocellulosic by-products, such as spent leaves. The gasification unit was<br />
deemed to be an elegant, environmentally friendly, method for integrating the pyrolysis and distillation<br />
processes. However, due to severe budget constraints, the gasification units could not be obtained.<br />
79
Chapter 9. Assessment of any health risks<br />
in relation to the process and the oil<br />
produced<br />
This chapter summarises the findings relating to known potential health hazards associated with the<br />
identified pyrolysis products. Pyrolysis oil generally consists of complex mixture of monomeric and<br />
oligomeric material. Therefore, the quality of any health assessment of this product is dependent on the<br />
extent in which its composition is understood. The methodology that was adopted in this research<br />
involved gas chromatograph/mass spectroscopic analysis (GCMS) of the pyrolysis oil. This form of<br />
analysis is suited to substances of relatively low molecular weight (30-300 A.M.U). It is not suitable<br />
for the analysis of oligomeric material, unless this material is first decomposed. It was strongly<br />
believed that a large proportion of the liquid pyrolysis product was composed of oligomeric material<br />
and until this material can be properly characterised, the health assessment will not be complete.<br />
9.1 Composition of pyrolysis oil by GCMS<br />
The composition of the pyrolysis oil was dependent on the processing conditions, type of feed and the<br />
state it was in with respect to thermal degradation. The mass spectra of all chromatographic peaks that<br />
gave counts of 1800 or greater were examined. Given that the peak count for major components<br />
exceeded 6x10 6 and total counts were in excess of 10 9 for a chromatogram, it was possible to obtain<br />
information on species comprising less than 0.001 % of the liquid fraction.<br />
In many cases, the mass spectra of the minor components could not be matched to the GCMS<br />
computer library. This is because mass spectra of such components often possessed peak signals that<br />
were only slightly greater than those associated with the background. However, by adopting the<br />
premise that the most insidious hazardous substances produced by pyrolysis are polycyclic aromatic<br />
hydrocarbons (PCAHs), inspection of the mass spectra obtained from these minor compounds, albeit<br />
rather imperfect and impure ones, failed to reveal the very stable characteristic molecular ions of such<br />
compounds, nor were any of the expected fragmentation peaks of the same observed. This is not<br />
unexpected as PCAHs are typically formed by high temperature, non-oxidative pyrolytic processes,<br />
and to a lesser degree, by higher temperature combustion (600 o C or greater), whereas this process<br />
operates at less than 300 o C.<br />
When chromatograph count levels for a component were of the order of 4x10 5 or greater (compounds<br />
comprising more than 0.05% of the oil), positive identifications by comparison with the library were<br />
usually possible. Some larger peaks were not identifiable as the library is not totally comprehensive<br />
(~100,000 compounds) and in all likelihood, many of the compounds produced are unknown.<br />
Low temperature pyrolysis (240-260 o C) yielded predominantly furfural, furfuryl alcohol and small<br />
quantities of other furfural derivatives (refer to Appendices 4 and 5 for complete list). Furfural and<br />
furfuryl alcohol, are items of commerce for which their hazards are well documented. When handling<br />
these materials, normal safe handling practices must be followed. Higher temperature pyrolysis (270-<br />
325 o C) yielded predominantly phenols as well as furfural derivatives, the quantity of the latter of<br />
which was dependent on previous thermochemical treatment. Thirty-six compounds were identified<br />
that were phenolic in nature, and for those which have an associated MSDS, they were, as expected for<br />
phenolics, corrosive, etc. Such compounds are general items of commerce and handling procedures<br />
adopted for the pyrolysis oils should be the same as those in force for phenol, resorcinol and the like.<br />
In Table 9.1.1 and 9.1.2, the various compounds that were positively identified in the pyrolysis oil are<br />
listed together with any known hazards.<br />
80
Table 9.1.1. Toxicity information on lignin derived compounds.<br />
I: Irritant; C: Corrosive; HI: Harmful by inhalation; A: Absorbed through skin; Ca: Carcinogenic; H: Harmful;<br />
T: Toxic; TI: Toxic by inhalation; B: Causes blisters; GD: Genetic damage; Bu: Burns<br />
Lignin Derived Compound<br />
Guaiacol<br />
Phenol<br />
3-Methyl-2-methoxyphenol<br />
4-Ethyl-2-methoxyphenol<br />
4-Vinylguaiacol<br />
Eugenol<br />
Syringol<br />
Isoeugenol<br />
Vanillin<br />
4-Hydroxy-3-methoxybenzoic acid<br />
3,4-Dimethoxybenzene-1,2-diol<br />
Homovanillin<br />
Acetoguaiacone<br />
2-Methoxy-1,4-benzenediol<br />
Guaiacyl acetone<br />
4-Vinylsyringol<br />
4-Allylsyringol<br />
2,5-Dimethoxybenzeneacetic acid<br />
3-Hydroxy-1-(4-hydroxy-3-methoxyphenyl)-1-Propanone<br />
Alpha-oxy-propioguaiacone<br />
4-Propenylsyringol (trans)<br />
4-(4-Hydroxy-3-methoxyphenyl)-3-buten-2-one<br />
3-Hydroxy-4-methoxycinnamic acid<br />
Syringaldehyde<br />
3,4,5-Trimethoxyphenol<br />
Homosyringaldehyde<br />
Acetosyringone<br />
Coniferaldehyde<br />
Syringyl acetone<br />
Benzeneacetic acid, alpha-phenyl-,methyl ester<br />
Propiosyringone<br />
Alpha-oxy-propiosyringone<br />
4-(oxy-Allyl)-syringol<br />
Sinapaldehyde<br />
Hazards<br />
I, HI<br />
A, B, I, HI<br />
No data available<br />
No data available<br />
GD<br />
I, HI<br />
I, HI<br />
I, HI<br />
I<br />
I, HI<br />
No data available<br />
No data available<br />
I, HI<br />
No data available<br />
No data available<br />
No data available<br />
No data available<br />
No data available<br />
No data available<br />
No data available<br />
No data available<br />
No data available<br />
I<br />
I, HI<br />
I, HI<br />
No data available<br />
I,HI<br />
No data available<br />
No data available<br />
No data available<br />
No data available<br />
No data available<br />
No data available<br />
No data available<br />
81
Table 9.1.2. Toxicity information on hemicellulose/cellulose derived compounds.<br />
I: Irritant; C: Corrosive; HI: Harmful by inhalation; A: Absorbed through skin; Ca: Carcinogenic; H: Harmful; T: Toxic; TI: Toxic by<br />
inhalation; B: Causes blisters; GD: Genetic damage; Bu: Burns<br />
Hemicellulose/Cellulose Derived Compound<br />
2,5-Dimethoxytetrahydrofuran<br />
3-Furfuraldehyde<br />
2-Furfuraldehyde<br />
2-Propylfural<br />
Furfuryl alcohol<br />
ß-methoxyfurfuryl alcohol<br />
4-cyclopentene-1,3-dione<br />
2-Methyl-2-pentyl-oxirane<br />
3-Furancarboxylic acid, methyl ester<br />
5-Methyl-2-furaldehyde<br />
2,3-Dihydroxy-1-ene-4-one<br />
Furfural diethyl acetal<br />
2-Hydroxy-1-methyl-1-cyclopentene-3-one<br />
2-Furoic acid methyl ester<br />
1,4:3,6-Dianhydromannofuranose<br />
1,4:3,6-Dianhydroglucopyranose<br />
5-Hydroxymethyl-2-furaldehyde<br />
3-Hydroxy-2(5H)-furanone<br />
Levoglucosan<br />
Hazards<br />
C, I<br />
T, Ca, GD<br />
I, HI, Ca, H, T, OCE<br />
No data available<br />
T, TI, I<br />
No data available<br />
B<br />
No data available<br />
No data available<br />
No data available<br />
No data available<br />
No data available<br />
No data available<br />
I<br />
Non Toxic<br />
Non Toxic<br />
I<br />
No data available<br />
I<br />
The phenolic component of pyrolysis oil is similar to the lowest-grade fossil fuel, lignite, or brown,<br />
and therefore any health hazards associated with lignite may also be applicable to pyrolysis oil. Other<br />
types of coal cannot be accurately compared to pyrolysis oil because, as the fuel grade of coal<br />
increases, the oxygen content decreases while the sulphur content increases. Moreover, the extent of<br />
PAH formation increases with increasing fuel grade. There are no reported hazards associated with<br />
the phenolic content of lignite that have not already been reported here.<br />
9.2 Pyrolysis oil MSDS<br />
The health hazard information associated with many of the compounds present in the pyrolysis liquids<br />
of the present study is unavailable or incomplete. An MSDS for a ‘typical’ pyrolysis oil has been<br />
prepared by workers at Aston University and is provided below (Table 9.2.1). The MSDS is designed<br />
as a guide only.<br />
82
Table 9.2.1. Example MSDS for a ‘typical’ pyrolysis oil (pages 83-88).<br />
ENERGY RESEARCH GROUP<br />
Department of Chemical Engineering and Applied Chemistry<br />
Aston University<br />
Birmingham B4 7ET<br />
UK<br />
Telephone: (44) 121 359 3611 extension 4647, 4633, 4644, 4622<br />
Fax: (44) 121 359 6814 or 4094<br />
Contact persons:Dr C. Peacocke, Dr A.V. Bridgewater<br />
NOTE:<br />
There is at present no official recognition of the information contained within this document. The Health<br />
and Safety Executive do not have an official designation for pyrolysis liquids. The reader and user of this<br />
data sheet is advised to follow the HSE protocol for transport and shipment identification:<br />
Petroleum Distillates-NOS (Wood oil), 3, UN 1268, III, Flammable Liquid<br />
The user of these notes is also advised to refer to the following HMSO (Her Majesty’s Stationery Office)<br />
publications for further information.<br />
‘Approved Carriage List-Information approved for the classification, packaging and labelling of dangerous<br />
goods for carriage by Road and Rail. Carriage of Dangerous Goods by Road and Rail (Classification,<br />
Packaging and Labelling) Regulations 1994’, (SI 1994/669), Health and Safety Commission, HMSO, ISBN<br />
0 11 043669 5.<br />
‘Approved methods for the classification and packaging of dangerous goods for carriage by road and rail.<br />
Carriage of Dangerous Goods by Road and Rail (Classification, Packaging and Labelling) Regulations<br />
1994’, Health and Safety Commission, HMSO, ISBN 0 11 041735 6.<br />
Material Safety Data Sheet<br />
1.0 Chemical Identification<br />
Pyrolysis liquid (also known as pyrolysis oil, bio-crude-oil, bio-oil, bio-fuel-oil, pyroligneous tar,<br />
pyroligneous acid, wood liquids, wood oil, liquid smoke, wood distillates).<br />
2.0 Composition/Information on ingredients<br />
Complex mixture of highly oxygenated hydrocarbons. A mixture of three to four hundred chemicals<br />
derived by the thermal decomposition of biomass. A typical pyrolysis oil may be composed as follows:<br />
Composition wt%<br />
Organic acids 5-10%<br />
Anhydrosugars 0-5%<br />
Ketones 0-5%<br />
Phenolics 20-25%<br />
Hydrocarbons 0-5%<br />
Water up to 35%<br />
A list of components which may be found in pyrolysis oil is appended at the end of the MSDS<br />
83
3.0 Synonyms<br />
Bio-oil, pyrolysis liquid, pyroligneous oil, bio-crude-oil, pyroligneous liquid, liquid wood, bio-fuel-oil,<br />
wood tar, wood oil.<br />
4.0 Hazards Identification<br />
Label Precautionary Statements<br />
• Harmful by inhalation, in contact with skin and if swallowed.<br />
• Irritating to eyes, respiratory system and skin.<br />
• Corrosive (pH 1.5-3).<br />
• Only flammable with additional fuel source at 5wt% concentration such as methanol, ethanol,<br />
acetone, or diesel and upon heating with suitable ignition source.<br />
• Possible mutagen, contains potentially carcinogenic compounds.<br />
• Keep container tightly closed in a cool, well ventilated place.<br />
• Do not empty into drains.<br />
• Wear suitable gloves and eye/face protection when handling.<br />
• Avoid continuous exposure.<br />
5.0 First Aid Measures<br />
• In case of contact with eyes, flush with copious amounts of water for 15 minutes. Remove<br />
contaminated clothing.<br />
• In case of contact with skin, flush with copious amounts of water. Remove contaminated clothing.<br />
• If inhaled, remove to fresh air. If breathing is difficult, give oxygen. If not breathing, give artificial<br />
respiration.<br />
• If swallowed, wash out mouth with water. Consume water to dilute. Call doctor immediately.<br />
6.0 Fire Fighting Measures<br />
Extinguishing Media:<br />
Water, carbon dioxide, foam, powder<br />
Special fire fighting precautions:<br />
• Wear self-contained breathing apparatus and protective clothing to prevent contact with eyes and skin.<br />
Do not inhale smoke from fire.<br />
• Use water spray to cool fire exposed containers.<br />
7.0 Accidental Release Measures<br />
7.1 Small Quantities (100ml)<br />
• Evacuate area.<br />
84
• Wear rubber boots, rubber gloves, suitable eye/face protection and NIOSH/MSHA approved<br />
respirator.<br />
• Cover contaminated area with sawdust. Take up sawdust and place in closed container. Transport to<br />
approved landfill or incinerator.<br />
8.0 Handling and Storage<br />
• Store in sealed container in darkness at room temperature.<br />
• Immiscible with water above 50% weight concentration. Soluble only in solvents such as acetone or<br />
ethanol. Immiscible in hydrocarbon solvents.<br />
• Reacts with mild steel and impure copper due to high acidity. Attacks buna rubber and in some cases<br />
causes rubber seals to swell.<br />
9.0 Exposure Controls/Personal Protection<br />
• Wear appropriate NIOSH/MSHA approved respirator, rubber gloves, rubber apron, and suitable<br />
eye/face protection.<br />
• Use in a well-ventilated area or fume cupboard.<br />
• Safety shower and eye bath.<br />
• Do not breathe vapour.<br />
• Wash thoroughly after handling.<br />
10.0 Physical and Chemical Properties<br />
Dark brown, viscous liquid with a smoky odour.<br />
(All values are typical, not definitive, values.)<br />
Boiling curve:<br />
Setting point:<br />
Specific gravity:<br />
Flash point:<br />
Auto ignition temperature:<br />
Upper explosion level:<br />
Lower explosion level:<br />
Vapour pressure:<br />
Vapour density:<br />
Start point 90-100 o C<br />
NB. When heated above 100 o C, pyrolysis oil forms a solid<br />
char.<br />
-26 o C<br />
1.2 @ 25 o C<br />
55-70 o C<br />
110-120 o C<br />
Unknown<br />
Unknown<br />
Similar to water<br />
Unknown<br />
11.0 Stability and Reactivity<br />
Incompatibilities:<br />
Heat – 50% char formed upon continuous heating above 100oC<br />
Hazardous combustion or decomposition products.<br />
Fumes of:<br />
Carbon dioxide<br />
Carbon monoxide<br />
Light organics-2-propenal, acetic acid, formaldehyde, methanol, acetaldehyde.<br />
12.0 Toxicological Information<br />
• Liquids produced at reactor temperatures greater than 600 o C contain condensed polyaromatic ring<br />
compounds, which have mutagenic effects.<br />
• Harmful if swallowed, inhaled, or absorbed through the skin.<br />
85
• Vapour is irritating to the eyes, mucous membranes and upper respiratory tract.<br />
• Can sensitise skin.<br />
• Laboratory tests have shown mutagenic properties.<br />
13.0 Ecological Information<br />
Very high BOD – no exact value yet.<br />
14.0 Disposal Considerations<br />
Burn in a chemical incinerator observing all environmental regulation.<br />
15.0 Transport Information<br />
Transport in a sealed translucent container in cool conditions. Avoid prolonged exposure to strong<br />
sunlight and heat.<br />
Bibliography<br />
• Elliot, D.C.: ‘Comparative Analysis of Biomass Pyrolysis Condensates’; Chemical Technology<br />
Department, Pacific Northwest Laboratory, Richland, Washington.<br />
• Longley, C.J., Howard, J. and Fung, D.: ‘Levoglucosan recovery from cellulose and wood pyrolysis<br />
liquids’, in Advances in Thermochemical Biomass Conversion, Ed. Bridgewater, A.V., 1441-1451, Blackie,<br />
1994.<br />
• McKinley, J.: ‘Final report biomass liquefaction: centralized analysis’; Vancouver, B.C.: B.C. Research,<br />
1989.<br />
• Material Safety Data Sheet prepared by G. Underwood for Red Arrow Products Inc.<br />
• Peacocke, G.V.C., of Aston University, Birmingham, England. Information provided from personal<br />
experience.<br />
• Piskorz, J., Radlein, D., Scott, D.S., and Czernik, S.: ‘Liquid Products from the Fast Pyrolysis of Wood<br />
and Cellulose’, in Research in Thermochemical Biomass Conversion, pp557-571, 1988.<br />
• Piskorz, J., Scott, D.S., Radlein, D. and Czernik, S.: ‘New applications of the Waterloo Fast Pyrolysis<br />
process’, in Biomass Thermal Processing, Eds. Hogan, E., Robert, J., Grassi, G. and Bridgewater, A.V.<br />
(pp64-73, 1992).<br />
• Rick, F., Vix, U.: ‘Product Standards for Pyrolysis Products for Use as Fuel in Industrial Firing Plants’,<br />
in Biomass Pyrolysis Liquids: Upgrading and Utilisation. Scott, D.S. and Fung, D.: ‘Chemicals and fuels<br />
from biomass flash pyrolysis’ – part of the bioenergy development program (BDP), 1988.<br />
• Solantausta, Y., Diebold, J., Elliott, D.C., Bridgewater, A.V., Beckman, D.: ‘Assessment of<br />
Liquefaction and Pyrolysis Systems’, Technical Research Centre of Finland, Espoo, 1993.<br />
• Scott, D.S., Piskorz, J. and Radlein, D.: ‘The yields of chemicals from biomass based fast pyrolysis<br />
oils’, in Energy from Biomass and Wastes (16 th Ed.), 1992.<br />
• ‘Approved Carriage List-Information approved for the classification, packaging and labelling of<br />
dangerous goods for carriage by Road and Rail (Classification, Packaging and Labelling) Regulations<br />
1994’, (SI 1994.669), Health and Safety Commission, HMSO, ISBN 0 11 043669 5.<br />
• ‘Approved methods for the classification and packaging of dangerous goods for carriage by road and<br />
rail. Carriage of Dangerous Goods by Road and Rail (Classification, Packaging and Labelling)<br />
Regulations 1994’, Health and Safety Commission, HMSO, ISBN 0 11 041735 6.<br />
Some Chemicals Identified in Pyrolysis Oil<br />
Acids<br />
Oxopentanoic acid Acetic acid Benzoic acid<br />
Butyric acid Formic acid (methanoic acid) Glycolic acid<br />
86
Hexadecanoic acid Hexanoic acid Propanoic (propionic) acid<br />
Valeric acid (pentanoic acid)<br />
Sugars<br />
1,6-anhydroglucofuranose Cellobiosan D-arabinose<br />
D-glucose D-xylose Fructose<br />
Oligosacharides<br />
Levoglucosan<br />
Ketones<br />
1-hydroxy 2-propanone 2,5-hexanedione 2-butanone<br />
2-ethylcyclopentanone 2-methyl-2-cyclopenten-1-one 2-methylcyclohexanone<br />
2-methylcyclopentanone 3-ethylcyclopentanone 3-methyl-2-cyclopenten-1-one<br />
3-methylcyclohexanone 3-methylcyclopentanone 3-methylindan-1-one<br />
C8 (=) cyclic ketones<br />
C8 cyclic ketonesC9 (=) cyclic ketones<br />
C9 cyclic ketones Cyclohexanone Cyclopentanone<br />
Dimethylcyclopentanone Hydroxyacetone Methylcyclopentene-ol-one<br />
Trimethylcyclopentanone<br />
Phenolics<br />
(4-hydroxyphenyl)-1-ethanone 2,3,5-trimethylphenol 2,3,6-trimethylphenol<br />
2,3-dimethyl phenol 2,4,6-trimethylphenol 2,4-xylene<br />
2,5,8-trimethyl-1-naphthol 2,5-dimethyl phenol 2,6-dimethoxy phenol<br />
2-methoxy-4(1-propenyl)phenol 2-methoxy-4-n-propylphenol 3-methyl-1-naphthol<br />
4-ethyl-1,3-benzenediol<br />
4-ethyl-2-methoxyphenol 4-ethylguaiacol<br />
4-hydroxy-3,5-dimethoxyphenylethanone 4-hydroxy-3-methoxybenzaldehyde (Vanillin)<br />
4-methyl-2-methoxyphenol 4-propylguaiacol 6,7-dimethylnaphthol<br />
C2 dihydroxybenzene C3 dihydroxybenzene C3 phenols<br />
C4 dihydroxybenzene C4 phenol C4 phenols<br />
C5 (=) phenols C5 dihydroxybenzene C5 phenols<br />
C6 (=) phenols C6 dihydroxybenzene C6 phenols<br />
Catachol Dimethyldihydroxybenzene Dimethylnaphthol<br />
Ethylmethylphenol Eugenol Guaiacol<br />
Hydroquinone Isoeugenol M-cresol<br />
Methylbenzenediol O-cresol P-cresol<br />
p-ethylphenol Phenol Resorcinol<br />
Syringaldehyde Trimethyldihydroxybenzene Trimethylnaphthol<br />
Other Oxygenates<br />
1-acetyloxy-2-propanone 2,3-dihydro-1,4-benzodioxin 2-butoxyethanol<br />
2-furaldehyde 2-furanone 2,5-dimethylfuran<br />
2-methyl-2-butenal 2-methylcyclopentanol 2-methylfuran<br />
3-hydroxy-2-methyl-4-pyrene 4-butyrolactone 5-hydroxymethyl-2-furanone<br />
5-methyl furfural 5-methyl-2(3H)furanone Acetal<br />
Acetaldehyde Angelicalactone Acetol<br />
Dibenzofuran Ethyleneglycol Formaldehyde<br />
Furfuryl alcohol Glyoxal Hydroxyacetaldehyde<br />
Methanol Methyl glyoxal Methyl formate<br />
Hydrocarbons<br />
1-eicosene 1-heneicosene 1-heptadecene<br />
1-hexacosene 1-nonadecene 1-octadecene<br />
1-pentacosene 1-tetracosene 1-tricosene<br />
87
1-tridecene<br />
2,6,10,14-tetramethylpentadecane 4-methylanisole<br />
Benzene Dimethylcylopentene Eicosene Heneicosene<br />
Heptadecene Hexadecene Methylindane<br />
Nonadecene Octadecene Pentacosene<br />
Pentadecene Styrene Tetracosene<br />
Tetradecene<br />
Tetrahydrocyclopropyl(a)Indian<br />
Toluene<br />
Tricosene<br />
9.3 Hazards associated with the pyrolysis process<br />
Apart from hazards associated with the pyrolysis oil, there are also specific hazards associated with the<br />
pyrolysis process. The main hazard is that of fire or explosions. The presence of oxygen with<br />
flammable materials at elevated temperatures is a relatively dangerous combination and therefore the<br />
process needs to be extremely well controlled with rapid and automated emergency response systems<br />
in place. Such systems were incorporated into the PDU and proved effective. High temperature wood<br />
flake driers in particleboard factories possess similar hazards to that of the pyrolysis process and<br />
therefore such hazards should be manageable by this industry.<br />
Another hazard is that associated with carbon monoxide emissions. All lignocellulose pyrolysis<br />
processes produce varying amounts of carbon monoxide. Carbon monoxide toxicity is well understood<br />
and procedures for prevention of exposure are well documented.<br />
88
Chapter 10. Passivation/isolation of liquid<br />
pyrolysis product<br />
This chapter summarises the results relating to the passivation of the liquid pyrolysis product and<br />
isolation of constituent compounds. An objective of the research was to determine a suitable refining<br />
technique for purification of phenolic compounds within the pyrolysis oil. This task was broadened to<br />
include the isolation and separation of product furfuryls formed by low temperature pyrolysis.<br />
10.1 Furfuryl compound isolation<br />
Clean-up and concentration of the Stage 1 fast pyrolysis liquid product gave a clear orange-coloured<br />
oil. The clean up procedure involved filtration to remove any fine particulate material. The filtrate was<br />
then extracted with sodium hydrogen carbonate, according to the method of Chum and co-workers 27 ,<br />
in order to remove phenolic material. Most of the furfuryl compounds remained in the filtrate.<br />
Fractional distillation of the filtrate under reduced pressure gave three discrete fractions whose boiling<br />
points were in general accord with those recorded for 2-furfurylaldehyde, 3-furfurylaldehyde and<br />
furfuryl alcohol.<br />
10.2 Phenolic compound isolation<br />
Pyrolysis oil is thermally unstable. This is mainly due to the low pH of the oil and to the presence of<br />
highly reactive phenols containing carbonyl or carboxylic acid groups. When heated, or left to stand at<br />
room temperature for extended periods of time, these species are able to polymerise with other phenols<br />
and furfuryls, resulting in a complex, multi-phased, residue. In order to stabilise the oil, and permit<br />
product refinement, the reactive species must be either removed, or passivated. Conventional<br />
separation was not feasible because such techniques trigger the polymerisation reactions. Therefore,<br />
the passivation approach was explored.<br />
Clean-up and concentration of the high temperature fast pyrolysis liquid products gave, depending<br />
upon the temperature employed, clear oils ranging in colour from a pale red to a red-black. Preliminary<br />
investigations indicated that both borohydride and catalytic hydrogenation effectively reduce the active<br />
carbonyl species to their condensation inactive alcohol derivatives.<br />
The procedure involved filtration of the oil to remove any fine particulate material followed by a<br />
sodium hydrogen carbonate or sodium hydroxide extraction of the phenols, based on the method<br />
developed by Chum and co-workers 27 . The extract was then acidified in order to liberate the phenols.<br />
If heated above 100 o C, the mixture quickly darkened and small black resinous flakes formed and after<br />
about one minute a distinct solid and liquid phase would appear. When catalytically hydrogenated<br />
(3000 psi H 2 /Pd catalyst), or reduced with sodium borohydride, the resulting phenolic mixture was<br />
stable at 100 o C for several minutes although it eventually darkened.<br />
While fractional distillation of the product phenols would be the method of choice, the vast array of<br />
compounds in the mixture makes discrete separation of any one phenol virtually impossible. Further,<br />
while a crude fractionation was effected, all one could do was take ‘cuts’ at discrete temperature<br />
intervals.<br />
An alternative approach is to use a non-ionic macro reticular resin, although that was not employed in<br />
this study. Such a medium would enable the mixture to be separated into discrete compounds, with the<br />
separation medium being able to be continually regenerated.<br />
Conventional distillation of the passivated product was not attempted, although this may have resulted<br />
in better separation of phenols with similar boiling points.<br />
89
Chapter 11: Market analysis<br />
This chapter provides a preliminary market analysis of the products obtained from both the pyrolysis<br />
and steam distillation processes. Based on the current level of understanding of the various processes,<br />
any market analysis can only be tentative at this stage. This is because there is no data on the<br />
feasibility of product substitution, nor is there any data on the economics associated with a commercial<br />
scale plant. Moreover, the costs associated with post-processing and refining of the various products in<br />
order to ensure their compatibility in the relevant markets are unknown. However, despite these<br />
limitations, certain aspects of the market analysis are feasible.<br />
The main products from the thermochemical processes are:<br />
• Furfural and Furfuryl alcohol<br />
• Low molecular weight phenols<br />
• Cellulose rich fibre<br />
• Eucalypt essential oil<br />
11.1 Furfural<br />
Furfural is the main furfuryl product from Stage 1 of the process. Currently, furfural is manufactured<br />
from certain agricultural residues, such as the hulls of rice and oats, corncobs, bagasse, or any other<br />
pentosan rich waste material. The process involves steam-acid digestion, normally with sulphuric acid.<br />
There are a number of commercial processes for the manufacture of furfural with varying degrees of<br />
efficiency. The simplest and oldest process involves pre-treatment of the pentosan rich feed with a 4%<br />
solution of sulphuric acid. The acid treated feed is then loaded into a reactor and 1 to 1.5 tons/hr of<br />
steam passed through from bottom to top for a period of 4 to 5 hours. The furfural is collected in the<br />
condensate and distilled. Yields from this process are about 50% of the theoretical maximum<br />
(determined by the pentosan content). This batch type process is used extensively in poorly developed<br />
countries, the main producers of furfural, but much less so in Western countries. All batch type<br />
processes require considerable amounts of steam and produce large quantities of effluent. The more<br />
sophisticated processes are continuous and achieve yields better than 60% of the theoretical maximum.<br />
A new generation process, called the SUPRAYIELD Process, is supposed to be able to achieve 100%<br />
of the theoretical yield, although it has not achieved this to date. The process incorporates principals<br />
which minimise side reactions that lead to loss of furfural. Whether or not the process can actually<br />
achieve the maximum yield is irrelevant from the point of view of this study. What matters is that very<br />
high yields are achievable through conventional processes and these yields will only improve.<br />
Moreover, the chemical and energy requirements of these newer processes are far below those of<br />
current commercial significance. A disadvantage of current furfural plants is the treatment of waste<br />
water, which can add significant costs to the overall process, as well as the formation of a lignin rich<br />
waste material similar to black liquor.<br />
11.1.1 Current applications of furfural<br />
Furfural (also known as artificial ant oil, pyromucic aldehyde, furfuraldehyde or bran oil), has a<br />
number of commercial applications and these are briefly discussed.<br />
Wetting agent<br />
An important application of furfural is as a wetting agent in the manufacture of abrasive wheels and<br />
brake linings.<br />
90
Extractant<br />
Furfural is widely used as an extracting agent. It is able to join with compounds containing double<br />
bonds through a process called “intermolecular conjugation”. In this process, furfural is used to either<br />
remove unsaturated impurities from an otherwise saturated product, or it is used to isolate unsaturated<br />
compounds from a more complicated product mixture. Examples of this type of refinement include<br />
purification of lubricating oils, rosin and butadiene.<br />
Solvent<br />
Furfural is used as a solvent for various cellulose derivatives such as cellulose acetate and<br />
nitrocellulose.<br />
Fungicide<br />
It has been known for many years that furfural is a very effective fungicide. In fact, it is much more<br />
effective than formaldehyde and is nowhere near as toxic. For example, wheat seeds infected with<br />
wheat smut (Tilletis foetens) must be soaked for 12 hours in 0.05% formaldehyde solution to effect<br />
treatment. However, only 3 hours are required for treatment using a furfural solution of the same<br />
concentration. Moreover, the furfural solution results in a mere 4% reduction in germination power<br />
whereas germination power is completely destroyed with the formaldehyde solution. The efficacy of<br />
furfural as a fungicide has also found use on growing plants and on wood 119,120 .<br />
Nematocide<br />
Nematodes, or eelworms, are a small plant parasite which can severely damage crops of potatoes,<br />
beets, tomatoes, bananas, berries citrus fruits and many others. On the global scale, the damage caused<br />
by plant-parasitic nematodes is very serious and is in the order of US$60 billion annually 121 . Furfural<br />
does not kill nematodes. Instead, it alters the soil microflora to such an extent that the nematode<br />
population is effectively eliminated. It is believed that furfural stimulates the growth of bacteria<br />
antagonistic to nematodes. Moreover, furfural has a number of advantages over currently employed<br />
nematocides which function by direct toxicity. It is cheap, non-toxic to humans (it is naturally present<br />
in many foods such as fruit juices and bread, although it does have a potential for mutagenesis in some<br />
species of mammal exposed to very high doses), easy to apply as a spray in solution form and is not<br />
accumulated by the plant.<br />
Chemical precursor<br />
Furfural is a precursor in the industrial synthesis of several important compounds such as furfuryl<br />
alcohol and lysine. In fact, 65% of all furfural produced is converted to furfuryl alcohol 119,120 .<br />
Resin<br />
Furfural is similar to phenol with respect to resin formation and in some respects it is superior. For<br />
example, furfural resins have a higher solvent resistance and are not as brittle.<br />
11.1.2 World production of furfural<br />
The total annual world production of furfural is in excess of 280,000 tons. China is by far the largest<br />
producer, accounting for more than 70% of world production. Australia does not produce any furfural,<br />
although this will soon change with the construction of a furfural/furfuryl alcohol plant at a sugar mill<br />
at Proserpine in Queensland. The mill will produce furfural from sugarcane bagasse using a<br />
conventional hydrolysis technology. Table 11.1.2.1 displays the countries in which furfural is<br />
manufactured and the approximate quantities produced.<br />
91
Table 11.1.2.1. World production of furfural in 2001. 122<br />
Country Principal Feedstock Production (tpa)<br />
China<br />
Thailand<br />
Dominican Republic<br />
South Africa<br />
Spain<br />
Others (Incl. India & South America)<br />
Russia (used internally, only)<br />
Corncobs<br />
Corncobs<br />
Bagasse<br />
Bagasse<br />
Corncobs<br />
Corncobs/Bagasse<br />
Corncobs<br />
200,000<br />
8,500<br />
32,000<br />
20,000<br />
6,000<br />
280,000<br />
Furfural may become an increasingly important commodity as the search for petroleum alternatives<br />
gains pace. This is because it is “the only organic compound derived from biomass that can replace the<br />
crude oil based organics used in industry” 122 .<br />
11.1.3 World consumption of furfural<br />
As mentioned, furfural is an intermediate in the synthesis of furfuryl alcohol, with about two-thirds<br />
being used for this purpose. However, this usually occurs at the furfural plant as an additional step and<br />
so furfuryl alcohol is strongly correlated with furfural with respect to country of production and<br />
quantities produced. Table 11.1.3.1 lists furfural consumption according to country. This does not<br />
include furfuryl alcohol.<br />
Table 11.1.3.1. World consumption of furfural in 2001. 122<br />
Country/ Continent<br />
Sales (tpa)<br />
Europe<br />
12,000<br />
USA<br />
8,000<br />
Middle East<br />
7,000<br />
Japan<br />
6,000<br />
Taiwan<br />
5,000<br />
South America<br />
5,000<br />
China<br />
5,000<br />
Australia/South Africa<br />
2,000<br />
Others<br />
up to 50,000<br />
Total 50,000 - 100,000<br />
It is apparent from Table 11.1.3.1 that relatively little furfural is consumed in Australia. The United<br />
States is the largest national consumer, although compared with major commodities even the quantities<br />
of furfural consumed by the United States are quite small. The price of furfural is generally about<br />
US$600-1,000/ton and is mainly dependent upon the availability of Chinese supplies. For example,<br />
during 1995-1997 the price of furfural was relatively high due to drought in China. Table 11.1.3.2 lists<br />
the recent market prices of furfural.<br />
92
Table 11.1.3.2. Market prices of furfural in 2001. 122<br />
Date<br />
1995<br />
1996<br />
1997<br />
1998<br />
1999<br />
2000<br />
2001<br />
2002<br />
Price Range ($/t)<br />
675-1,250<br />
840-1,845<br />
860-1,225<br />
830-990<br />
690-865<br />
630- 705<br />
>650<br />
500- 1,100<br />
11.2 Furfuryl alcohol<br />
Furfuryl alcohol is produced in relatively small amounts from Stage 1 of the pyrolysis process.<br />
However, it may also be derived from the main product, furfural, through standard industrial<br />
techniques. Industrially, furfuryl alcohol is manufactured from furfural by hydrogenation. Virtually all<br />
furfuryl alcohol is produced at the same plants as furfural because furfuryl alcohol synthesis is the<br />
main application of furfural.<br />
11.2.1 Current applications of furfuryl alcohol<br />
Furfuryl alcohol has a number of important commercial applications, some of which are briefly<br />
discussed. The uses of furfuryl alcohol are generally similar to that of furfural.<br />
Wetting agent<br />
Like furfural, an important application of furfuryl alcohol is as a wetting agent in the manufacture of<br />
abrasive wheels and brake linings.<br />
Foundry cores<br />
Because of its excellent strength and thermal resistance, furfuryl alcohol is used extensively in the<br />
manufacture of foundry cores, grinding disks and sharpening stones etc.<br />
Resins<br />
Furfuryl alcohol is used to fortify and improve the performance of urea formaldehyde resins. It is also<br />
used as a resin in its own right.<br />
Corrosion-resistant sealants and cements<br />
Furfuryl alcohol is used as a mortar for bonding acid-proof brick and chemical masonry. It also used as<br />
a corrosion resistant sealant.<br />
11.2.2 World production of furfuryl alcohol<br />
The main producers of furfuryl alcohol are also the main producers of furfural. Approximately 65% of<br />
all furfural is converted to furfuryl alcohol. The annual world production of furfuryl alcohol is around<br />
180,000 tons. At present Australia is not a producer of furfuryl alcohol, although this may change<br />
when the Proserpine furfural plant is complete. China is the main producer of furfuryl alcohol. Much<br />
of the production of furfural and furfuryl alcohol has shifted to the less developed countries. This is<br />
due to their cheaper labour costs and lower environmental protection standards.<br />
93
11.2.3 World consumption of furfuryl alcohol<br />
The world consumption of furfuryl alcohol for the year 2001 is listed in Table 11.2.3. by<br />
country/continent. It is apparent from that compared to other nations; Australia and South Africa<br />
consume a relatively large proportion of world furfuryl alcohol production. However, the actual<br />
volume of this consumption is quite small compared to major commodity items. The United States is<br />
the largest consumer of furfuryl alcohol followed closely by Germany.<br />
Table 11.2.3.1. World consumption of furfuryl alcohol in 2001. 122<br />
Country/ Continent<br />
Europe<br />
USA<br />
Japan<br />
Taiwan<br />
South America<br />
China<br />
Australia/South Africa<br />
UK<br />
Germany<br />
Others<br />
Sales (tpa)<br />
7,000<br />
20,000<br />
15,000<br />
5,000<br />
10,000<br />
6,000<br />
6,000<br />
12,000<br />
18,000<br />
31,000<br />
One of China’s largest producers of furfuryl alcohol is the Hebei Xingtai Chunlei Furfuryl Alcohol Co.<br />
Ltd where annual production is around 10,000 tons. The 2004 base price of furfuryl alcohol from this<br />
plant is US$530/ton (not including shipping). For comparative purposes, the cost of furfural from the<br />
same plant is US$380/ ton. Other large Chinese producers, such as the Shandong Dongyue Chemical<br />
Co. Ltd, do not have a fixed price for their furfuryl alcohol. Rather, the price is negotiable and is<br />
dependent mainly on the desired quantity.<br />
11.3 Low molecular weight phenols<br />
Phenols are a class of compounds characterised by a hydroxyl group attached to a benzene ring. They<br />
are the main low molecular weight volatile product from Stage 2 of the pyrolysis process. At present,<br />
phenols of industrial importance are synthesised from petroleum or are extracted from natural<br />
products.<br />
In this section the market status of the main phenols associated with the fast pyrolysis of Australian<br />
hardwood will be discussed. These phenols are:<br />
• Phenol<br />
• Guaiacol<br />
• Eugenol<br />
• Isoeugenol<br />
• Vanillin<br />
With the exception of phenol itself, most of these phenols are associated with essential oils and in fact<br />
a few, such as eugenol, comprise the dominant compound of several important essential oils. The total<br />
world market for essential oils is around 312 million USD. At room temperature, vanillin is a solid and<br />
therefore not classified as an essential oil, although it is dissolved in some essential oils. The main<br />
producers of essential oils are China, Brazil, Malaysia, India, Indonesia and Thailand. Many other<br />
countries, including Australia, export essential oils, although the production outputs from these<br />
countries are relatively small.<br />
94
There are a few other important low molecular weight phenols obtained from the fast pyrolysis process<br />
such as syringol, coniferaldehyde and syringaldehyde. However, these compounds currently have<br />
limited industrial application. This is mainly because of the difficulty, and hence cost, associated with<br />
their derivation.<br />
For most of the phenols, actual production figures and import and export data are often poorly<br />
documented. This is because these compounds are generally produced in small quantities throughout<br />
the third world as extractives from natural products. However, the information that is available reveals<br />
that production is small and very fragmented.<br />
11.3.1 Phenol<br />
At present, phenol is synthesised from petroleum products. The process involves reaction of benzene<br />
with propylene to form cumene, which is then oxidised to yield cumene hydroperoxide. Subsequent<br />
cleavage of cumene hydroperoxide yields phenol and acetone. Other phenols may then be derived<br />
from phenol through various substitution reactions. Approximately 20,000 tons/pa of phenol is<br />
manufactured in Australia. All of it is produced by Huntsman Chemicals (plant formerly owned by<br />
Monsanto) at West Footscray in Victoria. Australian imports of phenol are substantial and are<br />
estimated to be around 80 million dollars/annum. The real figure is probably much higher because this<br />
figure does not account for phenol present in resin formulations.<br />
In 2001, world production of phenol was approximately 8 Mt and the corresponding price was about<br />
US$550-700/ton 123 . Thus, the total market value of raw phenol is about 4.4-5.6 billion USD. In 1981,<br />
world production was only 3.3 Mt 124 . It is therefore apparent that in the last 20 years, the demand for<br />
phenol has increased enormously and it is expected that this trend will continue into the foreseeable<br />
future with an average of 3-4 new manufacturing plants being commissioned annually 123 .<br />
Current Application of Phenol<br />
Phenols are used in a wide variety of applications, some of which are briefly discussed.<br />
Resins<br />
A very important application of phenol is in resins/adhesives. Such resins are utilised widely in the<br />
wood panels industry where they impart high strength and dimensional stability to the panel products.<br />
Phenolic resins generally incorporate formaldehyde as a cross-linking agent.<br />
Chemical precursor<br />
Phenol is the precursor for the synthesis of many aromatic compounds such as adipic acid, salicylic<br />
acid, phenolphthalein, pentachlorophenol, acetophenetidin, picric acid, germicidal paints,<br />
pharmaceuticals, laboratory reagent, dyes and indicators. Many of the compounds derived from phenol<br />
have important industrial applications ranging from resins (such as resorcinol) to explosives (such as<br />
2,4,6-trinitrophenol (picric acid)) to pharmaceuticals (such as aspirin).<br />
Slimicide<br />
Phenol is an effective slimicide. Slimicides prevent slimy growths such as those which can occur on<br />
wood pulps.<br />
Biocide/disinfectant<br />
Phenol is quite toxic to a range of organisms and it has therefore been classified as a biocide. It is also<br />
used as a general disinfectant.<br />
95
11.3.2 Guaiacol<br />
There is relatively little information available on the market status of guaiacol. Guaiacol is considered<br />
a specialty chemical and most is produced in China. For example, Zhejiang JIaxing Juqiang Chemical<br />
Co.,Ltd manufactures approximately 300 tons/year of guaiacol while Jade Fine Chemicals produces<br />
4,000 tons/year.<br />
The guaiacyl group is the dominant monomeric unit in the lignin of conifers but is also present in<br />
hardwoods where it exists in approximately equal proportion with the syringyl group. Guaiacol is<br />
naturally present in small amounts in coffee and it is also present as a by-product in fruit juice<br />
contaminated with Alicyclobacillus. Guaiacol is also an important component of wood based<br />
creosotes.<br />
Guaiacol is not a chemical that is purchased in bulk quantities. This is because of its limited<br />
availability and specialty applications. The price of guaiacol is around US$5-60/kg depending on<br />
where it is sourced and on its purity.<br />
Current applications of guaiacol<br />
Pharmaceutical<br />
Guaiacol has a number of pharmaceutical applications. It is used an antituberculic and expectorant. It<br />
is also used as a disinfectant agent.<br />
Preservative<br />
Since antiquity guaiacol has been used as a preservative for all manner of applications. Guaiacol is an<br />
active ingredient in the preservative, wood creosote.<br />
Resin<br />
Guaiacol is used in resins for root canal treatments. The resin is a guaiacol-formaldehyde type.<br />
11.3.3 Eugenol<br />
Eugenol is naturally present in cloves and this is its primary commercial source. The clove oil is<br />
treated with excess aqueous sodium hydroxide to dissolve the eugenol. The remaining oil constituents<br />
are then removed with ether. The sodium eugenol is acidified to yield eugenol which may then be<br />
purified by distillation 125 . It is also a major constituent of cinnamon, bay, basil and pimento oils as well<br />
as many other essential oils. The crude extract is called “oil of cloves” and has a wholesale value of<br />
US$3.75-3.85/kg. The corresponding wholesale value of eugenol (greater than 99% purity) is<br />
US$5.00-12.00/kg. World production figures for eugenol are not available. The United States is the<br />
largest consumer of eugenol. An idea of the size of the eugenol market may be obtained from data of<br />
the combined US imports of eugenol and isoeugenol listed in Table 11.3.4.2. Australia imports small<br />
quantities of eugenol, as the pure compound and as an ingredient in a wide range of foods, flavourings,<br />
pharmaceuticals and perfumes.<br />
By world commodity standards, eugenol is produced in relatively small quantities. For example, the<br />
Tanzanian company, Zanzibar State Trading Corporation, has a plant which produces about<br />
15tons/annum.<br />
Current applications of eugenol<br />
This compound is used to prepare microscopic slides for viewing and is also a local anaesthetic for<br />
toothaches. Eugenol is used in germicides, perfumes, and mouthwashes, in the synthesis of vanillin,<br />
96
and as a sweetener or intensifier. Eugenol is also used as a precursor for the synthesis of other<br />
chemicals.<br />
11.3.4 Isoeugenol<br />
Commercially, isoeugenol is prepared by isomerisation of eugenol with caustic potash. It is produced<br />
by a number of companies in Europe and the United States, as well as in Asia. Some of the more<br />
important European and US companies are listed in Table 11.3.4.1.<br />
The United States is the largest importer of eugenol and isoeugenol. Table 11.3.4.2 lists the combined<br />
imports of eugenol and isoeugenol into the United States for the years 1985-1988.<br />
Table 11.3.4.1. Main producers of Isoeugenol in the US and Europe.<br />
United States Producers<br />
European Producers<br />
Berje, Inc. Bloomfield, New Jersey<br />
Biddle Sawyer, Inc. Keyport, New Jersey<br />
Chem-Fleur, Inc. Newark, New Jersey<br />
Chemical Division-UOP, Inc. East Rutherford,<br />
New Jersey<br />
Elan Chemical Company, Inc. Newark, New<br />
Jersey<br />
Firmenich, Inc. Princeton, New Jersey<br />
Fritzsche Dodge and Olcott, Inc. East<br />
Hanover, New Jersey<br />
Bush Boake Allen LTD. Sudbury, United<br />
Kingdom<br />
Charabot SA. Grasse, France<br />
Givaudan France. Lyon, France<br />
Haarmann and Reimer GmbH. Holzminden,<br />
Germany<br />
Lautier SA-Florasynth. Grasse, France<br />
Quest International U.K. Ltd. Ashford, United<br />
Kingdom<br />
V. Mane Fils SA. Le Bar Sur Loup, France<br />
Givaudan Corporation. Clifton, New Jersey<br />
Haarmann and Reimer Corporation.<br />
Springfield, New Jersey<br />
Norda, Inc. Boonton, New Jersey<br />
Penta Manufacturing Company. Fairfield,<br />
New Jersey.<br />
Schweizerhall, Inc. Chemical Division. South<br />
Plainfield, New Jersey<br />
Unilever United States, Inc. Quest<br />
International<br />
Boonton, New Jersey<br />
Table 11.3.4.2. Combined quantities of eugenol and isoeugenol imported into the US. Source: Chemical<br />
Marketing Reporter, 1989.<br />
Country of Origin<br />
Volume Imported (kg)<br />
1985 1986 1987 1988<br />
France<br />
Spain<br />
Singapore<br />
Indonesia<br />
Japan<br />
Other<br />
18,617<br />
0<br />
39,683<br />
74,155<br />
0<br />
2,895<br />
11,895<br />
10,021<br />
0<br />
92,242<br />
6,314<br />
5,206<br />
0<br />
0<br />
98,205<br />
140,093<br />
11,424<br />
14,440<br />
32953<br />
0<br />
48098<br />
381801<br />
7395<br />
8460<br />
Total 135350 125678 264,162 478707<br />
97
Current applications of isoeugenol<br />
Flavouring agent<br />
The main application of isoeugenol is as a flavouring agent in non-alcoholic beverages, baked foods<br />
and chewing gum.<br />
Fragrance ingredient<br />
Isoeugenol has a strong aromatic smell and for this reason it is used as an ingredient in fragrances. In<br />
the US, approximately 18,000kg/year of isoeugenol are used for this purpose. It is used to fragrance<br />
soaps, detergents and lotions.<br />
Chemical precursor<br />
Isoeugenol is also used as a precursor in the synthesis of vanillin.<br />
11.3.5 Vanillin<br />
Vanillin may be derived from vanilla beans or it may be produced synthetically. Vanilla (synthetic and<br />
natural) represents only 0.75% of the international spice market, yet it accounts for about 7% of its<br />
total value. In 2000, the world production of vanillin was around 3,500 tons and the corresponding<br />
price was about US$15/kg. Thus, the total world market value for vanillin is around 52.5 million USD.<br />
The world market for vanilla beans is around 300 million USD and their price is around US$82/kg.<br />
Therefore, substitution of vanillin from vanilla beans by synthetically manufactured vanillin is ever<br />
increasing. There are few large producers of vanillin in the world. The main producers are listed<br />
below:<br />
• Brichima SpA, Italy<br />
• Toyotoma Perfumery Co.Ltd.,Japan<br />
• Bush Boake Allen Ltd., U.K<br />
• ICI Katalco,USA<br />
• Rhone Poulenc Inc.,USA<br />
• Monsanto Co,USA<br />
• Ritter International ,USA<br />
• Ungerer & Co., Inc.USA<br />
• Eastman Fine Chemicals,USA<br />
• Ube Industries,Japan<br />
• Euro Vanillin,Norway<br />
Vanillin is prepared by extraction from vanilla beans or it is extracted from the waste liquor from<br />
sulphite pulping. Vanillin is extracted directly from the liquor and synthesised from guaiacol via the<br />
Reimer-Tiemann reaction, which is also extracted from the liquor.<br />
Australia is an importer of vanillin. The actual quantities imported are uncertain. This is because much<br />
of the imported vanillin is contained in manufactured products.<br />
Current application of vanillin<br />
Flavouring agent<br />
By far the most important application of vanillin is as a flavouring agent where it imparts the flavour<br />
‘vanilla’ (hence the name).<br />
98
Perfumery agent<br />
Vanillin is used as an aromatic additive in perfume and as a masking agent in unpleasant smelling<br />
products. For some applications, such as air fresheners, it is used to provide an alternative, more<br />
pleasant fragrance.<br />
11.4 Application for furfuryls and phenols derived from fast<br />
pyrolysis of hardwood<br />
With the exception of phenol itself, the current applications of the phenols produced through the fast<br />
pyrolysis process are far too specific, and the global demand far too small, to enable large scale supply<br />
into these markets, despite the current high prices demanded. This is because the current demand for<br />
these phenols is quite low, and likely to remain so, and therefore any substantial increase in supply will<br />
not be matched by a corresponding increase in demand. However, if alternative applications for these<br />
compounds could be developed then their demand may substantially increase.<br />
The envisaged application for the furfuryls and phenols derived from the fast pyrolysis of hardwood is<br />
resins, and in particular adhesives for wood panels manufacture. The global market for adhesives is<br />
enormous. It is estimated that global consumption of phenolic adhesives is in the order of 20 billion<br />
USD/year. Moreover, due to their relatively high cost, phenolic adhesives are used for only 5% of all<br />
particleboard, with most particleboard incorporating urea-formaldehyde adhesive. Urea formaldehyde<br />
has few redeeming qualities. For example, it is relatively weak and is not water resistant. However, its<br />
one redeeming feature is its low price, and this is sufficient to ensure that it dominates the market. The<br />
envisaged application of the furfuryls and phenols derived from the pyrolysis process is not only the<br />
substitution of the petroleum based phenols currently employed, but also the substitution of ureaformaldehyde<br />
resins as well. This can only be achieved through development of resin formulations<br />
which are cheap and which possess the necessary attributes for use as wood adhesives. Furfural and<br />
furfuryl alcohol currently have very little usage in wood panels manufacture. This is mainly due to<br />
their prohibitive cost compared with the cheaper alternatives.<br />
A trend which is occurring throughout the world is the elimination of free formaldehyde from<br />
manufactured products. Eventually this will probably result in the elimination of formaldehyde<br />
completely. This is because formaldehyde is highly toxic, both acutely and chronically. This means<br />
that urea-formaldehyde based adhesives, which currently dominate the market, will, in the not-todistant<br />
future, be phased out. This will provide an excellent opportunity for non-formaldehyde based<br />
resins to become established in the market. Phenolic resins currently employ formaldehyde as a crosslinking,<br />
or hardening, agent. However, when formulated with furfural, formaldehyde is not required.<br />
There is still much research to be done in order to fully develop formaldehyde free resin formulations,<br />
but with the availability of low cost supplies of raw materials derived from fast pyrolysis of<br />
lignocellulose, the impetus for this research can increase.<br />
The utilisation of many of the phenols associated with the fast pyrolysis process in resin applications<br />
has received little attention. This is because of their price as well as the difficulty in justifying the<br />
research based on the grossly insufficient quantities available. However, some fruitful research has<br />
been performed on utilisation of the whole liquid product from the fast pyrolysis of wood in adhesive<br />
applications. It has been reported that up to 50% substitution of phenol can be achieved with pyrolysis<br />
oil in particleboard manufacture 126 and workers at SRI International have developed a pyrolytic<br />
process for the derivation of phenols in which plywood residues are pyrolysed to produce oil in 25%<br />
yield. The oil is utilised in the unmodified state to substitute for a proportion of the phenol in plywood<br />
manufacture 127 . Moreover, many workers have developed techniques for the production of phenolic<br />
adhesives and extenders from black liquor, a material quite similar to pyrolysis oil with respect to the<br />
phenolic content 127-130 . Therefore, it may be possible, with only a small amount of preparation, to<br />
develop adhesives based on the bulk phenolic content of the liquid product. Alternatively, the liquid<br />
product may need to be modified in order to increase its thermal stability and reactivity as a resin. This<br />
99
will involve passivation by a process such as hydrogenation and it will involve purification of the<br />
product to remove components, such as acetic acid and methanol, not associated with resin formation.<br />
The costs associated with these kinds of modifications are presently unknown. However, it has been<br />
reported that the cost to produce phenol rich oil, through fast pyrolysis, which is suitable as an<br />
extender in phenol-formaldehyde adhesives is approximately $300USD/ton 126 , considerably lower than<br />
the price of phenol, and therefore it may be feasible to further refine the product while still keeping the<br />
overall process economic.<br />
From the fast pyrolysis experimentation it was found that up to 25% mass loss may occur from a<br />
single treatment. However, the condensable volatile compounds represent only about 10% of this<br />
material, although in some cases the proportion is significantly higher. This would indicate that the<br />
process does not achieve sufficient fragmentation and subsequent volatile compound formation from<br />
the primary decomposition products. Thus, as it stands, the process for furfuryls and phenols<br />
production is not economic because insufficient product is formed and because a substantial proportion<br />
of the feed material converted to volatile products is oligomeric and not within the desired molecular<br />
weight range. It may be the case that this material possesses sufficient reactivity that it is quite suitable<br />
as a wood adhesive extender. The work conducted by others would suggest that this is indeed possible<br />
and if so 127 then the economics of the process are much more favourable. Alternatively, the process<br />
could be further optimised by improving the efficiency of conversion of the primary oligomeric<br />
products to their monomeric constituents. Further research incorporating simple catalysts into the<br />
pyrolysis system has validated this notion.<br />
In conclusion, the research has demonstrated that fast pyrolysis of hardwood at low temperatures under<br />
oxygen containing atmosphere yields a liquid product with low molecular weight phenol content<br />
roughly comparable to that obtained through conventional fast pyrolysis conducted at much higher<br />
temperatures. The advantages of the process are a simplification of product composition, resulting in<br />
increased stability and simplification of product purification, as well as a substantial reduction in<br />
energy costs due to the lower temperature requirements. The simplification of product mixture is due<br />
to the low proportion of cellulose decomposition, a phenomenon not present in conventional pyrolysis,<br />
as well as significant differentiation between hemicellulose and lignin pyrolysis. The overall yield of<br />
monomeric phenols is still too low to ensure that the process is economic, although with improved<br />
conversion, or through incorporation of the oligomeric material, the process economics may be<br />
substantially improved.<br />
11.5 Cellulose<br />
A potentially important by-product from the low-temperature fast pyrolysis process is the cellulose<br />
rich residue. This is because cellulose is an extremely important material produced in vast quantities.<br />
Cellulose has a number of applications which are briefly summarised.<br />
11.5.1 Applications of cellulose<br />
Paper products<br />
The global cellulose market is gigantic. The market size of the pulp and paper industry alone is in<br />
excess of 200 billion USD/annum. This does not include reconstituted cellulose products which<br />
contribute significantly to the overall cellulose market. The status of the Australian paper market in<br />
recent years is summarised in Table 11.5.1.1.<br />
It is apparent from Table 11.5.1.1 that Australia has a substantial trade deficit in paper based products.<br />
In the 2000-2001 financial year, this deficit was 2.1 billion dollars. This trade situation is not<br />
favourable to Australia, although the corresponding value of woodchip exports (70% derived from<br />
hardwood), most of which were converted to paper products, was around 7.5 billion dollars. Thus,<br />
relative to our consumption, Australia is a large producer of woodchips, the raw material for cellulose<br />
production, and a net importer of manufactured paper products.<br />
100
Table 11.5.1.1. Australian market for pulp (cellulose based) products (000’s tonnes). Source:<br />
www.nafi.com.au<br />
Product<br />
Newsprint<br />
Printing and<br />
Writing<br />
Tissues<br />
Packaging and<br />
Industrial<br />
Source<br />
Production<br />
Imports<br />
Exports<br />
App. Cons.<br />
Production<br />
Imports<br />
Exports<br />
App. Cons.<br />
Production<br />
Imports<br />
Exports<br />
App. Cons.<br />
Production<br />
Imports<br />
Exports<br />
App. Cons.<br />
444<br />
290<br />
18<br />
716<br />
424<br />
741<br />
47<br />
954<br />
191<br />
32<br />
15<br />
208<br />
1483<br />
255<br />
357<br />
1381<br />
1996-<br />
1997<br />
421<br />
250<br />
1<br />
670<br />
364<br />
625<br />
35<br />
955<br />
181<br />
24<br />
15<br />
190<br />
1452<br />
237<br />
368<br />
1320<br />
1997-<br />
1998<br />
Financial Year<br />
1998- 1999-<br />
1999 2000<br />
404<br />
275<br />
13<br />
666<br />
497<br />
718<br />
59<br />
1156<br />
208<br />
40<br />
15<br />
233<br />
1431<br />
264<br />
289<br />
1406<br />
404<br />
293<br />
2<br />
695<br />
558<br />
839<br />
97<br />
1300<br />
196<br />
54<br />
23<br />
226<br />
1491<br />
325<br />
384<br />
1433<br />
2000-2001<br />
396<br />
284<br />
0<br />
680<br />
586<br />
760<br />
83<br />
1263<br />
202<br />
55<br />
3<br />
218<br />
1472<br />
311<br />
319<br />
1464<br />
The companies which produce virtually all of Australia’s paper products are (www.ppmfa.com.au):<br />
• Australian Paper<br />
• Amcor Limited-packaging<br />
• Norske Skog Paper Mills<br />
• Carter Holt Harvey<br />
• Kimberly-Clark Australia<br />
• Visy Paper Pty Ltd<br />
With the exception of newsprint, paper products are manufactured from the chemical pulping of wood.<br />
The process requires large quantities of toxic chemicals, water and energy. Furthermore, the process<br />
generates large quantities of waste, called black liquor, which is heavily sulphonated and is disposed of<br />
through combustion in boilers. The process of chemical pulping is to break down the lignin and<br />
hemicellulose to yield a clean cellulose product. The cellulose product may then be prepared as paper<br />
products.<br />
Reconstituted cellulose<br />
Australia imports large quantities of reconstituted cellulose products. For example, approximately 20<br />
million dollars worth of rayon fibres are imported annually and much more is imported in the form of<br />
manufactured products, such as garments. The global market for rayon is around 6 billion<br />
dollars/annum 131 . Rayon is the most important reconstituted cellulose product but others include<br />
cellulose acetate, methylcellulose, nitrocellulose and cellophane.<br />
Reconstituted cellulose is generally prepared by converting the cellulose to the soluble xanthate, which<br />
may then be extruded into an acid solution and spun into fibres.<br />
Ethanol<br />
The main application for ethanol is as a liquid fuel for transport. Currently, world ethanol production is<br />
around 45 billion litres/annum and increasing rapidly. The main producer of ethanol is Brazil, which<br />
101
produces around 14 billion litres/annum. At present, about 60% of all ethanol is used as a<br />
transportation fuel. By 2010 it is estimated that the proportion will increase to 85% with total<br />
production exceeding 70 billion litres. From a demand perspective, there is virtually no limit to<br />
potential ethanol consumption. This is because ethanol is a substitute for petrol. In contrast to ethanol,<br />
global consumption of petrol is around 950 billion litres/annum. Ethanol production in Australia is<br />
only 60 million litres/annum.<br />
Petrol, derived from petroleum (oil), is not a renewable resource and this fact is becoming increasingly<br />
apparent as reserves begin to decline and the difficulty of finding new reserves increases. Moreover,<br />
much of the world’s oil reserves are controlled by countries with questionable political stability and<br />
therefore the supply and price of oil is always uncertain. Finally, prolific petroleum consumption has<br />
been implicated in a range of global environmental hazards. These conditions have provided the<br />
incentive for rapid expansion of ethanol production.<br />
Ethanol is derived primarily from the cellulose component of agricultural wastes. The cellulose is first<br />
hydrolysed, usually by acid hydrolysis, and the resultant glucose solution fermented to ethanol. New<br />
strains of bacteria have been developed which are able to ferment hemicellulose hydrolysates also,<br />
thereby increasing the efficiency of the process between 20-40% depending on the composition of the<br />
feedstock. A waste material from ethanol production is the lignin.<br />
In Australia, ethanol has an undeservedly bad reputation as a liquid fuel. This is because it has been<br />
reported that ethanol is damaging to car engines if its proportion in the fuel mix exceeds about 10%.<br />
However, in Brazil, proportions of up to 90% ethanol have been used for years. The problem is that<br />
modern engines regulate fuel consumption based on the amount of oxygen in the combustion products<br />
relative to the amount of fuel consumed. These engines are tuned for fuels that contain no oxygen.<br />
However, ethanol contains a high proportion of oxygen and therefore its utilization in engines tuned<br />
for non-oxygenated fuels is potentially damaging because the engine compensates for the higher<br />
proportion of oxygen in the emissions. Therefore, there is nothing wrong with ethanol as a fuel per se;<br />
it is simply that modern engines are not tuned for oxygenated fuels. This problem can be rectified quite<br />
easily without major engine design modifications, as has occurred in Brazil. In Brazil, two types of<br />
fuel are sold. One contains about 10% ethanol whereas the other contains about 90%. The choice of<br />
fuel is dependent on how the motor is tuned.<br />
At present, ethanol is the only viable renewable alternative to petrol. Therefore, the utilisation of<br />
ethanol in Australia must increase substantially if Australia is to have a viable liquid fuel supply into<br />
the future as well as meet greenhouse gas reduction targets. In order for this to occur, ethanol must be<br />
promoted positively and steps taken to ensure that its utilisation is safe, as has occurred in Brazil and<br />
other countries.<br />
11.5.2 Potential applications for the cellulose rich residue<br />
The extent of depolymerisation of the cellulose that occurs as a consequence of the pyrolysis treatment<br />
would appear to prohibit utilisation of the solid residue as source of pulp for paper production. This is<br />
because preservation of cellulose fibre structural integrity is an important characteristic of pulps<br />
utilised in paper manufacture. However, until more detailed analyses of the fibre characteristics of the<br />
solid residue are available, its potential application in the area of paper manufacture cannot be<br />
completely ruled out. These analyses consider cellulose chain length and degree of crystallinity.<br />
A more plausible application for the solid residue is as a feedstock for reconstituted cellulose<br />
production. If this pathway were feasible, and if the cost of production were less than that of the<br />
import price of rayon, then the reconstituted product may be supplied to the domestic market, which is<br />
currently valued at 20 million dollars. However, the volume of the domestic market is quite small and<br />
it would therefore appear that export of surplus product is essential.<br />
102
The most plausible application of the solid residue, based on the current understanding of its chemical<br />
composition, is as a raw material for ethanol production. The derivation of ethanol from lignocellulose<br />
substrates involves a number of steps. In the first step, the lignocellulose is pre-treated, by steaming or<br />
steam explosion in the presence or absence of acidic reagents 132 , in order to liberate soluble<br />
hemicellulose components 133 . The pre-treatment process also opens up the lignocellulose structure,<br />
rendering the cellulose component more accessible to hydrolysis in the following step. In the second<br />
step, free glucose is liberated from cellulose, a form of polymerised glucose, by acid or enzymatic<br />
hydrolysis. The third step involves fermentation of the liberated glucose with yeast or ethanolproducing<br />
bacteria. Higher ethanol yields may be obtained with genetically modified organisms, such<br />
as recombinant Escherichia coli, recombinant strains of brewer’s yeast (Saccharomyces cerevisiae)<br />
and Zymomonas mobilis, which are capable of utilising sugars liberated from the hemicellulose<br />
component 133 . The final step in the process involves separation and purification of the ethanol by<br />
distillation and filtration through molecular sieves respectively.<br />
Due to the complexity of the lignocellulose-to-ethanol process, production costs are relatively high. If<br />
the process could be simplified, production costs may be reduced. Furthermore, the process economics<br />
would be substantially improved if ethanol production were combined with the production of another,<br />
higher value product. The solid residue from the pyrolysis process has already had much of the<br />
hemicellulose removed and the cellulose component is substantially depolymerised. Moreover, a<br />
proportion of the lignin has also been removed. Therefore, it may be possible to eliminate the steam<br />
treatment process and reduce the severity of acid hydrolysis in order to synthesise ethanol from the<br />
solid residue. These simplifications to the conventional lignocellulose-to-ethanol process may<br />
significantly reduce production costs relative to unpyrolysed substrates. Moreover, the derivation of<br />
phenols and furfuryls from previous steps, in conjunction with ethanol production, represents an<br />
integrated process where the costs of manufacture of one component are offset by the value of other<br />
components.<br />
11.6 Essential oils from eucalypts<br />
At present, Australia is a net importer of Eucalyptus oil, an irony given that the eucalypts are native to<br />
Australia. World production of Eucalyptus oil is around 3,000 tons/annum and Australian production<br />
is about 150 tons/annum. Currently, Eucalyptus oil is used primarily in the pharmaceutical and<br />
flavouring industries. The value of Eucalyptus oil is directly proportional to the cineole content and in<br />
general Australian Eucalyptus oils are higher in cineole that their foreign counterparts. In fact,<br />
Australia imports cheap low quality oil and blends it with domestically produced high quality oil to<br />
yield Eucalyptus oil that still meets minimum pharmaceutical requirements.<br />
The world market for Eucalyptus oil is relatively small and supply could easily outstrip demand if a<br />
cheap alternative supply became available, as may occur with the implementation of integrated<br />
thermochemical processing of agroforestry biomass. It would therefore seem likely that alternative<br />
applications would have to be developed. A novel application of Eucalyptus oil that has received some<br />
attention is as a liquid fuel comparable to diesel 100 . If the technology for this application is developed<br />
then it will only be of value if large quantities of oil can be supplied at low cost. The extraction of<br />
Eucalyptus as part of the thermochemical treatment of agroforestry material may provide such a<br />
supply.<br />
103
Appendix 1. Mass balances associated<br />
with experiment 1: influence of selected<br />
operational parameters on stage 1 of the<br />
pyrolysis process<br />
Trial<br />
1<br />
2<br />
3<br />
4<br />
5<br />
Feed<br />
Processed<br />
Actual<br />
(g)<br />
135.56<br />
149.25<br />
124.19<br />
107.77<br />
143.27<br />
Feed<br />
Processed<br />
Water Free<br />
(g)<br />
124.11<br />
136.64<br />
120.32<br />
107.77<br />
131.16<br />
Solid<br />
Residue<br />
(g)<br />
118.13<br />
129.20<br />
106.52<br />
90.35<br />
114.80<br />
Liquids and<br />
Gases<br />
(g)<br />
Water Actual<br />
Free<br />
9.58<br />
11.47<br />
16.76<br />
17.42<br />
20.17<br />
17.43<br />
20.05<br />
17.67<br />
17.42<br />
28.46<br />
Solid<br />
Residues<br />
Yield<br />
(%)<br />
87.14<br />
86.57<br />
85.77<br />
83.84<br />
80.13<br />
Liquids<br />
and Gases<br />
Yield<br />
(%)<br />
7.07<br />
7.68<br />
13.50<br />
16.16<br />
14.08<br />
Water a<br />
(%)<br />
5.79<br />
5.75<br />
0.74<br />
0.00<br />
5.79<br />
Table A1.1. Mass of product phases obtained from each trial of Experiment 1.1. a The free water evaporated<br />
from feed during trial.<br />
Trial<br />
Feed<br />
Actual<br />
(g)<br />
Feed a<br />
Water Free<br />
(g)<br />
Solid<br />
Residues<br />
(g)<br />
Liquids and<br />
Gases<br />
(g)<br />
Solid<br />
Residues<br />
Yield<br />
(%)<br />
Liquids and Gases<br />
Yield<br />
(%)<br />
1<br />
2A<br />
2B<br />
107.77<br />
19.03<br />
6.10<br />
107.77<br />
19.03<br />
6.10<br />
90.35<br />
16.09<br />
5.15<br />
17.420<br />
2.940<br />
0.946<br />
83.84<br />
84.55<br />
84.49<br />
16.16<br />
15.45<br />
15.51<br />
Table A1.2. Mass of product phases obtained for trials of Experiment 1.2. a Oven-dried feed. Residue from<br />
Trial 4 of Experiment 1.1.<br />
Trial<br />
1<br />
2<br />
3A<br />
3B<br />
Feed a<br />
Processed<br />
Actual<br />
(g)<br />
8.90<br />
7.95<br />
7.01<br />
4.55<br />
Feed<br />
Processed<br />
Water Free<br />
(g)<br />
8.65<br />
7.73<br />
6.81<br />
4.42<br />
Solid<br />
Residue<br />
(g)<br />
7.65<br />
6.64<br />
5.69<br />
3.74<br />
Liquids and<br />
Gases<br />
(g)<br />
Water Actual<br />
Free<br />
1.09<br />
1.16<br />
1.20<br />
0.73<br />
1.25<br />
1.31<br />
1.32<br />
0.81<br />
Solid<br />
Residues<br />
Yield<br />
(%)<br />
85.99<br />
83.56<br />
81.14<br />
82.11<br />
Liquids<br />
and Gases<br />
Yield<br />
(%)<br />
12.27<br />
14.64<br />
17.04<br />
16.04<br />
Water b<br />
(%)<br />
1.74<br />
1.80<br />
1.82<br />
1.85<br />
Table A1.3. Mass of product phases obtained from each trial of Experiment 1.3. a Residue from Trial 3 of<br />
Experiment 1.1. b The free water evaporated from feed during trial.<br />
104
Trial<br />
1A<br />
1B<br />
2<br />
Feed a<br />
Processed<br />
Actual<br />
(g)<br />
9.57<br />
4.19<br />
8.90<br />
Feed<br />
Processed<br />
Water Free<br />
(g)<br />
9.30<br />
4.07<br />
8.65<br />
Solid<br />
Residue<br />
(g)<br />
77.91<br />
3.59<br />
7.65<br />
Liquids and<br />
Gases<br />
(g)<br />
Water Actual<br />
Free<br />
1.49<br />
0.52<br />
1.09<br />
1.66<br />
0.60<br />
1.25<br />
Solid<br />
Residues<br />
Yield<br />
(%)<br />
82.70<br />
85.68<br />
85.99<br />
Liquids<br />
and Gases<br />
Yield<br />
(%)<br />
15.51<br />
12.46<br />
12.27<br />
Water b<br />
(%)<br />
1.79<br />
1.86<br />
1.74<br />
Table A1.4. Mass of product phases obtained from each trial of Experiment 1.4A. a Residue from Trial 3 of<br />
Experiment 1.1. b Free water evaporated from feed during trial.<br />
Trial<br />
1A<br />
1B<br />
2<br />
3<br />
Feed a<br />
Processed<br />
Actual<br />
(g)<br />
4.76<br />
16.27<br />
8.48<br />
44.54<br />
Feed<br />
Processed<br />
Water Free<br />
(g)<br />
4.60<br />
15.73<br />
8.20<br />
43.06<br />
Solid<br />
Residue<br />
(g)<br />
3.79<br />
12.88<br />
6.90<br />
34.70<br />
Liquids and<br />
Gases<br />
(g)<br />
Water Actual<br />
Free<br />
0.86<br />
3.02<br />
1.39<br />
8.79<br />
0.97<br />
3.39<br />
1.58<br />
9.84<br />
Solid<br />
Residues<br />
Yield<br />
(%)<br />
79.64<br />
79.16<br />
81.32<br />
77.92<br />
Liquids<br />
and Gases<br />
Yield<br />
(%)<br />
18.01<br />
18.57<br />
16.33<br />
19.73<br />
Water b<br />
(%)<br />
Table A1.5. Mass of product phases obtained from each trial of Experiment 1.4A. a Residue from Trial 5 of<br />
Experiment 1.1. b Free water evaporated from feed during trial.<br />
Trial<br />
1<br />
2A<br />
2B<br />
Feed a<br />
Processed<br />
Actual<br />
(g)<br />
4.79<br />
4.76<br />
16.27<br />
Feed<br />
Processed<br />
Water Free<br />
(g)<br />
4.63<br />
4.60<br />
15.73<br />
Solid<br />
Residue<br />
(g)<br />
3.77<br />
3.79<br />
12.88<br />
Liquids and<br />
Gases<br />
(g)<br />
Water Actual<br />
Free<br />
0.90<br />
0.86<br />
3.02<br />
1.02<br />
0.97<br />
3.39<br />
Solid<br />
Residues<br />
Yield<br />
(%)<br />
78.75<br />
79.64<br />
79.16<br />
Liquids<br />
and Gases<br />
Yield<br />
(%)<br />
18.87<br />
18.01<br />
18.57<br />
2.35<br />
2.28<br />
2.35<br />
2.35<br />
Water b<br />
(%)<br />
2.38<br />
2.35<br />
2.28<br />
Table A1.6. Mass of product phases obtained from each trial of Experiment 1.5. a Residue from Trial 5 of<br />
Experiment 1.1. b Free water evaporated from feed during trial.<br />
Trial<br />
1<br />
2<br />
3<br />
4A<br />
4B<br />
Feed a<br />
Processed<br />
Actual<br />
(g)<br />
15.26<br />
8.90<br />
6.59<br />
4.07<br />
5.39<br />
Feed<br />
Processed<br />
Water Free<br />
(g)<br />
14.83<br />
8.65<br />
6.41<br />
3.96<br />
5.24<br />
Solid<br />
Residue<br />
(g)<br />
13.01<br />
7.65<br />
5.69<br />
3.53<br />
4.74<br />
Liquids and<br />
Gases<br />
(g)<br />
Water Actual<br />
Free<br />
1.98<br />
1.09<br />
0.78<br />
0.47<br />
0.56<br />
2.25<br />
1.25<br />
0.90<br />
0.54<br />
0.65<br />
Solid<br />
Residues<br />
Yield<br />
(%)<br />
85.24<br />
85.99<br />
86.40<br />
86.71<br />
87.98<br />
Liquids<br />
and Gases<br />
Yield<br />
(%)<br />
12.98<br />
12.27<br />
11.85<br />
11.62<br />
10.32<br />
Water b<br />
(%)<br />
1.78<br />
1.74<br />
1.74<br />
1.67<br />
1.70<br />
Table A1.7. Mass of product phases obtained from each trial of Experiment 1.6. a Residue from Trial 3 of<br />
Experiment 1.1. b Free water evaporated from feed during trial.<br />
105
Appendix 2. Mass balances associated<br />
with experiment 2: influence of selected<br />
operational parameters on stage 2 of the<br />
pyrolysis process<br />
Trial<br />
1A<br />
1B<br />
2A<br />
2B<br />
3<br />
Feed a<br />
Processed<br />
Actual<br />
(g)<br />
8.12<br />
4.98<br />
7.91<br />
4.84<br />
5.71<br />
Feed<br />
Processed<br />
Water Free<br />
(g)<br />
7.87<br />
4.83<br />
7.67<br />
4.69<br />
5.54<br />
Solid<br />
Residue<br />
(g)<br />
6.76<br />
4.04<br />
6.56<br />
4.09<br />
4.86<br />
Liquids and<br />
Gases<br />
(g)<br />
Water Actual<br />
Free<br />
1.19<br />
0.83<br />
1.19<br />
0.65<br />
0.74<br />
1.36<br />
0.94<br />
1.35<br />
0.75<br />
0.86<br />
Solid<br />
Residues<br />
Yield<br />
(%)<br />
83.20<br />
81.04<br />
82.90<br />
84.59<br />
85.03<br />
Liquids<br />
and Gases<br />
Yield<br />
(%)<br />
14.62<br />
16.73<br />
14.98<br />
13.36<br />
12.94<br />
Water b<br />
(%)<br />
2.18<br />
2.23<br />
2.12<br />
2.05<br />
2.03<br />
Table A2.1. Mass of product phases obtained from each trial of Experiment 2.1. a Residue from Trial 3 of<br />
Experiment 1.1. b The free water evaporated from feed during trial.<br />
Trial<br />
1A<br />
1B<br />
2<br />
3A<br />
3B<br />
4<br />
Feed a<br />
Processed<br />
Actual<br />
(g)<br />
8.12<br />
4.98<br />
14.03<br />
8.58<br />
7.21<br />
14.43<br />
Feed<br />
Processed<br />
Water Free<br />
(g)<br />
7.87<br />
4.83<br />
13.60<br />
8.32<br />
6.99<br />
13.99<br />
Solid<br />
Residue<br />
(g)<br />
6.76<br />
4.04<br />
11.51<br />
7.14<br />
5.98<br />
12.11<br />
Liquids and<br />
Gases<br />
(g)<br />
Water Actual<br />
Free<br />
1.19<br />
0.83<br />
2.22<br />
1.25<br />
1.06<br />
1.99<br />
1.36<br />
0.94<br />
2.53<br />
1.45<br />
1.23<br />
2.32<br />
Solid<br />
Residues<br />
Yield<br />
(%)<br />
83.20<br />
81.04<br />
82.00<br />
83.16<br />
83.00<br />
83.89<br />
Liquids<br />
and Gases<br />
Yield<br />
(%)<br />
14.62<br />
16.73<br />
15.79<br />
14.58<br />
14.71<br />
13.80<br />
Water b<br />
(%)<br />
2.18<br />
2.23<br />
2.21<br />
2.26<br />
2.29<br />
2.30<br />
Table A2.2. Mass of product phases obtained from each trial of Experiment 2.2A. a Residue from Trial 1 of<br />
Experiment 1.1. b The free water evaporated from feed during trial.<br />
106
Trial<br />
1A<br />
1B<br />
2<br />
3<br />
4A<br />
4B<br />
5A<br />
5B<br />
6<br />
Feed a<br />
Processed<br />
Actual<br />
(g)<br />
12.75<br />
5.49<br />
12.12<br />
11.41<br />
8.37<br />
7.77<br />
10.29<br />
6.86<br />
4.90<br />
Feed<br />
Processed<br />
Water Free<br />
(g)<br />
12.35<br />
5.32<br />
11.74<br />
11.05<br />
8.11<br />
7.53<br />
9.97<br />
6.65<br />
4.75<br />
Solid<br />
Residue<br />
(g)<br />
10.39<br />
4.35<br />
9.44<br />
8.84<br />
6.30<br />
5.81<br />
7.64<br />
5.09<br />
3.60<br />
Liquids and<br />
Gases<br />
(g)<br />
Water Actual<br />
Free<br />
2.08<br />
1.01<br />
2.40<br />
2.31<br />
1.87<br />
1.78<br />
2.40<br />
1.60<br />
1.18<br />
2.36<br />
1.14<br />
2.68<br />
2.57<br />
2.07<br />
1.97<br />
2.65<br />
1.77<br />
1.30<br />
Solid<br />
Residues<br />
Yield<br />
(%)<br />
81.47<br />
79.33<br />
77.92<br />
77.49<br />
75.24<br />
74.71<br />
74.30<br />
74.23<br />
73.53<br />
Liquids<br />
and Gases<br />
Yield<br />
(%)<br />
16.32<br />
18.42<br />
19.81<br />
20.24<br />
22.38<br />
22.88<br />
23.34<br />
23.37<br />
24.02<br />
Water b<br />
(%)<br />
2.21<br />
2.26<br />
2.27<br />
2.27<br />
2.38<br />
2.41<br />
2.36<br />
2.41<br />
2.45<br />
Table A2.3. Mass of product phases obtained from each trial of Experiment 2.2B. a Residue from Trial 2 of<br />
Experiment 1.1. b Free water evaporated from feed during trial.<br />
107
Appendix 3: Quantification data for<br />
selected phenolic and furfuryl compounds<br />
108
Guaiacol<br />
Trial 1.1<br />
Trial 1.2A<br />
Trial 1.2B<br />
Peak Area<br />
M/Z = 109<br />
0<br />
0<br />
0<br />
Conc.<br />
(ppm)<br />
0.00<br />
0.00<br />
0.00<br />
Mass a<br />
(mg)<br />
0.000<br />
0.000<br />
0.000<br />
Yield<br />
m(converted)<br />
(%)<br />
0.000<br />
0.000<br />
0.000<br />
Yield<br />
(processed)<br />
(%)<br />
0.000<br />
0.000<br />
0.000<br />
Yield<br />
m(dry mass prc’d)<br />
(%)<br />
0.000<br />
0.000<br />
0.000<br />
Trial 2A.1A<br />
Trial 2A.1B<br />
Trial 2A.2<br />
Trial 2A.3A<br />
Trial 2A.3B<br />
Trial 2A.4<br />
33509<br />
22605<br />
79324<br />
6368<br />
6866<br />
6823<br />
86.79<br />
58.62<br />
204.35<br />
16.54<br />
17.84<br />
17.73<br />
9.796<br />
6.616<br />
23.066<br />
1.867<br />
2.013<br />
2.001<br />
0.825<br />
0.794<br />
1.041<br />
0.149<br />
0.190<br />
0.100<br />
0.121<br />
0.133<br />
0.164<br />
0.022<br />
0.028<br />
0.014<br />
0.124<br />
0.137<br />
0.170<br />
0.022<br />
0.029<br />
0.014<br />
Trial 2B.1A<br />
Trial 2B.1B<br />
Trial 2B.2<br />
Trial 2B.3<br />
Trial 2B.4A<br />
Trial 2B.4B<br />
Trial 2B.5A<br />
Trial 2B.5B<br />
Trial 2B.6<br />
0<br />
0<br />
0<br />
0<br />
0<br />
0<br />
0<br />
0<br />
0<br />
0.00<br />
0.00<br />
0.00<br />
0.00<br />
0.00<br />
0.00<br />
0.00<br />
0.00<br />
0.00<br />
0.000<br />
0.000<br />
0.000<br />
0.000<br />
0.000<br />
0.000<br />
0.000<br />
0.000<br />
0.000<br />
0.000<br />
0.000<br />
0.000<br />
0.000<br />
0.000<br />
0.000<br />
0.000<br />
0.000<br />
0.000<br />
0.000<br />
0.000<br />
0.000<br />
0.000<br />
0.000<br />
0.000<br />
0.000<br />
0.000<br />
0.000<br />
0.000<br />
0.000<br />
0.000<br />
0.000<br />
0.000<br />
0.000<br />
0.000<br />
0.000<br />
0.000<br />
Trial 2C.1<br />
Trial 2C.2<br />
Trial 2C.3A<br />
Trial 2C.3B<br />
2971<br />
3029<br />
0<br />
0<br />
7.72<br />
7.87<br />
0.00<br />
0.00<br />
0.872<br />
0.889<br />
0.000<br />
0.000<br />
0.080<br />
0.076<br />
0.000<br />
0.0000<br />
0.010<br />
0.011<br />
0.000<br />
0.000<br />
0.010<br />
0.012<br />
0.000<br />
0.000<br />
Trial 3A.1A<br />
Trial 3A.1B<br />
Trial 3A.2<br />
0<br />
0<br />
2971<br />
0.00<br />
0.00<br />
7.72<br />
0.000<br />
0.000<br />
0.872<br />
0.000<br />
0.000<br />
0.080<br />
0.000<br />
0.000<br />
0.010<br />
0.000<br />
0.000<br />
0.010<br />
Trial 3B.1A<br />
Trial 3B.1B<br />
Trial 3B.2<br />
Trial 3B.3<br />
1993<br />
9274<br />
8647<br />
0<br />
5.18<br />
24.09<br />
22.46<br />
0.00<br />
0.585<br />
2.719<br />
2.535<br />
0.000<br />
0.068<br />
0.090<br />
0.183<br />
0.000<br />
0.012<br />
0.017<br />
0.030<br />
0.000<br />
0.013<br />
0.017<br />
0.031<br />
0.000<br />
Trial 4A.1<br />
Trial 4A.2<br />
Trial 4A.3<br />
Trial 4A.4A<br />
Trial 4A.4B<br />
0<br />
2971<br />
1832<br />
1242<br />
1083<br />
0.00<br />
7.72<br />
4.76<br />
3.23<br />
2.82<br />
0.000<br />
0.872<br />
0.538<br />
0.364<br />
0.318<br />
0.000<br />
0.080<br />
0.069<br />
0.077<br />
0.057<br />
0.000<br />
0.010<br />
0.008<br />
0.009<br />
0.006<br />
0.000<br />
0.010<br />
0.008<br />
0.009<br />
0.006<br />
Trial 4B.1A<br />
Trial 4B.1B<br />
Trial 4B.2A<br />
Trial 4B.2B<br />
Trial 4B.3<br />
33509<br />
22605<br />
21817<br />
19976<br />
3957<br />
86.79<br />
58.62<br />
56.58<br />
51.82<br />
10.28<br />
9.796<br />
6.616<br />
6.386<br />
5.849<br />
1.161<br />
0.825<br />
0.794<br />
0.539<br />
0.904<br />
0.157<br />
0.121<br />
0.133<br />
0.081<br />
0.121<br />
0.020<br />
0.124<br />
0.137<br />
0.083<br />
0.125<br />
0.021<br />
Trial 5.1<br />
Trial 5.2A<br />
Trial 5.2B<br />
2072<br />
1993<br />
9274<br />
5.39<br />
5.18<br />
24.09<br />
0.608<br />
0.585<br />
2.719<br />
0.067<br />
0.068<br />
0.090<br />
0.013<br />
0.012<br />
0.017<br />
0.013<br />
0.013<br />
0.017<br />
Trial 6.1<br />
Trial 6.2<br />
Trial 6.3<br />
Trial 6.4<br />
Trial 6.5<br />
17847<br />
0<br />
0<br />
0<br />
0<br />
46.31<br />
0.00<br />
0.00<br />
0.00<br />
0.00<br />
5.227<br />
0.000<br />
0.000<br />
0.000<br />
0.000<br />
0.055<br />
0.000<br />
0.000<br />
0.000<br />
0.000<br />
Table A3.1. Quantification data for Guaiacol. a density of guaiacol = 1.1287.<br />
0.004<br />
0.000<br />
0.000<br />
0.000<br />
0.000<br />
0.004<br />
0.000<br />
0.000<br />
0.000<br />
0.000<br />
109
Phenol<br />
Trial 1.1<br />
Trial 1.2A<br />
Trial 1.2B<br />
Peak<br />
Area<br />
M/Z = 94<br />
0<br />
0<br />
0<br />
Conc.<br />
(ppm)<br />
0.00<br />
0.00<br />
0.00<br />
Mass<br />
(mg)<br />
0.000<br />
0.000<br />
0.000<br />
Yield<br />
m(converted)<br />
(%)<br />
0.000<br />
0.000<br />
0.000<br />
Yield<br />
(processed)<br />
(%)<br />
0.000<br />
0.000<br />
0.000<br />
Yield<br />
m(dry mass prc’d)<br />
(%)<br />
0.000<br />
0.000<br />
0.000<br />
Trial 2A.1A<br />
Trial 2A.1B<br />
Trial 2A.2<br />
Trial 2A.3A<br />
Trial 2A.3B<br />
Trial 2A.4<br />
0<br />
0<br />
16602<br />
0<br />
0<br />
0<br />
0.00<br />
0.00<br />
8.30<br />
0.00<br />
0.00<br />
0.00<br />
0.000<br />
0.000<br />
0.830<br />
0.000<br />
0.000<br />
0.000<br />
0.000<br />
0.000<br />
0.038<br />
0.000<br />
0.000<br />
0.000<br />
0.000<br />
0.000<br />
0.006<br />
0.000<br />
0.000<br />
0.000<br />
0.000<br />
0.000<br />
0.006<br />
0.000<br />
0.000<br />
0.000<br />
Trial 2B.1A<br />
Trial 2B.1B<br />
Trial 2B.2<br />
Trial 2B.3<br />
Trial 2B.4A<br />
Trial 2B.4B<br />
Trial 2B.5A<br />
Trial 2B.5B<br />
Trial 2B.6<br />
0<br />
0<br />
0<br />
0<br />
0<br />
0<br />
0<br />
0<br />
0<br />
0.00<br />
0.00<br />
0.00<br />
0.00<br />
0.00<br />
0.00<br />
0.00<br />
0.00<br />
0.00<br />
0.000<br />
0.000<br />
0.000<br />
0.000<br />
0.000<br />
0.000<br />
0.000<br />
0.000<br />
0.000<br />
0.000<br />
0.000<br />
0.000<br />
0.000<br />
0.000<br />
0.000<br />
0.000<br />
0.000<br />
0.000<br />
0.000<br />
0.000<br />
0.000<br />
0.000<br />
0.000<br />
0.000<br />
0.000<br />
0.000<br />
0.000<br />
0.000<br />
0.000<br />
0.000<br />
0.000<br />
0.000<br />
0.000<br />
0.000<br />
0.000<br />
0.000<br />
Trial 2C.1<br />
Trial 2C.2<br />
Trial 2C.3A<br />
Trial 2C.3B<br />
6851<br />
2057<br />
0<br />
0<br />
3.43<br />
1.03<br />
0.00<br />
0.00<br />
0.343<br />
0.103<br />
0.000<br />
0.000<br />
0.031<br />
0.009<br />
0.000<br />
0.000<br />
0.004<br />
0.001<br />
0.000<br />
0.000<br />
0.004<br />
0.001<br />
0.000<br />
0.000<br />
Trial 3A.1A<br />
Trial 3A.1B<br />
Trial 3A.2<br />
0<br />
0<br />
6851<br />
0.00<br />
0.00<br />
3.43<br />
0.000<br />
0.000<br />
0.343<br />
0.000<br />
0.000<br />
0.031<br />
0.000<br />
0.000<br />
0.004<br />
0.000<br />
0.000<br />
0.004<br />
Trial 3B.1A<br />
Trial 3B.1B<br />
Trial 3B.2<br />
Trial 3B.3<br />
1063<br />
7131<br />
8065<br />
15385<br />
0.53<br />
3.57<br />
4.03<br />
7.69<br />
0.053<br />
0.357<br />
0.403<br />
0.769<br />
0.006<br />
0.012<br />
0.029<br />
0.009<br />
0.0011<br />
0.002<br />
0.005<br />
0.002<br />
0.001<br />
0.002<br />
0.005<br />
0.002<br />
Trial 4A.1<br />
Trial 4A.2<br />
Trial 4A.3<br />
Trial 4A.4A<br />
Trial 4A.4B<br />
0<br />
6851<br />
38634<br />
20347<br />
15722<br />
0.00<br />
3.43<br />
19.32<br />
10.17<br />
7.86<br />
0.000<br />
0.343<br />
1.932<br />
1.017<br />
0.786<br />
0.000<br />
0.031<br />
0.247<br />
0.215<br />
0.141<br />
0.000<br />
0.004<br />
0.029<br />
0.025<br />
0.015<br />
0.000<br />
0.004<br />
0.030<br />
0.026<br />
0.015<br />
Trial 4B.1A<br />
Trial 4B.1B<br />
Trial 4B.2A<br />
Trial 4B.2B<br />
Trial 4B.3<br />
0<br />
0<br />
12835<br />
9303<br />
26139<br />
0.00<br />
0.00<br />
6.42<br />
4.65<br />
13.07<br />
0.000<br />
0.000<br />
0.642<br />
0.465<br />
1.307<br />
0.000<br />
0.000<br />
0.054<br />
0.072<br />
0.177<br />
0.000<br />
0.000<br />
0.008<br />
0.010<br />
0.023<br />
0.000<br />
0.000<br />
0.008<br />
0.010<br />
0.024<br />
Trial 5.1<br />
Trial 5.2A<br />
Trial 5.2B<br />
4163<br />
1063<br />
7131<br />
2.08<br />
0.53<br />
3.57<br />
0.208<br />
0.053<br />
0.357<br />
0.023<br />
0.006<br />
0.012<br />
0.004<br />
0.001<br />
0.002<br />
0.005<br />
0.001<br />
0.002<br />
Trial 6.1<br />
Trial 6.2<br />
Trial 6.3<br />
Trial 6.4<br />
Trial 6.5<br />
0<br />
0<br />
0<br />
0<br />
0<br />
0.00<br />
0.00<br />
0.00<br />
0.00<br />
0.00<br />
Table A3.2. Quantification data for Phenol.<br />
0.000<br />
0.000<br />
0.000<br />
0.000<br />
0.000<br />
0.000<br />
0.000<br />
0.000<br />
0.000<br />
0.000<br />
0.000<br />
0.000<br />
0.000<br />
0.000<br />
0.000<br />
0.000<br />
0.000<br />
0.000<br />
0.000<br />
0.000<br />
110
Eugenol<br />
Trial 1.1<br />
Trial 1.2A<br />
Trial 1.2B<br />
Peak Area<br />
M/Z = 164<br />
0<br />
0<br />
0<br />
Conc.<br />
(ppm)<br />
0.00<br />
0.00<br />
0.00<br />
Mass a<br />
(mg)<br />
0.000<br />
0.000<br />
0.000<br />
Yield<br />
m(converted)<br />
(%)<br />
0.000<br />
0.000<br />
0.000<br />
Yield<br />
(processed)<br />
(%)<br />
0.000<br />
0.000<br />
0.000<br />
Yield<br />
m(dry mass prc’d)<br />
(%)<br />
0.000<br />
0.000<br />
0.000<br />
Trial 2A.1A<br />
Trial 2A.1B<br />
Trial 2A.2<br />
Trial 2A.3A<br />
Trial 2A.3B<br />
Trial 2A.4<br />
0<br />
0<br />
10972<br />
1497<br />
1233<br />
2815<br />
0.00<br />
0.00<br />
7.59<br />
1.05<br />
0.86<br />
1.96<br />
0.000<br />
0.000<br />
0.759<br />
0.105<br />
0.086<br />
0.196<br />
0.000<br />
0.000<br />
0.034<br />
0.008<br />
0.008<br />
0.010<br />
0.000<br />
0.000<br />
0.005<br />
0.001<br />
0.001<br />
0.001<br />
0.000<br />
0.000<br />
0.006<br />
0.001<br />
0.001<br />
0.001<br />
Trial 2B.1A<br />
Trial 2B.1B<br />
Trial 2B.2<br />
Trial 2B.3<br />
Trial 2B.4A<br />
Trial 2B.4B<br />
Trial 2B.5A<br />
Trial 2B.5B<br />
Trial 2B.6<br />
0<br />
2088<br />
0<br />
0<br />
0<br />
0<br />
0<br />
0<br />
0<br />
0.00<br />
1.46<br />
0.00<br />
0.00<br />
0.00<br />
0.00<br />
0.00<br />
0.00<br />
0.00<br />
0.000<br />
0.146<br />
0.000<br />
0.000<br />
0.000<br />
0.000<br />
0.000<br />
0.000<br />
0.000<br />
0.000<br />
0.014<br />
0.000<br />
0.000<br />
0.000<br />
0.000<br />
0.000<br />
0.000<br />
0.000<br />
0.000<br />
0.003<br />
0.000<br />
0.000<br />
0.000<br />
0.000<br />
0.000<br />
0.000<br />
0.000<br />
0.000<br />
0.003<br />
0.000<br />
0.000<br />
0.000<br />
0.000<br />
0.000<br />
0.000<br />
0.000<br />
Trial 2C.1<br />
Trial 2C.2<br />
Trial 2C.3A<br />
Trial 2C.3B<br />
0<br />
633<br />
0<br />
0<br />
0.00<br />
0.44<br />
0.00<br />
0.00<br />
0.000<br />
0.044<br />
0.000<br />
0.000<br />
0.000<br />
0.004<br />
0.000<br />
0.000<br />
0.000<br />
0.001<br />
0.000<br />
0.000<br />
0.000<br />
0.001<br />
0.000<br />
0.000<br />
Trial 3A.1A<br />
Trial 3A.1B<br />
Trial 3A.2<br />
0<br />
0<br />
0<br />
0.00<br />
0.00<br />
0.00<br />
0.000<br />
0.000<br />
0.000<br />
0.000<br />
0.000<br />
0.000<br />
0.000<br />
0.000<br />
0.000<br />
0.000<br />
0.000<br />
0.000<br />
Trial 3B.1A<br />
Trial 3B.1B<br />
Trial 3B.2<br />
Trial 3B.3<br />
0<br />
0<br />
0<br />
0<br />
0.00<br />
0.00<br />
0.00<br />
0.00<br />
0.000<br />
0.000<br />
0.000<br />
0.000<br />
0.000<br />
0.000<br />
0.000<br />
0.000<br />
0.000<br />
0.000<br />
0.000<br />
0.000<br />
0.000<br />
0.000<br />
0.000<br />
0.000<br />
Trial 4A.1<br />
Trial 4A.2<br />
Trial 4A.3<br />
Trial 4A.4A<br />
Trial 4A.4B<br />
0<br />
0<br />
938<br />
0<br />
0<br />
0.00<br />
0.00<br />
0.66<br />
0.00<br />
0.00<br />
0.000<br />
0.000<br />
0.066<br />
0.000<br />
0.000<br />
0.000<br />
0.000<br />
0.008<br />
0.000<br />
0.000<br />
0.000<br />
0.000<br />
0.001<br />
0.000<br />
0.000<br />
0.000<br />
0.000<br />
0.001<br />
0.000<br />
0.000<br />
Trial 4B.1A<br />
Trial 4B.1B<br />
Trial 4B.2A<br />
Trial 4B.2B<br />
Trial 4B.3<br />
0<br />
0<br />
0<br />
0<br />
0<br />
0.00<br />
0.00<br />
0.00<br />
0.00<br />
0.00<br />
0.000<br />
0.000<br />
0.000<br />
0.000<br />
0.000<br />
0.000<br />
0.000<br />
0.000<br />
0.000<br />
0.000<br />
0.000<br />
0.000<br />
0.00<br />
0.000<br />
0.000<br />
0.000<br />
0.000<br />
0.000<br />
0.000<br />
0.000<br />
Trial 5.1<br />
Trial 5.2A<br />
Trial 5.2B<br />
0<br />
0<br />
0<br />
0.00<br />
0.00<br />
0.00<br />
0.000<br />
0.000<br />
0.000<br />
0.000<br />
0.000<br />
0.000<br />
0.000<br />
0.000<br />
0.000<br />
0.000<br />
0.000<br />
0.000<br />
Trial 6.1<br />
Trial 6.2<br />
Trial 6.3<br />
Trial 6.4<br />
Trial 6.5<br />
0<br />
0<br />
0<br />
0<br />
0<br />
0.00<br />
0.00<br />
0.00<br />
0.00<br />
0.00<br />
0.000<br />
0.000<br />
0.000<br />
0.000<br />
0.000<br />
0.000<br />
0.000<br />
0.000<br />
0.000<br />
0.000<br />
Table A3.3. Quantification data for Eugenol. a density of eugenol = 1.0664<br />
0.000<br />
0.000<br />
0.000<br />
0.000<br />
0.000<br />
0.000<br />
0.000<br />
0.000<br />
0.000<br />
0.000<br />
111
Isoeugenol<br />
Trial 1.1<br />
Trial 1.2A<br />
Trial 1.2B<br />
Peak Area<br />
M/Z = 164<br />
0<br />
0<br />
0<br />
Conc.<br />
(ppm)<br />
0.00<br />
0.00<br />
0.00<br />
Mass a<br />
(mg)<br />
0.000<br />
0.000<br />
0.000<br />
Yield<br />
m(converted)<br />
(%)<br />
0.000<br />
0.000<br />
0.000<br />
Yield<br />
(processed)<br />
(%)<br />
0.000<br />
0.000<br />
0.000<br />
Yield<br />
m(dry mass prc’d)<br />
(%)<br />
0.000<br />
0.000<br />
0.000<br />
Trial 2A.1A<br />
Trial 2A.1B<br />
Trial 2A.2<br />
Trial 2A.3A<br />
Trial 2A.3B<br />
Trial 2A.4<br />
2644<br />
3021<br />
39116<br />
6583<br />
7225<br />
13119<br />
2.11<br />
2.42<br />
31.14<br />
5.26<br />
5.77<br />
10.48<br />
0.225<br />
0.258<br />
3.321<br />
0.561<br />
0.616<br />
1.117<br />
0.019<br />
0.031<br />
0.150<br />
0.045<br />
0.058<br />
0.056<br />
0.003<br />
0.005<br />
0.024<br />
0.007<br />
0.009<br />
0.008<br />
0.003<br />
0.005<br />
0.024<br />
0.007<br />
0.009<br />
0.008<br />
Trial 2B.1A<br />
Trial 2B.1B<br />
Trial 2B.2<br />
Trial 2B.3<br />
Trial 2B.4A<br />
Trial 2B.4B<br />
Trial 2B.5A<br />
Trial 2B.5B<br />
Trial 2B.6<br />
0<br />
0<br />
0<br />
2690<br />
0<br />
0<br />
0<br />
0<br />
0<br />
0.00<br />
0.00<br />
0.00<br />
2.15<br />
0.00<br />
0.00<br />
0.00<br />
0.00<br />
0.00<br />
0.000<br />
0.000<br />
0.000<br />
0.229<br />
0.000<br />
0.000<br />
0.000<br />
0.000<br />
0.000<br />
0.000<br />
0.000<br />
0.000<br />
0.010<br />
0.000<br />
0.000<br />
0.000<br />
0.000<br />
0.000<br />
0.000<br />
0.000<br />
0.000<br />
0.002<br />
0.000<br />
0.000<br />
0.000<br />
0.000<br />
0.000<br />
0.000<br />
0.000<br />
0.000<br />
0.002<br />
0.000<br />
0.000<br />
0.000<br />
0.000<br />
0.000<br />
Trial 2C.1<br />
Trial 2C.2<br />
Trial 2C.3A<br />
Trial 2C.3B<br />
0<br />
0<br />
0<br />
0<br />
0.00<br />
0.00<br />
0.00<br />
0.00<br />
0.000<br />
0.000<br />
0.000<br />
0.000<br />
0.000<br />
0.000<br />
0.000<br />
0.000<br />
0.000<br />
0.000<br />
0.000<br />
0.000<br />
0.000<br />
0.000<br />
0.000<br />
0.000<br />
Trial 3A.1A<br />
Trial 3A.1B<br />
Trial 3A.2<br />
2741<br />
1293<br />
0<br />
2.19<br />
1.03<br />
0.00<br />
0.234<br />
0.110<br />
0.000<br />
0.016<br />
0.021<br />
0.000<br />
0.002<br />
0.003<br />
0.000<br />
0.003<br />
0.003<br />
0.000<br />
Trial 3B.1A<br />
Trial 3B.1B<br />
Trial 3B.2<br />
Trial 3B.3<br />
0<br />
0<br />
0<br />
0<br />
0.00<br />
0.00<br />
0.00<br />
0.00<br />
0.000<br />
0.000<br />
0.000<br />
0.000<br />
0.000<br />
0.000<br />
0.000<br />
0.000<br />
0.000<br />
0.000<br />
0.000<br />
0.000<br />
0.000<br />
0.000<br />
0.000<br />
0.000<br />
Trial 4A.1<br />
Trial 4A.2<br />
Trial 4A.3<br />
Trial 4A.4A<br />
Trial 4A.4B<br />
927<br />
0<br />
0<br />
0<br />
0<br />
0.74<br />
0.00<br />
0.00<br />
0.00<br />
0.00<br />
0.079<br />
0.000<br />
0.000<br />
0.000<br />
0.000<br />
0.004<br />
0.000<br />
0.000<br />
0.000<br />
0.000<br />
0.001<br />
0.000<br />
0.000<br />
0.000<br />
0.000<br />
0.001<br />
0.000<br />
0.000<br />
0.000<br />
0.000<br />
Trial 4B.1A<br />
Trial 4B.1B<br />
Trial 4B.2A<br />
Trial 4B.2B<br />
Trial 4B.3<br />
2644<br />
3021<br />
0<br />
0<br />
0<br />
2.11<br />
2.42<br />
0.00<br />
0.00<br />
0.00<br />
0.225<br />
0.258<br />
0.000<br />
0.000<br />
0.000<br />
0.019<br />
0.031<br />
0.000<br />
0.000<br />
0.000<br />
0.003<br />
0.005<br />
0.000<br />
0.000<br />
0.000<br />
0.003<br />
0.005<br />
0.000<br />
0.000<br />
0.000<br />
Trial 5.1<br />
Trial 5.2A<br />
Trial 5.2B<br />
0<br />
0<br />
0<br />
0.00<br />
0.00<br />
0.00<br />
0.000<br />
0.000<br />
0.000<br />
0.000<br />
0.000<br />
0.000<br />
0.000<br />
0.000<br />
0.000<br />
0.000<br />
0.000<br />
0.000<br />
Trial 6.1<br />
Trial 6.2<br />
Trial 6.3<br />
Trial 6.4<br />
Trial 6.5<br />
8914<br />
0<br />
0<br />
0<br />
0<br />
7.12<br />
0.00<br />
0.00<br />
0.00<br />
0.00<br />
0.760<br />
0.000<br />
0.000<br />
0.000<br />
0.000<br />
0.008<br />
0.000<br />
0.000<br />
0.000<br />
0.000<br />
0.001<br />
0.000<br />
0.000<br />
0.000<br />
0.000<br />
Table A4.4. Quantification data for Isoeugenol. a density of isoeugenol = 1.0851<br />
0.001<br />
0.000<br />
0.000<br />
0.000<br />
0.000<br />
112
Vanillin<br />
Trial 1.1<br />
Trial 1.2A<br />
Trial 1.2B<br />
Peak Area<br />
M/Z = 151<br />
20181<br />
2968<br />
1883<br />
Conc.<br />
(ppm)<br />
10.06<br />
1.48<br />
0.94<br />
Mass<br />
(mg)<br />
1.092<br />
0.161<br />
0.102<br />
Yield<br />
m(converted)<br />
(%)<br />
0.006<br />
0.006<br />
0.011<br />
Yield<br />
(processed)<br />
(%)<br />
0.001<br />
0.001<br />
0.002<br />
Yield<br />
m(dry mass prc’d)<br />
(%)<br />
0.001<br />
0.001<br />
0.002<br />
Trial 2A.1A<br />
Trial 2A.1B<br />
Trial 2A.2<br />
Trial 2A.3A<br />
Trial 2A.3B<br />
Trial 2A.4<br />
120097<br />
107391<br />
442447<br />
32217<br />
41968<br />
62803<br />
59.04<br />
52.89<br />
207.52<br />
16.04<br />
20.86<br />
31.13<br />
6.406<br />
5.739<br />
22.518<br />
1.740<br />
2.264<br />
3.377<br />
0.540<br />
0.689<br />
1.016<br />
0.139<br />
0.213<br />
0.170<br />
0.079<br />
0.115<br />
0.161<br />
0.020<br />
0.031<br />
0.023<br />
0.081<br />
0.119<br />
0.166<br />
0.021<br />
0.032<br />
0.024<br />
Trial 2B.1A<br />
Trial 2B.1B<br />
Trial 2B.2<br />
Trial 2B.3<br />
Trial 2B.4A<br />
Trial 2B.4B<br />
Trial 2B.5A<br />
Trial 2B.5B<br />
Trial 2B.6<br />
0<br />
1966<br />
3609<br />
7380<br />
0<br />
1617<br />
0<br />
0<br />
0<br />
0.00<br />
0.98<br />
1.80<br />
3.69<br />
0.00<br />
0.81<br />
0.00<br />
0.00<br />
0.00<br />
0.000<br />
0.107<br />
0.196<br />
0.400<br />
0.000<br />
0.088<br />
0.000<br />
0.000<br />
0.000<br />
0.000<br />
0.011<br />
0.008<br />
0.017<br />
0.000<br />
0.005<br />
0.000<br />
0.000<br />
0.000<br />
0.000<br />
0.002<br />
0.002<br />
0.004<br />
0.000<br />
0.001<br />
0.000<br />
0.000<br />
0.000<br />
0.000<br />
0.002<br />
0.002<br />
0.004<br />
0.000<br />
0.001<br />
0.000<br />
0.000<br />
0.000<br />
Trial 2C.1<br />
Trial 2C.2<br />
Trial 2C.3A<br />
Trial 2C.3B<br />
2952<br />
24661<br />
16826<br />
21831<br />
1.48<br />
12.29<br />
8.39<br />
10.88<br />
0.160<br />
1.333<br />
0.911<br />
1.181<br />
0.015<br />
0.115<br />
0.076<br />
0.162<br />
0.002<br />
0.017<br />
0.013<br />
0.026<br />
0.002<br />
0.017<br />
0.013<br />
0.027<br />
Trial 3A.1A<br />
Trial 3A.1B<br />
Trial 3A.2<br />
53579<br />
37185<br />
2952<br />
26.59<br />
18.50<br />
1.48<br />
2.885<br />
2.007<br />
0.160<br />
0.194<br />
0.384<br />
0.015<br />
0.030<br />
0.048<br />
0.002<br />
0.031<br />
0.049<br />
0.002<br />
Trial 3B.1A<br />
Trial 3B.1B<br />
Trial 3B.2<br />
Trial 3B.3<br />
7984<br />
22964<br />
18452<br />
56097<br />
3.99<br />
11.45<br />
9.20<br />
27.83<br />
0.433<br />
1.242<br />
0.999<br />
3.020<br />
0.051<br />
0.041<br />
0.072<br />
0.034<br />
0.009<br />
0.008<br />
0.012<br />
0.007<br />
0.009<br />
0.008<br />
0.012<br />
0.007<br />
Trial 4A.1<br />
Trial 4A.2<br />
Trial 4A.3<br />
Trial 4A.4A<br />
Trial 4A.4B<br />
72395<br />
2952<br />
23212<br />
26745<br />
24896<br />
35.83<br />
1.48<br />
11.57<br />
13.32<br />
12.40<br />
3.888<br />
0.160<br />
1.255<br />
1.446<br />
1.346<br />
0.196<br />
0.015<br />
0.161<br />
0.306<br />
0.242<br />
0.026<br />
0.002<br />
0.019<br />
0.036<br />
0.025<br />
0.026<br />
0.002<br />
0.020<br />
0.037<br />
0.026<br />
Trial 4B.1A<br />
Trial 4B.1B<br />
Trial 4B.2A<br />
Trial 4B.2B<br />
Trial 4B.3<br />
120097<br />
107391<br />
95007<br />
84012<br />
79374<br />
59.04<br />
52.89<br />
46.87<br />
41.51<br />
39.25<br />
6.406<br />
5.739<br />
5.086<br />
4.504<br />
4.259<br />
0.540<br />
0.689<br />
0.429<br />
0.697<br />
0.576<br />
0.079<br />
0.115<br />
0.064<br />
0.093<br />
0.075<br />
0.081<br />
0.119<br />
0.066<br />
0.096<br />
0.077<br />
Trial 5.1<br />
Trial 5.2A<br />
Trial 5.2B<br />
16216<br />
7984<br />
22964<br />
8.09<br />
3.99<br />
11.45<br />
0.878<br />
0.433<br />
1.242<br />
0.097<br />
0.051<br />
0.041<br />
0.018<br />
0.009<br />
0.008<br />
0.019<br />
0.009<br />
0.008<br />
Trial 6.1<br />
Trial 6.2<br />
Trial 6.3<br />
Trial 6.4<br />
Trial 6.5<br />
249780<br />
44946<br />
54655<br />
20181<br />
29742<br />
120.52<br />
22.33<br />
27.12<br />
10.06<br />
14.81<br />
Table A5.5. Quantification data vanillin.<br />
13.078<br />
2.423<br />
2.943<br />
1.092<br />
1.607<br />
0.137<br />
0.021<br />
0.029<br />
0.005<br />
0.010<br />
0.010<br />
0.002<br />
0.002<br />
0.001<br />
0.001<br />
0.011<br />
0.002<br />
0.003<br />
0.001<br />
0.001<br />
113
Syringol<br />
Trial 1.1<br />
Trial 1.2A<br />
Trial 1.2B<br />
Peak Area<br />
M/Z = 154<br />
4909<br />
914<br />
765<br />
Conc.<br />
(ppm)<br />
2.85<br />
0.53<br />
0.44<br />
Mass a<br />
(mg)<br />
0.285<br />
0.053<br />
0.044<br />
Yield<br />
m(converted)<br />
(%)<br />
0.002<br />
0.002<br />
0.005<br />
Yield<br />
(processed)<br />
(%)<br />
0.000<br />
0.000<br />
0.001<br />
Yield<br />
m(dry mass prc’d)<br />
(%)<br />
0.000<br />
0.000<br />
0.001<br />
Trial 2A.1A<br />
Trial 2A.1B<br />
Trial 2A.2<br />
Trial 2A.3A<br />
Trial 2A.3B<br />
Trial 2A.4<br />
177403<br />
139907<br />
771674<br />
55285<br />
79311<br />
111435<br />
102.89<br />
81.15<br />
447.57<br />
32.07<br />
46.00<br />
64.63<br />
10.289<br />
8.115<br />
44.757<br />
3.207<br />
4.600<br />
6.463<br />
0.867<br />
0.974<br />
2.020<br />
0.256<br />
0.434<br />
0.3245<br />
0.127<br />
0.163<br />
0.319<br />
0.037<br />
0.064<br />
0.0448<br />
0.131<br />
0.168<br />
0.329<br />
0.039<br />
0.066<br />
0.0462<br />
Trial 2B.1A<br />
Trial 2B.1B<br />
Trial 2B.2<br />
Trial 2B.3<br />
Trial 2B.4A<br />
Trial 2B.4B<br />
Trial 2B.5A<br />
Trial 2B.5B<br />
Trial 2B.6<br />
4258<br />
2889<br />
8700<br />
20062<br />
3944<br />
2931<br />
1423<br />
2069<br />
6757<br />
2.47<br />
1.68<br />
5.05<br />
11.64<br />
2.29<br />
1.70<br />
0.83<br />
1.20<br />
3.92<br />
0.247<br />
0.168<br />
0.505<br />
1.164<br />
0.229<br />
0.170<br />
0.083<br />
0.120<br />
0.392<br />
0.012<br />
0.017<br />
0.021<br />
0.050<br />
0.012<br />
0.010<br />
0.003<br />
0.008<br />
0.033<br />
0.002<br />
0.003<br />
0.004<br />
0.010<br />
0.003<br />
0.002<br />
0.001<br />
0.002<br />
0.008<br />
0.002<br />
0.003<br />
0.004<br />
0.011<br />
0.003<br />
0.002<br />
0.001<br />
0.002<br />
0.008<br />
Trial 2C.1<br />
Trial 2C.2<br />
Trial 2C.3A<br />
Trial 2C.3B<br />
8769<br />
47442<br />
16616<br />
12726<br />
5.09<br />
27.52<br />
9.64<br />
7.38<br />
0.509<br />
2.752<br />
0.964<br />
0.738<br />
0.047<br />
0.236<br />
0.081<br />
0.101<br />
0.006<br />
0.035<br />
0.014<br />
0.016<br />
0.006<br />
0.036<br />
0.014<br />
0.017<br />
Trial 3A.1A<br />
Trial 3A.1B<br />
Trial 3A.2<br />
40359<br />
29812<br />
8769<br />
23.41<br />
17.29<br />
5.09<br />
2.341<br />
1.729<br />
0.509<br />
0.158<br />
0.331<br />
0.047<br />
0.025<br />
0.041<br />
0.006<br />
0.025<br />
0.043<br />
0.006<br />
Trial 3B.1A<br />
Trial 3B.1B<br />
Trial 3B.2<br />
Trial 3B.3<br />
6989<br />
39441<br />
33897<br />
101625<br />
4.05<br />
22.88<br />
19.66<br />
58.94<br />
0.405<br />
2.288<br />
1.966<br />
5.894<br />
0.047<br />
0.076<br />
0.142<br />
0.067<br />
0.009<br />
0.014<br />
0.023<br />
0.013<br />
0.009<br />
0.015<br />
0.024<br />
0.014<br />
Trial 4A.1<br />
Trial 4A.2<br />
Trial 4A.3<br />
Trial 4A.4A<br />
Trial 4A.4B<br />
20700<br />
8769<br />
9238<br />
7466<br />
6832<br />
12.01<br />
5.09<br />
5.36<br />
4.33<br />
3.96<br />
1.201<br />
0.509<br />
0.536<br />
0.433<br />
0.396<br />
0.061<br />
0.047<br />
0.069<br />
0.092<br />
0.071<br />
0.008<br />
0.006<br />
0.008<br />
0.011<br />
0.007<br />
0.008<br />
0.006<br />
0.008<br />
0.011<br />
0.008<br />
Trial 4B.1A<br />
Trial 4B.1B<br />
Trial 4B.2A<br />
Trial 4B.2B<br />
Trial 4B.3<br />
177403<br />
139907<br />
46756<br />
32881<br />
15867<br />
102.89<br />
81.15<br />
27.12<br />
19.07<br />
9.20<br />
10.289<br />
8.115<br />
2.712<br />
1.907<br />
0.920<br />
0.867<br />
0.974<br />
0.229<br />
0.295<br />
0.125<br />
0.127<br />
0.163<br />
0.034<br />
0.039<br />
0.016<br />
0.131<br />
0.168<br />
0.035<br />
0.041<br />
0.017<br />
Trial 5.1<br />
Trial 5.2A<br />
Trial 5.2B<br />
20697<br />
6989<br />
39441<br />
12.00<br />
4.05<br />
22.88<br />
1.200<br />
0.405<br />
2.288<br />
0.133<br />
0.047<br />
0.076<br />
0.025<br />
0.009<br />
0.014<br />
0.026<br />
0.009<br />
0.015<br />
Trial 6.1<br />
Trial 6.2<br />
Trial 6.3<br />
Trial 6.4<br />
Trial 6.5<br />
160124<br />
22040<br />
29042<br />
4909<br />
5131<br />
92.87<br />
12.78<br />
16.84<br />
2.85<br />
2.98<br />
Table A5.6. Quantification data for Syringol<br />
9.287<br />
1.278<br />
1.684<br />
0.285<br />
0.298<br />
0.097<br />
0.011<br />
0.017<br />
0.001<br />
0.002<br />
0.007<br />
0.001<br />
0.001<br />
0.000<br />
0.000<br />
0.008<br />
0.001<br />
0.002<br />
0.000<br />
0.000<br />
114
Syringaldehyde<br />
Trial 1.1<br />
Trial 1.2A<br />
Trial 1.2B<br />
Peak Area<br />
M/Z = 182<br />
113350<br />
8868<br />
7621<br />
Conc.<br />
(ppm)<br />
75.62<br />
6.18<br />
5.32<br />
Mass a<br />
(mg)<br />
7.562<br />
0.618<br />
0.532<br />
Yield<br />
m(converted)<br />
(%)<br />
0.0434<br />
0.0210<br />
0.0562<br />
Yield<br />
m(processed)<br />
(%)<br />
0.0070<br />
0.0033<br />
0.0087<br />
Yield<br />
m(dry mass prc’d)<br />
(%)<br />
0.007<br />
0.003<br />
0.009<br />
Trial 2A.1A<br />
Trial 2A.1B<br />
Trial 2A.2<br />
Trial 2A.3A<br />
Trial 2A.3B<br />
Trial 2A.4<br />
437257<br />
328634<br />
1915072<br />
259977<br />
297579<br />
365672<br />
250.63<br />
198.72<br />
276.98<br />
162.38<br />
182.62<br />
217.19<br />
25.063<br />
19.872<br />
27.698<br />
16.238<br />
18.262<br />
21.719<br />
2.1110<br />
2.3849<br />
1.2502<br />
1.2983<br />
1.7217<br />
1.0903<br />
0.3087<br />
0.3990<br />
0.1974<br />
0.1893<br />
0.2533<br />
0.1505<br />
0.318<br />
0.412<br />
0.204<br />
0.195<br />
0.261<br />
0.155<br />
Trial 2B.1A<br />
Trial 2B.1B<br />
Trial 2B.2<br />
Trial 2B.3<br />
Trial 2B.4A<br />
Trial 2B.4B<br />
Trial 2B.5A<br />
Trial 2B.5B<br />
Trial 2B.6<br />
0<br />
0<br />
28792<br />
73457<br />
27520<br />
32104<br />
34067<br />
28862<br />
11490<br />
0.00<br />
0.00<br />
19.91<br />
49.86<br />
19.04<br />
22.17<br />
23.51<br />
19.96<br />
8.00<br />
0.000<br />
0.000<br />
1.991<br />
4.986<br />
1.904<br />
2.217<br />
2.351<br />
1.996<br />
0.800<br />
0.0000<br />
0.0000<br />
0.0829<br />
0.2159<br />
0.1017<br />
0.1247<br />
0.0979<br />
0.1245<br />
0.0680<br />
0.0000<br />
0.0000<br />
0.0164<br />
0.0437<br />
0.0228<br />
0.0285<br />
0.0228<br />
0.0291<br />
0.0163<br />
0.000<br />
0.000<br />
0.017<br />
0.045<br />
0.024<br />
0.030<br />
0.024<br />
0.030<br />
0.017<br />
Trial 2C.1<br />
Trial 2C.2<br />
Trial 2C.3A<br />
Trial 2C.3B<br />
19891<br />
184497<br />
101075<br />
85814<br />
13.81<br />
119.28<br />
67.79<br />
57.93<br />
1.381<br />
11.928<br />
6.779<br />
5.793<br />
0.126<br />
1.025<br />
0.567<br />
0.794<br />
0.016<br />
0.150<br />
0.097<br />
0.127<br />
0.016<br />
0.154<br />
0.010<br />
0.131<br />
Trial 3A.1A<br />
Trial 3A.1B<br />
Trial 3A.2<br />
263595<br />
242866<br />
19891<br />
164.37<br />
152.90<br />
13.81<br />
16.437<br />
15.290<br />
1.381<br />
1.107<br />
2.928<br />
0.126<br />
0.172<br />
0.365<br />
0.016<br />
0.177<br />
0.375<br />
0.016<br />
Trial 3B.1A<br />
Trial 3B.1B<br />
Trial 3B.2<br />
Trial 3B.3<br />
22311<br />
112468<br />
99941<br />
218143<br />
15.47<br />
75.06<br />
67.06<br />
138.90<br />
1.547<br />
7.506<br />
6.706<br />
13.890<br />
0.181<br />
0.249<br />
0.484<br />
0.158<br />
0.033<br />
0.046<br />
0.079<br />
0.031<br />
0.034<br />
0.048<br />
0.082<br />
0.032<br />
Trial 4A.1<br />
Trial 4A.2<br />
Trial 4A.3<br />
Trial 4A.4A<br />
Trial 4A.4B<br />
28149<br />
19891<br />
0<br />
0<br />
1982<br />
19.47<br />
13.81<br />
0.00<br />
0.00<br />
1.39<br />
1.947<br />
1.381<br />
0.000<br />
0.000<br />
0.139<br />
0.0983<br />
0.1264<br />
0.0000<br />
0.0000<br />
0.0249<br />
0.0128<br />
0.0155<br />
0.0000<br />
0.0000<br />
0.0026<br />
0.013<br />
0.016<br />
0.000<br />
0.000<br />
0.003<br />
Trial 4B.1A<br />
Trial 4B.1B<br />
Trial 4B.2A<br />
Trial 4B.2B<br />
Trial 4B.3<br />
437257<br />
328634<br />
103345<br />
89307<br />
68946<br />
250.63<br />
198.72<br />
69.24<br />
60.20<br />
46.88<br />
25.063<br />
19.872<br />
6.924<br />
6.020<br />
4.688<br />
2.111<br />
2.385<br />
0.584<br />
0.931<br />
0.634<br />
0.309<br />
0.399<br />
0.088<br />
0.124<br />
0.082<br />
0.318<br />
0.412<br />
0.090<br />
0.128<br />
0.085<br />
Trial 5.1<br />
Trial 5.2A<br />
Trial 5.2B<br />
28149<br />
22311<br />
112468<br />
19.47<br />
15.47<br />
75.06<br />
1.947<br />
1.547<br />
7.506<br />
0.216<br />
0.181<br />
0.249<br />
0.041<br />
0.033<br />
0.046<br />
0.042<br />
0.034<br />
0.048<br />
Trial 6.1<br />
Trial 6.2<br />
Trial 6.3<br />
Trial 6.4<br />
Trial 6.5<br />
1274451<br />
296173<br />
331369<br />
113350<br />
102714<br />
421.09<br />
181.88<br />
200.11<br />
75.62<br />
68.84<br />
42.109<br />
18.188<br />
20.011<br />
7.562<br />
6.884<br />
Table A5.7. Quantification data for Syringaldehyde<br />
0.440<br />
0.159<br />
0.197<br />
0.032<br />
0.044<br />
0.031<br />
0.012<br />
0.016<br />
0.007<br />
0.005<br />
0.034<br />
0.013<br />
0.018<br />
0.007<br />
0.005<br />
115
Furfural<br />
Trial 1.1<br />
Trial 1.2A<br />
Trial 1.2B<br />
Peak Area<br />
M/Z = 95<br />
37413<br />
283413<br />
87399<br />
Conc.<br />
(ppm)<br />
7.47<br />
56.04<br />
17.42<br />
Mass a<br />
(mg)<br />
0.867<br />
6.500<br />
2.020<br />
Yield<br />
m(converted)<br />
(%)<br />
0.005<br />
0.221<br />
0.214<br />
Yield<br />
(processed)<br />
(%)<br />
0.001<br />
0.034<br />
0.033<br />
Yield<br />
m(dry mass prc’d)<br />
(%)<br />
0.001<br />
0.034<br />
0.033<br />
Trial 2A.1A<br />
Trial 2A.1B<br />
Trial 2A.2<br />
Trial 2A.3A<br />
Trial 2A.3B<br />
Trial 2A.4<br />
540112<br />
473882<br />
825771<br />
80600<br />
71092<br />
90955<br />
105.69<br />
92.98<br />
159.70<br />
16.07<br />
14.18<br />
18.12<br />
12.258<br />
10.784<br />
18.522<br />
1.864<br />
1.644<br />
2.102<br />
1.032<br />
1.335<br />
0.862<br />
0.154<br />
0.160<br />
0.109<br />
0.151<br />
0.217<br />
0.132<br />
0.022<br />
0.023<br />
0.015<br />
0.156<br />
0.223<br />
0.136<br />
0.022<br />
0.024<br />
0.015<br />
Trial 2B.1A<br />
Trial 2B.1B<br />
Trial 2B.2<br />
Trial 2B.3<br />
Trial 2B.4A<br />
Trial 2B.4B<br />
Trial 2B.5A<br />
Trial 2B.5B<br />
Trial 2B.6<br />
30974<br />
18681<br />
22754<br />
16616<br />
11070<br />
9962<br />
449<br />
2212<br />
1027<br />
6.19<br />
3.73<br />
4.55<br />
3.32<br />
2.21<br />
1.99<br />
0.09<br />
0.44<br />
0.21<br />
0.718<br />
0.433<br />
0.527<br />
0.385<br />
0.257<br />
0.231<br />
0.010<br />
0.051<br />
0.024<br />
0.036<br />
0.044<br />
0.023<br />
0.017<br />
0.014<br />
0.013<br />
0.000<br />
0.003<br />
0.002<br />
0.006<br />
0.008<br />
0.004<br />
0.003<br />
0.003<br />
0.003<br />
0.000<br />
0.001<br />
0.001<br />
0.006<br />
0.008<br />
0.005<br />
0.004<br />
0.003<br />
0.003<br />
0.000<br />
0.001<br />
0.001<br />
Trial 2C.1<br />
Trial 2C.2<br />
Trial 2C.3A<br />
Trial 2C.3B<br />
32664<br />
47600<br />
719<br />
1734<br />
6.52<br />
9.50<br />
0.14<br />
0.35<br />
0.757<br />
1.102<br />
0.017<br />
0.040<br />
0.0713<br />
0.0974<br />
0.0014<br />
0.0057<br />
0.0085<br />
0.0139<br />
0.0002<br />
0.0009<br />
0.009<br />
0.014<br />
0.000<br />
0.001<br />
Trial 3A.1A<br />
Trial 3A.1B<br />
Trial 3A.2<br />
2507<br />
3003<br />
32664<br />
0.50<br />
0.60<br />
6.52<br />
0.058<br />
0.070<br />
0.757<br />
0.004<br />
0.014<br />
0.071<br />
0.001<br />
0.002<br />
0.009<br />
0.001<br />
0.002<br />
0.009<br />
Trial 3B.1A<br />
Trial 3B.1B<br />
Trial 3B.2<br />
Trial 3B.3<br />
54498<br />
192837<br />
41378<br />
188052<br />
10.88<br />
38.27<br />
8.26<br />
37.33<br />
1.261<br />
4.439<br />
0.958<br />
4.329<br />
0.152<br />
0.152<br />
0.072<br />
0.051<br />
0.027<br />
0.027<br />
0.011<br />
0.010<br />
0.027<br />
0.028<br />
0.012<br />
0.010<br />
Trial 4A.1<br />
Trial 4A.2<br />
Trial 4A.3<br />
Trial 4A.4A<br />
Trial 4A.4B<br />
124643<br />
32664<br />
25861<br />
20114<br />
24742<br />
24.80<br />
6.52<br />
5.17<br />
4.02<br />
4.94<br />
2.877<br />
0.757<br />
0.599<br />
0.466<br />
0.573<br />
0.149<br />
0.071<br />
0.079<br />
0.101<br />
0.106<br />
0.019<br />
0.009<br />
0.009<br />
0.012<br />
0.011<br />
0.019<br />
0.009<br />
0.009<br />
0.012<br />
0.011<br />
Trial 4B.1A<br />
Trial 4B.1B<br />
Trial 4B.2A<br />
Trial 4B.2B<br />
Trial 4B.3<br />
540112<br />
473882<br />
499328<br />
566836<br />
318614<br />
105.69<br />
92.98<br />
97.87<br />
110.80<br />
62.91<br />
12.258<br />
10.784<br />
11.351<br />
12.850<br />
7.296<br />
1.032<br />
1.335<br />
0.958<br />
2.050<br />
1.018<br />
0.15<br />
0.217<br />
0.144<br />
0.266<br />
0.128<br />
0.156<br />
0.223<br />
0.148<br />
0.274<br />
0.132<br />
Trial 5.1<br />
Trial 5.2A<br />
Trial 5.2B<br />
48918<br />
54498<br />
192837<br />
9.76<br />
10.88<br />
38.27<br />
1.132<br />
1.261<br />
4.439<br />
0.130<br />
0.152<br />
0.152<br />
0.024<br />
0.026<br />
0.027<br />
0.025<br />
0.027<br />
0.028<br />
Trial 6.1<br />
Trial 6.2<br />
Trial 6.3<br />
Trial 6.4<br />
Trial 6.5<br />
480300<br />
0<br />
55453<br />
37413<br />
29868<br />
94.21<br />
0.00<br />
11.07<br />
7.47<br />
5.97<br />
10.927<br />
0.000<br />
1.283<br />
0.867<br />
0.692<br />
0.125<br />
0.000<br />
0.014<br />
0.004<br />
0.005<br />
Table A5.8. Quantification data for Furfural. a density of furfural = 1.1594<br />
0.008<br />
0.000<br />
0.001<br />
0.001<br />
0.001<br />
0.009<br />
0.000<br />
0.001<br />
0.001<br />
0.001<br />
116
Furfuryl<br />
alcohol<br />
Trial 1.1<br />
Trial 1.2A<br />
Trial 1.2B<br />
Peak Area<br />
M/Z = 98<br />
6831<br />
12758<br />
10934<br />
Conc.<br />
(ppm)<br />
8.18<br />
15.26<br />
13.08<br />
Mass a<br />
(mg)<br />
0.924<br />
1.724<br />
1.478<br />
Yield<br />
m(converted)<br />
(%)<br />
0.005<br />
0.059<br />
0.156<br />
Yield<br />
(processed)<br />
(%)<br />
0.001<br />
0.009<br />
0.024<br />
Yield<br />
m(dry mass prc’d)<br />
(%)<br />
0.001<br />
0.009<br />
0.024<br />
Trial 2A.1A<br />
Trial 2A.1B<br />
Trial 2A.2<br />
Trial 2A.3A<br />
Trial 2A.3B<br />
Trial 2A.4<br />
0<br />
0<br />
5682<br />
0<br />
0<br />
0<br />
0.00<br />
0.00<br />
6.81<br />
0.00<br />
0.00<br />
0.00<br />
0.000<br />
0.000<br />
0.769<br />
0.000<br />
0.000<br />
0.000<br />
0.000<br />
0.000<br />
0.036<br />
0.000<br />
0.000<br />
0.000<br />
0.000<br />
0.000<br />
0.006<br />
0.000<br />
0.000<br />
0.000<br />
0.000<br />
0.000<br />
0.006<br />
0.000<br />
0.000<br />
0.000<br />
Trial 2B.1A<br />
Trial 2B.1B<br />
Trial 2B.2<br />
Trial 2B.3<br />
Trial 2B.4A<br />
Trial 2B.4B<br />
Trial 2B.5A<br />
Trial 2B.5B<br />
Trial 2B.6<br />
5315<br />
6537<br />
0<br />
0<br />
0<br />
0<br />
744<br />
1099<br />
0<br />
6.37<br />
7.83<br />
0.00<br />
0.00<br />
0.00<br />
0.00<br />
0.89<br />
1.32<br />
0.00<br />
0.720<br />
0.885<br />
0.000<br />
0.000<br />
0.000<br />
0.000<br />
0.101<br />
0.149<br />
0.000<br />
0.036<br />
0.090<br />
0.000<br />
0.000<br />
0.000<br />
0.000<br />
0.004<br />
0.010<br />
0.000<br />
0.006<br />
0.016<br />
0.000<br />
0.000<br />
0.000<br />
0.000<br />
0.001<br />
0.002<br />
0.000<br />
0.006<br />
0.017<br />
0.000<br />
0.000<br />
0.000<br />
0.000<br />
0.001<br />
0.002<br />
0.000<br />
Trial 2C.1<br />
Trial 2C.2<br />
Trial 2C.3A<br />
Trial 2C.3B<br />
0<br />
6308<br />
1855<br />
1537<br />
0.00<br />
7.56<br />
2.22<br />
1.84<br />
0.000<br />
0.854<br />
0.251<br />
0.208<br />
0.000<br />
0.075<br />
0.022<br />
0.029<br />
0.000<br />
0.011<br />
0.004<br />
0.005<br />
0.000<br />
0.011<br />
0.004<br />
0.005<br />
Trial 3A.1A<br />
Trial 3A.1B<br />
Trial 3A.2<br />
3708<br />
1991<br />
0<br />
4.45<br />
2.39<br />
0.00<br />
0.502<br />
0.270<br />
0.000<br />
0.035<br />
0.053<br />
0.000<br />
0.005<br />
0.006<br />
0.000<br />
0.005<br />
0.007<br />
0.000<br />
Trial 3B.1A<br />
Trial 3B.1B<br />
Trial 3B.2<br />
Trial 3B.3<br />
10765<br />
42121<br />
9685<br />
91540<br />
12.88<br />
50.01<br />
11.59<br />
107.33<br />
1.455<br />
5.649<br />
1.310<br />
12.124<br />
0.176<br />
0.193<br />
0.098<br />
0.143<br />
0.031<br />
0.035<br />
0.015<br />
0.027<br />
0.032<br />
0.036<br />
0.016<br />
0.028<br />
Trial 4A.1<br />
Trial 4A.2<br />
Trial 4A.3<br />
Trial 4A.4A<br />
Trial 4A.4B<br />
0<br />
0<br />
4147<br />
5286<br />
1917<br />
0.00<br />
0.00<br />
4.97<br />
6.33<br />
2.30<br />
0.000<br />
0.000<br />
0.562<br />
0.716<br />
0.260<br />
0.000<br />
0.000<br />
0.074<br />
0.156<br />
0.048<br />
0.000<br />
0.000<br />
0.009<br />
0.018<br />
0.005<br />
0.000<br />
0.000<br />
0.009<br />
0.018<br />
0.005<br />
Trial 4B.1A<br />
Trial 4B.1B<br />
Trial 4B.2A<br />
Trial 4B.2B<br />
Trial 4B.3<br />
0<br />
4926<br />
2892<br />
5177<br />
2124<br />
0.00<br />
5.90<br />
3.47<br />
6.20<br />
2.55<br />
0.000<br />
0.667<br />
0.392<br />
0.701<br />
0.288<br />
0.000<br />
0.083<br />
0.033<br />
0.112<br />
0.040<br />
0.000<br />
0.013<br />
0.005<br />
0.015<br />
0.005<br />
0.000<br />
0.014<br />
0.005<br />
0.015<br />
0.005<br />
Trial 5.1<br />
Trial 5.2A<br />
Trial 5.2B<br />
9607<br />
10765<br />
42121<br />
11.50<br />
12.88<br />
50.01<br />
1.299<br />
1.455<br />
5.649<br />
0.149<br />
0.176<br />
0.194<br />
0.027<br />
0.031<br />
0.035<br />
0.028<br />
0.032<br />
0.036<br />
Trial 6.1<br />
Trial 6.2<br />
Trial 6.3<br />
Trial 6.4<br />
Trial 6.5<br />
21413<br />
2966<br />
3223<br />
6831<br />
4741<br />
25.56<br />
3.56<br />
3.86<br />
8.18<br />
5.68<br />
2.887<br />
0.402<br />
0.437<br />
0.924<br />
0.642<br />
0.033<br />
0.004<br />
0.005<br />
0.004<br />
0.004<br />
0.002<br />
0.000<br />
0.000<br />
0.001<br />
0.000<br />
Table A5.9. Quantification data for Furfuryl alcohol. a density of furfuryl alcohol = 1.1296.<br />
0.002<br />
0.000<br />
0.000<br />
0.001<br />
0.001<br />
117
Furfural<br />
methyl acetal<br />
Trial 1.1<br />
Trial 1.2A<br />
Trial 1.2B<br />
Peak Area<br />
M/Z = RIC<br />
602536<br />
327182<br />
119741<br />
Conc.<br />
(ppm)<br />
49.52<br />
26.89<br />
9.84<br />
Mass a<br />
(mg)<br />
2.476<br />
1.345<br />
0.492<br />
Yield<br />
m(converted)<br />
(%)<br />
0.014<br />
0.046<br />
0.052<br />
Yield<br />
(processed)<br />
(%)<br />
0.002<br />
0.007<br />
0.008<br />
Yield<br />
m(dry mass prc’d)<br />
(%)<br />
0.002<br />
0.007<br />
0.008<br />
Trial 2A.1A<br />
Trial 2A.1B<br />
Trial 2A.2<br />
Trial 2A.3A<br />
Trial 2A.3B<br />
Trial 2A.4<br />
4625057<br />
2725377<br />
6344485<br />
466540<br />
367926<br />
464085<br />
380.13<br />
224.00<br />
521.45<br />
38.34<br />
30.24<br />
38.14<br />
19.007<br />
11.200<br />
26.073<br />
1.917<br />
1.512<br />
1.907<br />
1.601<br />
1.344<br />
1.177<br />
0.153<br />
0.143<br />
0.096<br />
0.234<br />
0.225<br />
0.186<br />
0.022<br />
0.021<br />
0.013<br />
0.241<br />
0.232<br />
0.192<br />
0.023<br />
0.022<br />
0.014<br />
Trial 2B.1A<br />
Trial 2B.1B<br />
Trial 2B.2<br />
Trial 2B.3<br />
Trial 2B.4A<br />
Trial 2B.4B<br />
Trial 2B.5A<br />
Trial 2B.5B<br />
Trial 2B.6<br />
540171<br />
198757<br />
261981<br />
403379<br />
158564<br />
123924<br />
110309<br />
61994<br />
55223<br />
44.40<br />
16.34<br />
21.53<br />
33.15<br />
13.03<br />
10.19<br />
9.07<br />
5.10<br />
4.54<br />
2.220<br />
0.817<br />
1.077<br />
1.658<br />
0.652<br />
0.509<br />
0.453<br />
0.255<br />
0.227<br />
0.107<br />
0.081<br />
0.045<br />
0.072<br />
0.035<br />
0.029<br />
0.019<br />
0.016<br />
0.019<br />
0.017<br />
0.015<br />
0.009<br />
0.015<br />
0.008<br />
0.007<br />
0.004<br />
0.004<br />
0.005<br />
0.018<br />
0.015<br />
0.009<br />
0.015<br />
0.008<br />
0.007<br />
0.005<br />
0.004<br />
0.005<br />
Trial 2C.1<br />
Trial 2C.2<br />
Trial 2C.3A<br />
Trial 2C.3B<br />
369905<br />
0<br />
0<br />
0<br />
30.40<br />
0.00<br />
0.00<br />
0.00<br />
1.520<br />
0.000<br />
0.000<br />
0.000<br />
0.139<br />
0.000<br />
0.000<br />
0.000<br />
0.017<br />
0.000<br />
0.000<br />
0.000<br />
0.018<br />
0.000<br />
0.000<br />
0.000<br />
Trial 3A.1A<br />
Trial 3A.1B<br />
Trial 3A.2<br />
0<br />
0<br />
369905<br />
0.00<br />
0.00<br />
30.40<br />
0.000<br />
0.000<br />
1.520<br />
0.000<br />
0.000<br />
0.139<br />
0.0000<br />
0.000<br />
0.017<br />
0.000<br />
0.000<br />
0.018<br />
Trial 3B.1A<br />
Trial 3B.1B<br />
Trial 3B.2<br />
Trial 3B.3<br />
168184<br />
616087<br />
97327<br />
423519<br />
13.82<br />
50.64<br />
8.00<br />
34.81<br />
0.691<br />
2.532<br />
0.400<br />
1.740<br />
0.081<br />
0.084<br />
0.029<br />
0.020<br />
0.015<br />
0.016<br />
0.005<br />
0.004<br />
0.015<br />
0.016<br />
0.005<br />
0.004<br />
Trial 4A.1<br />
Trial 4A.2<br />
Trial 4A.3<br />
Trial 4A.4A<br />
Trial 4A.4B<br />
1131935<br />
369905<br />
117369<br />
178101<br />
0<br />
93.03<br />
30.40<br />
9.65<br />
14.64<br />
0.00<br />
4.652<br />
1.520<br />
0.482<br />
0.732<br />
0.000<br />
0.235<br />
0.139<br />
0.062<br />
0.155<br />
0.000<br />
0.031<br />
0.017<br />
0.007<br />
0.018<br />
0.000<br />
0.031<br />
0.018<br />
0.008<br />
0.019<br />
0.000<br />
Trial 4B.1A<br />
Trial 4B.1B<br />
Trial 4B.2A<br />
Trial 4B.2B<br />
Trial 4B.3<br />
4625057<br />
2725377<br />
4527114<br />
3131181<br />
1093335<br />
380.13<br />
224.00<br />
372.08<br />
257.35<br />
89.86<br />
19.007<br />
11.200<br />
18.604<br />
12.868<br />
4.493<br />
1.601<br />
1.344<br />
1.570<br />
1.999<br />
0.608<br />
0.234<br />
0.225<br />
0.235<br />
0.260<br />
0.079<br />
0.241<br />
0.232<br />
0.243<br />
0.274<br />
0.081<br />
Trial 5.1<br />
Trial 5.2A<br />
Trial 5.2B<br />
130442<br />
168184<br />
616087<br />
10.72<br />
13.82<br />
50.64<br />
0.536<br />
0.691<br />
2.532<br />
0.059<br />
0.081<br />
0.084<br />
0.011<br />
0.015<br />
0.016<br />
0.012<br />
0.015<br />
0.016<br />
Trial 6.1<br />
Trial 6.2<br />
Trial 6.3<br />
Trial 6.4<br />
Trial 6.5<br />
2645225<br />
260255<br />
360755<br />
1602536<br />
180127<br />
217.41<br />
21.39<br />
29.65<br />
131.71<br />
14.80<br />
10.871<br />
1.070<br />
1.483<br />
6.586<br />
0.740<br />
0.114<br />
0.009<br />
0.015<br />
0.028<br />
0.005<br />
Table A5.10. Quantification data for Furfural methyl acetal.<br />
0.008<br />
0.001<br />
0.001<br />
0.006<br />
0.001<br />
0.009<br />
0.001<br />
0.001<br />
0.006<br />
0.001<br />
118
Appendix 4: Integration data for<br />
compounds derived from the pyrolysis of<br />
the hardwood lignin<br />
Lignin Derived Compound<br />
Guaiacol<br />
Phenol<br />
3-methyl-2-methoxyphenol<br />
4-Ethyl-2-methoxyphenol<br />
4-Vinylguaiacol<br />
Eugenol<br />
Syringol<br />
Isoeugenol<br />
Vanillin<br />
4-Hydroxy-3-methoxybenzoic acid<br />
3,4-Dimethoxybenzene-1,2-diol<br />
Homovanillin<br />
Acetguaiacone<br />
2-Methoxy-1,4-benzenediol<br />
Guaiacyl acetone<br />
4-Vinylsyringol<br />
4-Allylsyringol<br />
2,5-Dimethoxybenzeneacetic acid<br />
3-Hydroxy-1-(4-hydroxy-3-methoxyphenyl)-1-Propanone<br />
Alpha-oxy-propioguaiacone<br />
4-Propenylsyringol (trans)<br />
4-(4-Hydroxy-3-methoxyphenyl)-3-buten-2-one<br />
3-Hydroxy-4-methoxycinnamic acid<br />
Isomer 1 of 3-Hydroxy-4-methoxycinnamic acid<br />
Syringaldehyde<br />
3,4,5-Trimethoxyphenol<br />
Homosyringaldehyde<br />
Acetosyringone<br />
Coniferaldehyde<br />
Syringyl acetone<br />
Unknown 1 (syringyl)<br />
Benzeneacetic acid, alpha-phenyl-,methyl ester<br />
Propiosyringone<br />
Alpha-oxy-propiosyringone<br />
4-(oxy-Allyl)-syringol<br />
Sinapaldehyde<br />
Retention Time<br />
(minutes)<br />
15.177<br />
15.667<br />
18.246<br />
23.233<br />
25.600<br />
26.649<br />
28.065<br />
30.884<br />
31.534<br />
31.733<br />
32.476<br />
33.845<br />
34.622<br />
34.349<br />
36.567<br />
36.683<br />
37.434<br />
37.834<br />
38.250<br />
38.715<br />
39.283<br />
39.798<br />
39.967<br />
41.350<br />
42.148<br />
42.933<br />
43.758<br />
44.548<br />
45.440<br />
46.051<br />
46.626<br />
46.695<br />
47.087<br />
47.344<br />
47.551<br />
52.131<br />
Table A4.1. Compounds detected from the pyrolysis of the lignin component of hardwood and the<br />
corresponding retention time.<br />
119
Retention<br />
Time<br />
15.177<br />
15.667<br />
18.246<br />
23.233<br />
25.600<br />
26.649<br />
28.065<br />
30.884<br />
31.534<br />
31.733<br />
32.476<br />
33.845<br />
34.622<br />
34.349<br />
36.567<br />
36.683<br />
37.434<br />
37.834<br />
38.250<br />
38.715<br />
39.283<br />
39.798<br />
39.967<br />
41.350<br />
42.148<br />
42.933<br />
43.758<br />
44.548<br />
45.440<br />
46.051<br />
46.626<br />
46.695<br />
47.087<br />
47.344<br />
47.551<br />
52.131<br />
Standardised Peak Area<br />
Trial 1.1.1 Trial 1.1.2 Trial 1.1.3 Trial 1.1.4 Trial 1.1.5<br />
10796<br />
0<br />
0<br />
0<br />
0<br />
0<br />
0<br />
0<br />
0<br />
0<br />
2485<br />
0<br />
0<br />
0<br />
0<br />
0<br />
0<br />
0<br />
0<br />
0<br />
9354<br />
0<br />
0<br />
0<br />
0<br />
0<br />
0<br />
0<br />
0<br />
0<br />
89976 4783 14587 2052 1868<br />
5039<br />
0<br />
0<br />
0<br />
0<br />
98238 14903 14137 6729 5630<br />
50432 3049 4025 1862 1519<br />
15425<br />
0 1143<br />
0<br />
0<br />
6791<br />
0 1619<br />
0<br />
0<br />
4737 950 4548<br />
0<br />
0<br />
0<br />
0 2445<br />
0<br />
0<br />
0<br />
0 1646<br />
0<br />
0<br />
17871<br />
0 3590<br />
0<br />
0<br />
0 859 2328<br />
0<br />
0<br />
0<br />
0<br />
0<br />
0<br />
0<br />
0<br />
0 2812<br />
0<br />
0<br />
0<br />
0 2246<br />
0<br />
0<br />
0<br />
0<br />
0<br />
0<br />
0<br />
0<br />
0 1471<br />
0<br />
0<br />
0<br />
0 1407<br />
0<br />
0<br />
0<br />
0 6862<br />
0<br />
0<br />
577763 116204 106116 48306 36879<br />
10411 3190 5201 1216<br />
0<br />
17143 5196 4531 1455<br />
0<br />
80674 14202 13055 4808<br />
744<br />
232957 72837 35339 21622 3509<br />
18764 7970<br />
0 1146 1046<br />
2313 3226<br />
0<br />
0<br />
0<br />
3349<br />
0<br />
0<br />
0<br />
0<br />
4974 3078<br />
0<br />
0<br />
0<br />
33471 10268<br />
0 4173 1322<br />
44002 10106<br />
0 3378 1091<br />
779976 59524 89868 84716 13420<br />
Table A4.2. Standardised peak area of lignin derived compounds for trials conducted in Experiment 1.1.<br />
120
Retention<br />
Time<br />
15.177<br />
15.667<br />
18.246<br />
23.233<br />
25.600<br />
26.649<br />
28.065<br />
30.884<br />
31.534<br />
31.733<br />
32.476<br />
33.845<br />
34.622<br />
34.349<br />
36.567<br />
36.683<br />
37.434<br />
37.834<br />
38.250<br />
38.715<br />
39.283<br />
39.798<br />
39.967<br />
41.350<br />
42.148<br />
42.933<br />
43.758<br />
44.548<br />
45.440<br />
46.051<br />
46.626<br />
46.695<br />
47.087<br />
47.344<br />
47.551<br />
52.131<br />
Standardised Peak Area<br />
Trial 1.2.1 Trial 1.2.2A Trial 1.2.2B<br />
0<br />
0<br />
0<br />
0<br />
0<br />
0<br />
0<br />
0<br />
0<br />
0<br />
0<br />
0<br />
0<br />
0<br />
0<br />
0<br />
0<br />
0<br />
2052 1866 2154<br />
0<br />
0<br />
0<br />
6729 5185 5611<br />
1862<br />
0<br />
0<br />
0<br />
0<br />
0<br />
0<br />
0<br />
0<br />
0<br />
0<br />
0<br />
0<br />
0<br />
0<br />
0<br />
0<br />
0<br />
0<br />
0<br />
0<br />
0<br />
0<br />
0<br />
0<br />
0<br />
0<br />
0<br />
0<br />
0<br />
0<br />
0<br />
0<br />
0<br />
0<br />
0<br />
0<br />
0<br />
0<br />
0<br />
0<br />
0<br />
0<br />
0<br />
0<br />
48306 21685 21877<br />
1216<br />
0<br />
0<br />
1455<br />
0<br />
0<br />
4808<br />
0<br />
0<br />
21622 4194 4544<br />
1146<br />
0<br />
0<br />
0<br />
0<br />
0<br />
0<br />
0<br />
0<br />
0<br />
0<br />
0<br />
4173 3811 4250<br />
3378 3043 2849<br />
84716 65678 63504<br />
Table A4.3. Standardised peak area of lignin derived compounds for trials conducted in Experiment 1.2<br />
121
Retention<br />
Time<br />
15.177<br />
15.667<br />
18.246<br />
23.233<br />
25.600<br />
26.649<br />
28.065<br />
30.884<br />
31.534<br />
31.733<br />
32.476<br />
33.845<br />
34.622<br />
34.349<br />
36.567<br />
36.683<br />
37.434<br />
37.834<br />
38.250<br />
38.715<br />
39.283<br />
39.798<br />
39.967<br />
41.350<br />
42.148<br />
42.933<br />
43.758<br />
44.548<br />
45.440<br />
46.051<br />
46.626<br />
46.695<br />
47.087<br />
47.344<br />
47.551<br />
52.131<br />
Standardised Peak Area<br />
Trial 1.3.1 Trial 1.3.2 Trial 1.3.3A Trial 1.3.3B<br />
32505 30886<br />
0<br />
0<br />
27482 163321<br />
0<br />
55474<br />
0<br />
0<br />
0<br />
0<br />
0<br />
0<br />
0<br />
0<br />
0<br />
0<br />
0<br />
0<br />
0 14170<br />
0<br />
24903<br />
117557 241839 173978 144217<br />
0<br />
0<br />
0<br />
0<br />
105316 116873 121483 153346<br />
116815 48145 81514<br />
83437<br />
7184<br />
0<br />
0<br />
0<br />
0 11531<br />
0<br />
0<br />
0 20705<br />
0<br />
0<br />
0<br />
0<br />
0<br />
0<br />
36601 19754<br />
0<br />
0<br />
0<br />
0 58823<br />
50437<br />
0<br />
0 45904<br />
34008<br />
0<br />
0 21169<br />
0<br />
0<br />
0<br />
0<br />
0<br />
0<br />
0<br />
0<br />
0<br />
0<br />
0<br />
0<br />
0<br />
0 36190 27124<br />
20703<br />
0<br />
0 38077<br />
21349<br />
33823<br />
0 127245 106193<br />
333914 469559 656152 567039<br />
0<br />
0<br />
0<br />
0<br />
7406 48112 65302<br />
53589<br />
45280 143010 132333 142301<br />
22612<br />
0 60952 121674<br />
38953 96498 95229<br />
99131<br />
0<br />
0<br />
0<br />
0<br />
0<br />
0 81721<br />
64573<br />
0<br />
0 46132<br />
42635<br />
36004 18850 31651<br />
32408<br />
0<br />
0<br />
0<br />
0<br />
183889 35243 434288 343606<br />
Table A4.4. Standardised peak area of lignin derived compounds for trials conducted in Experiment 1.3.<br />
122
Retention<br />
Time<br />
15.177<br />
15.667<br />
18.246<br />
23.233<br />
25.600<br />
26.649<br />
28.065<br />
30.884<br />
31.534<br />
31.733<br />
32.476<br />
33.845<br />
34.622<br />
34.349<br />
36.567<br />
36.683<br />
37.434<br />
37.834<br />
38.250<br />
38.715<br />
39.283<br />
39.798<br />
39.967<br />
41.350<br />
42.148<br />
42.933<br />
43.758<br />
44.548<br />
45.440<br />
46.051<br />
46.626<br />
46.695<br />
47.087<br />
47.344<br />
47.551<br />
52.131<br />
Standardised Peak Area<br />
Trial 1.4A.1A Trial 1.4A.1B Trial 1.4A.2<br />
0<br />
0 32505<br />
0<br />
0 27482<br />
0<br />
0<br />
0<br />
0<br />
0<br />
0<br />
0<br />
0<br />
0<br />
0<br />
0<br />
0<br />
264617 224763 117557<br />
14155<br />
0<br />
0<br />
210354 168847 105316<br />
166099 140821 116815<br />
14479<br />
0<br />
7184<br />
27378<br />
46825<br />
0<br />
55835<br />
71472<br />
0<br />
0<br />
0<br />
0<br />
0<br />
0 36601<br />
0<br />
24813<br />
0<br />
0<br />
6971<br />
0<br />
0<br />
0<br />
0<br />
0<br />
0<br />
0<br />
0<br />
0<br />
0<br />
0<br />
0<br />
0<br />
0<br />
0<br />
0<br />
0<br />
0<br />
0<br />
59182<br />
54513 33823<br />
1284043 1183085 333914<br />
0<br />
0<br />
0<br />
71340<br />
58071<br />
7406<br />
240864 217455 45280<br />
40025<br />
7174 22612<br />
132125<br />
99319 38953<br />
0<br />
0<br />
0<br />
0<br />
0<br />
0<br />
0<br />
0<br />
0<br />
43307<br />
33303 36004<br />
18872<br />
15026<br />
0<br />
606470 524183 183889<br />
Table A4.5. Total peak area of lignin derived compounds for trials conducted in Experiment 1.4A.<br />
123
Retention<br />
Time<br />
15.177<br />
15.667<br />
18.246<br />
23.233<br />
25.600<br />
26.649<br />
28.065<br />
30.884<br />
31.534<br />
31.733<br />
32.476<br />
33.845<br />
34.622<br />
34.349<br />
36.567<br />
36.683<br />
37.434<br />
37.834<br />
38.250<br />
38.715<br />
39.283<br />
39.798<br />
39.967<br />
41.350<br />
42.148<br />
42.933<br />
43.758<br />
44.548<br />
45.440<br />
46.051<br />
46.626<br />
46.695<br />
47.087<br />
47.344<br />
47.551<br />
52.131<br />
Standardised Peak Area<br />
Trial 1.4B.1A Trial 1.4B.1B Trial 1.4B.2 Trial 1.4B.3<br />
18903<br />
21379<br />
37304<br />
0<br />
7415<br />
8801<br />
16619<br />
6638<br />
0<br />
0<br />
0<br />
0<br />
0<br />
0<br />
0<br />
0<br />
0<br />
0<br />
0<br />
0<br />
0<br />
0<br />
0<br />
0<br />
38789<br />
47746<br />
77451<br />
34516<br />
0<br />
0<br />
0<br />
0<br />
34033<br />
34622<br />
55317<br />
21464<br />
30140<br />
15789<br />
25544<br />
22189<br />
0<br />
0<br />
0<br />
0<br />
0<br />
0<br />
0<br />
0<br />
0<br />
0<br />
0<br />
0<br />
0<br />
0<br />
0<br />
0<br />
9813<br />
10702<br />
18610<br />
9526<br />
0<br />
0<br />
0<br />
0<br />
0<br />
0<br />
27117<br />
5423<br />
0<br />
0<br />
0<br />
0<br />
0<br />
0<br />
0<br />
0<br />
0<br />
0<br />
0<br />
0<br />
0<br />
0<br />
0<br />
0<br />
0<br />
0<br />
29836<br />
3338<br />
0<br />
0<br />
0<br />
0<br />
12018<br />
14532<br />
22716<br />
10756<br />
91512<br />
111212<br />
193794<br />
85998<br />
0<br />
0<br />
0<br />
0<br />
10331<br />
12258<br />
20943<br />
9115<br />
20136<br />
22917<br />
35823<br />
17416<br />
5336<br />
2465<br />
15161<br />
5020<br />
11745<br />
13749<br />
78668<br />
10396<br />
0<br />
0<br />
0<br />
0<br />
0<br />
0<br />
0<br />
0<br />
0<br />
0<br />
0<br />
0<br />
8602<br />
22481<br />
37527<br />
7010<br />
0<br />
0<br />
0<br />
0<br />
55827<br />
63067<br />
118194<br />
49727<br />
Table A4.6. Standardised peak area of lignin derived compounds for trials conducted in Experiment 1.4B.<br />
124
Retention<br />
Time<br />
15.177<br />
15.667<br />
18.246<br />
23.233<br />
25.600<br />
26.649<br />
28.065<br />
30.884<br />
31.534<br />
31.733<br />
32.476<br />
33.845<br />
34.622<br />
34.349<br />
36.567<br />
36.683<br />
37.434<br />
37.834<br />
38.250<br />
38.715<br />
39.283<br />
39.798<br />
39.967<br />
41.350<br />
42.148<br />
42.933<br />
43.758<br />
44.548<br />
45.440<br />
46.051<br />
46.626<br />
46.695<br />
47.087<br />
47.344<br />
47.551<br />
52.131<br />
Standardised Peak Area<br />
Trial 1.5.1 Trial 1.5.2A Trial 1.5.2B<br />
21027 18903 21379<br />
19881 7415 8801<br />
0<br />
0<br />
0<br />
0<br />
0<br />
0<br />
0<br />
0<br />
0<br />
0<br />
0<br />
0<br />
94121 38789 47746<br />
0<br />
0<br />
0<br />
59736 34033 34622<br />
58582 30140 15789<br />
0<br />
0<br />
0<br />
0<br />
0<br />
0<br />
0<br />
0<br />
0<br />
0<br />
0<br />
0<br />
26043 9813 10702<br />
0<br />
0<br />
0<br />
0<br />
0<br />
0<br />
0<br />
0<br />
0<br />
0<br />
0<br />
0<br />
0<br />
0<br />
0<br />
0<br />
0<br />
0<br />
0<br />
0<br />
0<br />
0<br />
0<br />
0<br />
28789 12018 14532<br />
262901 91512 111212<br />
0<br />
0<br />
0<br />
25455 10331 12258<br />
51989 20136 22917<br />
0 5336 2465<br />
31413 11745 13749<br />
0<br />
0<br />
0<br />
0<br />
0<br />
0<br />
0<br />
0<br />
0<br />
21338 8602 22481<br />
0<br />
0<br />
0<br />
137868 55827 63067<br />
Table A4.7. Standardised peak area of lignin derived compounds for trials conducted in Experiment 1.5<br />
125
Retention<br />
Time<br />
15.177<br />
15.667<br />
18.246<br />
23.233<br />
25.600<br />
26.649<br />
28.065<br />
30.884<br />
31.534<br />
31.733<br />
32.476<br />
33.845<br />
34.622<br />
34.349<br />
36.567<br />
36.683<br />
37.434<br />
37.834<br />
38.250<br />
38.715<br />
39.283<br />
39.798<br />
39.967<br />
41.350<br />
42.148<br />
42.933<br />
43.758<br />
44.548<br />
45.440<br />
46.051<br />
46.626<br />
46.695<br />
47.087<br />
47.344<br />
47.551<br />
52.131<br />
Standardised Peak Area<br />
Trial 1.6.1 Trial 1.6.2 Trial 1.6.3 Trial 1.6.4A Trial 1.6.4B<br />
20449 32505 19066 18972 11274<br />
19376 27482 128116 119992 72996<br />
0<br />
0<br />
0<br />
0<br />
0<br />
0<br />
0<br />
0<br />
0<br />
0<br />
0<br />
0<br />
0<br />
0<br />
0<br />
0<br />
0 5433<br />
0<br />
0<br />
137871 117557 196430 204751 139541<br />
0<br />
0<br />
0<br />
0<br />
0<br />
92209 105316 93314 177362 157265<br />
95357 116815<br />
0<br />
0 79038<br />
0 7184<br />
0<br />
0<br />
0<br />
0<br />
0<br />
0<br />
0<br />
0<br />
0<br />
0<br />
0<br />
0<br />
0<br />
0<br />
0<br />
0<br />
0<br />
0<br />
45533 36601 16751 19174 7638<br />
0<br />
0<br />
0<br />
0<br />
0<br />
23265<br />
0<br />
0 25216 19235<br />
0<br />
0<br />
0<br />
0<br />
0<br />
0<br />
0<br />
0<br />
0<br />
0<br />
0<br />
0<br />
0<br />
0<br />
0<br />
0<br />
0<br />
0<br />
0<br />
0<br />
18925<br />
0 20147 37690 26315<br />
15889<br />
0<br />
0<br />
0<br />
0<br />
44893 33823<br />
0<br />
0 23179<br />
458979 333914 374644 373493 297614<br />
0<br />
0<br />
0<br />
0<br />
0<br />
47524 7406 48858 51712 33820<br />
94018 45280 88775 127943 96833<br />
45085 22612<br />
0<br />
0<br />
0<br />
48993 38953 70477 72171 58920<br />
0<br />
0<br />
0<br />
0<br />
0<br />
0<br />
0<br />
0<br />
0<br />
0<br />
6901<br />
0<br />
0<br />
0<br />
0<br />
36420 36004<br />
0<br />
0<br />
0<br />
0<br />
0<br />
0<br />
0<br />
0<br />
354758 183889 22420 20419 15233<br />
Table A4.8. Standardised peak area of lignin derived compounds for trials conducted in Experiment 1.6.<br />
126
127<br />
Standardised Peak Area<br />
Retention<br />
Time<br />
Trial<br />
2.1A.1A<br />
Trial<br />
2.1A.1B<br />
Trial<br />
2.1A.2<br />
Trial<br />
2.1A.3A<br />
Trial<br />
2.1A.3B<br />
Trial<br />
2.1A.4<br />
15.177<br />
15.667<br />
18.246<br />
23.233<br />
25.600<br />
26.649<br />
28.065<br />
30.884<br />
31.534<br />
31.733<br />
32.476<br />
33.845<br />
34.622<br />
34.349<br />
36.567<br />
36.683<br />
37.434<br />
37.834<br />
38.250<br />
38.715<br />
39.283<br />
39.798<br />
39.967<br />
41.350<br />
42.148<br />
42.933<br />
43.758<br />
44.548<br />
45.440<br />
46.051<br />
46.626<br />
46.695<br />
47.087<br />
47.344<br />
47.551<br />
52.131<br />
117559<br />
0<br />
0<br />
0<br />
0<br />
0<br />
2974931<br />
13100<br />
479997<br />
336273<br />
116467<br />
148719<br />
0<br />
0<br />
0<br />
0<br />
65976<br />
0<br />
0<br />
0<br />
0<br />
84392<br />
154596<br />
82844<br />
1937831<br />
28334<br />
358092<br />
606301<br />
155267<br />
225270<br />
160120<br />
39380<br />
205142<br />
101184<br />
167514<br />
801756<br />
130369<br />
0<br />
0<br />
0<br />
18198<br />
0<br />
3052686<br />
17997<br />
468592<br />
358194<br />
125140<br />
206825<br />
0<br />
0<br />
0<br />
44042<br />
67965<br />
0<br />
0<br />
0<br />
0<br />
0<br />
62343<br />
78562<br />
1951407<br />
0<br />
376827<br />
579991<br />
148945<br />
234586<br />
178602<br />
10395<br />
213568<br />
110690<br />
171102<br />
861761<br />
169874<br />
35137<br />
0<br />
0<br />
231974<br />
59634<br />
5121232<br />
138145<br />
1743915<br />
1331119<br />
284994<br />
487466<br />
680129<br />
0<br />
95189<br />
206820<br />
237818<br />
0<br />
0<br />
77537<br />
89208<br />
164342<br />
276618<br />
218358<br />
8092227<br />
0<br />
1700619<br />
2216964<br />
621620<br />
964087<br />
0<br />
271126<br />
709209<br />
537632<br />
191211<br />
3842110<br />
31241<br />
0<br />
0<br />
0<br />
33221<br />
0<br />
536282<br />
29792<br />
196731<br />
202952<br />
85065<br />
50532<br />
0<br />
0<br />
0<br />
0<br />
0<br />
0<br />
0<br />
0<br />
0<br />
0<br />
0<br />
100031<br />
911830<br />
0<br />
0<br />
171180<br />
0<br />
0<br />
0<br />
0<br />
0<br />
0<br />
0<br />
280333<br />
29011<br />
7894<br />
0<br />
0<br />
80757<br />
37658<br />
1245462<br />
15271<br />
224403<br />
251052<br />
119595<br />
103864<br />
96148<br />
0<br />
0<br />
262687<br />
69227<br />
0<br />
0<br />
10843<br />
30821<br />
158119<br />
106463<br />
609832<br />
1356376<br />
0<br />
346407<br />
293660<br />
169065<br />
168226<br />
0<br />
19847<br />
59488<br />
57747<br />
36772<br />
883423<br />
24007<br />
0<br />
0<br />
19521<br />
69487<br />
35045<br />
705578<br />
36250<br />
201150<br />
238145<br />
106446<br />
90534<br />
79133<br />
9568<br />
0<br />
209632<br />
61733<br />
0<br />
0<br />
9141<br />
29045<br />
126149<br />
94803<br />
486760<br />
1153869<br />
0<br />
291441<br />
266166<br />
150444<br />
133763<br />
0<br />
19130<br />
51548<br />
51336<br />
34397<br />
722198<br />
Table A4.9. Standardised peak area of lignin derived compounds for trials conducted in Experiment 2.1A.
Retention<br />
Time<br />
15.177<br />
15.667<br />
18.246<br />
23.233<br />
25.600<br />
26.649<br />
28.065<br />
30.884<br />
31.534<br />
31.733<br />
32.476<br />
33.845<br />
34.622<br />
34.349<br />
36.567<br />
36.683<br />
37.434<br />
37.834<br />
38.250<br />
38.715<br />
39.283<br />
39.798<br />
39.967<br />
41.350<br />
42.148<br />
42.933<br />
43.758<br />
44.548<br />
45.440<br />
46.051<br />
46.626<br />
46.695<br />
47.087<br />
47.344<br />
47.551<br />
52.131<br />
Standardised Peak Area<br />
Trial 2.1A.1A Trial 2.1A.1B Trial 2.1A.2A Trial 2.1A.2B Trial 2.1A.3<br />
117559 130369 82310 116822 18614<br />
0<br />
0 63459 83183 119589<br />
0<br />
0<br />
0<br />
0<br />
0<br />
0<br />
0<br />
0<br />
0<br />
0<br />
0 18198<br />
0<br />
0<br />
0<br />
0<br />
0<br />
0<br />
0<br />
0<br />
2974931 3052686 1415739 1840700 269640<br />
13100 17997<br />
0<br />
0<br />
0<br />
479997 468592 383954 481818 294446<br />
336273 358194 337646 451795 139786<br />
116467 125140 79228 108006<br />
0<br />
148719 206825 105186 155200<br />
0<br />
0<br />
0<br />
0<br />
0<br />
0<br />
0<br />
0<br />
0<br />
0<br />
0<br />
0<br />
0 5251<br />
0<br />
0<br />
0 44042<br />
0 24169<br />
0<br />
65976 67965 72098 47177 37715<br />
0<br />
0<br />
0<br />
0<br />
0<br />
0<br />
0<br />
0<br />
0<br />
0<br />
0<br />
0<br />
0<br />
0<br />
0<br />
0<br />
0<br />
0<br />
0<br />
0<br />
84392<br />
0 87638 122006 48897<br />
154596 62343 96698 136497<br />
0<br />
82844 78562 67901 97601 47978<br />
1937831 1951407 547036 774433 616028<br />
28334<br />
0<br />
0 21338<br />
0<br />
358092 376827 317176 465291 53256<br />
606301 579991 575977 826561 147799<br />
155267 148945 113704 68066<br />
0<br />
225270 234586 176714 279640 103084<br />
160120 178602 116863 180024<br />
0<br />
39380 10395<br />
0<br />
0<br />
0<br />
205142 213568 156643 188661<br />
0<br />
101184 110690<br />
0<br />
0<br />
0<br />
167514 171102 141737 166415 69249<br />
801756 861761 497433 694167 29213<br />
Table A2.10. Standardised peak area of lignin derived compounds for trials conducted in Experiment<br />
2.1A.<br />
128
129<br />
Standardised Peak Area<br />
Retention<br />
Time<br />
Trial<br />
2.1B.1A<br />
Trial<br />
2.1B.1B<br />
Trial<br />
2.1B.2<br />
Trial<br />
2.1B.3<br />
Trial<br />
2.1B.4A<br />
Trial<br />
2.1B.4B<br />
15.177<br />
15.667<br />
18.246<br />
23.233<br />
25.600<br />
26.649<br />
28.065<br />
30.884<br />
31.534<br />
31.733<br />
32.476<br />
33.845<br />
34.622<br />
34.349<br />
36.567<br />
36.683<br />
37.434<br />
37.834<br />
38.250<br />
38.715<br />
39.283<br />
39.798<br />
39.967<br />
41.350<br />
42.148<br />
42.933<br />
43.758<br />
44.548<br />
45.440<br />
46.051<br />
46.626<br />
46.695<br />
47.087<br />
47.344<br />
47.551<br />
52.131<br />
0<br />
0<br />
0<br />
0<br />
0<br />
0<br />
44815<br />
0<br />
0<br />
51854<br />
0<br />
0<br />
0<br />
0<br />
0<br />
0<br />
8070<br />
0<br />
0<br />
0<br />
0<br />
0<br />
0<br />
8349<br />
0<br />
0<br />
0<br />
22983<br />
0<br />
0<br />
0<br />
0<br />
0<br />
0<br />
0<br />
54538<br />
0<br />
0<br />
0<br />
0<br />
0<br />
19422<br />
35267<br />
0<br />
14111<br />
38347<br />
0<br />
0<br />
0<br />
0<br />
0<br />
0<br />
0<br />
0<br />
0<br />
0<br />
0<br />
0<br />
0<br />
0<br />
0<br />
0<br />
0<br />
16848<br />
0<br />
0<br />
0<br />
0<br />
0<br />
0<br />
10406<br />
42586<br />
0<br />
0<br />
0<br />
0<br />
0<br />
0<br />
38151<br />
0<br />
9565<br />
21702<br />
0<br />
0<br />
0<br />
0<br />
0<br />
0<br />
0<br />
0<br />
0<br />
0<br />
0<br />
0<br />
0<br />
0<br />
55857<br />
0<br />
9942<br />
21444<br />
0<br />
17286<br />
0<br />
0<br />
0<br />
0<br />
0<br />
75097<br />
0<br />
0<br />
0<br />
0<br />
0<br />
0<br />
152207<br />
11474<br />
40274<br />
84488<br />
0<br />
19586<br />
23393<br />
0<br />
0<br />
28923<br />
22134<br />
0<br />
0<br />
0<br />
10533<br />
17694<br />
15999<br />
70708<br />
257066<br />
0<br />
68579<br />
81845<br />
29888<br />
64572<br />
0<br />
0<br />
0<br />
8917<br />
0<br />
192117<br />
0<br />
0<br />
0<br />
0<br />
0<br />
0<br />
36253<br />
0<br />
0<br />
24700<br />
0<br />
0<br />
0<br />
0<br />
0<br />
14479<br />
0<br />
0<br />
0<br />
0<br />
0<br />
0<br />
0<br />
18470<br />
90113<br />
0<br />
0<br />
0<br />
0<br />
0<br />
0<br />
0<br />
0<br />
0<br />
0<br />
120586<br />
0<br />
0<br />
0<br />
0<br />
0<br />
0<br />
27054<br />
3872<br />
6133<br />
17021<br />
0<br />
0<br />
0<br />
0<br />
0<br />
12908<br />
0<br />
0<br />
0<br />
0<br />
0<br />
0<br />
0<br />
13754<br />
59662<br />
0<br />
0<br />
0<br />
0<br />
0<br />
0<br />
0<br />
0<br />
0<br />
0<br />
83800<br />
Table A4.11. Standardised peak area of lignin derived compounds for trials conducted in Experiment<br />
2.1B.
130<br />
Standardised Peak Area<br />
Retention<br />
Time<br />
Trial 2.1B.5A Trial 2.1B.5B Trial 2.1B.6<br />
15.177<br />
15.667<br />
18.246<br />
23.233<br />
25.600<br />
26.649<br />
28.065<br />
30.884<br />
31.534<br />
31.733<br />
32.476<br />
33.845<br />
34.622<br />
34.349<br />
36.567<br />
36.683<br />
37.434<br />
37.834<br />
38.250<br />
38.715<br />
39.283<br />
39.798<br />
39.967<br />
41.350<br />
42.148<br />
42.933<br />
43.758<br />
44.548<br />
45.440<br />
46.051<br />
46.626<br />
46.695<br />
47.087<br />
47.344<br />
47.551<br />
52.131<br />
0<br />
0<br />
0<br />
0<br />
0<br />
0<br />
32361<br />
0<br />
0<br />
14081<br />
0<br />
0<br />
0<br />
0<br />
0<br />
0<br />
0<br />
0<br />
0<br />
0<br />
0<br />
0<br />
0<br />
0<br />
75654<br />
0<br />
19237<br />
11273<br />
0<br />
0<br />
0<br />
0<br />
0<br />
0<br />
0<br />
80448<br />
0<br />
0<br />
0<br />
0<br />
0<br />
0<br />
32727<br />
0<br />
0<br />
20744<br />
0<br />
0<br />
0<br />
0<br />
0<br />
0<br />
4932<br />
0<br />
0<br />
0<br />
0<br />
0<br />
0<br />
0<br />
81036<br />
0<br />
20523<br />
12241<br />
0<br />
0<br />
0<br />
0<br />
0<br />
0<br />
0<br />
112476<br />
0<br />
0<br />
0<br />
0<br />
0<br />
0<br />
60544<br />
0<br />
0<br />
22577<br />
0<br />
0<br />
0<br />
0<br />
0<br />
0<br />
25210<br />
29657<br />
0<br />
0<br />
0<br />
0<br />
0<br />
0<br />
80248<br />
0<br />
0<br />
0<br />
0<br />
42046<br />
0<br />
33581<br />
83124<br />
0<br />
0<br />
31404<br />
Table A4.11. Continued
Appendix 5: Integration data for<br />
compounds derived from the pyrolysis of<br />
the hardwood hemicellulose<br />
Hemicellulose Derived Compound<br />
2,5-Dimethoxytetrahydrofuran<br />
3-Furfuraldehyde<br />
2-Furfuraldehyde<br />
2-Propylfural<br />
Furfuryl alcohol<br />
Beta-methoxyfurfuryl alcohol<br />
4-cyclopentene-1,3-dione<br />
2-Methyl-2-pentyl-oxirane<br />
3-Furancarboxylic acid, methyl ester<br />
5-Methyl-2-furaldehyde<br />
2,3-Dihydroxy-1-ene-4-one<br />
Furfural diethyl acetal<br />
2-Hydroxy-1-methyl-1-cyclopentene-3-one<br />
2-Furoic acid methyl ester<br />
1,4:3,6-Dianhydromannofuranose<br />
Furan derivative (Compound 82)<br />
1,4:3,6-Dianhydroglucopyranose<br />
5-Hydroxymethyl-2-furaldehyde<br />
Gamma-lactone derivative (Unknown compound 87)<br />
Unknown compound 90<br />
Anhydro-pento-furanose (Unknown compound 92)<br />
3-Hydroxy-2(5H)-furanone<br />
Unknown (Unknown compound 94)<br />
Levoglucosan<br />
Retention<br />
Time<br />
3.205<br />
3.268<br />
3.989<br />
4.600<br />
6.732<br />
7.010<br />
7.400<br />
8.987<br />
9.747<br />
9.932<br />
10.824<br />
12.214<br />
13.482<br />
14.765<br />
18.749<br />
20.149<br />
24.848<br />
27.984<br />
28.466<br />
31.397<br />
31.902<br />
32.214<br />
33.299<br />
40.630<br />
Table A5.1. Compounds detected from the pyrolysis of the hemicellulose component of hardwood and the<br />
corresponding retention time.<br />
131
Retention<br />
Time<br />
3.205<br />
3.268<br />
3.989<br />
4.600<br />
6.732<br />
7.010<br />
7.400<br />
8.987<br />
9.747<br />
9.932<br />
10.824<br />
12.214<br />
13.482<br />
14.765<br />
18.749<br />
20.149<br />
24.848<br />
27.984<br />
28.466<br />
31.397<br />
31.902<br />
32.214<br />
33.299<br />
40.630<br />
Standardised Peak Area<br />
Trial 1.1.1 Trial 1.1.2 Trial 1.1.3 Trial 1.1.4 Trial 1.1.5<br />
0<br />
0<br />
0<br />
0<br />
0<br />
3266<br />
0<br />
0 41057 1066<br />
310109 32647 13950 179498 21162<br />
0<br />
0<br />
0 1749<br />
0<br />
8485 687<br />
973 3148 1101<br />
390265 17437 29048 107372 12572<br />
4570<br />
0<br />
0<br />
0<br />
0<br />
5137<br />
0<br />
0<br />
0<br />
0<br />
1772<br />
0 4095<br />
0<br />
0<br />
41979<br />
0<br />
0 58079<br />
0<br />
5048<br />
0<br />
0<br />
0<br />
0<br />
0<br />
0<br />
0<br />
0<br />
0<br />
0<br />
0<br />
0<br />
0<br />
0<br />
0<br />
0<br />
0<br />
0<br />
0<br />
0<br />
0<br />
0<br />
0<br />
0<br />
0<br />
0<br />
0<br />
0<br />
0<br />
6298<br />
0 1487 2166<br />
0<br />
0<br />
0<br />
0<br />
278<br />
0<br />
26090 1045 4776 2481<br />
0<br />
0<br />
0<br />
0<br />
0<br />
0<br />
16563<br />
0 1437<br />
0<br />
0<br />
0<br />
0<br />
0<br />
0<br />
0<br />
0<br />
0<br />
0<br />
0<br />
0<br />
0<br />
0 12610 7193 2240<br />
Table A5.2. Standardised peak area of hemicellulose derived compounds for trials conducted in<br />
Experiment 1.1.<br />
132
Retention<br />
Time<br />
3.205<br />
3.268<br />
3.989<br />
4.600<br />
6.732<br />
7.010<br />
7.400<br />
8.987<br />
9.747<br />
9.932<br />
10.824<br />
12.214<br />
13.482<br />
14.765<br />
18.749<br />
20.149<br />
24.848<br />
27.984<br />
28.466<br />
31.397<br />
31.902<br />
32.214<br />
33.299<br />
40.630<br />
Standardised Peak Area<br />
Trial 1.2.1 Trial 1.2.2A Trial 1.2.2B<br />
0<br />
0<br />
0<br />
41057 52183 39093<br />
20070 267818 254291<br />
1749<br />
0 17257<br />
2335 36718 51731<br />
40370 171929 199236<br />
0<br />
0<br />
0<br />
0<br />
0<br />
0<br />
0<br />
0<br />
0<br />
58079 80180 72232<br />
0<br />
0<br />
0<br />
0<br />
0<br />
0<br />
0<br />
0<br />
0<br />
0<br />
0<br />
0<br />
0<br />
0<br />
0<br />
0<br />
0<br />
0<br />
2166<br />
0<br />
0<br />
278<br />
0 10294<br />
2481<br />
0<br />
0<br />
0<br />
0<br />
0<br />
0<br />
0<br />
0<br />
0<br />
0<br />
0<br />
0<br />
0<br />
0<br />
7193 12028 38202<br />
Table A5.3. Standardised peak area of hemicellulose derived compounds for trials conducted in<br />
Experiment 1.2<br />
133
Retention<br />
Time<br />
3.205<br />
3.268<br />
3.989<br />
4.600<br />
6.732<br />
7.010<br />
7.400<br />
8.987<br />
9.747<br />
9.932<br />
10.824<br />
12.214<br />
13.482<br />
14.765<br />
18.749<br />
20.149<br />
24.848<br />
27.984<br />
28.466<br />
31.397<br />
31.902<br />
32.214<br />
33.299<br />
40.630<br />
Standardised Peak Area<br />
Trial 1.3.1 Trial 1.3.2 Trial 1.3.3A Trial 1.3.3B<br />
6966 39467<br />
0<br />
0<br />
0<br />
0 19320<br />
19184<br />
78308 248021<br />
0<br />
53646<br />
0<br />
0<br />
0<br />
0<br />
0 240565 68684<br />
68125<br />
415623<br />
0<br />
0<br />
0<br />
0<br />
0<br />
0<br />
0<br />
0<br />
0<br />
0<br />
0<br />
0<br />
0<br />
0<br />
0<br />
0<br />
0<br />
0<br />
0<br />
0<br />
0<br />
0<br />
0<br />
0<br />
0<br />
0<br />
0<br />
0<br />
0<br />
0<br />
0<br />
0<br />
0<br />
0<br />
0<br />
28654 69631<br />
0<br />
15048<br />
0<br />
0<br />
0<br />
0<br />
33556 100309 33212<br />
15569<br />
0 28138 14643<br />
0<br />
53187 113098 115223<br />
97404<br />
0<br />
0<br />
0<br />
0<br />
0<br />
0<br />
0<br />
0<br />
11241 27704<br />
0<br />
34529<br />
0<br />
0<br />
0<br />
0<br />
1219869 2677294 2600686 3333824<br />
Table A5.4. Standardised peak area of hemicellulose derived compounds for trials conducted in<br />
Experiment 1.3.<br />
134
Retention<br />
Time<br />
3.205<br />
3.268<br />
3.989<br />
4.600<br />
6.732<br />
7.010<br />
7.400<br />
8.987<br />
9.747<br />
9.932<br />
10.824<br />
12.214<br />
13.482<br />
14.765<br />
18.749<br />
20.149<br />
24.848<br />
27.984<br />
28.466<br />
31.397<br />
31.902<br />
32.214<br />
33.299<br />
40.630<br />
Standardised Peak Area<br />
Trial 1.4A.1A Trial 1.4A.1B Trial 1.4A.2<br />
0<br />
0 6966<br />
0<br />
0<br />
0<br />
10920 14832 78308<br />
20815 31109<br />
0<br />
120218 362840<br />
0<br />
0<br />
0 415623<br />
0<br />
0<br />
0<br />
0<br />
0<br />
0<br />
0<br />
0<br />
0<br />
0<br />
0<br />
0<br />
0<br />
0<br />
0<br />
0<br />
0<br />
0<br />
0<br />
0<br />
0<br />
0<br />
0<br />
0<br />
0<br />
0 28654<br />
0<br />
0<br />
0<br />
27638 23677 33556<br />
0 37911<br />
0<br />
110433 88102 53187<br />
0<br />
0<br />
0<br />
27496 16968<br />
0<br />
0<br />
0 11241<br />
0<br />
0<br />
0<br />
0 126630 1219869<br />
Table A5.5. Standardised peak area of hemicellulose derived compounds for trials conducted in<br />
Experiment 1.4A.<br />
135
Retention<br />
Time<br />
3.205<br />
3.268<br />
3.989<br />
4.600<br />
6.732<br />
7.010<br />
7.400<br />
8.987<br />
9.747<br />
9.932<br />
10.824<br />
12.214<br />
13.482<br />
14.765<br />
18.749<br />
20.149<br />
24.848<br />
27.984<br />
28.466<br />
31.397<br />
31.902<br />
32.214<br />
33.299<br />
40.630<br />
Standardised Peak Area<br />
Trial 1.4B.1A Trial 1.4B.1A Trial 1.4B.2 Trial 1.4B.3<br />
12008<br />
6090 3003<br />
1258<br />
60399 29306 22469 15185<br />
222569 211851 90212 72957<br />
0<br />
0<br />
0<br />
0<br />
206176 114492 94105 44853<br />
353327 378664 114772 95087<br />
0<br />
0<br />
0<br />
0<br />
0<br />
0<br />
0<br />
0<br />
0<br />
0<br />
0<br />
0<br />
0<br />
0<br />
0<br />
0<br />
0<br />
0<br />
0<br />
0<br />
0<br />
0<br />
0<br />
0<br />
0<br />
0<br />
0<br />
0<br />
0<br />
0<br />
0<br />
0<br />
0<br />
0<br />
0<br />
0<br />
0<br />
0<br />
0<br />
0<br />
0<br />
0<br />
0<br />
0<br />
0<br />
6488<br />
0<br />
1119<br />
22821 24912 20652 17821<br />
0<br />
0<br />
0<br />
0<br />
0<br />
0<br />
0<br />
0<br />
0<br />
0<br />
0<br />
0<br />
0<br />
0<br />
0<br />
0<br />
16661 14094 46803 58175<br />
Table A5.6. Standardised peak area of hemicellulose derived compounds for trials conducted in<br />
Experiment 1.4B.<br />
136
Retention<br />
Time<br />
3.205<br />
3.268<br />
3.989<br />
4.600<br />
6.732<br />
7.010<br />
7.400<br />
8.987<br />
9.747<br />
9.932<br />
10.824<br />
12.214<br />
13.482<br />
14.765<br />
18.749<br />
20.149<br />
24.848<br />
27.984<br />
28.466<br />
31.397<br />
31.902<br />
32.214<br />
33.299<br />
40.630<br />
Standardised Peak Area<br />
Trial 1.5.1 Trial 1.5.2A Trial 1.5.2B<br />
3488 12008 6090<br />
21015 60399 29306<br />
62687 222569 211851<br />
0<br />
0<br />
0<br />
48673 206176 114492<br />
85479 353327 378664<br />
0<br />
0<br />
0<br />
0<br />
0<br />
0<br />
0<br />
0<br />
0<br />
0<br />
0<br />
0<br />
0<br />
0<br />
0<br />
0<br />
0<br />
0<br />
0<br />
0<br />
0<br />
0<br />
0<br />
0<br />
0<br />
0<br />
0<br />
0<br />
0<br />
0<br />
0<br />
0<br />
0<br />
0<br />
0 6488<br />
7343 22821 24912<br />
0<br />
0<br />
0<br />
0<br />
0<br />
0<br />
0<br />
0<br />
0<br />
0<br />
0<br />
0<br />
5443 16661 14094<br />
Table A5.7. Standardised peak area of hemicellulose derived compounds for trials conducted in<br />
Experiment 1.5.<br />
137
Retention<br />
Time<br />
3.205<br />
3.268<br />
3.989<br />
4.600<br />
6.732<br />
7.010<br />
7.400<br />
8.987<br />
9.747<br />
9.932<br />
10.824<br />
12.214<br />
13.482<br />
14.765<br />
18.749<br />
20.149<br />
24.848<br />
27.984<br />
28.466<br />
31.397<br />
31.902<br />
32.214<br />
33.299<br />
40.630<br />
Standardised Peak Area<br />
Trial 1.6.1 Trial 1.6.2 Trial 1.6.3 Trial 1.6.4A Trial 1.6.4B<br />
6623 6966 8837 25117<br />
0<br />
0<br />
0 47761 57984 8337<br />
203574 78308 130849 136871 17354<br />
0<br />
0 19704 36041 11202<br />
0<br />
0 29722 43026 8784<br />
741766 415623 178101<br />
0<br />
0<br />
0<br />
0<br />
0<br />
0<br />
0<br />
0<br />
0<br />
0<br />
0<br />
0<br />
0<br />
0<br />
0<br />
0<br />
0<br />
0<br />
0<br />
0<br />
0<br />
0<br />
0<br />
0<br />
0<br />
0<br />
0<br />
0<br />
0<br />
0<br />
0<br />
0<br />
0<br />
0<br />
0<br />
0<br />
0<br />
0<br />
0<br />
0<br />
0<br />
0<br />
0 28654 57482 72589<br />
0<br />
0<br />
0<br />
0<br />
0<br />
0<br />
0 33556 41502 48159<br />
0<br />
0<br />
0<br />
0<br />
0<br />
0<br />
44694 53187 106421 111798<br />
0<br />
0<br />
0<br />
0<br />
0<br />
0<br />
0<br />
0<br />
0 15029 18927<br />
0 11241 184306 236019 42185<br />
0<br />
0<br />
0 26678<br />
0<br />
320889 1219869 1600836 1818814 1203634<br />
Table A5.8. Standardised peak area of hemicellulose derived compounds for trials conducted in<br />
Experiment 1.6.<br />
138
Retention<br />
Time<br />
3.205<br />
3.268<br />
3.989<br />
4.600<br />
6.732<br />
7.010<br />
7.400<br />
8.987<br />
9.747<br />
9.932<br />
10.824<br />
12.214<br />
13.482<br />
14.765<br />
18.749<br />
20.149<br />
24.848<br />
27.984<br />
28.466<br />
31.397<br />
31.902<br />
32.214<br />
33.299<br />
40.630<br />
Standardised Peak Area<br />
Trial 2.1.1A Trial 2.1.1B Trial 2.1.2A Trial 2.1.2B Trial 2.1.3<br />
35983<br />
0 29294 11417 4655<br />
494025 428746 537796 675987 379135<br />
2779594 3369263 2872790 3776266 1247149<br />
0<br />
0 21699<br />
0<br />
0<br />
0 20586 11430 16007 13787<br />
5718942 5472644 5723280 6469383 1914773<br />
91726 25578 100279 128680<br />
0<br />
67570 10349 74619 110186<br />
0<br />
0<br />
0<br />
0<br />
0<br />
0<br />
528604 499805 430669 627161 209341<br />
52426<br />
0 43224 53676 24122<br />
0<br />
0<br />
0<br />
0<br />
0<br />
0<br />
0<br />
0<br />
0<br />
0<br />
0<br />
0<br />
0<br />
0<br />
0<br />
0<br />
0<br />
0<br />
0<br />
0<br />
0<br />
0<br />
0<br />
0<br />
0<br />
397286 411334 360615 527222 161974<br />
0<br />
0<br />
0<br />
0<br />
0<br />
554548 522164 642739 934452 892470<br />
0<br />
0<br />
0<br />
0<br />
0<br />
99887 122465 86863 90811 91662<br />
0<br />
0<br />
0 9839<br />
0<br />
0<br />
0<br />
0<br />
0<br />
0<br />
2480668 2427353 1172981 1176872 800956<br />
Table A5.9. Standardised peak area of hemicellulose derived compounds for trials conducted in<br />
Experiment 2.1.<br />
139
140<br />
Standardised Peak Area<br />
Retention<br />
Time<br />
Trial<br />
2.1A.1A<br />
Trial<br />
2.1A.1B<br />
Trial<br />
2.1A.2<br />
Trial<br />
2.1A.3A<br />
Trial<br />
2.1A.3B<br />
Trial<br />
2.1A.4<br />
3.205<br />
3.268<br />
3.989<br />
4.600<br />
6.732<br />
7.010<br />
7.400<br />
8.987<br />
9.747<br />
9.932<br />
10.824<br />
12.214<br />
13.482<br />
14.765<br />
18.749<br />
20.149<br />
24.848<br />
27.984<br />
28.466<br />
31.397<br />
31.902<br />
32.214<br />
33.299<br />
40.630<br />
35983<br />
494025<br />
2779594<br />
0<br />
0<br />
5718942<br />
91726<br />
67570<br />
0<br />
528604<br />
52426<br />
0<br />
0<br />
0<br />
0<br />
0<br />
397286<br />
0<br />
554548<br />
0<br />
99887<br />
0<br />
0<br />
2480668<br />
0<br />
428746<br />
3369263<br />
0<br />
20586<br />
5472644<br />
25578<br />
10349<br />
0<br />
499805<br />
0<br />
0<br />
0<br />
0<br />
0<br />
0<br />
411334<br />
0<br />
522164<br />
0<br />
122465<br />
0<br />
0<br />
2427353<br />
50808<br />
75150<br />
2722335<br />
41918<br />
73344<br />
4522084<br />
76805<br />
0<br />
0<br />
589134<br />
142264<br />
70298<br />
216164<br />
0<br />
42582<br />
0<br />
730630<br />
0<br />
237950<br />
0<br />
276368<br />
0<br />
0<br />
4254189<br />
0<br />
0<br />
326786<br />
0<br />
0<br />
543752<br />
0<br />
0<br />
0<br />
0<br />
0<br />
0<br />
0<br />
0<br />
0<br />
0<br />
115332<br />
0<br />
204613<br />
0<br />
148353<br />
0<br />
0<br />
2923370<br />
0<br />
0<br />
414303<br />
0<br />
0<br />
510299<br />
0<br />
0<br />
0<br />
0<br />
0<br />
0<br />
0<br />
0<br />
0<br />
0<br />
147858<br />
0<br />
183112<br />
0<br />
194184<br />
0<br />
0<br />
2781658<br />
0<br />
0<br />
248309<br />
0<br />
0<br />
321611<br />
0<br />
0<br />
0<br />
15816<br />
0<br />
0<br />
0<br />
0<br />
0<br />
0<br />
109542<br />
273390<br />
422738<br />
0<br />
212271<br />
21070<br />
12792<br />
4882786<br />
Table A5.10. Standardised peak area of hemicellulose derived compounds for trials conducted in<br />
Experiment 2.1A.
141<br />
Standardised Peak Area<br />
Retention<br />
Time<br />
Trial<br />
2.1B.1A<br />
Trial<br />
2.1B.1B<br />
Trial<br />
2.1B.2<br />
Trial<br />
2.1B.3<br />
Trial<br />
2.1B.4A<br />
Trial<br />
2.1B.4B<br />
3.205<br />
3.268<br />
3.989<br />
4.600<br />
6.732<br />
7.010<br />
7.400<br />
8.987<br />
9.747<br />
9.932<br />
10.824<br />
12.214<br />
13.482<br />
14.765<br />
18.749<br />
20.149<br />
24.848<br />
27.984<br />
28.466<br />
31.397<br />
31.902<br />
32.214<br />
33.299<br />
40.630<br />
0<br />
0<br />
64333<br />
0<br />
19625<br />
423663<br />
0<br />
0<br />
74305<br />
20160<br />
0<br />
0<br />
0<br />
0<br />
0<br />
0<br />
0<br />
0<br />
9589<br />
0<br />
0<br />
0<br />
0<br />
42543<br />
0<br />
0<br />
61573<br />
0<br />
30318<br />
362033<br />
0<br />
0<br />
49679<br />
31465<br />
0<br />
0<br />
0<br />
0<br />
0<br />
0<br />
0<br />
0<br />
19406<br />
0<br />
0<br />
0<br />
0<br />
74262<br />
0<br />
0<br />
79675<br />
0<br />
0<br />
216155<br />
0<br />
0<br />
52155<br />
0<br />
0<br />
0<br />
0<br />
0<br />
0<br />
0<br />
0<br />
0<br />
18198<br />
0<br />
0<br />
0<br />
0<br />
0<br />
0<br />
0<br />
49777<br />
0<br />
0<br />
353531<br />
0<br />
0<br />
116206<br />
0<br />
0<br />
0<br />
0<br />
0<br />
0<br />
0<br />
43325<br />
14918<br />
97735<br />
0<br />
17682<br />
0<br />
0<br />
222131<br />
0<br />
0<br />
59835<br />
0<br />
0<br />
189443<br />
0<br />
0<br />
63334<br />
0<br />
0<br />
0<br />
0<br />
0<br />
0<br />
0<br />
0<br />
0<br />
20341<br />
0<br />
0<br />
0<br />
0<br />
0<br />
0<br />
0<br />
55145<br />
0<br />
0<br />
159490<br />
0<br />
0<br />
37827<br />
0<br />
0<br />
0<br />
0<br />
0<br />
0<br />
0<br />
8514<br />
13480<br />
29328<br />
0<br />
0<br />
0<br />
0<br />
0<br />
Table A5.11. Standardised peak area of hemicellulose derived compounds for trials conducted in<br />
Experiment 2.1B.
142<br />
Standardised Peak Area<br />
Retention<br />
Time<br />
Trial 2.1B.5A Trial 2.1B.5B Trial 2.1B.6<br />
3.205<br />
3.268<br />
3.989<br />
4.600<br />
6.732<br />
7.010<br />
7.400<br />
8.987<br />
9.747<br />
9.932<br />
10.824<br />
12.214<br />
13.482<br />
14.765<br />
18.749<br />
20.149<br />
24.848<br />
27.984<br />
28.466<br />
31.397<br />
31.902<br />
32.214<br />
33.299<br />
40.630<br />
0<br />
0<br />
0<br />
0<br />
6756<br />
107200<br />
0<br />
0<br />
16731<br />
0<br />
0<br />
0<br />
0<br />
0<br />
0<br />
0<br />
0<br />
0<br />
17482<br />
0<br />
0<br />
0<br />
0<br />
46722<br />
0<br />
0<br />
14954<br />
7542<br />
11704<br />
90370<br />
0<br />
0<br />
8743<br />
0<br />
0<br />
0<br />
0<br />
0<br />
0<br />
0<br />
0<br />
0<br />
9281<br />
0<br />
0<br />
0<br />
0<br />
61061<br />
0<br />
0<br />
0<br />
0<br />
0<br />
112700<br />
0<br />
0<br />
0<br />
0<br />
0<br />
0<br />
0<br />
0<br />
0<br />
0<br />
0<br />
0<br />
91426<br />
0<br />
0<br />
0<br />
0<br />
0<br />
Table A5.11. Continued.
Appendix 6: Quantification data for<br />
Eucalyptus oil components for experiment<br />
1<br />
Sample<br />
Steam Extract 1<br />
Ethanol Extract 1<br />
Peak Area<br />
Xylene IS<br />
392.0<br />
336.0<br />
Peak<br />
Area<br />
Pinene<br />
111.2<br />
9.7<br />
Peak<br />
Area<br />
Cineole<br />
296.0<br />
26.1<br />
Mass of<br />
Leaves<br />
(g)<br />
879.0<br />
6.05<br />
Yield<br />
Pinene<br />
(%m/m)<br />
0.118<br />
0.217<br />
Yield<br />
Cineole<br />
(%m/m)<br />
0.420<br />
0.784<br />
Steam Extract 2<br />
Ethanol Extract 2<br />
409.0<br />
228.0<br />
147.0<br />
9.6<br />
598.0<br />
32.1<br />
819.7<br />
6.42<br />
0.160<br />
0.300<br />
0.872<br />
1.340<br />
Steam Extract 3<br />
Ethanol Extract 3<br />
392.0<br />
229.0<br />
110.0<br />
21.0<br />
428.0<br />
49.5<br />
721.7<br />
12.40<br />
0.142<br />
0.337<br />
0.739<br />
1.065<br />
Table A6.1. Quantification data for Trials of Experiment 1: Steam distillation using Dean Stark<br />
Apparatus.<br />
Sample<br />
Steam Extract 1<br />
Ethanol Extract 1<br />
Peak Area<br />
Xylene IS<br />
318.8<br />
271.0<br />
Peak<br />
Area<br />
Pinene<br />
77.0<br />
13.1<br />
Peak<br />
Area<br />
Cineole<br />
319.0<br />
42.1<br />
Mass of<br />
Leaves<br />
(g)<br />
832.6<br />
6.43<br />
Yield<br />
Pinene<br />
(%m/m)<br />
0.106<br />
0.343<br />
Yield<br />
Cineole<br />
(%m/m)<br />
0.587<br />
1.476<br />
Steam Extract 2<br />
Ethanol Extract 2<br />
395.0<br />
238.0<br />
61.7<br />
10.4<br />
290.0<br />
31.3<br />
387.9<br />
6.11<br />
0.147<br />
0.326<br />
0.925<br />
1.315<br />
Steam Extract 3<br />
Ethanol Extract 3<br />
388.0<br />
244.0<br />
82.5<br />
17.7<br />
295.0<br />
42.3<br />
634.6<br />
13.00<br />
0.122<br />
0.254<br />
0.585<br />
0.815<br />
Table A6.2. Quantification data for Trials of Experiment 1: Simple distillation (condensed water not<br />
recycled).<br />
Sample<br />
Steam Extract 1<br />
Ethanol Extract 1<br />
Peak Area<br />
Xylene IS<br />
346.0<br />
248.0<br />
Peak<br />
Area<br />
Pinene<br />
108.0<br />
16.8<br />
Peak<br />
Area<br />
Cineole<br />
551.0<br />
47.2<br />
Mass of<br />
Leaves<br />
(g)<br />
934.4<br />
13.81<br />
Yield<br />
Pinene<br />
(%m/m)<br />
0.122<br />
0.224<br />
Yield<br />
Cineole<br />
(%m/m)<br />
0.833<br />
0.842<br />
Steam Extract 2<br />
Ethanol Extract 2<br />
335.0<br />
214.9<br />
137.0<br />
10.2<br />
771.0<br />
37.5<br />
910.1<br />
6.09<br />
0.164<br />
0.355<br />
1.236<br />
1.750<br />
Steam Extract 3<br />
Ethanol Extract 3<br />
359.0<br />
217.1<br />
109.0<br />
6.7<br />
745.0<br />
27.9<br />
980.6<br />
4.94<br />
0.113<br />
0.283<br />
1.034<br />
1.589<br />
Steam Extract 4<br />
Ethanol Extract 4<br />
464.7<br />
247.0<br />
82.5<br />
9.5<br />
498.0<br />
21.7<br />
911.7<br />
4.15<br />
0.071<br />
0.422<br />
0.574<br />
1.293<br />
Table A6.3. Quantification data for Trials of Experiment 1: Pentane in separating funnel, condensed<br />
water recycled.<br />
143
Sample<br />
Steam Extract 1<br />
Ethanol Extract 1<br />
Peak Area<br />
Xylene IS<br />
309.5<br />
215.4<br />
Peak<br />
Area<br />
Pinene<br />
161.0<br />
14.0<br />
Peak<br />
Area<br />
Cineole<br />
633.0<br />
46.9<br />
Mass of<br />
Leaves<br />
(g)<br />
923.0<br />
11.75<br />
Yield<br />
Pinene<br />
(%m/m)<br />
0.205<br />
0.252<br />
Yield<br />
Cineole<br />
(%m/m)<br />
1.083<br />
1.132<br />
Steam Extract 2<br />
Ethanol Extract 2<br />
495.0<br />
215.5<br />
273.0<br />
8.5<br />
1708.0<br />
32.5<br />
892.5<br />
4.4<br />
0.225<br />
0.409<br />
1.889<br />
2.094<br />
Steam Extract 3<br />
Ethanol Extract 3<br />
407.0<br />
212.0<br />
118.0<br />
6.6<br />
561.0<br />
19.1<br />
901.9<br />
4.38<br />
0.117<br />
0.322<br />
0.747<br />
1.256<br />
Steam Extract 4<br />
Ethanol Extract 4<br />
347.0<br />
311.4<br />
122.0<br />
15.4<br />
732.0<br />
38.6<br />
909.2<br />
4.28<br />
Table A6.4. Quantification data for Trials of Experiment 1: Likers-Nickerson<br />
0.141<br />
0.527<br />
1.134<br />
1.769<br />
144
Appendix 7: Quantification data for<br />
Eucalyptus oil components for experiment<br />
2<br />
Sample<br />
Steam Extract 1<br />
Ethanol Extract 1<br />
Peak Area<br />
Xylene IS<br />
242.0<br />
253.0<br />
Peak<br />
Area<br />
Pinene<br />
29.2<br />
21.2<br />
Peak<br />
Area<br />
Cineole<br />
284.0<br />
45.8<br />
Mass of<br />
Leaves<br />
(g)<br />
832.1<br />
14.17<br />
Yield<br />
Pinene<br />
(%m/m)<br />
0.053<br />
0.269<br />
Yield<br />
Cineole<br />
(%m/m)<br />
0.689<br />
0.780<br />
Steam Extract 2<br />
Ethanol Extract 2<br />
243.0<br />
303.8<br />
101.0<br />
26.0<br />
312.0<br />
39.9<br />
1003.4<br />
12.44<br />
0.151<br />
0.313<br />
0.625<br />
0.645<br />
Steam Extract 3<br />
Ethanol Extract 3<br />
247.0<br />
322.1<br />
93.9<br />
0.0<br />
288.0<br />
44.9<br />
1000.1<br />
16.43<br />
0.139<br />
0.000<br />
0.570<br />
0.518<br />
Steam Extract 4<br />
Ethanol Extract 4<br />
268.0<br />
264.0<br />
60.7<br />
15.0<br />
242.0<br />
15.8<br />
1022.8<br />
6.24<br />
0.081<br />
0.415<br />
0.431<br />
0.586<br />
Table A7.1. Quantification data for Trials of Experiment 2: Simple steam distillation (condensed water<br />
not recycled).<br />
Sample<br />
Steam Extract 1<br />
Ethanol Extract 1<br />
Peak Area<br />
Xylene IS<br />
314.9<br />
264.9<br />
Peak<br />
Area<br />
Pinene<br />
129.6<br />
15.1<br />
Peak<br />
Area<br />
Cineole<br />
409.0<br />
41.3<br />
Mass of<br />
Leaves<br />
(g)<br />
1009.3<br />
12.79<br />
Yield<br />
Pinene<br />
(%m/m)<br />
0.149<br />
0.203<br />
Yield<br />
Cineole<br />
(%m/m)<br />
0.629<br />
0.745<br />
Steam Extract 2<br />
Ethanol Extract 2<br />
313.7<br />
284.8<br />
111.0<br />
13.9<br />
406.2<br />
45.9<br />
1000.6<br />
13.13<br />
0.129<br />
0.170<br />
0.632<br />
0.750<br />
Steam Extract 3<br />
Ethanol Extract 3<br />
347.0<br />
298.0<br />
117.0<br />
12.6<br />
713.0<br />
30.9<br />
873.6<br />
2.93<br />
0.141<br />
0.658<br />
1.149<br />
2.162<br />
Steam Extract 4<br />
Ethanol Extract 4<br />
217.0<br />
258.3<br />
49.3<br />
9.1<br />
452.0<br />
26.1<br />
726.1<br />
4.27<br />
0.114<br />
0.376<br />
1.402<br />
1.445<br />
Table A7.2. Quantification data for Trials of Experiment 2: Simple steam distillation (condensed water<br />
not recycled), oil collected in pentane.<br />
145
Sample<br />
Steam Extract 1<br />
Ethanol Extract 1<br />
Peak Area<br />
Xylene IS<br />
256.0<br />
226.9<br />
Peak<br />
Area<br />
Pinene<br />
17.1<br />
1.0<br />
Peak<br />
Area<br />
Cineole<br />
167.9<br />
11.4<br />
Mass of<br />
Leaves<br />
(g)<br />
982.2<br />
6.58<br />
Yield<br />
Pinene<br />
(%m/m)<br />
0.025<br />
0.031<br />
Yield<br />
Cineole<br />
(%m/m)<br />
0.326<br />
0.466<br />
Steam Extract 2<br />
Ethanol Extract 2<br />
261.0<br />
257.0<br />
10.0<br />
1.1<br />
122.0<br />
19.1<br />
644.6<br />
6.30<br />
0.022<br />
0.031<br />
0.354<br />
0.721<br />
Steam Extract 3<br />
Ethanol Extract 3<br />
244.0<br />
255.0<br />
19.8<br />
2.1<br />
200.0<br />
15.3<br />
933.1<br />
5.52<br />
0.032<br />
0.066<br />
0.429<br />
0.664<br />
Steam Extract 4<br />
Ethanol Extract 4<br />
266.0<br />
255.6<br />
15.5<br />
2.5<br />
189.0<br />
16.0<br />
1012.0<br />
5.64<br />
0.021<br />
0.079<br />
0.343<br />
0.678<br />
Table A7.3. Quantification data for Trials of Experiment 2: Simple steam distillation (condensed water<br />
recycled).<br />
Sample<br />
Steam Extract 1<br />
Ethanol Extract 1<br />
Peak Area<br />
Xylene IS<br />
268.0<br />
237.0<br />
Peak<br />
Area<br />
Pinene<br />
37.1<br />
9.1<br />
Peak<br />
Area<br />
Cineole<br />
533.0<br />
42.7<br />
Mass of<br />
Leaves<br />
(g)<br />
914.1<br />
11.78<br />
Yield<br />
Pinene<br />
(%m/m)<br />
0.055<br />
0.149<br />
Yield<br />
Cineole<br />
(%m/m)<br />
1.063<br />
0.934<br />
Steam Extract 2<br />
Ethanol Extract 2<br />
333.0<br />
243.3<br />
45.1<br />
2.9<br />
415.0<br />
17.2<br />
927.5<br />
3.93<br />
0.053<br />
0.139<br />
0.657<br />
1.099<br />
Steam Extract 3<br />
Ethanol Extract 3<br />
313.0<br />
226.0<br />
51.7<br />
6.6<br />
461.0<br />
27.7<br />
857.2<br />
6.77<br />
0.070<br />
0.197<br />
0.840<br />
1.106<br />
Steam Extract 4<br />
Ethanol Extract 4<br />
325.0<br />
224.0<br />
68.1<br />
6.8<br />
685.0<br />
29.6<br />
903.1<br />
7.55<br />
0.085<br />
0.183<br />
1.140<br />
1.069<br />
Table A7.4. Quantification data for Trials of Experiment 2: Simple steam distillation (condensed water<br />
recycled), oil collected in pentane.<br />
146
References<br />
1. Pakdel, H., C. Amen-Chen and C. Roy. 1997. Phenolic Compounds from Vacuum Pyrolysis of<br />
Wood Wastes. The Canadian Journal of Chemical Engineering 75:121-126.<br />
2. Enkvist, J. 1975. Phenolics and Other Organic Chemicals from Kraft Black Liquors by<br />
Disproportionation and Cracking Reactions. Applied Polymer Symposium. 28:285-295.<br />
3. Iatridis, B. and G.R. Gavalos. 1979. Pyrolysis of a Precipitated Kraft Lignin. Industrial and<br />
Engineering Chemistry Product Research and Development. 18:127-130.<br />
4. Jegers, H.E. and M.T.Klein. 1985. Primary and Secondary Lignin Pyrolysis Reaction Pathways.<br />
Industrial Engineering Chemical Processing. Design and Development 24(1):173-183.<br />
5. Churin, E., R. Maggi, P. Grange and B. Delmon. 1988. Characterisation and Upgrading of a Bio-<br />
Oil Produced by Pyrolysis of Biomass. In Research in Thermochemical Biomass Conversion. Eds.<br />
A.V. Bridgewater and J.L. Kuester. Elsevier Applied Science. P:896-909.<br />
6. Conner, M.A. and C.M. Salazar. 1988. Factors Influencing the Decomposition in Wood Particles<br />
During Low Temperature Pyrolysis. In Research in Thermochemical Biomass Conversion. Eds.<br />
A.V. Bridgewater and J.L. Kuester. Elsevier Applied Science. P:104-117.<br />
7. Maniatis, K. and A. Beukens. 1988. Fast Pyrolysis of Biomass. In Research in Thermochemical<br />
Biomass Conversion. Eds. A.V. Bridgewater and J.L. Kuester. Elsevier Applied Science. P:179-<br />
191.<br />
8. Mühlen, H.-J., W. Wanzl and K.H. van Heek. 1989. Characterisation of Carbon Containing<br />
Materials with Respect to Pyrolysis and Gasification. In Pyrolysis and Gasification. Eds. G.L.<br />
Ferrero, K. Maniatis, A. Beukens and A.V. Bridgewater. Elsevier Applied Science. P:72-84.<br />
9. Shafizadeh, F. and P.S. Chin. 1977. Thermal Deterioration of Wood. In Wood Technology:<br />
Chemical Aspects. Ed I.S. Goldstein. American Chemical Society, Washington DC. CH 5:57-81.<br />
10. Elliott, D.C. 1989. Upgrading Liquid Products: Notes from the Workshop at the International<br />
Conference Research in Thermochemical Biomass Conversion. In Pyrolysis and Gasification. Eds.<br />
G.L. Ferrero, K. Maniatis, A. Beukens and A.V. Bridgewater. Elsevier Applied Science. P:1170-<br />
1175.<br />
11. Ramiah, M.V., and D.A.I. Goring. 1967. Some Dilatometric Measurements of the Thermal<br />
Decomposition of Cellulose, Hemicellulose and Lignin. Journal of Cellulose Chemistry and<br />
Technology. 1(3): 277-285.<br />
12. Roberts, A.F. 1972. A Review of Kinetics Data for the Pyrolysis of Wood and Related Substances.<br />
Combustion and Flame. 14:261-272<br />
13. Young, R.A. and J.L. Davis. 1985. Thermochemical Fractionation and Liquefaction of Wood. In<br />
Fundamentals of Thermochemical Biomass Conversion. Eds R.P. Overend, T.A. Milne and L.K.<br />
Mudge. Elsevier Applied Science CH 7:121-141.<br />
14. Domburg, G., G. Rossinskaya and V. Sergeeva. 1974. Study of Thermal Stability of β-ether Bonds<br />
in Lignin and its Models. Thermal Analysis. Proceedings of the 4th International Conference,<br />
Budapest 2, 211-220.<br />
147
15. Klein, M.T. and P. Virk. 1981. Model Pathways in Lignin Thermolysis. Energy Laboratory Report<br />
No. MIT-EL 81-005, Massachusetts Institute of Technology, Cambridge, MA.<br />
16. Lin, L., Y. Yao, M. Yoshioka and N. Shiraishi. 1997. Liquefaction Mechanism of Lignin in the<br />
Presence of Phenol at Elevated Temperature without catalysts. Studies on β-O-4 Lignin Model<br />
Compound. I. Structural Characterisation of the Reaction Products. Holzforschung. 51(4):316-324.<br />
17. Brežný, R.I. Surina and M. kosik. 1984. Low Temperature Thermolysis of Lignins. II.<br />
Thermofractography and Thermal Analysis of β-O-4 Model Compounds. Holzforschung 38(1):19-<br />
24.<br />
18. Sandermann, W. and H. Augustin. 1963. Chemical Investigations on the Thermal Decomposition<br />
of Wood. Part I: Stand of Research. Holz als Roh- und Werkstoff. 22:256-265.<br />
19. Antal, M.J. Jr. 1982. Biomass Pyrolysis: A Review of the Literature, Part 2-Lignocellulose<br />
Pyrolysis. In Advances in Solar Energy. CH 4:175-255.<br />
20. Tang, W.K. 1967. Effect of Inorganic Salts on Pyrolysis of Wood, Alphacellulose and Lignin<br />
Determined by Dynamic Thermogravimetry. US Forest Service Research Paper FPL 71, 16p.<br />
21. Beall, F.C. 1969. Thermogravimetric Analysis of Wood Lignin and<br />
Hemicelluloses. Wood and Fibre Science 1(3):215-226.<br />
22. Connor, M.A. 1983. Heat and Mass Transfer Considerations in Fuel Production from Wood<br />
Wastes by Pyrolysis. Reg. Journal of Energy Heat and Mass Transfer. 5(3):179-194<br />
23. Sundaram, M.S., M. Steinberg, P.T. Fallon. 1985. Flash Pyrolysis of Biomass with Reactive and<br />
Non-Reactive Gases. In Fundamental of Thermochemical Biomass Conversion. Eds R.P. Overend,<br />
T.A.Milne and L.K. Mudge. Elsevier Applied Science. CH 10:167-182.<br />
24. Vasalos, I.A., M.C. Somolada and G.E. Achladas. 1988. Biomass Pyrolysis for Maximising<br />
Phenolic Liquids. In Research in Thermochemical Biomass Conversion. Eds. A.V. Bridgewater<br />
and J.L. Kuester. Elsevier Applied Science. P:251-263.<br />
25. Bridge, S.A. and A.V. Bridgewater. 1989. Flash Pyrolysis of Biomass for Liquid Fuels. In<br />
Pyrolysis and Gasification. Eds. G.L. Ferrero, K. Maniatis, A. Beukens and A.V. Bridgewater.<br />
Elsevier Applied Science. P:541-546.<br />
26. Font, R., A. Marcilla, E. Verdú and J. Devesa. 1989. Chemicals from Almond Shells by Pyrolysis<br />
in Fluidised Bed. In Pyrolysis and Gasification. Eds. G.L. Ferrero, K. Maniatis, A. Beukens and<br />
A.V. Bridgewater. Elsevier Applied Science. P:230-237.<br />
27. Chum, H., J. Diebold, J. Scahill, D. Johnson and S. Black. 1989. Biomass Pyrolysis Oil Feedstocks<br />
for Phenolic Adhesives. In Adhesives from Renewable Resources. American Chemical Society<br />
Symposium Series 385. Eds. R.W. Hemingway, A.H. Conner, S.J. Branham. CH 11:135-151.<br />
28. Diebold, J. and A. Power. 1988. Engineering Aspects of the Vortex Pyrolysis Reactor to Produce<br />
Primary Pyrolysis Oil Vapours for Use in Resins and Adhesives. In Research in Thermochemical<br />
Biomass Conversion. Eds. A.V. Bridgewater and J.L. Kuester. Elsevier Applied Science.<br />
29. Ledé, J., J. Panagopoulos, Z.H. Li and L. Villermaux. 1985. Fast Pyrolysis of Wood: Direct<br />
Measurement and Study of Ablation Rate. Fuel. 64:1514-1520.<br />
148
30. Nunn, T.R., J.B. Howard, J.P. Longwell and W.A. Peters. 1985. Studies of the Rapid Pyrolysis of<br />
Sweet Gum Hardwood. In Fundamentals of Thermochemical Biomass Conversion. Eds. R.P.<br />
Overend, T.A. Milne and L.K.Mudge. Elsevier Applied Science Publishers, New York.<br />
CH16:293-314<br />
31. Piskorz, J., P. Majerski, D. Radlein and D.S. Scott. 1989. Conversion of Lignins to Hydrocarbon<br />
Fuels. Journal of Energy and Fuels. 3:723-726.<br />
32. Wasselle, L.A. 1982. Chemicals from Wood Wastes and Pulping Residues. In SRI International,<br />
Report No. 147.<br />
33. Desbene, P.-L, M. Essayegh, B. Desmazieres and J.-J. Basselier. 1991. Contribution to the<br />
Analytical Study of Biomass Pyrolysis Oils. In Biomass Pyrolysis Liquids Upgrading and<br />
Utilisation. Eds. A.V. Bridgewater and G. Grassi. Elsevier Applied Science. CH6:155-175.<br />
34. Domburg, G.E and V.N. Sergeeva. 1977. Interaction of Wood Components during Thermal<br />
Treatment. Journal of Thermal Analysis. 59:304-307.<br />
35. Roy, C., R. Lemieux, B. de Caumia and D. Blanchette. 1988. Processing of Wood Chips in<br />
Semicontinuous Multiple-Hearth Vacuum-Pyrolysis Reactor. In Pyrolysis Oils from Biomass-<br />
Processing, Analysing and Upgrading. Eds. J. Soltes, T.A. Milne. American Chemical Society<br />
Symposium Series 376, Washington DC P:16-30.<br />
36. Afifi, A.I., J.P. Hindermann, E. Chornet and R.P. Overend. 1989. The Cleavage of the Aryl-O-CH 3<br />
Bond Using Anisole as a Model Compound. Fuel. 68:498-504.<br />
37. Agblevor, F.A. and S.Besler. 1996. Inorganic Compounds in Biomass Feedstocks. 1. Effect on the<br />
Quality of Fast Pyrolysis Oils. Energy and Fuels. 10:293-298.<br />
38. Knight, J.A. and C.W.Gorton. 1984. Oil Production by Entrained Flow Pyrolysis of Biomass.<br />
Engineering Exp. Station, Georgia Institute of Technology, Atlanta, Georgia 30332 USA In<br />
Bioenergy 84 Biomass conversion. Eds. H.Egneus and A.Ellegard. Department of Plant<br />
Physiology, University of Gotenborg, Sweden. Elsevier Applied Science Publishers, London.<br />
39. Beckman, D. and D.C. Elliot. 1985. Comparisons of the Yields and Properties of the Oil Products<br />
from Direct Thermochemical Biomass Liquefaction Processes. The Canadian Journal of Chemical<br />
Engineering. 63:99-104.<br />
40. Kirshbaum, I.Z., G.E. Domburg, V.N. Sergeeva. 1976. Khimiya Drevesiny. 4:96<br />
41. Capart, R., A. Elamin, S. Ammar and M. Gelus. 1989. A Survey of Biomass Liquefaction<br />
Processes. In Pyrolysis and Gasification. Eds. G.L. Ferrero, K. Maniatis, A. Beukens and A.V.<br />
Bridgewater. Elsevier Applied Science. P:158-168.<br />
42. Krieger-Brockett, B. and D.S. Glaister. 1988. Wood Devolatilisation-Sensitivity to Feed Properties<br />
and Process Variables. In Research in Thermochemical Biomass Conversion. Eds. A.V.<br />
Bridgewater and J.L. Kuester. Elsevier Applied Science. P:127-141.<br />
43. Shafizadeh, F. 1982. Chemistry of Pyrolysis and Combustion of Wood. In Progress in Biomass<br />
Conversion. Eds. K.V. Sarkanen and D.A. Tillman. Academic press, New York. P:51-75.<br />
44. Stein, S.E. 1981 New Approaches in Coal Chemistry. In American Chemical Society Symposium<br />
Series. Eds: B.D. Blaustein, B.C. Bockrath, and S. Friedman.169:97<br />
149
45. Vuori, A. 1986. Pyrolysis Studies of some Simple Coal Related Aromatic Methyl Ethers. Fuel<br />
65:1575-1583.<br />
46. Anvi, E., F. Davoudzadeh, and R.W. Coughlin. 1985. Flash Pyrolysis of Lignin. In Fundamentals<br />
of Thermochemical Biomass Conversion. Eds. R.P. Overend, T.A. Milne and L.K. Mudge.<br />
Elsevier Applied Science Publishers, London CH 18:329-343.<br />
47. Hallen, R.T., L.J.Sealock, Jr. and R. Cuello. 1985. Influence of Alkali Carbonates on Biomass<br />
Volatilisation. In Fundamentals of Thermochemical Biomass Conversion. Eds R.P. Overend, T.A.<br />
Milne, L.K. Mudge. Elsevier Applied Science CH 9:157-166.<br />
48. Franklin, J.C. and J.L. Kuester. 1988. Pyrolysis/Gas Chromatography: Application in the Study of<br />
Biomass Pyrolysis. In Research in Thermochemical Biomass Conversion. Eds. A.V. Bridgewater<br />
and J.L. Kuester. Elsevier Applied Science. P:215-220.<br />
49. Ramiah, M.V. 1970. Thermogravimetric and Differential Thermal Analysis of Cellulose,<br />
Hemicellulose, and Lignin. Journal of Polymer Science 14:1323-1337.<br />
50. Wailes, P.C. and J.R. Kershaw. 1982. The Characterisation and Upgrading of Flash Pyrolysis Coal<br />
Tars: A Review of Work in the Division of Applied Organic Chemistry, CSIRO. Project Report<br />
Number 3.<br />
51. Fung, D.P.C. and R. Graham. 1980. The Role of Catalysts in Wood Gasification. In Thermal<br />
Conversion of Solid Wastes and Biomass. Eds. J.L. Jones and S.B. Radding. SRI International.<br />
American Chemical Society Symposium Series. Washington DC. CH 28:369-378.<br />
52. Back, E.L. 1990. The Rate of Isothermal heat Evolution between 150 o C and 230 o C of<br />
Lignocellulosic Sheet Materials in an Air Stream. II. Temperature Dependence, Kinetics,<br />
Interpretation. Holzforschung 44(3):177-184.<br />
53. Knight, J.A. 1979. Pyrolysis of pine sawdust. In Progress in Biomass Conversion. Ed. D.A.<br />
Tillman. Academic Press, New York.<br />
54. Knight, J.A. 1979a. Pyrolysis of Wood Residues with a Vertical Bed Reactor. In<br />
Progress in Biomass Conversion V1. Eds. K.V. Sarkanen and D.A. Tillman.<br />
Academic Press. P:87-115.<br />
55. Shafizadeh, F. 1982. Pyrolytic Reactions and Products of Biomass. In Fundamentals of<br />
Thermochemical Biomass Conversion. Eds. R.P. Overend, T.A. Milne and L.K. Mudge. Elsevier<br />
Applied Science. Also Paper presented at Thermochemical Conversion of Biomass Symposium.<br />
Estes Park, Colorado.<br />
56. Shafizadeh, F. and Y.L. Fu. 1973. Pyrolysis of Cellulose. Carbohydrate Research. 29:113-122.<br />
57. Shafizadeh, F., R.H. Furneaux, T.G. Cochran, J.P. Scholl and Y. Sakai. 1979. Production of<br />
Levoglucosan and Glucose from Pyrolysis of Cellulosic Materials. Journal of Applied Polymer<br />
Science. 23:3525-3539.<br />
58. Shafizadeh, F. and T.T. Stevenson. 1982. Saccharification of Douglas-Fir Wood by a<br />
Combination of Prehydrolysis and Pyrolysis. Journal of Applied Polymer Science 27:4577-4585.<br />
59. Nassar, M.M. and G.D.M. MacKay. 1984. Mechanism of Thermal Decomposition of Lignin.<br />
Wood and Fibre Science. 16(3):441-453.<br />
150
60. Kosiewicz, S.T. 1980. Cellulose Thermally Decomposes at 70 o C. Thermochimica Acta. 40:319-<br />
326.<br />
61. Broido, A., A.C. Javier-son, A.C. Ouano, and E.M. Barrall. 1973. Molecular Weight Decrease in<br />
the Early Pyrolysis of Crystalline and Amorphous Cellulose. Journal of Applied Polymer Science.<br />
17:3627-3635.<br />
62. Madorsky, S.L. 1964. Thermal Degradation of Organic Polymers. New York. Interscience<br />
Publishers. J. Wiley and Sons Inc.<br />
63. Shafizadeh, F. and A.G.W. Bradbury. 1979. Thermal Degradation of Cellulose in Air and Nitrogen<br />
at Low Temperatures. Journal of Applied Polymer Science. 23:1431-1442.<br />
64. Chatterjee, P. K. and C.M. Conrad. 1966. Kinetics of the Pyrolysis of Cotton Cellulose. Textile<br />
Research Journal. 36:487-494.<br />
65. Fung, D.P.C. 1969. Kinetics and Mechanism of the Thermal Degradation of Cellulose. Tappi.<br />
52(2):319-321.<br />
66. Basch, A. and M. Lewin. 1973. The Influence of Fine Structure on the Pyrolysis of Cellulose. I.<br />
Vacuum Pyrolysis. Journal of Polymer Science. 11:3071-3093.<br />
67. Weinstein, M. and A. Broido. 1970. Pyrolysis Crystallinity Relationships in Cellulose.<br />
Combustion Science and Technology. 1:287-292.<br />
68. Antal, M.J. Jr. 1983. Biomass Pyrolysis: A Review of the Literature Part 1- Carbohydrate<br />
Pyrolysis. In Advances in Solar Energy. P:61-109.<br />
69. Byrne, G.A., D. Gardiner and F.H. Holmes. 1966. The Pyrolysis of Cellulose and the Action of<br />
Flame-retardants: II. Further Analysis and Identification of Products. Journal of Applied<br />
Chemistry. 16:81-88.<br />
70. Franklin, W.E. 1979. Direct Pyrolysis of Cellulose and Cellulose Derivatives in a Mass<br />
Spectrometer with a Data System. Analytical Chemistry. 51(7):992-996.<br />
71. Schulten, H.R., U. Bahr, and W. Gortz. 1981. Pyrolysis Field Ionization Mass Spectrometry of<br />
Carbohydrates : Part b: Polysaccharides Journal of Analytical and Applied Pyrolysis. 3:229-241.<br />
72. Golova, O.P. and R.G. Krylova. 1957. Thermal Decomposition of Cellulose and its Structure.<br />
Doklady Akademii Nauk SSSR. 116:419-421.<br />
73. Golova. O.P. 1975. Chemical Effects of Heat on Cellulose. Russian Chemical Reviews. 44(8):687-<br />
697.<br />
74. Murphy, E.J. 1962.Thermal Decomposition of Natural Cellulose in Vacuo. Journal of Polymer<br />
Science. 58:649-665.<br />
75. Millet, M.A. and V.L. Goedken. 1965. Modification of Cellulose Fine Structure-Effect of Thermal<br />
and Electron Irradiation Pretreatments. Tappi. 48(6):367-371.<br />
76. Madorsky, S.L., V.E. Hart and S. Straus. 1956. Pyrolysis of Cellulose in a Vacuum. Journal of<br />
Research of the National Bureau of Standards. 56(6):343-354.<br />
77. Schwenker, R.F. and L.R. Beck Jr. 1963. Study of the Pyrolytic Decomposition of Cellulose by<br />
Gas Chromatography. Journal of Polymer Science: Part C. 2:331-340.<br />
151
78. Faix. O., I. Fortmann, J. Bremer and D. Meier. 1991. Thermal Degradation Products of wood: Gas<br />
Chromotographic Separation and Mass Spectrometric Characterisation of Polysaccharide Derived<br />
Products. Holz-als-Roh und Werkstoff. 49:213-219.<br />
79. Wodley, F.A. 1971. Pyrolysis Products of Untreated and Flame Retardant-Treated α-Cellulose and<br />
Levoglucosan. Journal of Applied Polymer Science. 15:835-851.<br />
80. Wolf, O. 1950. Staerke. 2:273.<br />
81. Greenwood, C.T. 1967. The Thermal Degradation of Starch. Advances in Carbohydrate<br />
Chemistry. 22:483-515.<br />
82. Beall, F.C. and H.W. Eickner. 1968. Thermal Degradation of Wood Components: A Review of the<br />
Literature. Forest Products Laboratory, Forest Service, U.S Department of Agriculture.<br />
83. Domansky, R. and F. Rendos. 1962. On the Pyrolysis of Wood and its Components. Holz als Roh<br />
und Werkstoff 20(12):473-476.<br />
84. Kosik, M.Von., F. Kozmal, V. Reisen, and R. Domnsky. 1968. Pyrolyse des Buchenholzes bei<br />
niedrigen Temperaturen II. Thermographie des Buchenholzes und seiner Komponenten.<br />
Holzforschung und Holzverwertung. 20:15-19.<br />
85. Goring, D.A.I. 1963. Thermal Softening of Lignin, Hemicellulose and Cellulose. Pulp and Paper<br />
Magazine of Canada. 64:T517-527.<br />
86. Shafizadeh, F., G.G. McGinnis, R.A. Sosott and H.W. Tatton. 1971. Thermal Reactions of α-D-<br />
Xylopyranose and β-D-Xylopyranosides. Journal of Organic Chemistry. 36(19):2813-2818.<br />
87. Shafizadeh, F. and R.A. Susott. 1973. Crystalline Transitions of Carbohydrates. Journal of Organic<br />
Chemistry. 38(21):3710-3715.<br />
88. Kudo, J. and E. Yoshida. 1957. On the Decomposition of Wood Constituents in the Course of<br />
Carbonisation. I. The Decomposition of Carbohydrate and Lignin in Mizunara. (Quercus Crispla<br />
Blume). Journal of Japanese Wood Research Society. 3(4):125-127.<br />
89. Shafizadeh, F. G.D. McGinnis and C.W. Philpot. 1972. Thermal Degradation of Xylan and<br />
Related Model Compounds. Carbohydrate Research. 25:23-33.<br />
90. Stamm, A.J. 1962. Thermal Degradation of Wood and Cellulose. Industrial Engineering and<br />
Chemical Research. 48(3):413-417.<br />
91. Fengel, D. 1966. On the Changes of the Wood and its Components in the Temperature Range up<br />
to 200 o C-Part II: The Hemicelluloses in Untreated and Thermally Treated Sprucewood. Holz als<br />
Roh- und Werkstoff. 24(3): 98-109.<br />
92. Kato, K. and H. Komorita. 1968. Pyrolysis of Cellulose. Part V. Isolation and Identification of 3-<br />
Deoxyglycosones Produced from D-Glucose, D-Xylose and α-Cellulose by Heating. Agr. Biol.<br />
Chem. (Tokyo). 32(6):715-20.<br />
93. Shafizadeh, F. and G.D. McGinnis. 1971. Chemical Composition and Thermal Analysis of<br />
Cottonwood. Carbohydrate Research. 16:273-277.<br />
94. Goldstein, I.J. and T.L. Hullar. 1966. Chemical Synthesis of Polysaccharides. Advances in<br />
Carbohydrate Chemistry. 21:431-512.<br />
152
95. Miller, R.E. and S.M. Cantor. 1952. 2-Hyrdoxyacetylfuran from Sugars. Journal of the American<br />
Chemical Society. 74:5236-5237.<br />
96. Speck, J.C. Jr. 1958. The Lobry de Bruyn-Alberda van Ekenstein Transformation. Advances in<br />
Carbohydrate Chemistry. 13:63-103.<br />
97. Gardiner, D. 1966. The pyrolysis of some Hexoses and Derived Di-, Tri-, and Poly-saccharides<br />
Journal of the Chemical Society C. 1473-1476.<br />
98. Shafizadeh, F. and Y.Z. Lai. 1972. Thermal Degradation of 1,6-Anhydro-β-D-glucopyranose.<br />
Journal of Organic Chemistry. 37(2):278-284.<br />
99. Hopkins, M., M.J., Antal, Jr. and J, Kay. 1985. Radiant Flash Pyrolysis of Biomass Using a Xenon<br />
Flash Tube. Journal of Applied Polymer Science. 29:2163-2175.<br />
100. Barton, A.F.M., Tjandra, J., and Nicholas, P.G. 1989. Chemical Evaluation of Volatile Oils in<br />
Eucalypts. Journal of Agricultural and Food Chemistry, 37:1253-1257.<br />
101. Lassak, E.V. 1988. The Australian Eucalyptus Oil Industry, Past and Present. Chemistry in<br />
Australia. Nov:396-398.<br />
102. Browning, B.L. 1967. Methods of Wood Chemistry. Institute of Paper Chemistry, Appleton,<br />
Wisconsin. Interscience Publishers. New York.<br />
103. Elder, T.J. and E.J. Soltes. 1980. Pyrolysis of Lignocellulosic Material. Phenolic Constituents<br />
of a Wood Pyrolytic Oil. Wood and Fibre Science 12(4):217-226.<br />
104. Faix, O., D. Meier and I. Fortmann. 1990a. Thermal Degradation Products of Wood: Gas<br />
Chromatographic Separation and Mass Spectrometric Characterisation of Monomeric Lignin<br />
Derived Products. Hols-als-Roh und Werkstoff 48:281-285<br />
105. Faix, O., D. Meier and I. Fortmann. 1990b. Thermal Degradation Products of Wood: A<br />
Collection of Electron-Impact (EI) Mass Spectra of Monomeric Lignin Derived Products. Holsals-Roh<br />
und Werkstoff 48:351-354.<br />
106. Obst, J.R. 1983. Analytical Pyrolysis of Hardwood and Softwood Lignins and its use in<br />
Lignin-Type Determination of Hardwood Vessel Elements. Journal of Wood Chemistry and<br />
Technology. 3(4):377-397.<br />
107. Wallis, A.F.A., R.H. Wearne and P.J. Wright. 1986. Chemical Analysis of Polysaccharides in<br />
Plantation Eucalypt Woods and Pulps. Appita J. 49(4):258.<br />
108. Wright, P.J., and A.F.A. Wallis. 1996. Rapid Determination of Carbohydrates in Hardwoods<br />
by High Performance Anion Exchange Chromatography. Holzforschung, 1996, 50(6):518.<br />
109. Seifert, K. 1960. Zur Frage der Cellulose-Schnellbestimmung nach der Acetylation-Methode.<br />
Das Papier. 14(3):104.<br />
110. Wallis, A.F.A., R.H. Wearne and P.J. Wright. 1997. New Approaches to the Rapid Analysis of<br />
Cellulose in Wood. The Cooperative Research Centre for Hardwood Fibre and Paper Science.<br />
Research Report No 128.<br />
111. Ritter, G.J., and E.F. Kurth.1933. Holocellulose, Total Carbohydrate Fraction of Extractive-<br />
Free Maple Wood. Indistrial and Engineering Chemistry Research. 25:1250-1253.<br />
153
112. Kurth, E.F., and G.J. Ritter. 1934. Spruce Holocellulose and the Composition of its Easily<br />
Hydrolyzable Fraction. Journal of the American Chemical Society. 56:2720-2723.<br />
113. Van Beckum, W.G., and G.J. Ritter. 1937. Chemical Composition of Wood. Paper Trade<br />
Journal. 105(18):127.<br />
114. Wise, L.E., M. Murphy and A.A. D’Addieco. 1946. Chlorite Holocellulose: Its Fractionation<br />
and Bearing on Summative Wood Analysis and on Studies on the Hemicelluloses. Paper Trade<br />
Journal. 122(2):35-43.<br />
115. Norman, A.G. and S.H Jenkins. 1933. Biochemical Journal. 27:818.<br />
116. TAPPI (Technical Association of the Pulp and Paper Industry). 1999. Standard Method T230<br />
om-99. Viscosity of pulp (capillary viscometer method).<br />
117. Butt, D. 2002. Optimisation of Low Molecular Weight Phenols Production from Fast Pyrolysis<br />
of Radiata Pine. PhD Thesis. University of Melbourne.<br />
118. Fletcher, T.L. and E.E. Harris. 1952. Products from the Destructive Distillation of Douglas-Fir<br />
lignin. Tappi. 35(12):536-539.<br />
119. Hawley, G.G. 1991. The Condensed Chemical Dictionary. 10 th Edition. Van Rostrand<br />
Reinhold. New York<br />
120. Zeitsch, K.J. 2000. The Chemistry and Technology of Furfural and its many By-Products.<br />
Sugar Series 13. Elsevier, Amsterdam.<br />
121. Venter, C. 1996. Nematode Pests of Agriculture in Southern Africa, Nematological Society of<br />
Southern Africa, Potchefstroom.<br />
122. Furfural Market Size. 2001. DalinYebo Investments CC.<br />
123. Phenol Production, Executive Summary. Eldanel, Business Solutions and Services. Israel.<br />
124. Phenol, Health and Safety Guide No. 88. 1994. World Health Organization for the<br />
International Programme on Chemical Safety (IPCS).<br />
125. Gennaro, A.R. 1985. Remington's Pharmaceutical Sciences, Seventeenth Edition. Easton,<br />
Pennsylvania, Mack Publishing Company.<br />
126. Himmelblau, A.D. 1995. Phenol-Formaldehyde Resin Substituents from Biomass Tars. In<br />
Wood and Adhesives 1995. Eds A.W. Christiansen and A.H. Conner. P:155-162. Proceedongs<br />
No.7296.<br />
127. Wasselle, L.A. 1982. Chemicals from Wood Wastes and Pulping Residues. In SRI<br />
International, Report No. 147.<br />
128. Oshima, M., K. Kashiwa, T. Kubo, H. Tabata, and H. Watanbe. 1966. Studies on the<br />
Hydrocracking of Lignin. Bulletin of the Chemical Society of Japan. 39:2750-2755.<br />
129. Sarkanen, K.V. and C.H.Ludwig. 1971. Lignin: Occurrence, Formation, Structure, Reactions.<br />
Wiley Interscience, New York.<br />
154
130. Enkvist, J. 1975. Phenolics and Other Organic Chemicals from Kraft Black Liquors by<br />
Disproportionation and Cracking Reactions. Applied Polymer Symposium. 28:285-295.<br />
131. Research updates from the CSIRO Divisions of Forestry and Forest Products. Onwood 7,<br />
Summer 1994-95.<br />
132. Shevchenko, S. M., K. Chang, J. Robinson and J.N. Saddler. 2000. Optimisation of<br />
Monosaccharide Recovery by Post-Hydrolysis of the Water-Soluble Hemicellulose Component<br />
after Steam Explosion of Softwood Chips. Bioresource Technology 72: 207-211.<br />
133. Jacobsen, S. E. and C.E. Wyman. 2000. Cellulose and Hemicellulose Hydrolysis Models for<br />
Application to Current and Novel Pre-Treatment Processes. Applied Biochemistry and<br />
Biotechnology 84-86, 81-96.<br />
134. 134 Shafizadeh, F. 1982. Introduction to the Pyrolysis of wood. Journal of Analytical and<br />
Applied Pyrolysis. 3:283-305.<br />
155
Thermochemical Processing of Agroforestry Biomass<br />
for furans, phenols, cellulose and essential oils<br />
by David Butt<br />
RIRDC Pub. No. 06/121<br />
The aim of this research was to optimise the fast pyrolysis<br />
process on Australian hardwood and then to assess the effect of<br />
scale through construction and optimisation of a development<br />
scale process plant. A second aim was to improve the viability<br />
of Eucalyptus oil extraction through improvement of recovery<br />
efficiency.<br />
Eucalyptus oil is high-value and is derived from some Australian<br />
agroforestry species. However, the efficiency of oil recovery<br />
depends on the distillation technique. To move beyond the<br />
traditional pharmaceutical market, more efficient extraction is<br />
required in order to compete with industrial solvents derived<br />
from other materials.<br />
Most RIRDC publications can be viewed and purchased at<br />
our website:<br />
www.rirdc.gov.au<br />
Contact RIRDC:<br />
Level 2<br />
15 National Circuit<br />
Barton ACT 2600<br />
PO Box 4776<br />
Kingston ACT 2604<br />
Ph: 02 6271 4100<br />
Fax: 02 6271 4199<br />
Email: rirdc@rirdc.gov.au<br />
web: www.rirdc.gov.au<br />
Bookshop: 1300 634 313<br />
RIRDCNew ideas for rural Australia