Greenhouse Effect and Atmospheric Chemistry
Greenhouse Effect and Atmospheric Chemistry
Greenhouse Effect and Atmospheric Chemistry

Create successful ePaper yourself
Turn your PDF publications into a flip-book with our unique Google optimized e-Paper software.
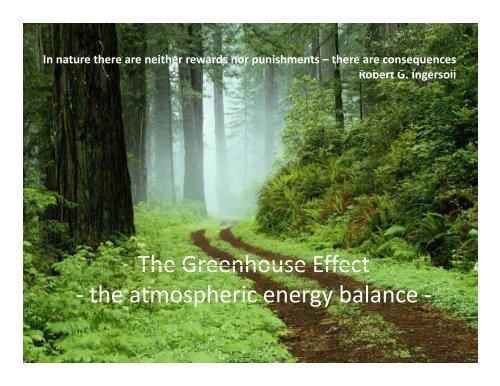
In nature there are neither rewards nor punishments –there are consequences<br />
Robert tG G. Ingersoll<br />
The <strong>Greenhouse</strong> <strong>Effect</strong><br />
‐ the atmospheric energy balance ‐
Organic Carbon Cycle<br />
The pre‐industrial (1800) amount of CO 2 in the<br />
atmosphere was 600Gt, balanced by equilibrium<br />
between absorption by photosynthesis <strong>and</strong><br />
sequestration <strong>and</strong> emission through respiration<br />
<strong>and</strong> release.<br />
d(<br />
CO2)<br />
dt<br />
d(<br />
CO2)<br />
dt<br />
d(<br />
CO2)<br />
dt<br />
abs<br />
abs<br />
ems<br />
d(<br />
CO2)<br />
<br />
dt<br />
Gt<br />
74<br />
y<br />
atm<br />
atm<br />
ems<br />
0<br />
ocean<br />
Gt<br />
74.6<br />
y<br />
ocean<br />
0.6<br />
Gt<br />
y<br />
Gt<br />
50<br />
y<br />
soil<br />
soil<br />
100<br />
Gt<br />
y<br />
Gt<br />
50<br />
y<br />
photosynth.<br />
respiration<br />
Each process has its own time scale depending<br />
on the conversion rate which in turn depend on<br />
environmental conditions such as light, water,<br />
temperature. The conversion rate is proportional<br />
to the product of CO 2 abundance in the reservoir,<br />
the conversion cross section <strong>and</strong> the<br />
leaf area A.<br />
R<br />
conv<br />
N ,<br />
CO<br />
2<br />
<br />
L,<br />
H T A
Photosynthesis<br />
<br />
<br />
chlorophyll<br />
<br />
sunlight<br />
<br />
<br />
C<br />
6<br />
H<br />
O 6<br />
O<br />
6<br />
CO2<br />
<br />
6<br />
H<br />
2<br />
O<br />
12 6<br />
6<br />
2<br />
<strong>and</strong> respiration<br />
C 6 H12 O6<br />
<br />
6<br />
O2<br />
<br />
6<br />
CO2<br />
<br />
6<br />
H<br />
2<br />
O<br />
Chemical reaction takes place<br />
on a pico‐second timescale<br />
which translates into a high<br />
reaction probability or crosssection.<br />
The absorption yield<br />
depends on the cross section<br />
integrated over the spectrum of<br />
the incoming light <strong>and</strong> the<br />
luminosity the actual light<br />
absorption <strong>and</strong> conversion<br />
cross section depends on the<br />
wavelength, the leaf structure,<br />
t<br />
the pigment composition <strong>and</strong><br />
the cell conversion mechanism.<br />
The timescale for CO 2 absorption is fast, making<br />
photosynthesis an extremely efficient absorption<br />
process if sufficient leaf surface area is available!
Change of balance<br />
Increase of CO 2 emission <strong>and</strong> increase of deforestation since the 19 th century!
Drastic increase of the anthropogenic<br />
CO 2 production due to fossil fuel<br />
consumption by growing<br />
industrialization<br />
Impact on CO 2 equilibrium conditions, which<br />
maintain the present status quo in climate !
Observational evidence, CO 2<br />
YEAR<br />
The dashed red line with diamond symbols represents the monthly mean values,<br />
centeredonthemiddleofeachmonth.Theblack line with the square symbols<br />
represents the same, after correction for the average seasonal cycle. The curve shows<br />
a continuous increase of the CO 2 level in Earth’s atmosphere .
CO 2 Global Distribution<br />
2
Strong seasonal variations<br />
due to climate variances<br />
between the northern <strong>and</strong><br />
the southern hemisphere<br />
<strong>and</strong> feed back correlations<br />
over the year.<br />
CO 2 observations from Mauna<br />
Loa reflect medium location in<br />
northern hemisphere, but the<br />
observations reflect consistently<br />
the seasonal variations in CO 2 emission
Other <strong>Greenhouse</strong> Gases<br />
N 2 O nitrous oxide level was stable<br />
for the last 3000 years according to<br />
ice core analysis. The present<br />
annual increase in emission i by 0.2%<br />
to 0.3% is due to widespread <strong>and</strong><br />
rapidly increasing applications of<br />
nitrogen based fertilizers, tropical<br />
deforestation, <strong>and</strong> conversion of<br />
forest to pasture <strong>and</strong> farml<strong>and</strong>.<br />
CH 4 methane increases at an annual rate of 0.8% to<br />
1%. Thistrackswell with ihpopulation growth. Naturally<br />
occurring from wetl<strong>and</strong>s such as bog <strong>and</strong> swamp<br />
emissions the increase is associated with rice<br />
cultivation, l<strong>and</strong>fills, biomass burning, mining, natural<br />
gas venting, <strong>and</strong> pipeline leaks. Release of CH 4 from<br />
Alaskan <strong>and</strong> Siberian permafrost regions could result<br />
in an sudden increase by 500Gt within next century.<br />
CFC chlorofluorocarbons have been<br />
developed in the 1920ies for<br />
cleaning solvents, refrigerants, <strong>and</strong><br />
propellants spray cans. Industrial<br />
mass production after 1950 caused<br />
an unprecedented increase. Inert to<br />
chemical processes expected to<br />
occur in the troposphere, p CFCs<br />
accumulate in the stratosphere,<br />
where photodissociation breaks up<br />
molecules, releasing halogen gases.
Anthropogenic sources of CO 2
Alternative World Views<br />
http://www.worldmapper.org/display.php?selected=295<br />
Territory size shows the proportion of carbon dioxide emissions in 1980, 2000, 2006.<br />
CO 2 emission 1980 CO 2 emission 2000<br />
>17t/p<br />
>2t/p<br />
~8t/p<br />
~6t/p<br />
>2t/p<br />
~3t/p<br />
CO CO emission 2006 per capita<br />
2 emission 2006 2<br />
"... the world need[s] to differentiate between the survival emissions of<br />
the poor <strong>and</strong> luxury emissions of [the] rich." Sunita Narain, 2002
<strong>Greenhouse</strong> gases<br />
<strong>Greenhouse</strong>gasestraptheemittedinfraredradiationfromearthsurfaceinthe<br />
lower troposphere by atomic or molecular absorption processes, causing a<br />
gradual heating of the lower atmosphere layer.<br />
H 2 O is the most natural occurring greenhouse gas (humidity, clouds). CO 2 is<br />
2 2<br />
primarily an anthropogenic greenhouse gas (industry, traffic). Additional<br />
anthropogenic greenhouse gases are industry produced Chlorofluorcarbons<br />
(CFCs) <strong>and</strong> Hydrofluorcarbons (HCFCs).
Single layer <strong>Greenhouse</strong> model<br />
Infrared radiation from theearth surface of emission i temperaturet<br />
T e is completely absorbed in atmosphere <strong>and</strong> radiates into space<br />
<strong>and</strong> back to earth surface increasing surface temperature T s .<br />
F 0<br />
( 1<br />
)<br />
F<br />
Incoming net solar flux:<br />
0<br />
F avg<br />
<br />
F 0 4<br />
( 1 ) F<br />
i<br />
4 0<br />
Emission temperature: T e<br />
<br />
F<br />
Flux A ↑ radiated to space<br />
depends on atmospheric<br />
temperature T a :<br />
A<br />
<br />
T<br />
4 <br />
4<br />
a<br />
<br />
A<br />
<br />
F<br />
F ↑<br />
Flux S ↑ radiated from<br />
<br />
F <br />
surface with terrestrial<br />
<br />
T<br />
A 0<br />
F T<br />
s<br />
surface temperature T <br />
<br />
in <br />
s<br />
4 F<br />
Ts<br />
<br />
2<br />
4<br />
s<br />
( 1 )<br />
0<br />
4<br />
4<br />
Te<br />
<br />
Te<br />
4<br />
T 2 T<br />
1. 19 T<br />
e<br />
e<br />
Emission temperature<br />
T =255K=‐18 o e C<br />
Surface temperature:<br />
T s =303K=30 o C<br />
4
Considering a change in albedo <br />
<strong>and</strong> an atmospheric absorption <br />
T e<br />
T<br />
s<br />
<br />
<br />
4<br />
4<br />
<br />
1<br />
<br />
<br />
F<br />
<br />
<br />
<br />
4 <br />
0<br />
<br />
<br />
<br />
<br />
<br />
1<br />
<br />
F0<br />
<br />
2 T<br />
4<br />
e<br />
<br />
2 <br />
<br />
Earth’s surface temperature depends on<br />
the albedo . Increasing the albedo<br />
(reflection of incoming radiation) reduces<br />
the emission temperature T e <strong>and</strong> therefore<br />
also the temperature T s of the earth<br />
surface. Enhanced cloud coverage would<br />
cause a temperature reduction.<br />
T<br />
T<br />
2 <br />
of the emitted radiation is absorbed by the<br />
<br />
<br />
2 <br />
atmosphere (full absorption =1) reduces<br />
s<br />
4 T e<br />
a<br />
<br />
4<br />
1 1<br />
T<br />
4<br />
<br />
e<br />
2 <br />
<br />
2<br />
T<br />
No absorption: 0 ≤ ≤ 1 full absorption<br />
s<br />
A leaky greenhouse where only a fraction <br />
the greenhouse effect <strong>and</strong> lowers the<br />
surface temperature T s (This corresponds to<br />
a reduction of greenhouse gases) <strong>and</strong> also<br />
the atmospheric temperature T a .
Examples<br />
320<br />
T<br />
s<br />
2 <br />
1 1<br />
T T<br />
T<br />
<br />
<br />
<br />
<br />
2 <br />
<br />
2 <br />
<br />
2<br />
4 <br />
e a<br />
4 4<br />
e<br />
T<br />
s<br />
Tempe erature [K]<br />
300<br />
280<br />
260<br />
240<br />
220<br />
200<br />
0 0.2 0.4 0.6 0.8 1 1.2<br />
The globally averaged solar incident<br />
(or emitted) flux F e on the surface is<br />
only a fraction f≈0.16 (for =0.35)<br />
of the incoming total flux F o .<br />
<br />
Te<br />
Ts<br />
Ta<br />
T e<br />
<br />
4<br />
<br />
<br />
<br />
<br />
<br />
1<br />
F<br />
4 <br />
Emission temperature depends<br />
on the amount of incoming solar<br />
radiation flux, the insolation F o !<br />
4 1 <br />
Fe<br />
Te<br />
F<br />
4<br />
<br />
W 1 0.35 W<br />
1 6<br />
2 <br />
m 4 m<br />
0<br />
<br />
<br />
0<br />
2
Climate feed‐backs<br />
<strong>Greenhouse</strong> models have to account for several potential positive or<br />
negative feedbacks that can occur, if the equilibrium of the climate system is<br />
perturbed by an additional energy input or energy loss dQ (in units W/m 2 ).<br />
The impact can be expressed in terms of surface temperature change dT s .<br />
dTs<br />
Ts<br />
<br />
dQ QQ<br />
<br />
is a measure for climate sensitivity<br />
<br />
4<br />
3<br />
QBB Te<br />
4 Te<br />
Te<br />
4<br />
Te<br />
since const<br />
T<br />
T<br />
Q<br />
s<br />
BB<br />
<br />
s<br />
K<br />
Wm<br />
T<br />
3<br />
e<br />
T<br />
<br />
3<br />
1<br />
4 <br />
<br />
<br />
T <br />
0.26<br />
for<br />
T<br />
<br />
255<br />
K<br />
2<br />
e<br />
For every Q=1 Wm ‐2 increase in the forcing of energy balance at the earth’s<br />
surface, the surface temperature T s will change by 0.25K ! Each such change<br />
requires altering total insolation by 6 Wm ‐2 due to albedo or geometrical shifts!<br />
<br />
s<br />
e
Climate feedback from water vapor in the atmosphere depends on the<br />
saturated vapor pressure SVP. If the temperature increases the amount<br />
of water at saturation ti increases, enhancing the greenhouse effect of<br />
water <strong>and</strong> raising the temperature (humid <strong>and</strong> hot weather conditions).<br />
SVP<br />
<br />
A<br />
<br />
e<br />
0.06706<br />
T<br />
A 6.11mbar<br />
<br />
0<br />
C<br />
<br />
1<br />
A change by 1 o C leads to a 7% change in SVP<br />
Ts K<br />
0.5<br />
for Te<br />
255K<br />
2<br />
Q<br />
Wm<br />
BBH<br />
2<br />
O<br />
See lecture 7.1.<br />
<br />
d SVP<br />
SVP<br />
<br />
dT s<br />
Taking into account the water vapor for every Q=1 Wm ‐2 increase in the<br />
forcingofenergybalancethesurfacetemperatureT s will change by 0.5K !<br />
This is a positive feedback of water vapor formation. However, water<br />
vapor will favor cloud formation which increases albedo, reduces<br />
insolation <strong>and</strong> therefore reduces temperature as negative feedback.
Observed annual global temperature<br />
trends compared with the simulated<br />
global mean surface temperatures,<br />
considering separately the natural <strong>and</strong><br />
anthropogenic forcing contributions.<br />
The observed trend suggests an<br />
increasing dominance of anthropogenic<br />
based forcing contributions. This<br />
conclusion is still heavily contested!
Temperature increase predictions as<br />
a function of future CO 2 emission
Predictions IPCC 2001 for the development<br />
of mean temperatures in Europe until 2080 Reality in summer 2010<br />
Comparison with 2003<br />
Science 332 (2011)
Conclusions by the intergovernmental Panel on Climate Change (IPCC)<br />
Possible consequences<br />
predicted by theoretical<br />
model dl studies of the<br />
IPCC <strong>and</strong> other research<br />
institutions or research<br />
groups.<br />
Detailed analyses <strong>and</strong><br />
study are summarized<br />
in a number of different<br />
reports by the National<br />
Academies <strong>and</strong> are<br />
available on‐line:<br />
www.nap.edu/topics.php?topic=367
Counterstrategies: how to cool the<br />
earth by climate‐ or geoengineering<br />
g g