Simple Template for Takt Time/Cycle Time Bar Charts
Simple Template for Takt Time/Cycle Time Bar Charts
Simple Template for Takt Time/Cycle Time Bar Charts

You also want an ePaper? Increase the reach of your titles
YUMPU automatically turns print PDFs into web optimized ePapers that Google loves.
TBM Consulting Group<br />
Operational Excellence One Point Lesson<br />
<strong>Simple</strong> <strong>Template</strong> <strong>for</strong> <strong>Takt</strong> <strong>Time</strong>/<strong>Cycle</strong> <strong>Time</strong><br />
<strong>Bar</strong> <strong>Charts</strong><br />
Category: Shop floor │ Business: General Application │ Lesson: #11 │ Author: Beth Morrison<br />
PROBLEM OR OPPORTUNITY<br />
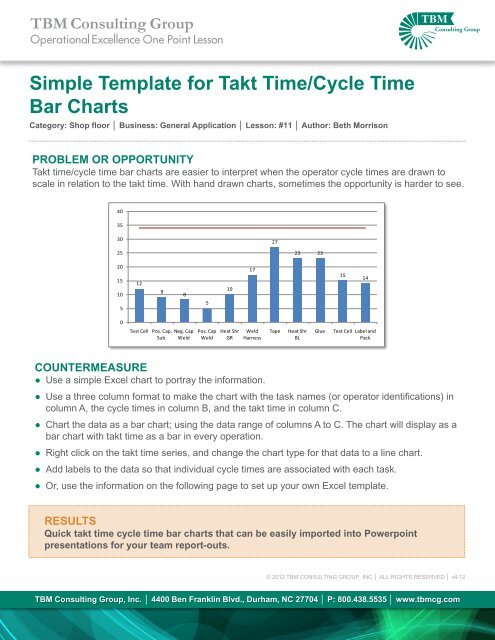
<strong>Takt</strong> time/cycle time bar charts are easier to interpret when the operator cycle times are drawn to<br />
scale in relation to the takt time. With hand drawn charts, sometimes the opportunity is harder to see.<br />
40<br />
35<br />
30<br />
27<br />
25<br />
23 23<br />
20<br />
15<br />
10<br />
5<br />
12<br />
9<br />
8<br />
5<br />
10<br />
17<br />
15<br />
14<br />
0<br />
Test Cell Pos. Cap. Neg. Cap<br />
Sub. Weld<br />
Pos. Cap<br />
Weld<br />
Heat Shr<br />
GR<br />
Weld<br />
Harness<br />
Tape<br />
Heat Shr<br />
BL<br />
Glue<br />
Test Cell Label and<br />
Pack<br />
COUNTERMEASURE<br />
● Use a simple Excel chart to portray the in<strong>for</strong>mation.<br />
● Use a three column <strong>for</strong>mat to make the chart with the task names (or operator identifications) in<br />
column A, the cycle times in column B, and the takt time in column C.<br />
● Chart the data as a bar chart; using the data range of columns A to C. The chart will display as a<br />
bar chart with takt time as a bar in every operation.<br />
● Right click on the takt time series, and change the chart type <strong>for</strong> that data to a line chart.<br />
● Add labels to the data so that individual cycle times are associated with each task.<br />
● Or, use the in<strong>for</strong>mation on the following page to set up your own Excel template.<br />
RESULTS<br />
Quick takt time cycle time bar charts that can be easily imported into Powerpoint<br />
presentations <strong>for</strong> your team report-outs.<br />
© 2012 TBM CONSULTING GROUP, INC │ ALL RIGHTS RESERVED │ v4-12<br />
TBM Consulting Group, Inc. │ 4400 Ben Franklin Blvd., Durham, NC 27704 │ P: 800.438.5535 │ www.tbmcg.com
Operator Task <strong>Cycle</strong> <strong>Time</strong> <strong>Takt</strong> <strong>Time</strong><br />
Test Cell 12 34<br />
Pos. Cap. Sub. 9 34<br />
Neg. Cap Weld 8 34<br />
Pos. Cap Weld 5 34<br />
Heat Shr GR 10 34<br />
Weld Harness 17 34<br />
Tape 27 34<br />
Heat Shr BL 23 34<br />
Glue 23 34<br />
Test Cell 15 34<br />
Label and Pack 14 34<br />
How this chart was created:<br />
Use in<strong>for</strong>mation from your timed observations (example above is<br />
battery assembly.)<br />
40<br />
35<br />
30<br />
25<br />
20<br />
15<br />
10<br />
5<br />
0<br />
12<br />
Test Cell<br />
9<br />
Pos. Cap.<br />
Sub.<br />
8<br />
Neg. Cap<br />
Weld<br />
<strong>Takt</strong> time = 34 seconds<br />
5<br />
Pos. Cap<br />
Weld<br />
10<br />
Heat Shr<br />
GR<br />
17<br />
Weld<br />
Harness<br />
27<br />
Tape<br />
23 23<br />
Heat Shr<br />
BL<br />
Glue<br />
15<br />
14<br />
Test Cell Label and<br />
Pack<br />
Column A: Short task description <strong>for</strong> work per<strong>for</strong>med by a single<br />
operator.<br />
Column B: <strong>Cycle</strong> time <strong>for</strong> task from timed observations.<br />
This chart has had the legend deleted, and the label <strong>for</strong> the <strong>Takt</strong> <strong>Time</strong> line was added manually, using the text box feature.<br />
Column C: Calculated takt time.<br />
Excel 2010:<br />
Highlight your data range. Don't include Row 1.<br />
Click on the insert tab and choose the icon <strong>for</strong> column charts.<br />
Choose the 2D column chart on the left.<br />
You will get a column chart with two bars <strong>for</strong> each task; the red bar will be takt time.<br />
Right click on one of the red bars.<br />
Choose Change Series Chart Type<br />
Select the Line Chart furthest to the left and click on OK.<br />
You can click on the legend box to delete it, and add in what ever text you would like using the text feature.<br />
If you want the individual task times to display, right click on any blue bar.<br />
Click on Add Data Labels