Chapter 3 Population Geography - W.H. Freeman
Chapter 3 Population Geography - W.H. Freeman
Chapter 3 Population Geography - W.H. Freeman

You also want an ePaper? Increase the reach of your titles
YUMPU automatically turns print PDFs into web optimized ePapers that Google loves.
80 <strong>Chapter</strong> 3 <strong>Population</strong> <strong>Geography</strong><br />
Crude Death Rate<br />
80<br />
180 140 100 60 20<br />
80<br />
60<br />
Death Rate<br />
(deaths per year<br />
per 1,000 population)<br />
12 – 20<br />
10 – 11<br />
7 – 9<br />
1 – 6<br />
Not available<br />
40<br />
20<br />
0<br />
140 120<br />
20<br />
0 1000 2000 mi.<br />
0 1000 2000 3000<br />
km<br />
Scale at latitude 35°<br />
Flat Polar Quartic<br />
equal area projection<br />
40<br />
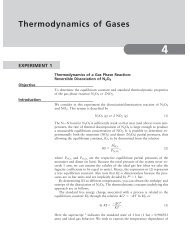
Figure 3.5 Crude death rate. This map<br />
shows deaths per thousand population per<br />
year. (Source: <strong>Population</strong> Reference Bureau.)<br />
100 80 60 40 20<br />
shortcomings. First is the inexorable stage-by-stage progression<br />
implicit in the model. Have countries or regions<br />
ever skipped a stage or regressed? Certainly. The case of<br />
China shows how policy, in this case government-imposed<br />
restrictions on births, can fast-forward an entire nation to<br />
stage 4 (see Subject to Debate). War, too, can occasion a<br />
return to an earlier stage in the model by increasing death<br />
rates. For instance, Angola and Afghanistan are two countries<br />
with recent histories of conflict and with some of the<br />
highest death rates in the world: 24 per 1000 and 18 per<br />
1000, respectively. In other cases, wealth has not led to<br />
declining<br />
Maps.com<br />
fertility. Thanks to oil exports, residents of Saudi<br />
WH <strong>Freeman</strong> and Company Publishers<br />
Domosh/The Human Mosaic, 12e<br />
Perm Fig: 305<br />
Domosh_Fig3.05a - Death Rate<br />
April 20, 2011 - Final<br />
Cyan Magenta Yellow Black<br />
Arabia enjoy relatively high average incomes; but fertility,<br />
too, remains relatively high at nearly 4 children per woman<br />
in 2010. Indeed, the <strong>Population</strong> Reference Bureau has<br />
pointed to a “demographic divide” between countries<br />
where the demographic transition model applies well and<br />
others—mostly poorer countries or those experiencing<br />
widespread conflict or disease—where birth and death<br />
rates do not necessarily follow the model’s predictions.<br />
Even in Europe, there are countries where fertility has<br />
dropped precipitously, while at the same time death rates<br />
have escalated. In countries such as Russia, which, according<br />
to Peter Coclanis, has “somehow managed to reverse