2005 Annual Report - Investor Relations - Sherwin-Williams
2005 Annual Report - Investor Relations - Sherwin-Williams
2005 Annual Report - Investor Relations - Sherwin-Williams

You also want an ePaper? Increase the reach of your titles
YUMPU automatically turns print PDFs into web optimized ePapers that Google loves.
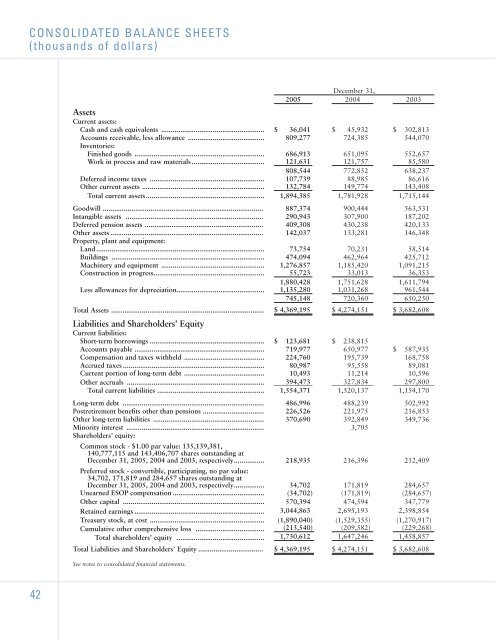
CONSOLIDATED BALANCE SHEETS<br />
(thousands of dollars)<br />
December 31,<br />
<strong>2005</strong> 2004 2003<br />
Assets<br />
Current assets:<br />
Cash and cash equivalents ...................................................... $ 36,041 $ 45,932 $ 302,813<br />
Accounts receivable, less allowance ........................................ 809,277 724,385 544,070<br />
Inventories:<br />
Finished goods .................................................................... 686,913 651,095 552,657<br />
Work in process and raw materials ...................................... 121,631 121,757 85,580<br />
808,544 772,852 638,237<br />
Deferred income taxes ............................................................ 107,739 88,985 86,616<br />
Other current assets ................................................................ 132,784 149,774 143,408<br />
Total current assets.............................................................. 1,894,385 1,781,928 1,715,144<br />
Goodwill .................................................................................... 887,374 900,444 563,531<br />
Intangible assets ........................................................................ 290,943 307,900 187,202<br />
Deferred pension assets .............................................................. 409,308 430,238 420,133<br />
Other assets ................................................................................ 142,037 133,281 146,348<br />
Property, plant and equipment:<br />
Land ........................................................................................ 73,754 70,231 58,514<br />
Buildings ................................................................................ 474,094 462,964 425,712<br />
Machinery and equipment ...................................................... 1,276,857 1,185,420 1,091,215<br />
Construction in progress.......................................................... 55,723 33,013 36,353<br />
1,880,428 1,751,628 1,611,794<br />
Less allowances for depreciation.............................................. 1,135,280 1,031,268 961,544<br />
745,148 720,360 650,250<br />
Total Assets ................................................................................ $ 4,369,195 $ 4,274,151 $ 3,682,608<br />
Liabilities and Shareholders’ Equity<br />
Current liabilities:<br />
Short-term borrowings ............................................................ $ 123,681 $ 238,815<br />
Accounts payable .................................................................... 719,977 650,977 $ 587,935<br />
Compensation and taxes withheld .......................................... 224,760 195,739 168,758<br />
Accrued taxes .......................................................................... 80,987 95,558 89,081<br />
Current portion of long-term debt .......................................... 10,493 11,214 10,596<br />
Other accruals ........................................................................ 394,473 327,834 297,800<br />
Total current liabilities ........................................................ 1,554,371 1,520,137 1,154,170<br />
Long-term debt .......................................................................... 486,996 488,239 502,992<br />
Postretirement benefits other than pensions ................................ 226,526 221,975 216,853<br />
Other long-term liabilities .......................................................... 370,690 392,849 349,736<br />
Minority interest ........................................................................ 3,705<br />
Shareholders’ equity:<br />
Common stock - $1.00 par value: 135,139,381,<br />
140,777,115 and 143,406,707 shares outstanding at<br />
December 31, <strong>2005</strong>, 2004 and 2003, respectively................ 218,935 216,396 212,409<br />
Preferred stock - convertible, participating, no par value:<br />
34,702, 171,819 and 284,657 shares outstanding at<br />
December 31, <strong>2005</strong>, 2004 and 2003, respectively................ 34,702 171,819 284,657<br />
Unearned ESOP compensation ................................................ (34,702) (171,819) (284,657)<br />
Other capital .......................................................................... 570,394 474,594 347,779<br />
Retained earnings .................................................................... 3,044,863 2,695,193 2,398,854<br />
Treasury stock, at cost ............................................................ (1,890,040) (1,529,355) (1,270,917)<br />
Cumulative other comprehensive loss .................................... (213,540) (209,582) (229,268)<br />
Total shareholders’ equity .............................................. 1,730,612 1,647,246 1,458,857<br />
Total Liabilities and Shareholders’ Equity .................................. $ 4,369,195 $ 4,274,151 $ 3,682,608<br />
See notes to consolidated financial statements.<br />
42