- Page 1 and 2:
World in Transition German Advisory
- Page 3 and 4:
Members of the German Advisory Coun
- Page 5 and 6:
German Advisory Council on Global C
- Page 7 and 8:
VI Dr Helmut Kraus (University of B
- Page 9 and 10:
VIII G 4 G 5 H H 1 H 2 H 3 H 4 H 5
- Page 11 and 12:
X D 1.3.1.3 D 1.3.1.4 D 1.3.1.5 D 1
- Page 13 and 14:
XII E 3.3.1.1 E 3.3.1.2 E 3.3.2 E 3
- Page 15 and 16:
XIV F 4.3 F 5 F 5.1 F 5.1.1 F 5.1.2
- Page 17 and 18:
XVI J I 2.4 I 2.5 I 2.5.1 I 2.5.2 I
- Page 19 and 20:
XVIII L K 2.4.12 K 2.4.13 K 2.4.14
- Page 21 and 22:
XX Box E 3.9-2 Box E 3.9-3 Box E 3.
- Page 23 and 24:
Figures Figure C 1.2-1 Figure C 1.3
- Page 25 and 26:
Acronyms ACFM AGDW AIA AIDS ATBI´s
- Page 27 and 28:
XXVI NIH NPP OECD ÖPUL PCR PEFC PI
- Page 30 and 31:
Summary for Policymakers A 3 Overco
- Page 32 and 33:
Summary for Policymakers A 5 vation
- Page 34:
Introduction: Humanity reconstructs
- Page 37 and 38:
10 B Introduction Box B-1 Biosphere
- Page 39 and 40:
12 B Introduction Box B-2 Sustainab
- Page 42 and 43:
The biosphere-centred network of in
- Page 44 and 45:
Trends of global change in the bios
- Page 46 and 47:
Impact loops in the biosphere-centr
- Page 48 and 49:
Impact loops in the biosphere-centr
- Page 50 and 51:
Impact loops in the biosphere-centr
- Page 52 and 53:
Impact loops in the biosphere-centr
- Page 54 and 55:
Impact loops as core elements of sy
- Page 56:
Genetic diversity and species diver
- Page 59 and 60:
32 D The use of genetic and species
- Page 61 and 62:
34 D The use of genetic and species
- Page 63 and 64:
36 D The use of genetic and species
- Page 65 and 66:
38 D The use of genetic and species
- Page 67 and 68:
40 D The use of genetic and species
- Page 69 and 70:
42 D The use of genetic and species
- Page 71 and 72:
44 D The use of genetic and species
- Page 73 and 74:
46 D The use of genetic and species
- Page 75 and 76:
48 D The use of genetic and species
- Page 77 and 78:
50 D The use of genetic and species
- Page 79 and 80:
D 3 Focal issues D 3.1 Trade in end
- Page 81 and 82:
54 D The use of genetic and species
- Page 83 and 84:
56 D The use of genetic and species
- Page 85 and 86:
58 D The use of genetic and species
- Page 87 and 88:
60 D The use of genetic and species
- Page 89 and 90:
62 D The use of genetic and species
- Page 91 and 92:
64 D The use of genetic and species
- Page 93 and 94:
66 D The use of genetic and species
- Page 95 and 96:
68 D The use of genetic and species
- Page 97 and 98:
70 D The use of genetic and species
- Page 99 and 100:
72 D The use of genetic and species
- Page 101 and 102:
74 D The use of genetic and species
- Page 103 and 104:
76 D The use of genetic and species
- Page 105 and 106:
78 D The use of genetic and species
- Page 107 and 108:
80 D The use of genetic and species
- Page 109 and 110:
82 D The use of genetic and species
- Page 111 and 112:
84 D The use of genetic and species
- Page 113 and 114:
86 D The use of genetic and species
- Page 116 and 117:
Natural and cultivated landscapes E
- Page 118 and 119:
From natural to cultivated landscap
- Page 120 and 121:
Development of landscapes under hum
- Page 122 and 123:
Development of the cultivated lands
- Page 124 and 125:
Development of the cultivated lands
- Page 126 and 127:
Development of the cultivated lands
- Page 128 and 129:
Amazonia: Revolution in a fragile e
- Page 130 and 131:
Amazonia: Revolution in a fragile e
- Page 132 and 133:
Introduction of the Nile perch into
- Page 134 and 135:
The Indonesian shallow sea E 2.4 10
- Page 136 and 137:
The Indonesian shallow sea E 2.4 10
- Page 138 and 139:
The Indonesian shallow sea E 2.4 11
- Page 140 and 141:
Perception and evaluation E 3.1 113
- Page 142 and 143:
Perception and evaluation E 3.1 115
- Page 144 and 145:
Perception and evaluation E 3.1 117
- Page 146 and 147:
Spatial and temporal separation of
- Page 148 and 149:
Spatial and temporal separation of
- Page 150 and 151:
Spatial and temporal separation of
- Page 152 and 153:
Sustainable land use E 3.3 125 E 3.
- Page 154 and 155:
Sustainable land use E 3.3 127 tion
- Page 156 and 157:
Sustainable land use E 3.3 129 Box
- Page 158 and 159:
Sustainable land use E 3.3 131 cons
- Page 160 and 161:
Sustainable land use E 3.3 133 Figu
- Page 162 and 163:
Sustainable land use E 3.3 135 from
- Page 164 and 165:
Sustainable land use E 3.3 137 Habi
- Page 166 and 167:
Sustainable land use E 3.3 139 1. O
- Page 168 and 169:
Sustainable land use E 3.3 141 vati
- Page 170 and 171:
Sustainable land use E 3.3 143 used
- Page 172 and 173:
Sustainable land use E 3.3 145 Tabl
- Page 174 and 175:
Sustainable land use E 3.3 147 Box
- Page 176 and 177:
Sustainable land use E 3.3 149 Tabl
- Page 178 and 179:
Sustainable land use E 3.3 151 Tabl
- Page 180 and 181:
Sustainable land use E 3.3 153 Chan
- Page 182 and 183:
Sustainable land use E 3.3 155 rene
- Page 184 and 185:
Sustainable land use E 3.3 157 vati
- Page 186 and 187:
Sustainable land use E 3.3 159 comb
- Page 188 and 189:
Sustainable land use E 3.3 161 Box
- Page 190 and 191:
Sustainable food production from aq
- Page 192 and 193:
Sustainable food production from aq
- Page 194 and 195:
Sustainable food production from aq
- Page 196 and 197: Sustainable food production from aq
- Page 198 and 199: Conserving natural and cultural her
- Page 200 and 201: Conserving natural and cultural her
- Page 202 and 203: Conserving natural and cultural her
- Page 204 and 205: Conserving natural and cultural her
- Page 206 and 207: Introduction of alien species E 3.6
- Page 208 and 209: Introduction of alien species E 3.6
- Page 210 and 211: Introduction of alien species E 3.6
- Page 212 and 213: Tourism as an instrument E 3.7 185
- Page 214 and 215: Tourism as an instrument E 3.7 187
- Page 216 and 217: Tourism as an instrument E 3.7 189
- Page 218 and 219: The role of sustainable urban devel
- Page 220 and 221: The role of sustainable urban devel
- Page 222 and 223: The role of sustainable urban devel
- Page 224 and 225: Integrating conservation and use at
- Page 226 and 227: Integrating conservation and use at
- Page 228 and 229: Integrating conservation and use at
- Page 230 and 231: Integrating conservation and use at
- Page 232 and 233: Integrating conservation and use at
- Page 234: The biosphere in the Earth System F
- Page 237 and 238: 210 F The biosphere in the Earth Sy
- Page 239 and 240: 212 F The biosphere in the Earth Sy
- Page 241 and 242: 214 F The biosphere in the Earth Sy
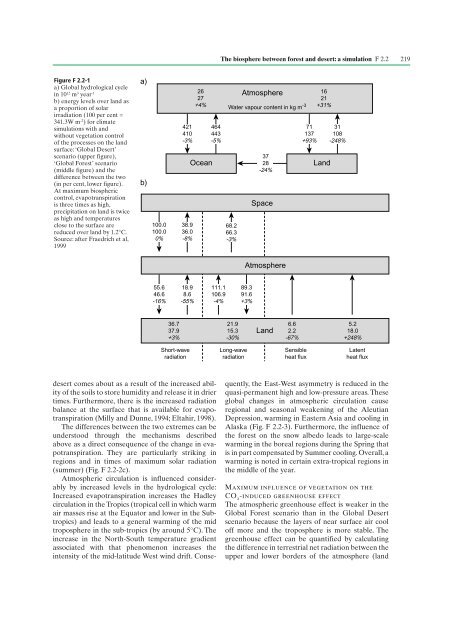
- Page 243 and 244: F 2 The global climate between fore
- Page 245: 218 F The biosphere in the Earth Sy
- Page 249 and 250: 222 F The biosphere in the Earth Sy
- Page 251 and 252: F 3 The biosphere in global transit
- Page 253 and 254: 226 F The biosphere in the Earth Sy
- Page 255 and 256: 228 F The biosphere in the Earth Sy
- Page 257 and 258: 230 F The biosphere in the Earth Sy
- Page 259 and 260: 232 F The biosphere in the Earth Sy
- Page 261 and 262: 234 F The biosphere in the Earth Sy
- Page 263 and 264: 236 F The biosphere in the Earth Sy
- Page 265 and 266: F 5 Critical elements of the biosph
- Page 267 and 268: 240 F The biosphere in the Earth Sy
- Page 269 and 270: 242 F The biosphere in the Earth Sy
- Page 271 and 272: 244 F The biosphere in the Earth Sy
- Page 274: Biosphere-anthroposphere linkages:
- Page 277 and 278: 250 G Biosphere-anthroposphere link
- Page 279 and 280: 252 G Biosphere-anthroposphere link
- Page 281 and 282: G2 The mechanism of the Overexploit
- Page 283 and 284: 256 G Biosphere-anthroposphere link
- Page 285 and 286: 258 G Biosphere-anthroposphere link
- Page 287 and 288: 260 G Biosphere-anthroposphere link
- Page 289 and 290: G 3 Disposition of forest ecosystem
- Page 291 and 292: 264 G Biosphere-anthroposphere link
- Page 293 and 294: 266 G Biosphere-anthroposphere link
- Page 295 and 296: 268 G Biosphere-anthroposphere link
- Page 297 and 298:
G5 Political implications of the sy
- Page 300:
Valuing the biosphere: An ethical a
- Page 303 and 304:
276 H Valuing the biosphere: An eth
- Page 305 and 306:
278 H Valuing the biosphere: An eth
- Page 307 and 308:
280 H Valuing the biosphere: An eth
- Page 309 and 310:
282 H Valuing the biosphere: An eth
- Page 311 and 312:
H 5 Economic valuation of biosphere
- Page 313 and 314:
286 H Valuing the biosphere: An eth
- Page 315 and 316:
288 H Valuing the biosphere: An eth
- Page 317 and 318:
290 H Valuing the biosphere: An eth
- Page 319 and 320:
292 H Valuing the biosphere: An eth
- Page 321 and 322:
H 6 The ethics of conducting negoti
- Page 323 and 324:
296 H Valuing the biosphere: An eth
- Page 325 and 326:
298 H Valuing the biosphere: An eth
- Page 328 and 329:
A guard rail strategy for biosphere
- Page 330 and 331:
Third biological imperative: mainta
- Page 332 and 333:
Fourth biological imperative: prese
- Page 334 and 335:
Conclusion: an explicit guard rail
- Page 336 and 337:
Tasks and issues I 2.1 309 • Pres
- Page 338 and 339:
Tasks and issues I 2.1 311 basis of
- Page 340 and 341:
Approaches under international law
- Page 342 and 343:
Approaches under international law
- Page 344 and 345:
Approaches for positive regulations
- Page 346 and 347:
Approaches for positive regulations
- Page 348 and 349:
Motivational approaches I 2.4 321 t
- Page 350 and 351:
Motivational approaches I 2.4 323 c
- Page 352 and 353:
Environmental education and environ
- Page 354 and 355:
Environmental education and environ
- Page 356 and 357:
Environmental education and environ
- Page 358 and 359:
Environmental education and environ
- Page 360 and 361:
Environmental education and environ
- Page 362 and 363:
Focuses of implementation I 3.2 335
- Page 364 and 365:
Focuses of implementation I 3.2 337
- Page 366 and 367:
Focuses of implementation I 3.2 339
- Page 368 and 369:
Focuses of implementation I 3.2 341
- Page 370 and 371:
The role of the Biodiversity Conven
- Page 372 and 373:
The role of the Biodiversity Conven
- Page 374 and 375:
The role of the Biodiversity Conven
- Page 376 and 377:
The role of the Biodiversity Conven
- Page 378 and 379:
Agreements and arrangements under t
- Page 380 and 381:
Incentive instruments, funds and in
- Page 382 and 383:
Incentive instruments, funds and in
- Page 384:
Incentive instruments, funds and in
- Page 388 and 389:
Research strategy for the biosphere
- Page 390 and 391:
Preserving the integrity of bioregi
- Page 392 and 393:
Maintaining biopotential for the fu
- Page 394 and 395:
Preserving the global natural herit
- Page 396 and 397:
Preserving the regulatory functions
- Page 398 and 399:
Monitoring and remote sensing J 2.3
- Page 400 and 401:
Biological-ecological basic researc
- Page 402:
Socio-economic basic research J 3.2
- Page 406 and 407:
The foundations of a strategy for a
- Page 408 and 409:
Focal areas of implementation K 2 K
- Page 410 and 411:
Governments and government institut
- Page 412 and 413:
Governments and government institut
- Page 414 and 415:
International institutions K 2.4 38
- Page 416 and 417:
International institutions K 2.4 38
- Page 418 and 419:
International institutions K 2.4 39
- Page 420:
A worldwide system of protected are
- Page 424 and 425:
References L 397 Abramovitz, J N (1
- Page 426 and 427:
References L 399 Berlyne, E D (1974
- Page 428 and 429:
References L 401 Campfire Associati
- Page 430 and 431:
References L 403 Promoting the Cons
- Page 432 and 433:
References L 405 fied Organisms. UB
- Page 434 and 435:
References L 407 Gollin, M A (1993)
- Page 436 and 437:
References L 409 Herzog-Schröder,
- Page 438 and 439:
References L 411 Kaufmann, L S (199
- Page 440 and 441:
References L 413 Leader-Williams, N
- Page 442 and 443:
References L 415 Sustaining Society
- Page 444 and 445:
References L 417 of forest recreati
- Page 446 and 447:
References L 419 Pott, R (1993) Far
- Page 448 and 449:
References L 421 pp109-140. Scharpf
- Page 450 and 451:
References L 423 schutz und die Wid
- Page 452 and 453:
References L 425 des Naturschutzes
- Page 454 and 455:
References L 427 Wold, C (1998) ‘
- Page 456:
Glossary M
- Page 459 and 460:
432 M Glossary the ecosystems in a
- Page 461 and 462:
434 M Glossary terized by its high
- Page 464:
The German Advisory Council on Glob
- Page 467 and 468:
440 N The German Advisory Council o
- Page 470 and 471:
Index O 443 A Aalborg Charter 194-1
- Page 472 and 473:
Index O 445 Especially as Waterfowl
- Page 474 and 475:
Index O 447 habitats 52, 81, 154, 1
- Page 476 and 477:
Index O 449 phytotherapy; see also
- Page 478:
Index O 451 United Nations Conferen