The convolution algorithm - Zoo
The convolution algorithm - Zoo
The convolution algorithm - Zoo

You also want an ePaper? Increase the reach of your titles
YUMPU automatically turns print PDFs into web optimized ePapers that Google loves.
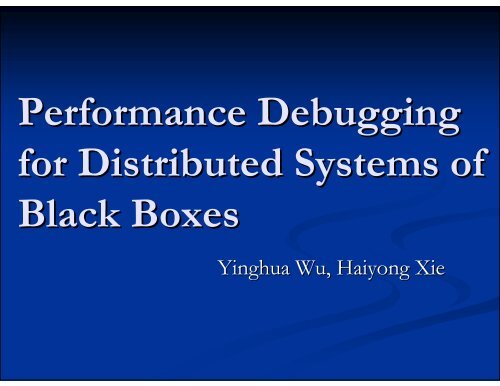
Performance Debugging<br />
for Distributed Systems of<br />
Black Boxes<br />
Yinghua Wu, Haiyong Xie
Outline<br />
•Problem Problem statement & goals<br />
•Overview of our approach<br />
•Algorithms<br />
• <strong>The</strong> nesting <strong>algorithm</strong> (RPC)<br />
• <strong>The</strong> <strong>convolution</strong> <strong>algorithm</strong> (RPC or free-form)<br />
form)<br />
•Experimental results<br />
•Visualization GUI<br />
•Related Related work<br />
•Conclusions
Motivation<br />
• Complex distributed systems<br />
• Built from black box components<br />
• Heavy communications traffic<br />
• Bottlenecks at some specific nodes<br />
• <strong>The</strong>se systems may have performance problems<br />
• High or erratic latency<br />
• Caused by complex system interactions<br />
• Isolating performance bottlenecks is hard<br />
• We cannot always examine or modify system<br />
components<br />
• We need tools to infer where bottlenecks are<br />
• Choose which black boxes to open
Example multi-tier tier system<br />
client<br />
client<br />
web server<br />
web server<br />
web server<br />
application<br />
server<br />
application<br />
server<br />
authentication<br />
server<br />
100ms<br />
database<br />
server<br />
database<br />
server
Goals<br />
• Isolating performance bottlenecks<br />
• Find high-impact<br />
impact causal path patterns<br />
• Causal path: : series of nodes that sent/received messages.<br />
Each message is caused by receipt of previous message,<br />
and Some causal paths occur many times<br />
• High-impact<br />
impact: : occurs frequently, and contributes<br />
significantly to overall latency<br />
• Identify high-latency<br />
nodes on high-impact<br />
impact<br />
patterns<br />
• Add significant latency to these patterns<br />
<strong>The</strong>n What should We do?<br />
------- Messages Trace is enough
<strong>The</strong> Black Box<br />
Complex distributed<br />
system built from<br />
“black boxes”<br />
Performance<br />
bottlenecks<br />
• Desired properties<br />
• Zero-knowledge, zero-instrumentation,<br />
zero-perturbation<br />
• Scalability<br />
• Accuracy<br />
• Efficiency (time and space)
Outline<br />
•Problem Problem statement & goals<br />
•Overview of our approach<br />
•Algorithms<br />
• <strong>The</strong> nesting <strong>algorithm</strong> (RPC)<br />
• <strong>The</strong> <strong>convolution</strong> <strong>algorithm</strong> (RPC or free-form)<br />
form)<br />
•Experimental results<br />
•Visualization GUI<br />
•Related Related work<br />
•Conclusions
Overview of Approach<br />
• Obtain traces of messages between components<br />
• Ethernet packets, middleware messages, etc.<br />
• Collect traces as non-invasively as possible<br />
• Require very little information:<br />
[timestamp, source, destination, call/return, call-id<br />
id]<br />
• Analyze traces using our <strong>algorithm</strong>s<br />
• Nesting: : faster, more accurate, limited to RPC-style systems<br />
• Convolution: : works for all message-based systems<br />
• Visualize results and highlight high-impact impact paths
Recap. causal path<br />
client<br />
client<br />
web server<br />
web server<br />
web server<br />
application<br />
server<br />
application<br />
server<br />
authentication<br />
server<br />
100ms<br />
database<br />
server<br />
database<br />
server
Challenges<br />
• Trace contain interleaved messages<br />
from many causal paths<br />
• How to identify causal paths?<br />
• Causality trace by Timestamp<br />
• Want only statistically significant causal<br />
paths<br />
• How to differentiate significance?<br />
• It is easy! <strong>The</strong>y appear repeatedly
Outline<br />
•Problem Problem statement & goals<br />
•Overview of our approach<br />
•Algorithms<br />
• <strong>The</strong> nesting <strong>algorithm</strong> (RPC)<br />
• <strong>The</strong> <strong>convolution</strong> <strong>algorithm</strong> (RPC or free-form)<br />
form)<br />
•Experimental results<br />
•Visualization GUI<br />
•Related Related work<br />
•Conclusions
<strong>The</strong> nesting <strong>algorithm</strong><br />
• Depends on RPC-style communication<br />
• Infers causality from “nesting” relationships by<br />
message timestamps<br />
• Suppose A calls B and B calls C before returning to A<br />
• <strong>The</strong>n the B↔C call is “nested” in the A↔B call<br />
• Uses statistical correlation<br />
node A node B node C<br />
call<br />
time<br />
call<br />
return<br />
return
Nesting: an example causal path<br />
Consider this system of 4 nodes<br />
Looking for internal delays at each node<br />
C<br />
node A node B node C<br />
call<br />
node D<br />
A<br />
B<br />
D<br />
time<br />
call<br />
return<br />
call<br />
return<br />
return
Steps of the nesting <strong>algorithm</strong><br />
1. Pair call and return messages<br />
• (A⇒B, B⇒A), (B⇒D, D⇒B) D B), , (B⇒C,(<br />
C⇒B) C<br />
2. Find and score all nesting relationships<br />
• B→C C nested in A→BA<br />
• B→D D also nested in A→BA<br />
3. Pick best parents<br />
• Here: unambiguous<br />
4. Reconstruct call paths<br />
• A→B→[C ; D]<br />
node A node B node C<br />
call<br />
time<br />
call<br />
return<br />
call<br />
node D<br />
O(m) ) run time<br />
m = number of messages<br />
return<br />
return
Pseudo-code for the nesting<br />
<strong>algorithm</strong><br />
• Detects calls pairs and find all possible nestings of one<br />
call pair in another<br />
• Pick the most likely candidate for the causing call for<br />
each call pair<br />
• procedure Derive FindCallPairs call paths from the causal relationships<br />
for each trace entry (t1, CALL/RET, sender A, receiver B, callid id)<br />
case CALL: procedure ScoreNestings<br />
store (t1,CALL,A,B,id) for each child in (B, Topencalls C, t2, t3) procedure in Tcallpairs FindCallPaths<br />
case RETURN: for each parent (A, B, t1, initialize t4) in hash child.parents table Tpaths<br />
find matching scoreboard[A, entry (t2, CALL, B, C, B, t2-t1] for each<br />
A, id) += callpair<br />
in Topencalls (1/|child.parents|) (A, B, t1, t2)<br />
if callpair.parents = null then<br />
if match is found then<br />
remove procedure entry from FindNestedPairs root := { CreatePathNode(callpair, t1) }<br />
Topencalls<br />
update for entry each with child return (B; C; message t2; t3) if<br />
timestamp in root call pairs is in Tpaths then update its latencies<br />
t2<br />
add entry maxscore to Tcallpairs := 0 else add root to Tpaths<br />
entry.parents for each := {all p (A, callpairs B, t1, (t3, t4) function in CALL, child.parents CreatePathNode(callpair (A, B, t1, t4), tp)<br />
X, A, id2) in Topencalls with t3 < t2}<br />
score[p] := scoreboard[A, node B, := C, new t2-t1]*penalty node with name B<br />
if (score[p] > maxscore) node.latency then := t4 - t1<br />
maxscore := score[p] node.call_delay := t1 - tp<br />
parent := p for each child in callpair.children<br />
parent.children := parent.children node.edges U {child} := node.edges U { CreatePathNode(child, t1)}<br />
return node
Inferring nesting<br />
• An example of Parallel calls<br />
−Local info not enough<br />
−Use aggregate info<br />
−Histograms keep track of<br />
possible latencies<br />
−Medium-length delay<br />
will be selected<br />
−Assign nesting<br />
−Heuristic methods<br />
node A node B node C<br />
time<br />
t3<br />
t4<br />
t1<br />
t2
Outline<br />
•Problem Problem statement & goals<br />
•Overview of our approach<br />
•Algorithms<br />
• <strong>The</strong> nesting <strong>algorithm</strong><br />
• <strong>The</strong> <strong>convolution</strong> <strong>algorithm</strong><br />
•Experimental results<br />
•Visualization GUI<br />
•Related Related work<br />
•Conclusions
<strong>The</strong> <strong>convolution</strong> <strong>algorithm</strong><br />
•“Time Time signal” of messages for each<br />
<br />
• A sent message to B at times 1,2,5,6,7<br />
1 2 3 4 5 6 7 time<br />
S1(t)= A→B messages
<strong>The</strong> <strong>convolution</strong> <strong>algorithm</strong><br />
•Look Look for time-shifted similarities<br />
• Compute <strong>convolution</strong> X(t) ) = S 2 (t) ⊗ S 1 (t)<br />
• Use Fast Fourier Transforms<br />
S 1<br />
(t)<br />
(A→B)<br />
S 2<br />
(t)<br />
(B→C)<br />
X(t)<br />
Peaks in X(t) suggest<br />
causality between<br />
A→B and B→C<br />
Time shift of a peak<br />
indicates delay
Convolution details<br />
•Time Time complexity: O(em+eVlogV)<br />
• m = messages<br />
• e = output edges<br />
• V = number of time steps in trace<br />
•Need Need to choose time step size<br />
• Must be shorter than delays of interest<br />
• Too coarse: poor accuracy<br />
• Too fine: long running time<br />
•Robust Robust to noise in trace
Algorithm comparison<br />
• Nesting<br />
• Looks at individual paths and then aggregates<br />
• Finds rare paths<br />
• Requires call/return style communication<br />
• Fast enough for real-time analysis<br />
• Convolution<br />
• Applicable to a broader class of systems<br />
• Slower: more work with less information<br />
• May need to try different time steps to get good<br />
results<br />
• Reasonable for off-line analysis
Summarize<br />
Communication<br />
style<br />
Rare events<br />
Level of<br />
Trace detail<br />
Time and space<br />
complexity<br />
Visualization<br />
Nesting Algorithm<br />
RPC only<br />
Yes, but hard<br />
<br />
+<br />
call/return tag<br />
Linear space<br />
Linear time<br />
RPC call and return combined<br />
More compact<br />
Convolution Algorithm<br />
RPC or free-form messages<br />
No<br />
<br />
Linear space<br />
Polynomial time<br />
Less compact
Outline<br />
• Problem statement & goals<br />
• Overview of our approach<br />
• Algorithms<br />
• Experimental results<br />
• Maketrace: : a trace generator<br />
• Maketrace web server simulation<br />
• Pet Store EJB traces<br />
• Execution costs<br />
• Visualization GUI<br />
• Related work<br />
• Conclusions
Maketrace<br />
• Synthetic trace generator<br />
• Needed for testing<br />
• Validate output for known input<br />
• Check corner cases<br />
• Uses set of causal path templates<br />
• All call and return messages, with latencies<br />
• Delays are x ± y seconds, Gaussian normal<br />
distribution<br />
• Recipe to combine paths<br />
• Parallelism, start/stop times for each path<br />
• Duration of trace
Desired results for one trace<br />
•Causal Causal paths<br />
• How often<br />
• How much time spent<br />
•NodesNodes<br />
• Host/component name<br />
• Time spent in node and<br />
all of the nodes it calls<br />
•EdgesEdges<br />
• Time parent waits<br />
before calling child
Measuring Added Delay<br />
• Added 200msec delay<br />
in WS2<br />
• <strong>The</strong> nesting <strong>algorithm</strong><br />
detects the added delay,<br />
and so does the<br />
<strong>convolution</strong> <strong>algorithm</strong>
Results: Petstore<br />
• Sample EJB application<br />
• J2EE middleware for<br />
Java<br />
• Instrumentation from<br />
Stanford’s PinPoint<br />
project<br />
• 50msec delay added in<br />
mylist.jsp
Results: running time<br />
Trace<br />
Length<br />
(messages)<br />
Duration<br />
(sec)<br />
Memory<br />
(MB)<br />
CPU time<br />
(sec)<br />
Nesting<br />
Multi-tier (short)<br />
20,164<br />
50<br />
1.5<br />
0.23<br />
Multi-tier<br />
202,520<br />
500<br />
13.8<br />
2.27<br />
Multi-tier (long)<br />
2,026,658<br />
5,000<br />
136.8<br />
23.97<br />
PetStore<br />
234,036<br />
2,000<br />
18.4<br />
2.92<br />
Convolution (20 ms time step)<br />
PetStore<br />
234,036 2,000<br />
More details and results in paper<br />
25.0<br />
6,301.00
Accuracy vs. parallelism<br />
• Increased parallelism degrades accuracy slightly<br />
• Parallelism is number of paths active at same<br />
time<br />
false positives<br />
60<br />
40<br />
20<br />
0<br />
0 100 200 300 400 500<br />
parallelism per node
Other results for nesting<br />
•Clock Clock skew<br />
<strong>algorithm</strong><br />
• Little effect on accuracy with skew ≤ delays of<br />
interest<br />
•Drop Drop rate<br />
• Little effect on accuracy with drop rates ≤ 5%<br />
•Delay Delay variance<br />
• Robust to ≤ 30% variance<br />
•Noise Noise in the trace<br />
• Only matters if same nodes send noise<br />
• Little effect on accuracy with ≤ 15% noise
• Goal: highlight<br />
dominant paths<br />
• Paths sorted<br />
• By frequency<br />
• By total time<br />
• Red highlights<br />
• High-cost<br />
nodes<br />
• Timeline<br />
• Nested calls<br />
• Dominant<br />
subcalls<br />
• Time plots<br />
• Node time<br />
• Call delay<br />
Visualization GUI
Related work<br />
• Systems that trace end-to<br />
to-end causality via<br />
modified middleware using modified JVM or<br />
J2EE layers<br />
• Magpie (Microsoft Research), aimed at<br />
performance debugging<br />
• Pinpoint (Stanford/Berkeley), aimed at locating<br />
faults<br />
• Products such as AppAssure, PerformaSure,<br />
OptiBench<br />
•Systems that make inferences from traces<br />
• Intrusion detection (Zhang & Paxson, , LBL) uses<br />
traces + statistics to find compromised systems
Future work<br />
•Automate trace gathering and<br />
conversion<br />
•Sliding-window versions of <strong>algorithm</strong>s<br />
• Find phased behavior<br />
• Reduce memory usage of nesting<br />
<strong>algorithm</strong><br />
• Improve speed of <strong>convolution</strong> <strong>algorithm</strong><br />
•Validate usefulness on more<br />
complicated systems
Conclusions<br />
• Looking for bottlenecks in black box systems<br />
• Finding causal paths is enough to find<br />
bottlenecks<br />
• Algorithms to find paths in traces really work<br />
• We find correct latency distributions<br />
• Two very different <strong>algorithm</strong>s get similar<br />
results<br />
• Passively collected traces have sufficient<br />
information