The Volvo Group Annual Report 2010
The Volvo Group Annual Report 2010
The Volvo Group Annual Report 2010

Create successful ePaper yourself
Turn your PDF publications into a flip-book with our unique Google optimized e-Paper software.
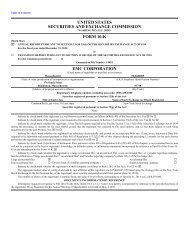
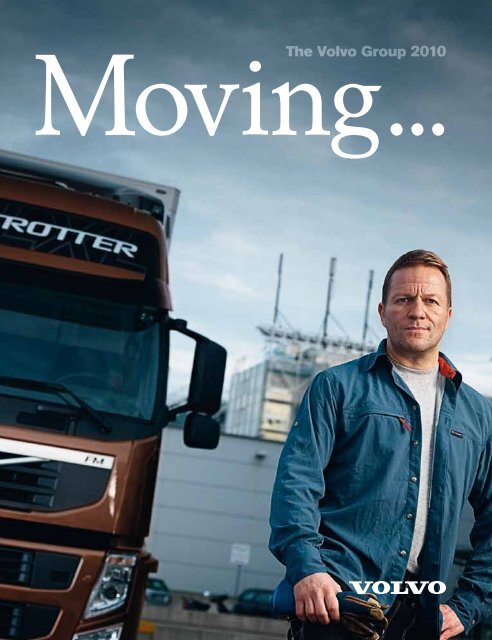
Moving<br />
<strong>The</strong> <strong>Volvo</strong> <strong>Group</strong><br />
...<br />
<strong>2010</strong>
A global group<br />
1 CEO comment<br />
4 Presence on all continents<br />
6 <strong>The</strong> <strong>Volvo</strong> <strong>Group</strong>’s product offering<br />
8 Moving the world – New York<br />
10 Vision, mission and values<br />
11 Overall strategies<br />
12 Profitable growth<br />
13 Operational Excellence<br />
14 Product renewal<br />
16 Strength factors<br />
17 <strong>Volvo</strong> Financial goals<br />
18 World-class services<br />
20 Moving the world – London<br />
22 Market overview<br />
Board of Directors’ report<br />
24 Significant events<br />
26 Organisation<br />
28 Trucks<br />
32 Buses<br />
34 Construction Equipment<br />
36 <strong>Volvo</strong> Penta<br />
38 <strong>Volvo</strong> Aero<br />
40 <strong>Volvo</strong> Financial Services<br />
42 Moving the world – Australia<br />
44 Sustainable development<br />
50 Moving the world – Stockholm<br />
52 Financial strategy<br />
53 Risks and uncertainties<br />
56 <strong>The</strong> share<br />
58 Financial performance<br />
62 Financial position<br />
64 Cash-flow statement<br />
Financial information<br />
66 Financial information <strong>2010</strong><br />
67 Consolidated income statement and<br />
Other comprehensive income<br />
68 Consolidated balance sheet<br />
69 Changes in consolidated<br />
Shareholders’ equity<br />
70 Consolidated cash-flow statement<br />
71 Notes to consolidated financial<br />
statements<br />
114 Parent Company AB <strong>Volvo</strong><br />
126 Proposed remuneration policy<br />
127 Proposed disposition of<br />
unappropriated earnings<br />
128 Audit <strong>Report</strong> for AB <strong>Volvo</strong><br />
129 Eleven-year summary<br />
Corporate Governance <strong>Report</strong><br />
138 <strong>Group</strong> Management<br />
140 Board of Directors and Auditors<br />
142 Corporate Governance <strong>Report</strong><br />
Fold-out Definitions<br />
<strong>Annual</strong> General Meeting<br />
... the<br />
Without the products and services of the <strong>Volvo</strong> <strong>Group</strong> there<br />
can be no modern society like we know it. Like lifeblood, our trucks, buses,<br />
engines, construction equipment and aircraft components are involved in many of the<br />
functions that most of us rely on every day.<br />
For instance, one in seven meals eaten in Europe reaches the<br />
consumers thanks to trucks from the <strong>Volvo</strong> <strong>Group</strong> rolling on the roads of the continent.<br />
Buses are the most common type of public transportation in the world,<br />
helping many people to reach work, school, vacations, friends and family.<br />
And if all the <strong>Volvo</strong> buses in the world were to start at the same time, they would transport<br />
more than 10 million people.<br />
Most of us want to be able to fly far away sometime, either at work or to explore a new<br />
part of the world. In 2009, <strong>Volvo</strong> Aero delivered components for over 90% of all large<br />
civilian aircraft engines.<br />
Every year, the population on earth produces billions of tons of garbage.<br />
In the US alone, the garbage removed by refuse trucks from the <strong>Volvo</strong> <strong>Group</strong> every week<br />
could form a line of full garbage cans that would reach the moon.<br />
<strong>The</strong>se are just a few examples. In this <strong>Annual</strong> <strong>Report</strong>, you can learn more about the<br />
importance of the <strong>Volvo</strong> <strong>Group</strong> in every day life. How we are the lifeblood of modern<br />
society – Moving the world.<br />
This report contains ‘forward-looking statements’. Such<br />
statements reflect management’s current expectations<br />
with respect to certain future events and potential financial<br />
performance. Although the Company believes that the<br />
expectations reflected in such forward looking statements<br />
are reasonable, no assurance can be given that<br />
such expectations will prove correct. Such statements are<br />
subject to risk and uncertainties and such future events<br />
and financial performance could differ materially from<br />
those set out in the forward looking statements as a result<br />
of, among other factors, (i) changes in economic, market<br />
and competitive conditions, (ii) success of business and<br />
operating initiatives, (iii) changes in the regulatory environment<br />
and other government actions, (iv) fluctuations in<br />
exchange rates and (v) business risk management.<br />
This report does not imply that the company has undertaken<br />
to revise these forward-looking statements, beyond<br />
what is required under the company’s registration contract<br />
with OMX Nordic Exchange Stockholm if and when<br />
circumstances arise that will lead to changes compared to<br />
the date when these statements were provided.<br />
<strong>The</strong> <strong>Volvo</strong> <strong>Group</strong>'s formal financial reports are presented<br />
on pages 24–127 in the printed version and has<br />
been audited by the company's auditors.
<strong>Volvo</strong> <strong>Group</strong><br />
Mo<br />
<strong>The</strong> <strong>Volvo</strong> <strong>Group</strong> is one of the world’s leading providers of commercial<br />
transport solutions, providing such products as trucks, buses,<br />
construction equipment, engines and drive systems for boats and<br />
industrial applications, as well as aircraft engine components. <strong>The</strong><br />
<strong>Volvo</strong> <strong>Group</strong> also offers financial solutions and an increasing<br />
share of other services to its customers.<br />
<strong>The</strong> <strong>Group</strong> has about 90,000 employees, production facilities<br />
in 19 countries, and sales activities in some 180 countries.<br />
Net sales development over ten years, SEK bn<br />
+18% +43%<br />
North America<br />
Europe<br />
Strategy<br />
<strong>The</strong> <strong>Volvo</strong> <strong>Group</strong>’s strategy is based on customers’ requirements<br />
and is focused on profitable growth, product renewal and operational<br />
excellence. More information. & 1 1<br />
2000 <strong>2010</strong><br />
40.7 47.9<br />
2000 <strong>2010</strong><br />
72.1 103.0<br />
90.000<br />
Employees<br />
+458%<br />
South America<br />
Organization<br />
<strong>The</strong> <strong>Volvo</strong> <strong>Group</strong> has product-related business areas that focus<br />
on our customers while the supporting business units work to<br />
make efficient use of <strong>Group</strong>-wide resources.<br />
More information. & 2 6<br />
2000 <strong>2010</strong><br />
5.2 29.0<br />
Trucks<br />
Buses<br />
Construction<br />
Equipment <strong>Volvo</strong> Penta <strong>Volvo</strong> Aero<br />
<strong>Volvo</strong><br />
Financial<br />
Services<br />
segments<br />
<strong>Volvo</strong> 3P<br />
<strong>Volvo</strong> Powertrain<br />
Business units<br />
<strong>Volvo</strong> Parts<br />
<strong>Volvo</strong> Logistics<br />
<strong>Volvo</strong> Business Services<br />
<strong>Volvo</strong> Information Technology<br />
<strong>Volvo</strong> <strong>Group</strong> Real Estate, <strong>Volvo</strong> Technology, <strong>Volvo</strong> Technology Transfer, <strong>Volvo</strong> <strong>Group</strong> NAP
ving the<br />
Share of <strong>Group</strong>’s net sales by geography<br />
Europe, 39%<br />
+644%<br />
Asia<br />
North America, 18%<br />
South America, 11%<br />
Asia, 25%<br />
Rest of the world, 7%<br />
2000 <strong>2010</strong><br />
8.8 65.5<br />
+471%<br />
Rest of the world<br />
2000 <strong>2010</strong><br />
3.4 19.4<br />
Customers<br />
<strong>Volvo</strong> <strong>Group</strong> customers are active in about 180 countries. <strong>Group</strong><br />
sales of products and services are conducted through both wholly<br />
owned and independent dealers. <strong>The</strong> global service network handles<br />
customer demand for spare parts and other services.<br />
More information. & 1 8<br />
Employees<br />
<strong>The</strong> majority of the <strong>Group</strong>’s employees work in Sweden, France, the<br />
U.S. , Japan, China, Brazil and Belgium. More information. & 4 7<br />
Strong positions<br />
• <strong>The</strong> second largest Western manufacturer of trucks.<br />
• No. 4 in construction equipment.<br />
• One of the world’s largest manufacturers of heavy-duty<br />
diesel engines.<br />
• Strong positions also in the other business areas.<br />
• Good market presence globally.<br />
Share of <strong>Group</strong>’s net sales<br />
Trucks 63%<br />
Buses 8%<br />
Construction Equipment 20%<br />
<strong>Volvo</strong> Penta 3%<br />
<strong>Volvo</strong> Aero 3%<br />
Customer Finance 3%
world<br />
<strong>The</strong> <strong>Volvo</strong> <strong>Group</strong>’s vision is to be valued as<br />
the world’s leading provider of commercial<br />
transport solutions.<br />
CEO comment<br />
Recovery, growth<br />
and strengthened<br />
profitability<br />
During <strong>2010</strong>, the<br />
<strong>Volvo</strong> <strong>Group</strong> grew at<br />
a good pace with<br />
increased sales in all regions, improved profitability<br />
and good cash flow. After having reported a<br />
substantial loss in 2009 when the global financial<br />
crisis hit hard and we were forced into considerable<br />
rationalizations, it is pleasing to note<br />
that recovery in growth and profitability has been<br />
swift.<br />
<strong>The</strong> <strong>Group</strong>’s sales of SEK 265 billion during<br />
<strong>2010</strong> represented an increase of 21% compared<br />
with the preceding year. Demand for the <strong>Group</strong>’s<br />
products recovered strongly in essentially all<br />
markets. Demand continued to rise from already<br />
high levels in emerging markets, while in our<br />
mature markets, with the exception of Japan,<br />
there was a significant gain in momentum during<br />
the second half of the year.<br />
Significantly improved earnings<br />
Operating income improved to SEK 18 billion,<br />
compared with the loss of SEK 17 billion the preceding<br />
year. <strong>The</strong> operating margin was 6.8%. <strong>The</strong><br />
improvement in earnings is of course an effect of<br />
us selling more products and services, but it is<br />
also the result of focused work on rationalizing<br />
and streamlining all parts of the <strong>Group</strong>, as well as<br />
our tight grip on costs. <strong>The</strong> combination of<br />
increased profitability with our achievement of<br />
growth without tying up any additional operating<br />
capital resulted in our Industrial Operations generating<br />
an operational cash flow of SEK 19 billion.<br />
In spite of our debt increasing when we were<br />
going through the global financial crisis in 2009,<br />
we made the assessment that we could take it<br />
upon ourselves to reduce our debt by lowering<br />
cost levels and turning around the negative cash<br />
flow. Through hard work, we succeeded in what<br />
we set out to accomplish. Thanks to the improved<br />
profitability and strong cash flow, we once again<br />
stand financially strong, with a net debt in Industrial<br />
Operations that at the close of the year was<br />
down to 37% of shareholders’ equity – in line with<br />
our objective.<br />
We have been fortunate to be able to welcome<br />
the return of increasing numbers of our former<br />
colleagues to the <strong>Volvo</strong> <strong>Group</strong> – colleagues who<br />
sadly had to leave us in conjunction with the<br />
financial crisis but who have now been offered<br />
work again in increasing numbers. It is also pleas-<br />
the volvo<br />
group <strong>2010</strong><br />
Net sales increased by 21% to SEK 264.7<br />
billion<br />
Operating income amounted to SEK 18.0<br />
billion<br />
Operating cash flow of SEK 19.0 billion in<br />
Industrial Operations<br />
Net debt in Industrial Operations reduced<br />
to 37.4% of shareholders’ equity<br />
Proposed dividend of SEK 2.50 per share<br />
Net sales, SEK bn<br />
06 07 08 09<br />
259 285 305 218<br />
10<br />
265<br />
Operating income, SEK bn<br />
06<br />
20.4<br />
07<br />
22.2<br />
08<br />
15.9<br />
09<br />
(17.0)<br />
10<br />
18.0<br />
Key ratios 2009 <strong>2010</strong><br />
Net sales <strong>Volvo</strong> <strong>Group</strong>, SEK M 218,361 264,749<br />
Operating income (loss) <strong>Volvo</strong> <strong>Group</strong>, SEK M (17,013) 18,000<br />
Operating income (loss) Industrial Operations, SEK M (16,333) 17,834<br />
Operating income (loss) Customer Finance, SEK M (680) 167<br />
Operating margin <strong>Volvo</strong> <strong>Group</strong>, % (7.8) 6.8<br />
Income (Loss) after financial items, SEK M (20,573) 15,514<br />
Income(Loss) for the period, SEK M (14,685) 11,212<br />
Diluted earnings per share, SEK (7.26) 5.36<br />
Dividend per share, SEK 0 2.50 1<br />
Return on shareholders' equity, % (19.7) 16.0<br />
1 According to the Board’s proposal.<br />
1
a global group <strong>2010</strong><br />
Continued CEO COMMENT<br />
ing that we have been able to provision SEK 350<br />
M for profit sharing to our employees, since<br />
return on shareholders’ equity for <strong>2010</strong> amounted<br />
to 16%. <strong>The</strong> past two years have required quick<br />
adaptations that we would never have managed<br />
without the extraordinary efforts undertaken by<br />
employees throughout the <strong>Group</strong>.<br />
Based on the much improved profitability and<br />
the significantly reduced debt level, the Board<br />
proposes to resume dividends with a pay-out of<br />
SEK 2.50 per share for the financial year of <strong>2010</strong>.<br />
Improvements within all business areas<br />
<strong>The</strong> improved demand was clearly visible in our<br />
truck operations, with order intake rising by 75%<br />
while deliveries increased by 41%. Order intake<br />
gradually increased from low levels in Europe and<br />
North America. In many emerging markets such<br />
as Brazil and India, demand remained strong. On<br />
the other hand, the Japanese market weakened<br />
during the second half of the year. Net sales in<br />
the truck operations increased 20% to SEK 167<br />
billion and the operating margin improved to<br />
6.0%. <strong>The</strong> positive trend in order intake led to a<br />
gradual increase in the pace of manufacturing<br />
and delivery in most of our truck plants.<br />
<strong>The</strong> growth and profitability development of<br />
Construction Equipment was strong throughout<br />
the year with a gradual improvement in Europe and<br />
North America, and with a very good contribution<br />
from emerging markets, particularly China. Sales<br />
rose 51% to SEK 54 billion and the business area<br />
recorded an operating income of slightly more<br />
than SEK 6 billion. <strong>The</strong> full year operating margin<br />
was 11.5% with a strong finish to the year. We have<br />
increased our market share in the important Chinese<br />
market and now rank as its third largest<br />
manufacturer. We are moving our position forward<br />
further with the launch of SDLG branded excavators<br />
from Lingong and a large number of <strong>Volvo</strong><br />
products.<br />
Buses’ sales increased by 11% and the operating<br />
margin rose to 3.8%. <strong>The</strong> business area had<br />
a positive trend in profitability throughout the<br />
year despite relatively low volumes in the important<br />
markets of Europe and North America. <strong>The</strong><br />
improved profitability is partly a result of increased<br />
sales, but primarily the fruit of considerable<br />
efforts to raise internal efficiency and lower<br />
costs.<br />
<strong>Volvo</strong> Penta turned around with a profit of SEK<br />
578 M and a margin of 6.6% despite continued<br />
weak demand for marine engines. With one of the<br />
industry’s broadest product ranges and a global<br />
network of service and distributors, <strong>Volvo</strong> Penta<br />
is strategically well-positioned to be an innovative<br />
partner to important boat builders. <strong>The</strong> industrial<br />
engine business had a good development and<br />
the aim is to further increase sales of industrial<br />
engines by breaking into new segments of the<br />
market.<br />
<strong>Volvo</strong> Aero’s operating income rose to SEK<br />
286 M despite a loss of SEK 538 M related to the<br />
divestment of the U.S.-based service business.<br />
Core operations developed strongly due to<br />
increased volumes, resulting in improved capacity<br />
utilization, improved productivity and lower costs.<br />
<strong>Volvo</strong> Aero remains well-established with participation<br />
in many interesting engine programs that<br />
will be entering production in coming years.<br />
In our Customer Finance Operations profitability<br />
gradually improved as our customers’ business<br />
activity increased, which in turn led to a more stable<br />
financial situation for them. As a consequence<br />
of the <strong>Volvo</strong> <strong>Group</strong>’s increased sales of new products,<br />
we also see that our credit portfolio is growing<br />
again.<br />
Intensive year of news<br />
We take a long-term view of our business and<br />
what needs to be done to create value for our<br />
customers and to create sustainable profitability.<br />
Accordingly, we maintained our relatively high<br />
investments in product development during both<br />
2009 and <strong>2010</strong>. We also continued to invest in<br />
our plants and sales channels. Combined, this<br />
means that we now stand well-prepared in terms<br />
of both products and capacity.<br />
As one of the world’s largest manufacturers of<br />
commercial vehicles, we have a responsibility to<br />
reduce the impact on the environment caused by<br />
our production as well as the usage of our products<br />
– it is a responsibility that we take most<br />
se riously. Engines that use less fuel lower our<br />
customers’ operating costs and strengthen their<br />
competitiveness while reducing environmental<br />
impact. At the beginning of the year, we introduced<br />
on a broad front in the USA, the new<br />
engines that meet the latest, extremely stringent<br />
requirements on emission levels that are in fact<br />
practically zero for nitrogen oxides and particulates.<br />
Trucks fitted with the new engines have<br />
been well received by both old and new customers<br />
and we are capturing market share in North<br />
America as a consequence. But the truck news<br />
doesn’t end there. In Europe, <strong>Volvo</strong> Trucks<br />
launched the new construction truck <strong>Volvo</strong> FMX<br />
that strengthens the offering within this important<br />
segment of the market. In Japan, UD Trucks,<br />
in conjunction with the introduction of new emission<br />
regulations, launched a new heavy Quon<br />
truck equipped with <strong>Group</strong> engines.<br />
Through Eicher, we have a very strong position<br />
in medium-duty trucks in India and a well-performing<br />
sales network. We are now further developing<br />
Eicher to keep pace with the strong growth<br />
in the country and for export to other countries.<br />
We are developing a new generation of heavyduty<br />
trucks and investing in new assembly capacity.<br />
We are also building a new engine plant that<br />
will be the global base for the medium-duty<br />
engine platform to be launched in increasing<br />
numbers of the <strong>Group</strong>’s products in the coming<br />
years.<br />
<strong>Volvo</strong> CE launched a number of new <strong>Volvo</strong><br />
products during the year. Manufacturing was also<br />
begun in China of the new series of excavators<br />
under the SDLG brand. In addition, <strong>Volvo</strong> CE’s<br />
engines received certification in accordance with<br />
the new environmental rules that are beginning to<br />
be introduced in Europe and North America in<br />
2011. During the year, <strong>Volvo</strong> Buses began mass<br />
production of hybrid buses at its plant in Poland.<br />
This is but a small selection of news for a year<br />
when the pace of renewal remained high for all<br />
business areas.<br />
2
Positive development in the short<br />
and long term<br />
Thanks to hard work and the resolute execution<br />
of cost-cutting measures, the <strong>Volvo</strong> <strong>Group</strong> has<br />
taken itself through the collapse of the global<br />
financial system and emerged as a stronger company<br />
at a time when the economic trend is once<br />
again pointing in the right direction. I can conclude<br />
that both our distributors and our suppliers<br />
are doing a great job, and that together we stand<br />
prepared to meet the expected continuation of<br />
the rise in volumes that we saw during <strong>2010</strong>. We<br />
are continuously working to trim the industrial<br />
system in order to improve productivity and capital<br />
efficiency. We are also intensifying our activities<br />
within product development in preparation<br />
for several important product launches in the<br />
coming years.<br />
Against the background of the <strong>Volvo</strong> <strong>Group</strong>’s<br />
improved profitability, good cash flow, reduced<br />
debt and the improved market outlook, as well as<br />
the investments we have made and continue to<br />
make in our plants and in product development, I<br />
look upon the development of the <strong>Group</strong> with<br />
confidence, both in the short- and the long-term<br />
perspective.<br />
Finally, I would like to say that it has been a<br />
pleasure to work for the <strong>Volvo</strong> <strong>Group</strong> for these<br />
past 14 years and that I wish my successor every<br />
success in leading the <strong>Volvo</strong> <strong>Group</strong> into the<br />
future.<br />
Leif Johansson<br />
President and CEO
EN A global group koncern <strong>2010</strong> <strong>2010</strong><br />
Presence on all continents<br />
Global industrial structure and<br />
strong market channels<br />
Backed by competitive product programs, strong dealers and increasingly more complete<br />
offerings including total solutions with spare parts, workshops, service packages, financing<br />
and leasing, the <strong>Volvo</strong> <strong>Group</strong>’s companies have established leading positions on a global<br />
market.<br />
<strong>The</strong> <strong>Volvo</strong> <strong>Group</strong> has an established and strong<br />
position in Europe, North America, and South<br />
America. Through the acquisitions of UD Trucks<br />
and Lingong and the cooperation within trucks<br />
and buses with India-based Eicher Motors the<br />
position has been strengthened in many markets<br />
in Asia. Through its acquisitions the <strong>Volvo</strong> <strong>Group</strong><br />
has also established a global industrial structure<br />
with manufacturing as well as sales and distribution<br />
channels on all continents.<br />
Trucks<br />
Production facilities North America South America<br />
<strong>Volvo</strong> New River Valley (US) Curitiba (BR)<br />
Renault Trucks<br />
UD Trucks<br />
Mack Trucks Macungie (US) Las Tejerias (VE)<br />
Eicher*<br />
Buses St Claire, St Eustache (CA), Mexico City (MX), Plattsburgh (US) Curitiba (BR)<br />
Construction Equipment Shippensburg (US) Pederneiras (BR)<br />
<strong>Volvo</strong> Penta<br />
Lexington (US)<br />
<strong>Volvo</strong> Aero<br />
Newington (US)<br />
<strong>Volvo</strong> Powertrain Hagerstown (US) Curitiba (BR)<br />
4
Share of <strong>Group</strong>’s net sales<br />
Trucks, 63%<br />
Buses, 8%<br />
Construction Equipment, 20%<br />
<strong>Volvo</strong> Penta, 3%<br />
<strong>Volvo</strong> Aero, 3%<br />
Customer<br />
Finance, 3%<br />
Share of <strong>Group</strong>’s net sales by geography<br />
Europe, 39%<br />
North America, 18%<br />
South America, 11%<br />
Asia, 25%<br />
Rest of the world, 7%<br />
Europe Asia Rest of world<br />
Göteborg, Umeå (SE), Gent (BE), Kaluga (RU) Bangalore (IN) Durban (ZA), Brisbane (AU)<br />
Blainville, Bourg-en-Bresse, Limoges (FR), Kaluga (RU)<br />
Ageo (JP), Hangzhou* (CN)<br />
Pithampur* (IN)<br />
Brisbane (AU)<br />
Borås, Säffle, Uddevalla (SE), Wroclaw (PL) Bangalore (IN), Shanghai*, Xian* (CN) Durban (ZA)<br />
Arvika, Braås, Eskilstuna, Hallsberg (SE), Konz-Könen, Hameln (DE),<br />
Belley (FR), Wroclaw (PL)<br />
Göteborg, Vara (SE)<br />
Trollhättan, Linköping (SE), Kongsberg (NO)<br />
Köping, Skövde (SE), Vénissieux (FR)<br />
Changwon (KR), Shanghai, Linyi* (CN),<br />
Bangalore (IN)<br />
Shanghai (CN)<br />
Ageo, Kounosu, Hanyu (JP)<br />
* Ownership ≥ 50%<br />
5
A GLOBAL GROUP <strong>2010</strong><br />
<strong>The</strong> <strong>Volvo</strong> <strong>Group</strong> ’s product offering<br />
Trucks<br />
All brands in the <strong>Volvo</strong> <strong>Group</strong>’s truck operations have a unique and distinct<br />
brand-specific character that attracts customers in their market segments.<br />
<strong>The</strong> trucks are sold and marketed under the brands <strong>Volvo</strong>, Renault, UD,<br />
Mack and Eicher, which all offer customers a broad range of products and<br />
services for efficient and economic transports.<br />
Long-haul<br />
Regional distribution<br />
City distribution<br />
Construction<br />
Eicher<br />
Mack<br />
Trucks<br />
UD<br />
Trucks<br />
Renault<br />
Trucks<br />
<strong>Volvo</strong><br />
Trucks<br />
Buses<br />
<strong>Volvo</strong> Buses’ product range includes complete buses and bus chassis for<br />
city, intercity and coach traffic. <strong>The</strong> company has a total offering that, in<br />
addition to buses, includes a global service network, efficient spare parts<br />
handling, service and repair contracts, financial services and traffic information<br />
systems.<br />
City buses Intercity buses Coaches Chassis<br />
Marine and industrial applications<br />
<strong>Volvo</strong> Penta manufactures engines and drive systems for marine applications,<br />
for both leisure and commercial craft, with an engine range of 10 to<br />
900 hp and has a global service network of approximately 4,000 dealers.<br />
<strong>Volvo</strong> Penta also supplies industrial engines ranging from 75 kW to 640 kW<br />
for irrigation pumps, generator units and other industrial applications.<br />
Marine engines<br />
Industrial engines<br />
6
Construction equipment<br />
<strong>Volvo</strong> Construction Equipment develops, manufactures and markets equipment<br />
for construction and related industries. Its products are leaders in<br />
many world markets, and include a comprehensive range of wheel loaders,<br />
hydraulic wheeled and crawler excavators, articulated haulers, road machinery<br />
and a wide range of compact equipment.<br />
Compact construction<br />
equipment<br />
Heavy construction equipment<br />
Road machinery<br />
Wheel loaders<br />
Crawler excavators<br />
Articulated haulers<br />
Motor graders<br />
Backhoe loaders<br />
Wheeled excavators<br />
Wheel loaders<br />
Compaction equipment<br />
Crawler excavators<br />
Crawler excavators from Lingong<br />
Lingong wheel loaders<br />
Pavers<br />
Skidsteer loaders<br />
Asphalt milling machines<br />
Aerospace industry<br />
<strong>Volvo</strong> Aero develops and manufactures advanced components for aircraft<br />
engines and space rockets with light weight in focus. More than 90% of all<br />
new large commercial aircraft are equipped with engine components from<br />
<strong>Volvo</strong> Aero. <strong>The</strong> company is also responsible for the engines of the Swedish<br />
Air Force’s Gripen fighters. <strong>Volvo</strong> Aero also has an aftermarket business<br />
that comprises repair and maintenance of select aircraft engines as<br />
well as stationary gas turbines.<br />
Engine components Engine overhaul Space<br />
Financial services<br />
Financial services, such as customer and dealer financing, and other services,<br />
such as insurance, contribute to create customer value. Providing<br />
attractive financing solutions is essential to retaining existing customers<br />
and attracting new ones.<br />
Customer and dealer financing<br />
7
A GLOBAL GROUP <strong>2010</strong><br />
Moving the world<br />
Every day<br />
Mack Trucks collect garbage for<br />
millions around the U.S.<br />
Mack is one of the leading producers of heavy-duty trucks in North America<br />
Ever since the start, Mack Trucks has focused on power and reliability, which has contributed to<br />
making the company one of the strongest heavy-duty truck brands in the North American market.<br />
In the U.S., Mack is the leading producer of trucks in the construction, economic haul and refuse<br />
segments. In total, Mack has sales and service in more than 45 countries.<br />
8
<strong>The</strong> people on Earth produce more than 2,000 million tons of garbage<br />
every year, and just a few days without refuse collection would be<br />
catastrophic for cities and suburban areas. In New York City alone, refuse<br />
trucks from the <strong>Volvo</strong> <strong>Group</strong> collect 11,000 tons of garbage each day.<br />
Every day, Mack trucks collect tons of refuse all over the U.S. <strong>The</strong><br />
demands imposed on these trucks are rigorous. <strong>The</strong>y have to get through<br />
in every situation and they must not break down. Should the garbage<br />
collection stop, it wouldn’t take long for the cities and suburban areas to<br />
become inundated by waste.<br />
Mack refuse trucks collect 2 million tons of garbage every week in the<br />
U.S. Is the number hard to grasp? Try this: With the garbage that Mack<br />
Trucks refuse trucks transport every week in the U.S., it would be possible<br />
to build a column of filled garbage cans that reaches all the way to the<br />
moon.<br />
Mack has been leading the U.S. market for refuse collection for more<br />
than 30 years. <strong>The</strong> company’s operations are most extensive on the east<br />
coast, with huge cities like New York, Boston and Philadelphia. In all,<br />
Mack has almost 50% of the refuse vehicle market in the U.S. and its<br />
success is continuing.<br />
Customers range from private family-owned companies with just one<br />
refuse truck to local authorities and large cities, such as New York City,<br />
operating around 2,500 Mack refuse trucks that haul more than 11,000<br />
tons of trash every day.<br />
Mack collaborates closely with customers to customise trucks that<br />
match their specific requirements. In New York, for example, a number of<br />
refuse trucks are also able to help with snow clearance using a specially<br />
designed plow.<br />
All Mack trucks are built at the plant in Macungie, Pennsylvania. <strong>The</strong><br />
Mack TerraPro model is primarily used as a refuse truck. At the plant,<br />
the trucks are also adapted to match customer requirements. <strong>The</strong> next<br />
step in the development process involves alternative fuels. Both hybrids<br />
and natural gas driven vehicles are important, and many customers in<br />
different parts of the U.S. are interested in extending their fleets to include<br />
more energy efficient and environmentally sound vehicles.<br />
9
EN A GLOBAL global GROUP koncern <strong>2010</strong> <strong>2010</strong><br />
Vision, mission and values<br />
Vision<br />
<strong>The</strong> <strong>Volvo</strong> <strong>Group</strong>’s vision is to be valued as<br />
the world’s leading provider of commercial<br />
transport solutions.<br />
Mission<br />
By creating value for our customers, we create value for our shareholders.<br />
We use our expertise to create transport-related hard and soft products of<br />
superior quality, safety and environmental care for demanding customers in selected segments.<br />
We work with energy, passion and respect for the individual.<br />
Values<br />
<strong>The</strong> <strong>Volvo</strong> <strong>Group</strong> views its corporate culture as a unique asset,<br />
since it is difficult for competitors to copy. By applying and<br />
strengthening the expertise and culture we have built up over the<br />
years, we can achieve our vision.<br />
Quality, safety and environmental care are the values that form the<br />
<strong>Volvo</strong> <strong>Group</strong>’s common base and are important components of our<br />
corporate culture. <strong>The</strong> values have a long tradition and permeate our<br />
organization, our products and our way of working. Our goal is to<br />
maintain a leading position in these areas.<br />
Quality<br />
Quality is an expression of our goal to<br />
offer reliable products and services. In<br />
all aspects of our operations, from product<br />
development and production to delivery<br />
and customer support, the focus<br />
shall be on customers’ needs and expectations.<br />
Our goal is to meet or exceed<br />
their expectations. With a customer<br />
focus based on everyone’s commitment<br />
and participation, our aim is to be<br />
number one in customer satisfaction.<br />
This is based on a culture in which all<br />
employees are responsive and aware of<br />
what must be accomplished to be the<br />
best business partner.<br />
Safety<br />
Safety pertains to how our products are<br />
used in society. We have had a leading<br />
position in issues regarding safety for a<br />
long time; our goal is to maintain this<br />
position. A focus on safety is an integral<br />
part of our product development work.<br />
Our employees are highly aware of<br />
safety issues, and the knowledge gained<br />
from our internal crash investigations is<br />
applied in product development. Our<br />
goal is to reduce the risk of accidents<br />
and mitigate the consequences of any<br />
accidents that may occur as well as to<br />
improve the personal safety and the<br />
work environment of the drivers of our<br />
vehicles and equipment. Our long-term<br />
vision is zero accidents.<br />
Environmental care<br />
We believe that it is self-evident that our<br />
products and our operations shall have<br />
the lowest possible adverse impact on<br />
the environment. We are working to<br />
further improve energy efficiency and to<br />
reduce emissions in all aspects of our<br />
business, with particular focus on the<br />
use of our products. Our goal is for the<br />
<strong>Volvo</strong> <strong>Group</strong> to be ranked as a leader in<br />
environmental care within our industry.<br />
To achieve this goal, we strive for a holistic<br />
view, continuous improvement, technical<br />
development and efficient resource<br />
utilization.<br />
10
Over all str ategies<br />
<strong>The</strong> majority of the <strong>Volvo</strong> <strong>Group</strong>’s<br />
customers are involved in commercial<br />
transport-related operations. <strong>The</strong>y place<br />
high demand on both products and<br />
services.<br />
Profitable<br />
Growth<br />
<strong>The</strong> <strong>Volvo</strong> <strong>Group</strong>’s aim is to continue to grow with<br />
increased focus on profitability. <strong>The</strong> goal is to grow by<br />
10% a year over a business cycle with a higher pace in<br />
new markets. Part of the growth may, over time, come<br />
from acquisitions and then mainly in growth markets<br />
and in strategic product segments.<br />
<strong>The</strong> market is characterized by intense competition<br />
where customer satisfaction is a key factor<br />
as it lays a foundation for future sales and future<br />
profitability. <strong>The</strong> <strong>Volvo</strong> <strong>Group</strong>’s strategy is based<br />
on customers’ requirements and is focused on<br />
profitable growth, product renewal and internal<br />
efficiency.<br />
Customer requirements<br />
<strong>The</strong> <strong>Volvo</strong> <strong>Group</strong>’s products and services offer<br />
high performance characteristics, quality, safety,<br />
flexibility and a favorable total economy. Customers<br />
are offered solutions adapted to their operations<br />
regardless of whether they involve a single<br />
product or a complete solution.<br />
Products, services and complete solutions are<br />
developed in close cooperation with customers<br />
with the goal of contributing to improving the<br />
customers’ productivity and profitability, and thus<br />
creating value for the customer. <strong>Volvo</strong> strives to<br />
increase the penetration and proportion of sales<br />
coming from services and soft products, with an<br />
offer consisting of financing, insurance, various<br />
forms of service contracts and spare parts,<br />
superstructures and attachments.<br />
In the past few years, the <strong>Volvo</strong> <strong>Group</strong> has<br />
intensified its relationships with key customers.<br />
<strong>The</strong> advantages are many. <strong>The</strong> <strong>Group</strong> can support<br />
customers’ development in an even better<br />
way than previously, and intensified relationships<br />
result in increased penetration of both the product<br />
and the service range. <strong>The</strong> extended offering<br />
creates advantages for both the <strong>Volvo</strong> <strong>Group</strong> and<br />
its customers.<br />
Product<br />
Renewal<br />
Operational<br />
Excellence<br />
<strong>The</strong> ongoing renewal of the <strong>Group</strong>’s product range and<br />
creation of new and better products and services is a<br />
challenge, but a matter of survival. Intense competition,<br />
new environmental standards and safety and quality<br />
requirements put significant demands on the entire<br />
product development process. <strong>The</strong> <strong>Group</strong> utilizes common<br />
architecture and shared technology to create synergies<br />
and reduce costs.<br />
<strong>The</strong> <strong>Volvo</strong> <strong>Group</strong> strives to optimize cost-efficiency and<br />
productivity in all parts of its operations by reducing<br />
manufacturing costs and sales and administrative costs<br />
and by speeding up product development and other<br />
processes. <strong>The</strong> work also comprises competence<br />
development and organizational development.<br />
11
EN A GLOBAL global GROUP koncern <strong>2010</strong> <strong>2010</strong><br />
Str ategY<br />
Profitable Growth<br />
In an industry characterized by economies of scale and which is undergoing consolidation,<br />
profitable growth is a necessary condition in order to continue to strengthen competitiveness<br />
and to develop as a close partner to customers with high demands. <strong>The</strong>re is particularly<br />
strong growth potential in supplemental business relating to service and to services in<br />
which significant effort is invested to give the customer a more complete offering.<br />
Profitability is essential to ensure investments in<br />
the development of new products and services<br />
and a favorable return to the shareholders. <strong>The</strong><br />
<strong>Group</strong>’s brands shall increase customer satisfaction<br />
by offering environmentally and cost-efficient<br />
products and services.<br />
Required scale achieved<br />
During the past ten years, the <strong>Volvo</strong> <strong>Group</strong> has<br />
grown on average 7.4% per year, both organically<br />
and through acquisitions. <strong>The</strong> acquisitions have<br />
been carried out in order to establish the <strong>Group</strong><br />
in new markets and in new product segments, as<br />
well as to achieve economies of scale through<br />
size. <strong>The</strong> average operating margin during the<br />
period has been 3.9%.<br />
Through its growth, the <strong>Group</strong> has achieved<br />
sufficient size in mature markets with satisfactory<br />
market shares. <strong>The</strong> size facilitates good economies<br />
of scale in most product segments.<br />
Strong positions<br />
<strong>The</strong> <strong>Volvo</strong> <strong>Group</strong> has strong positions from which<br />
further to develop:<br />
• No. 2 among Western manufacturers of heavyduty<br />
trucks<br />
• No. 4 in construction equipment<br />
• One of the world’s largest manufacturers of<br />
heavy-duty diesel engines<br />
• Strong positions also in the other business<br />
areas<br />
• Good market presence globally.<br />
Future direction<br />
Within the strategic area Profitable Growth the<br />
future direction is:<br />
• Continued organic growth in mature markets.<br />
• Focus on increased sales of services and aftermarket<br />
products.<br />
• Products in market segments that open up possibilities<br />
to capture the rapid growth in Asia and<br />
other growth markets.<br />
• Realizing further synergies from acquired companies.<br />
• Increased cooperation with business partners.<br />
Net sales<br />
SEK bn<br />
400<br />
300<br />
200<br />
100<br />
0<br />
Net sales<br />
01 02 03 04 05 06 07 08 09 10<br />
<strong>The</strong> <strong>Volvo</strong> <strong>Group</strong>’s acquisitions and divestments<br />
2008 Joint venture with Eicher Motors of India within trucks and buses.<br />
2007 Acquisition of Igersoll Rand’s road development division.<br />
2007 Acquisition of Ingersoll Rand’s road development division.<br />
2006 Acquisition of Japanese Nissan Diesel (Now UD Trucks). Completed in 2007.<br />
2005 Sale of the service company Celero Support.<br />
2004 Acquisition of remaining 50% of the Canadian bus manufacturer Prévost.<br />
2004 Sale of axle-manufacturing operations to ArvinMeritor.<br />
2003 Acquisition of the truck and construction equipment dealers from Bilia.<br />
2001 Acquisition of the truck manufacturers Mack and Renault VI.<br />
1999 Sale of <strong>Volvo</strong> Cars to Ford.<br />
1998 Acquisition of the excavator operations of Samsung Heavy industries.<br />
12
Str ategY<br />
Operational<br />
Excellence<br />
Operational excellence is an important factor for securing<br />
a sustainable profitability for the <strong>Group</strong>. <strong>The</strong> work with<br />
operational excellence includes lowering the manufacturing<br />
costs and the cost of sales and administration as well<br />
as making product development and other processes more<br />
efficient.<br />
<strong>Volvo</strong> Production System (VPS) is an important<br />
tool in the effort to increase operational excellence.<br />
It contains methods to make operations<br />
more efficient and reduce productivity losses.<br />
Competence development is a key part of VPS.<br />
Great effort is placed on developing employees in<br />
new, future technological competencies.<br />
Substantial cost savings<br />
In 2009 as well as <strong>2010</strong>, substantial measures<br />
were implemented to lower the <strong>Group</strong>’s costs on<br />
a permanent basis. Short-term, they have been<br />
focused on quickly changing over the <strong>Group</strong> to a<br />
new, lower cost base while at the same time<br />
securing the <strong>Group</strong>’s long-term competitiveness.<br />
All parts of the <strong>Group</strong> have been subject to cost<br />
savings in a number of areas. <strong>The</strong> measures have<br />
produced results and substantially lowered the<br />
total costs for, among others, sales and adminstration<br />
as well as for research and development.<br />
As the <strong>Group</strong> now grows again, it is of vital importance<br />
that costs increase at a slower pace<br />
through increased efficiency and productivity and<br />
thus assist in raising profitability.<br />
Future direction<br />
Within the strategic area of Operational Excellence<br />
the future direction is:<br />
• Lowering the product cost.<br />
• Utilizing the global production capacity with<br />
regional support.<br />
• Productivity increase in the industrial system to<br />
strengthen competitiveness.<br />
• Focus on closer and more long-term cooperation<br />
with well-performing suppliers and take<br />
further advantage of large purchasing volumes.<br />
• Reduce administration by fully utilizing the business<br />
units.<br />
• Increase productivity in product development.<br />
• Increase flexibility to be able to rapidly adapt the<br />
cost structure to changes in demand.<br />
• Increase competency and diversity with strong<br />
employee commitment.<br />
Improved profitability through cost control<br />
Industrial Operations<br />
80<br />
60<br />
+25%<br />
40<br />
20<br />
0<br />
09Q4 10Q1 10Q2 10Q3 10Q4<br />
Net sales<br />
Selling, administrative, reserach and development expenses<br />
+3%<br />
13
EN A GLOBAL global GROUP koncern <strong>2010</strong> <strong>2010</strong><br />
Str ategY<br />
Product Renewal<br />
<strong>The</strong> development of new, innovative technology is key to the success of future product<br />
generations and to maintaining market-leading positions.<br />
Efforts are constantly under way within the <strong>Group</strong><br />
to refine and improve the performance of products<br />
and with swiftness strengthen current competitiveness.<br />
At the same time, research looking<br />
further into the future is conducted to achieve<br />
new technical breakthroughs that will contribute<br />
to reduced environmental impact and meet future<br />
requirements.<br />
Cleaner engines<br />
After implementing comprehensive product<br />
renewal in recent years, the <strong>Volvo</strong> <strong>Group</strong> decided<br />
to maintain relatively high investments in research<br />
and development during 2009 and <strong>2010</strong>. This was<br />
done to secure a competitive range of products<br />
and services in both the short and the long term.<br />
<strong>The</strong> pace of product renewal has been high, for<br />
example in conjunction with the implementation<br />
of new emissions regulations in Europe, North<br />
America and Japan. <strong>The</strong> <strong>Group</strong> also started serial<br />
production of hybrid buses and launched a large<br />
number of new construction machines, including<br />
excavators under the brand name SDLG in China.<br />
<strong>The</strong> <strong>Volvo</strong> <strong>Group</strong> has also developed its own<br />
captive <strong>Group</strong>-wide engine platform for mediumduty<br />
diesel engines. <strong>The</strong> first models of the new<br />
medium-duty engines started to be launched in<br />
<strong>2010</strong>.<br />
<strong>The</strong> <strong>Group</strong> has its most competitive product<br />
range ever, but the customer offering will be further<br />
strengthened in the next few years by focusing<br />
intensely on the development of future generations<br />
of products and services that create<br />
value for customers.<br />
Focus on the driveline<br />
<strong>The</strong> <strong>Volvo</strong> <strong>Group</strong> is one of the world’s largest<br />
manufacturers of heavy diesel engines for commercial<br />
use. <strong>The</strong> <strong>Group</strong> has production and<br />
research and development facilities for drivelines<br />
on three continents. <strong>The</strong> products are sold to<br />
customers in some 180 markets worldwide.<br />
A large number of product launches<br />
<strong>Volvo</strong> Trucks<br />
In April <strong>2010</strong>, <strong>Volvo</strong> Trucks launched the<br />
new <strong>Volvo</strong> FMX truck, specially designed<br />
for heavy construction duties. With the<br />
new <strong>Volvo</strong> FMX and a strong service<br />
offering for the construction industry,<br />
the company has strengthened its position<br />
in this segment. During the year,<br />
<strong>Volvo</strong> Trucks also focused on the development<br />
of hybrid trucks and engines for<br />
alternative fuels.<br />
Renault Trucks<br />
Renault Trucks launched the Optitrack<br />
system on Renault Premium Lander. <strong>The</strong><br />
system is useful when driving on difficult<br />
terrain in quarries or worksites. With the<br />
aid of separate hydraulic motors integrated<br />
in the wheel hubs, the truck can<br />
automatically be driven in all-wheel<br />
drive. In addition Renault Trucks started<br />
delivery of an all-electric version of<br />
Renault Maxity.<br />
UD Trucks<br />
In April, UD Trucks launched versions of<br />
its Quon heavy-duty truck with engines<br />
based on the <strong>Group</strong>’s common heavy<br />
engine platform that comply with new<br />
emission regulations introduced in<br />
Japan. In addition to environmental<br />
performance, the latest Quon lineup<br />
has been developed to meet growing<br />
demand for high levels of both fuel<br />
economy and driving performance.<br />
Mack Trucks<br />
Mack introduced its new mDRIVE automated<br />
manual transmission, based on<br />
well-accepted <strong>Group</strong> architecture engineered<br />
to work exclusively with MACK<br />
MP series engines and delivering<br />
improved fuel efficiency, driveability and<br />
safety. A natural gas-powered version of<br />
the versatile MACK TerraPro Cabover<br />
model was brought to market for refuse<br />
and construction customers.<br />
14
Continued focus on product development<br />
Research and development costs, SEK billion<br />
01 02 03 04 05 06 07 08 09 10<br />
5.4 5.9 6.8 7.6 7.6 8.4 11.1 14.3 13.2 13.0<br />
<strong>The</strong> drivelines are designed so they can be<br />
adapted to a large number of applications in most<br />
of the <strong>Group</strong>’s products. <strong>The</strong> diesel engines are<br />
used in trucks, buses and construction equipment,<br />
as well as in boats and industrial applications,<br />
such as generator units.<br />
<strong>The</strong> strongest driver of the development of<br />
drivelines is customer requirements and preferences<br />
as well as new legislation with stricter<br />
emissions requirements. Products with reliability,<br />
sustainability, good drivability, favorable fuel<br />
economy and high environmental parameters<br />
help boost customers’ productivity and profitability.<br />
<strong>The</strong> environmental aspect is of great signifi-<br />
cance in all product development. Alternative<br />
drivelines and fuels, and the lower fuel consumption<br />
when using traditional drivelines, provide for<br />
twice the benefit – less impact on the environment<br />
and lower costs for customers. <strong>The</strong> <strong>Volvo</strong><br />
<strong>Group</strong> is a driving force in the areas of environmental<br />
adaptation and energy efficiency. <strong>The</strong><br />
undertaking involves a gradual transition from<br />
fossil fuels, such as oil and natural gas, to fuels<br />
from renewable sources and to hybrids.<br />
<strong>The</strong> <strong>Group</strong> continuously strengthens the<br />
development of aftermarket products and services<br />
with the aim of meeting customer needs<br />
through the entire product life cycle.<br />
Future direction<br />
Within the strategic area of Product Renewal the<br />
future direction is:<br />
• Meet future emission standards with competitive<br />
products – capitalize on converging technologies.<br />
• Start production in India of medium-duty engine<br />
platform developed by the <strong>Group</strong>.<br />
• Develop new products adapted for growth markets.<br />
• Further enhance the <strong>Group</strong>’s market-leading position<br />
within diesel engines and automatic gearboxes.<br />
• Commercialize the <strong>Group</strong>’s shared technology for<br />
diesel-electric hybrids.<br />
• Focus on fully utilizing common architecture and<br />
shared technology.<br />
<strong>Volvo</strong> Buses<br />
In the summer of <strong>2010</strong> serial production<br />
started of <strong>Volvo</strong>’s hybrid buses, both<br />
single deckers and double deckers.<br />
Hybrid buses reduce fuel consumption<br />
and emissions of CO 2<br />
by as much as<br />
35%. <strong>The</strong> company has redeived orders<br />
for some 200 hybrid buses in Europe<br />
and has carried out positive tests at<br />
operators in Brazil and Mexico.<br />
<strong>Volvo</strong> Construction Equipment<br />
<strong>Volvo</strong> CE is highlighting its commitment<br />
to improving fuel efficiency with a range<br />
of solutions that encompasses engines,<br />
hydraulic systems, operator behavior and<br />
hybrid technology. <strong>The</strong> company is ramping<br />
up its investments in new technology<br />
to maintain its leadership in fuel<br />
efficiency and thereby environmental<br />
protection.<br />
<strong>Volvo</strong> Penta<br />
With new and specially designed controls<br />
from <strong>Volvo</strong> Penta, boat drivers can<br />
quickly choose between a number of<br />
features, for example cruise control,<br />
powertrim assistant and tow mode. <strong>The</strong><br />
electronics development makes it possible<br />
for <strong>Volvo</strong> Penta to offer its customers<br />
soft products of this kind. Also<br />
among these is the appreciated joystick,<br />
which makes maneuvering a boat easier<br />
and safer.<br />
<strong>Volvo</strong> Aero<br />
<strong>The</strong> main challenge for the airline industry<br />
is to reduce the engines’ fuel consumption<br />
and thus also the emissions. <strong>Volvo</strong><br />
Aero’s lightweight technologies are<br />
therefore in increasing demand from the<br />
large, international engine manufacturers,<br />
while the technologies also get new<br />
applications in the aerospace industry<br />
15
A global GROUP <strong>2010</strong><br />
Strength factors<br />
<strong>Volvo</strong><br />
profitability<br />
Based<br />
Strategically important for future<br />
Mack<br />
By selling products with different brands, the<br />
Strong brands<br />
<strong>Volvo</strong> <strong>Group</strong> can penetrate many different customer<br />
and market segments in mature markets<br />
as well as growth markets.<br />
<strong>The</strong> <strong>Volvo</strong> brand, which has been built up over<br />
decades, is one of the world’s best known and<br />
respected names within trucks, buses, construction<br />
equipment, marine engines, industrial<br />
engines and in the aviation industry.<br />
Mack is one of the most well-known truck<br />
brands in North America, while Renault Trucks<br />
holds a special position in Southern Europe. <strong>The</strong><br />
UD brand is one of the biggest in the Japanese<br />
truck market.<br />
Prevost sells coaches and Nova Bus city buses<br />
Lingong<br />
in North America.<br />
<strong>The</strong> <strong>Volvo</strong> <strong>Group</strong> also sells construction equipment<br />
under the SDLG brand mainly in China, and<br />
through joint-venture companies, trucks and<br />
buses under the Eicher brand mainly in India and<br />
buses under the Sunwin and Silver brands in<br />
China.<br />
Sunwin<br />
machines. All in all, the <strong>Volvo</strong> <strong>Group</strong> in <strong>2010</strong> was<br />
Silver<br />
intended to provide for improved competitiveness.<br />
Prevost<br />
Nova Bus<br />
Renault<br />
UD Trucks<br />
Eicher<br />
1998<br />
Successful inroads into new markets<br />
Share of Industrial Operations’ net sales<br />
16<br />
Western Europe 52%<br />
North America 31%<br />
Eastern Europe 3%<br />
South America 6%<br />
Asia 5%<br />
Other markets 3%<br />
on its strategies and by utilizing its strength factors, the <strong>Volvo</strong><br />
<strong>Group</strong>’s ambition is to further increase its competitiveness and improve<br />
its profitability.<br />
A customer offering at the forefront<br />
<strong>The</strong> <strong>Volvo</strong> <strong>Group</strong> offers customers complete, efficient<br />
transport solutions. Products with reliability,<br />
durability, good driveability, favorable fuel<br />
efficiency and high environmental performance<br />
are combined with services such as financing,<br />
insurance, various service contracts, accessories<br />
and spare parts that support the core products.<br />
<strong>The</strong> <strong>Volvo</strong> <strong>Group</strong>’s increasingly broad offering<br />
of these services and aftermarket products is<br />
Strong dealers<br />
Through the years, the <strong>Volvo</strong> <strong>Group</strong> has invested<br />
considerable resources in building a very strong<br />
dealer network with overall well-developed sales<br />
and service channels. <strong>The</strong> network consists of<br />
wholly-owned as well as independent dealers.<br />
Thanks to large populations of <strong>Group</strong> products in<br />
most markets, the dealers have a stable base of<br />
revenues from the important aftermarket with<br />
service and repair.<br />
Strong market positions<br />
<strong>The</strong> <strong>Volvo</strong> <strong>Group</strong> has leading positions globally in<br />
each of its business areas. <strong>The</strong> <strong>Volvo</strong> <strong>Group</strong> is<br />
Europe’s largest and one of the world’s largest<br />
<strong>2010</strong><br />
Western Europe 34%<br />
North America 18%<br />
Eastern Europe 5%<br />
South America 11%<br />
Asia 25%<br />
Other markets 7%<br />
17% 48%<br />
manufacturers of heavy-duty trucks and one of<br />
the largest manufacturers of buses in Europe and<br />
North America. Within construction equipment,<br />
the <strong>Volvo</strong> <strong>Group</strong> is the world’s largest manufacturer<br />
of articulated haulers as well as one of the<br />
world’s largest manufacturers of wheel loaders,<br />
excavators equipment and road development<br />
one of the world’s largest producers of heavyduty<br />
diesel engines.<br />
Strengthened presence in Asia and<br />
South America<br />
In recent years, the <strong>Volvo</strong> <strong>Group</strong> has strengthened<br />
its position in important growth markets in<br />
Asia and South America through a combination<br />
of organic growth and acquisitions. Among the<br />
acquired companies are UD Trucks in Japan, Lingong<br />
(70% ownership) in China and VE Commercial<br />
Vehicles (50% ownership) with its Eicher<br />
brand in India. During <strong>2010</strong>, 19% of the Industrial<br />
Operations’ net sales were generated in the BRIC<br />
countries (Brazil, Russia, India and China). Altogether,<br />
the markets outside Western Europe and<br />
North America accounted for 48% of net sales in<br />
the Industrial Operations during <strong>2010</strong>.<br />
Organic growth<br />
• Strong brand and distribution in Eastern Europe<br />
• Product portfolio expansion and distribution in<br />
South America and Asia<br />
• Development of acquired businesses<br />
Acquisitions and JVs<br />
• Lingong, China<br />
• UD Trucks, Japan<br />
• VECV (Eicher), India
Financial goals<br />
Measured over a business cycle<br />
<strong>The</strong> <strong>Volvo</strong> <strong>Group</strong>’s financial goals were established by the Board<br />
in September 2006. <strong>The</strong> Board focuses on three goals comprising<br />
growth, operating margin and capital structure for the <strong>Group</strong>’s<br />
Industrial Operations.<br />
Financial goals for Industrial Operations<br />
Growth<br />
<strong>The</strong> growth target is that net sales should increase<br />
by a minimum of 10% annually. During 2000–<br />
<strong>2010</strong>, the average growth rate was 7.4% annually.<br />
Operating margin<br />
<strong>The</strong> <strong>Volvo</strong> <strong>Group</strong>’s profitability target is that operating<br />
margin for the Industrial operations is to<br />
exceed an average of 7% annually over a business<br />
cycle. <strong>The</strong> average annual operating margin for the<br />
<strong>Volvo</strong> <strong>Group</strong>’s Industrial Operations was 3.9%<br />
from 2000 to <strong>2010</strong>.<br />
Capital structure<br />
<strong>The</strong> capital structure target is set to a net debt<br />
including provisions for post-employment benefits<br />
for the Industrial operations of a maximum of<br />
40% of shareholders’ equity under normal conditions.<br />
As of December 31, <strong>2010</strong>, the <strong>Volvo</strong><br />
<strong>Group</strong>’s Industrial operations had a net financial<br />
debt position corresponding to 37.4% of shareholders’<br />
equity.<br />
Net sales growth, % Operating margin, % Net financial debt as percentage of<br />
shareholders’ equity, %<br />
10<br />
0<br />
(30)<br />
Target: above 10%<br />
10<br />
0<br />
(10)<br />
Target: above 7%<br />
80<br />
60<br />
40<br />
20<br />
0<br />
(20)<br />
(40)<br />
Target: below 40%<br />
Net cash Net debt<br />
06<br />
7<br />
07<br />
10<br />
08<br />
6<br />
09<br />
(28)<br />
10<br />
21<br />
06<br />
7.9<br />
07 08<br />
7.8 5.2<br />
09<br />
(7.8)<br />
10<br />
6.9<br />
06<br />
(29.2)<br />
07<br />
5.7<br />
08<br />
39.7<br />
09<br />
70.9<br />
10<br />
37.4<br />
Financial goals for Customer Finance Operations<br />
<strong>The</strong> target for Customer Finance is a return on shareholders’ equity of 12–15% and an equity ratio<br />
above 8.0%. At year end the equity ratio was 9.0%. <strong>The</strong> average annual return on shareholders’ equity<br />
for 2006–<strong>2010</strong> amounted to 7.2%.<br />
Return on shareholders’ equity, %<br />
Target: 12–15%<br />
15<br />
10<br />
5<br />
0<br />
(5)<br />
(10)<br />
06<br />
13.2<br />
07 08<br />
15.9 12.6<br />
09<br />
(6.2)<br />
10<br />
0.4<br />
17
A Global <strong>Group</strong> <strong>2010</strong><br />
World-cl ass services<br />
Strengthens customer<br />
relationships<br />
Many customers want long-term cooperation around total solutions<br />
to execute their work as efficiently as possible with maximum<br />
profitability and reliability.<br />
When customers choose supplier of vehicles or<br />
machinery, the offering of supplementary services<br />
combined with excellent products is a crucial<br />
factor.<br />
Accordingly, the <strong>Volvo</strong> <strong>Group</strong> offers such services<br />
as financing and insurance, various forms of<br />
service agreements, accessories and spare<br />
parts. <strong>The</strong> <strong>Volvo</strong> <strong>Group</strong>’s increasingly broad range<br />
of these services and aftermarket products, so<br />
called soft products, is of ever-increasing importance<br />
to the <strong>Group</strong>’s competitiveness.<br />
Growing aftermarket business<br />
<strong>The</strong> <strong>Volvo</strong> <strong>Group</strong>’s offering includes various types<br />
of financing solutions, insurance, rental services,<br />
used vehicles, spare parts, preventive maintenance,<br />
service agreements, assistance services<br />
and IT services. <strong>The</strong> range and flexibility of the<br />
offering means that the solutions can be customized<br />
for each customer.<br />
Since a large part of the accessories, spare<br />
parts and services in the aftermarket business is<br />
requested as long as products are being used,<br />
they contribute to balancing the fluctuations in<br />
Services and aftermarket products (so called soft products)<br />
Aftermarket products Extended product offering Services offering<br />
Spare<br />
parts<br />
Software<br />
Accessories<br />
Service<br />
Products<br />
Extended<br />
product<br />
offering<br />
Uptime<br />
services<br />
Fleet/Transport<br />
Services<br />
Support<br />
Services<br />
Financial<br />
Services<br />
New parts<br />
Used and<br />
remanufactured<br />
parts<br />
Extended<br />
parts<br />
Vehicle<br />
software<br />
Accessories<br />
Non-<strong>Volvo</strong><br />
accessories<br />
Merchandise<br />
products<br />
Service<br />
litterature<br />
Service /dealer<br />
tools<br />
Parts<br />
Services<br />
Used<br />
vehicles<br />
Trailers<br />
and superstructures<br />
Attachments<br />
and options<br />
Service<br />
planning<br />
Maintance and<br />
repair<br />
Updates and<br />
upgrades<br />
Transport<br />
management<br />
Driver time<br />
management<br />
Vehicle<br />
management<br />
Competence<br />
development<br />
Fleet and asset<br />
management<br />
Call centre<br />
services<br />
Dealer<br />
financing<br />
Customer<br />
financing<br />
Rental<br />
Special<br />
vehicles<br />
Service<br />
contracts<br />
Extended<br />
coverage<br />
Security, safety<br />
& environment<br />
Driver info<br />
and support<br />
Consultancy<br />
services<br />
Information<br />
services<br />
Insurance<br />
Card and<br />
payment<br />
solutions<br />
18
Soft product share of Industrial Operations’ net sales <strong>2010</strong><br />
Sales of hard<br />
products, 65%<br />
Sales of services and<br />
aftermarket products<br />
(soft products), 35%<br />
the business cycle for the <strong>Volvo</strong> <strong>Group</strong>. By strengthening<br />
the aftermarket offering, profitability and revenue<br />
sustainability can improve for the <strong>Group</strong><br />
throughout the business cycle.<br />
<strong>The</strong> strategy to increase sales of services and<br />
aftermarket products is an important element in<br />
the <strong>Volvo</strong> <strong>Group</strong>’s effort to achieve targets for<br />
profitability and growth, both in mature markets<br />
and in the <strong>Group</strong>’s new markets. During <strong>2010</strong>, the<br />
services and aftermarket products business represented<br />
approximately 35% of net sales in the<br />
Industrial Operations, of which roughly half was<br />
attributable to spare parts and workshop services.<br />
Develop and increase interface with<br />
customers<br />
<strong>The</strong> majority of <strong>Volvo</strong> <strong>Group</strong>’s customers are<br />
companies within the transportation or construction<br />
industries. <strong>The</strong> reliability and productivity of<br />
the products are important and in many cases<br />
crucial to the customers’ success and profitability.<br />
<strong>The</strong> goal is that <strong>Volvo</strong> <strong>Group</strong> companies shall<br />
be regarded as number one in customer satisfaction,<br />
in terms of both products and services. <strong>The</strong><br />
<strong>Volvo</strong> <strong>Group</strong> shall also be number one when the<br />
dealers’ customers assess customer satisfaction.<br />
A competent and professional dealer and service<br />
network is of vital importance to the <strong>Volvo</strong> <strong>Group</strong><br />
and contributes to strengthening the <strong>Group</strong>’s<br />
various brands.<br />
A missed delivery<br />
is a missed sale<br />
Last year, the bread producer, Pågen AB, placed an order<br />
for 61 <strong>Volvo</strong> FL trucks.<br />
“We are in the fresh produce business. Distribution is<br />
the one part of our chain that must be completely faultless,”<br />
says Johan Blixt, Purchasing Manager at the Pågen<br />
<strong>Group</strong>.<br />
<strong>The</strong> first <strong>Volvo</strong> trucks<br />
For 20 years, the drivers at Pågen AB have driven another brand<br />
of trucks, so the decision to change supplier and make an investment<br />
of this size requires serious consideration.<br />
“Our procurement processes are very thorough. Suppliers are<br />
compared in great detail. <strong>Volvo</strong> came out well and won this contract.<br />
But <strong>Volvo</strong> will still have to work hard for several years to come.”<br />
<strong>The</strong> service organization was decisive<br />
Price was not the main reason the Pågen <strong>Group</strong> made its choice.<br />
“I would say the decisive factor was <strong>Volvo</strong>’s service organization.<br />
We have been very well received, they have listened to what we had<br />
to say and we feel well looked after. <strong>The</strong>se things are important for<br />
me as Purchasing Manager when taking such large decisions and<br />
for our employees that leave the vehicles at the workshop.”<br />
Pågen AB has chosen to invest in <strong>Volvo</strong>’s Gold Service Contract<br />
for the new trucks.<br />
“When a driver hands in a truck for service, whatever work has<br />
been ordered must be completed in the appointed time. If we<br />
lose time, we miss deliveries and a missed delivery is a lost sale.<br />
It just has to work!”<br />
Fits Pågen’s environmental profile<br />
<strong>Volvo</strong> trucks’ environmental qualities are highly valued by Pågen.<br />
“We strive to minimize our environmental impact throughout our<br />
chain and invest in premium environmental technology, and the<br />
transports are no exception.<br />
Pågen AB<br />
Pågen is Sweden’s largest bread producer. Net<br />
sales amounted to SEK 2.7 billion.<br />
Freshly baked bread is distributed across<br />
Sweden from bakeries in Malmö and Gothenburg,<br />
seven days a week, all year long.<br />
Of the approximately 1,400 employees, 430<br />
work as sales staff and drive bread trucks around<br />
their own district of stores. In total, Pågen’s sales<br />
staff visit 5,000 stores every day.<br />
<strong>The</strong> order: 61 trucks of the <strong>Volvo</strong> FL model.<br />
19
A global group <strong>2010</strong><br />
Moving the world<br />
Red hybrid<br />
bus of the future for<br />
the streets of London<br />
Up to 35% lower fuel consumption<br />
<strong>The</strong> <strong>Volvo</strong> B5L Hybrid Double Decker is equipped with a diesel engine with smaller cylinder volume than usual,<br />
since it is combined with an electric motor. It is the electric motor that is running the bus when it accelerates to<br />
a speed of 15–20 km/h. When the bus is underway, the parallel hybrid system combines diesel and electric<br />
power to maintain speed. At higher speeds, the bus uses diesel power alone. Regenerative braking energy<br />
charges the battery via the generator. Several of the <strong>Volvo</strong> hybrid auxiliary systems are powered by independent<br />
electric motors. <strong>The</strong>se measures all contribute to high fuel savings on routes with frequent braking and<br />
acceleration, like city bus traffic. <strong>The</strong> parallel hybrid technology reduces fuel consumption and CO 2<br />
emissions<br />
by up to 35% compared to conventional diesel buses. In the hybrid configuration, the emissions of<br />
nitrogen oxide and particulates are reduced by up to 50%.<br />
20
When mega city London makes a commitment to reduce emissions,<br />
tradition and new technology are combined: A classic red double-decker<br />
bus using <strong>Volvo</strong>’s latest hybrid technology carries London’s citizens just as<br />
it always has – but with up to 35% less fuel consumption.<br />
Of all passengers using public transportation in the world, 80% go by bus.<br />
Buses are easy to use in almost all types of traffic and are in many parts of the<br />
world the only public transportation. In London, buses are one out of many<br />
means of transportation, and play an important role as the city aims to<br />
reduce traffic.<br />
North London’s Green Lanes is a chaotic experience during rush hour. At<br />
the bus stop outside the popular pub <strong>The</strong> Fox, commuters get on and off a<br />
never-ending stream of red doubledeckers. Noise pollution from cars and<br />
diesel buses fills the street with an aggressive roar.<br />
All this makes the contrast with <strong>Volvo</strong>’s new hybrid double-deckers all the<br />
more evident. When it arrives at the bus stop, the diesel engine shuts down<br />
completely. You are left with a comforting silence that remains even as the<br />
hybrid bus leaves the stop, only using its electric motor to accelerate.<br />
“It’s fantastic how quiet it is when the diesel engine is turned off and it only<br />
runs on electricity,” says Daniel Clarke, one of the commuters standing in line<br />
at the bus stop. “I can’t even imagine what the difference would be if all buses<br />
were hybrids.”<br />
Arriva’s Wood Green bus garage in North London is a pioneer of hybrid<br />
buses for London. In the summer of 2009, six brand new <strong>Volvo</strong> B5L Hybrid<br />
Double Decker buses arrived at the garage that has had previous experience<br />
of hybrid technology.<br />
“We received the first hybrid buses in 2007 and now have a total of 11<br />
hybrid double-deckers at Wood Green. Our experience of hybrid technology<br />
has been positive and all our staff, from mechanics to drivers, are pleased to<br />
be involved,”says Ian Tarran, engineering director at Arriva London.<br />
Transport for London, the body responsible for London’s transport system,<br />
has made the hybrid buses a key part of their strategy for public transport<br />
with less environmental impact. To really put the <strong>Volvo</strong> Hybrid Double<br />
Decker to the test, bus route 141, was selected. <strong>The</strong> route starts at Palmers<br />
Green and ends at London Bridge, with a total length of nine kilometers and<br />
a tour frequency of 6–12 minutes.<br />
“<strong>The</strong> field tests have shown that the fuel consumption of the <strong>Volvo</strong> Hybrid<br />
Double Decker is within our goals. On route 141, the buses have the toughest<br />
cycle possible and still their fuel consumption has been reduced by over 30%<br />
compared to the regular diesel buses on route 141,” says Niklas Deras at<br />
<strong>Volvo</strong> Buses.<br />
21
EN A global group koncern <strong>2010</strong> <strong>2010</strong><br />
Market overview<br />
Long-term increase in demand for<br />
the <strong>Group</strong>’s products and services<br />
During 2009, the <strong>Group</strong>’s mature markets showed a sharp decline in demand and during <strong>2010</strong> a<br />
gradual recovery from historically low levels. Demand in the <strong>Group</strong>’s growth markets were affected<br />
to a much lesser extent by the financial crisis. After a brief downturn at the beginning of 2009,<br />
these markets returned to growth, and they showed a continued good growth in <strong>2010</strong>.<br />
Long-term growth<br />
In the long-term, demand for freight capacity, and<br />
thus many of the <strong>Group</strong>’s products, is closely<br />
linked to the GDP trend. <strong>The</strong> extent of investment<br />
in infrastructure, which drives demand for building<br />
and construction equipment, is also, closely<br />
linked to the GDP trend. In the short-term,<br />
demand is affected by a number of factors including<br />
fuel prices, the implementation of new emission<br />
regulations, interest rates, etc.<br />
From a historical perspective, despite the<br />
recovery in the truck and construction equipment<br />
markets in <strong>2010</strong>, demand was below the longterm<br />
trend in Europe, North America and Japan.<br />
<strong>The</strong> <strong>Volvo</strong> <strong>Group</strong> sees no development that would<br />
imply that the connection between GDP trends<br />
and the sales of vehicles and machines would<br />
have changed and, accordingly, the view is that in<br />
time, demand will recover and return to levels corresponding<br />
with the long-term trend.<br />
North America<br />
In North America, sales of heavy-duty trucks rose 20%<br />
to 142,096 vehicles (117,983), primarily driven by rising<br />
demand for trucks for long distance haulage and<br />
regional distribution. <strong>The</strong> market for construction trucks<br />
remained weak. <strong>The</strong> market for construction equipment<br />
rose 20% after a three-year decline. However, the market<br />
still remained at a low level.<br />
Despite the uncertain macroeconomic trend, the need<br />
to replace old trucks and upgrade the truck fleets is substantial,<br />
which is expected to drive an improvement in<br />
demand. <strong>The</strong> total market for heavy-duty trucks in North<br />
America is expected to amount to approximately<br />
220,000 trucks in 2011. <strong>The</strong> market for construction<br />
equipment is expected to grow by 20–30% in 2011.<br />
Heavy-duty truck market, North America<br />
Vehicles, thousands<br />
400<br />
320<br />
240<br />
160<br />
80<br />
0<br />
1990<br />
1995 2000 2005 <strong>2010</strong><br />
South America<br />
In South America, the key Brazilian market<br />
remained strong, primarily due to a healthy economy<br />
with strong growth in GDP, but also due to<br />
support measures including advantageous<br />
financing. <strong>The</strong> Brazilian market for heavy-duty<br />
trucks rose 64% to 109,760 vehicles (66,950). In<br />
South America as a whole, the market rose 61%<br />
to 138,763 heavy trucks (86,398). In Brazil, the<br />
market for construction equipment rose 68%.<br />
<strong>The</strong> pace of growth in the South American<br />
truck market is expected to plane out during<br />
2011 after an extremely strong <strong>2010</strong>, but despite<br />
this, demand is expected to remain at a healthy<br />
level. <strong>The</strong> Brazilian market for construction equipment<br />
is expected to grow by 5–15% in 2011.<br />
Heavy-duty truck market, Brazil<br />
Vehicles, thousands<br />
120<br />
90<br />
60<br />
30<br />
0<br />
1990<br />
1995 2000 2005 <strong>2010</strong><br />
22
Economic growth in the U.S., EU and Brazil<br />
<strong>Annual</strong> GDP-growth, %<br />
Source: Consensus<br />
Economics<br />
Economic growth in Asia<br />
<strong>Annual</strong> GDP-growth, %<br />
Source: Consensus<br />
Economics<br />
According to Consensus Economics, global GDP grew<br />
by 4.0% during <strong>2010</strong> compared with a decline of 1.8%<br />
in 2009. GDP in the EU grew by 1.8% (–4.1%), in the<br />
US by 2.9% (–2.6%) and in Japan by 4.3% (–6.3%).<br />
Growth in countries such as Brazil, India and China was<br />
very strong. For 2011, global GDP is expected to grow<br />
by 3.4% with continued high growth rates in, among<br />
others, Brazil, India and China.<br />
06 07 08 09 10<br />
4.0 6.1 5.2 (0.6) 7.5 Brazil<br />
3.4 3.1 0.6 (4.1) 1.8 Europe<br />
2.7 1.9 0.0 (2.6) 2.9 USA<br />
06<br />
11.6<br />
07<br />
13.0<br />
08<br />
9.0<br />
09<br />
9.1<br />
10<br />
10.1 China<br />
9.7 9.0 6.7 7.4 8.7 India<br />
6.5 7.2 3.8 1.9 6.9 Asia/Pacific*<br />
2.0 2.3 (1.2) (6.3) 4.3 Japan<br />
* China, Hong Kong, South Korea, Taiwan, Indonesia,<br />
Malaysia, Singapore, Thailand, Phillippines, Vietnam,<br />
Australia, New Zealand, India, Japan, Sri Lanka<br />
Europe<br />
In Europe 29, (the 27 EU member states and Norway and<br />
Switzerland) registrations of heavy-duty trucks rose 8% to<br />
179,185 vehicles in <strong>2010</strong>, compared with 165,269 vehicles<br />
in 2009, driven by a recovery in Central and Northern<br />
Europe, while Southern Europe remained weak. <strong>The</strong> market<br />
for construction equipment rose by 15% in <strong>2010</strong>.<br />
It is difficult to gauge the effects European austerity<br />
packages will have on the economy in 2011, but <strong>Volvo</strong> currently<br />
estimates the truck market will amount to approximately<br />
220,000 heavy-duty trucks. <strong>The</strong> market for construction<br />
equipment is expected to grow by 5–15% in 2011.<br />
Heavy-duty truck market, Europe<br />
Vehicles, thousands<br />
400<br />
320<br />
240<br />
160<br />
80<br />
Asia<br />
<strong>The</strong> <strong>Group</strong>’s most substantial truck market in Asia is Japan,<br />
where demand weakened in the second half of the year<br />
after government scrapping premiums ceased and new<br />
tougher emission regulations were introduced. However, the<br />
total market amounted to 24,453 heavy-duty trucks, which<br />
was an increase of 29% compared with 18,889 trucks in<br />
2009. In other Asian markets, demand rose compared with<br />
the preceding year. <strong>The</strong> Indian market for heavy-duty trucks<br />
rose by 69% to 211,543 vehicles (125,173). <strong>The</strong> market for<br />
construction equipment in Asia rose by a total of 60%, primarily<br />
driven by continued strong growth in China and India.<br />
After a weak second half in <strong>2010</strong>, demand for heavyduty<br />
trucks is expected to recover gradually in Japan in<br />
2011. <strong>The</strong> Japanese market for heavy-duty trucks is<br />
expected to grow by 10%. <strong>The</strong> market for construction<br />
equipment in both China and India is expected to grow by<br />
5–15% in 2011.<br />
Construction equipment market, China<br />
Machines, thousands<br />
400<br />
0<br />
1990<br />
1995 2000 2005 <strong>2010</strong><br />
320<br />
240<br />
160<br />
80<br />
0<br />
1990<br />
1995 2000 2005 <strong>2010</strong><br />
Other markets<br />
For trucks, Other markets comprises Africa and<br />
Australia. <strong>The</strong> <strong>Volvo</strong> <strong>Group</strong>’s deliveries of trucks<br />
to Other markets rose 10% to 14,888 with a<br />
positive trend shown especially in North Africa<br />
and Australia. <strong>The</strong> market for construction<br />
equipment grew by 42%.<br />
23
Board of directors’ report <strong>2010</strong><br />
Significant e vents<br />
Recovery, growth and product<br />
launches<br />
<strong>2010</strong> was characterized by a recovery in the <strong>Group</strong>’s mature markets and<br />
a continued strong development in most of the growth markets. <strong>The</strong> <strong>Volvo</strong><br />
<strong>Group</strong>’s intensive product renewal continued in all business areas.<br />
<strong>The</strong> first quarter<br />
<strong>Annual</strong> General Meeting<br />
<strong>The</strong> <strong>Annual</strong> General Meeting of AB <strong>Volvo</strong> held on<br />
April 14, <strong>2010</strong> approved the proposal from the<br />
Board of Directors and the President not to pay a<br />
dividend to the shareholders and that all of the<br />
funds at the disposal of the <strong>Annual</strong> General<br />
Meeting would be carried forward to the following<br />
year.<br />
Peter Bijur, Jean-Baptiste Duzan, Leif Johansson,<br />
Anders Nyrén, Louis Schweitzer, Ravi<br />
Venkatesan, Lars Westerberg and Ying Yeh were<br />
reelected as members of the Board of AB <strong>Volvo</strong>,<br />
and Hanne de Mora was newly elected. Louis<br />
Schweitzer was elected Chairman of the Board.<br />
Thierry Moulonguet, representing Renault<br />
S.A.S., Carl-Olof By, representing AB Industrivärden,<br />
Håkan Sandberg, representing Svenska<br />
Handelsbanken, SHB Pension Fund, SHB<br />
Employee Fund, SHB Pensionskassa and<br />
Oktogonen, Lars Förberg, representing Violet<br />
Partners LP and the Chairman of the Board, were<br />
elected members of the Election Committee.<br />
<strong>The</strong> registered public accounting firm PricewaterhouseCoopers<br />
AB was elected as the company’s<br />
auditor for a period of four years.<br />
New trucks launched<br />
On April 20, <strong>2010</strong>, UD Trucks presented a new<br />
range of Quon heavy-duty trucks. <strong>The</strong> latest<br />
Quon lineup has been developed to meet high<br />
levels of demand for both fuel economy and driving<br />
performance. It features newly developed<br />
engines and automated manual transmissions<br />
based on <strong>Group</strong> architecture. UD Trucks has also<br />
added a new model equipped with a new mediumduty<br />
engine to its Condor truck lineup.<br />
On April 19, <strong>Volvo</strong> Trucks launched its new<br />
<strong>Volvo</strong> FMX construction truck at the Bauma international<br />
machinery trade fair in Munich, Germany.<br />
With the new truck, <strong>Volvo</strong> Trucks aims to increase<br />
its presence in the construction segment. Sales<br />
of the new <strong>Volvo</strong> FMX will begin in Europe in<br />
September, <strong>2010</strong>.<br />
Detailed information about the events is available<br />
at www.volvogroup.com<br />
<strong>The</strong> second quarter<br />
Investment in Indian facility for production<br />
of excavators<br />
As part of <strong>Volvo</strong> Construction Equipment’s (<strong>Volvo</strong><br />
CE) objective of supporting customers in the<br />
growing BRIC (Brazil, Russia, India and China)<br />
markets, <strong>Volvo</strong> CE has announced a strategic<br />
investment in its existing facility in Bangalore,<br />
India. <strong>The</strong> investment, which totals around SEK<br />
144 M, will allow <strong>Volvo</strong> CE to produce mediumsized<br />
excavators at the plant. <strong>The</strong>se machines will<br />
primarily be models for use in the Indian market.<br />
Production of the first machines is expected to<br />
start by the end of 2011.<br />
Production of new medium-duty engine<br />
in India<br />
<strong>The</strong> <strong>Volvo</strong> <strong>Group</strong>’s Indian joint venture company,<br />
VE Commercial Vehicles (VECV) is to invest a<br />
total of SEK 480 M in the production of the<br />
<strong>Group</strong>’s new global medium-duty engine in India.<br />
<strong>The</strong> investment gives the <strong>Volvo</strong> <strong>Group</strong> a complete<br />
facility in India for machining and assembling the<br />
new medium-duty engine, which will be introduced<br />
in the <strong>Group</strong>’s trucks and buses worldwide<br />
in the next few years. Through this investment, it<br />
will be possible for the <strong>Volvo</strong> <strong>Group</strong> to locate<br />
most of its production of medium-duty engines to<br />
VECV’s plant in Pithampur, India.<br />
Sale of <strong>Volvo</strong> Aero’s US service business<br />
In July it was announced that <strong>Volvo</strong> Aero had<br />
signed an agreement to sell its US subsidiary<br />
<strong>Volvo</strong> Aero Services. <strong>The</strong> sale had a negative<br />
24
impact of SEK 538 M on <strong>Volvo</strong> Aero’s operating<br />
income in <strong>2010</strong>. <strong>The</strong> sale of <strong>Volvo</strong> Aero Services<br />
is due to <strong>Volvo</strong> Aero’s strategy of focusing on its<br />
core operations of developing and manufacturing<br />
components for aircraft engines, combined with<br />
the goal of reducing the company’s tied-up capital.<br />
<strong>The</strong> third quarter<br />
UD Trucks and Nissan Motor end collaboration<br />
on contract manufacturing of light-duty<br />
trucks<br />
<strong>The</strong> collaboration between <strong>Volvo</strong> <strong>Group</strong>’s Japanese<br />
subsidiary UD Trucks and Nissan Motor on<br />
the contract manufacturing of light-duty trucks<br />
will expire and the production will end in January<br />
2011. <strong>The</strong> decision enables UD Trucks to focus<br />
more on medium and heavy-duty trucks. UD<br />
Trucks will continue to have its own manufacturing<br />
operation for light-duty trucks for the export<br />
market. During 2009, UD Trucks produced 6,150<br />
light-duty trucks within the collaboration framework<br />
and up to August <strong>2010</strong>, 4,800 vehicles had<br />
been produced and sold to Nissan Motor. <strong>The</strong><br />
end of contract manufacturing for Nissan Motor<br />
will not result in any restructuring costs or have<br />
any significant impact on the <strong>Volvo</strong> <strong>Group</strong>’s earnings<br />
or financial position.<br />
<strong>The</strong> fourth quarter<br />
<strong>Volvo</strong> <strong>Group</strong> President and CEO Leif<br />
Johansson to resign in the summer of 2011<br />
After almost 14 years as President and CEO of<br />
<strong>Volvo</strong>, Leif Johansson in December informed the<br />
Board of AB <strong>Volvo</strong> of his intention to resign in<br />
conjunction with his 60th birthday in the summer<br />
of 2011. At the same time Leif Johansson will<br />
also leave the Board of AB <strong>Volvo</strong>.<br />
<strong>The</strong> <strong>Volvo</strong> <strong>Group</strong> enters partnership with<br />
WWF to reduce CO 2<br />
-emissions<br />
<strong>The</strong> <strong>Volvo</strong> <strong>Group</strong> will be the world’s first vehicle<br />
manufacturer to join the World Wide Fund for<br />
Nature’s (WWF) Climate Savers Program. As a<br />
WWF partner, the <strong>Volvo</strong> <strong>Group</strong>’s truck companies<br />
undertake to reduce the CO 2<br />
-emissions from<br />
vehicles manufactured between 2009 and 2014<br />
by 13 million tons. Independent technical experts<br />
will oversee the results.<br />
Events after balance-sheet date<br />
<strong>Volvo</strong> part of investigation by European<br />
Commission<br />
In January 2011, <strong>Volvo</strong> <strong>Group</strong> and a number of<br />
other companies in the truck industry have<br />
become part of an investigation by the European<br />
Commission regarding a possible violation of EU<br />
antitrust rules.<br />
Proposal for voluntary conversion of<br />
series A shares<br />
In a letter to AB <strong>Volvo</strong>’s Board of Directors ahead<br />
of the <strong>Annual</strong> General Meeting (AGM) on April 6<br />
this year, AB <strong>Volvo</strong>’s two largest shareholders –<br />
Renault S.A. and Industrivärden – have proposed<br />
an addendum to AB <strong>Volvo</strong>’s articles of association<br />
that would permit voluntary conversion of<br />
series A to series B shares.<br />
Corporate Governance <strong>Report</strong> <strong>Volvo</strong> has issued<br />
a corporate governance report which is separate<br />
from the annual report. <strong>The</strong> corporate governance<br />
report is included in this document, after the<br />
annual report as such, on the pages 138–147.<br />
25
Board of directors’ report <strong>2010</strong><br />
Organiz ation<br />
Organized to be close to<br />
customers and drive economies<br />
of scale<br />
<strong>The</strong> <strong>Volvo</strong> <strong>Group</strong>’s product-related companies in the different segments work closely<br />
together with customers while <strong>Group</strong>-wide resources in the business units work to create<br />
economies of scale. Approximately 70% of the <strong>Group</strong>’s 90,000 employees work in the<br />
product-related companies and 30% work in the business units.<br />
Net sales as<br />
Business units PERCENTAGE of<br />
<strong>Volvo</strong> <strong>Group</strong>’s<br />
segment<br />
sales<br />
Trucks<br />
<strong>The</strong> truck operations product portfolio is sold and marketed under five different brands:<br />
<strong>Volvo</strong>, Renault, UD and Mack and also Eicher from VE Commercial Vehicles (50% ownership)<br />
in India. <strong>The</strong> product offer stretches from heavy-duty trucks for long-haulage and<br />
construction work to light-duty trucks for distribution.<br />
Number of employees: 38,533 (37,575).<br />
Number of delivered trucks: 179,989 (127,681).<br />
63% (63)<br />
<strong>Volvo</strong> 3P<br />
<strong>Volvo</strong> 3P is responsible for product planning, product development and purchasing for the <strong>Group</strong>’s truck companies. Product planning<br />
involves having the right products over the longer term. Product development focuses on chassis, cabins and electrical systems. In<br />
purchasing, <strong>Volvo</strong> 3P offers significant size and negotiating strength. Number of employees: 3,748 (4,022).<br />
<strong>Volvo</strong> Powertrain<br />
<strong>Volvo</strong> Powertrain coordinates the <strong>Volvo</strong> <strong>Group</strong>’s driveline operations and is responsible for the development and manufacturing of medium-duty and heavyduty<br />
diesel engines, gearbox and driveshafts. <strong>Volvo</strong> Powertrain also manufactures light-duty engines for external customers and is responsible for ensuring<br />
that the <strong>Volvo</strong> <strong>Group</strong> is supplied with drivelines for medium-duty applications from external manufacturers. Number of employees: 8,305 (8,143).<br />
<strong>Volvo</strong> Parts<br />
<strong>Volvo</strong> Parts provides services and tools for the aftermarket. <strong>The</strong> services start with the suppliers and proceed via the dealers all the way to<br />
the end-customers. This entails planning, purchasing, shipping and storing parts, as well as inventory management, order management, and<br />
tools for workshop maintenance and other services for the aftermarket. Number of employees: 4,063 (4,133).<br />
<strong>Volvo</strong> Logistics<br />
<strong>Volvo</strong> Logistics develops and provides transport and logistics solutions to the automotive and aerospace industries worldwide. Its customers come partly from<br />
outside the <strong>Volvo</strong> <strong>Group</strong>. <strong>Volvo</strong> Logistics provides customeradapted services throughout the logistics chain – everything from the design of complex logistics<br />
systems to packaging, insurance and distribution solutions for finished products. Number of employees: 1,194 (1,157).<br />
<strong>Volvo</strong> Business Services<br />
<strong>Volvo</strong> Business Services provides administrative services to <strong>Volvo</strong> <strong>Group</strong> companies. Its operations include accounts payable, accounts<br />
receivable, accounting and human resources administration. Number of employees: 902 (910).<br />
<strong>Volvo</strong> Information Technology<br />
<strong>Volvo</strong> IT’s business concept is to manage complex IT systems. <strong>Volvo</strong> IT delivers solutions for all segments of the industrial process<br />
and provides unique expertise in product lifecycle management, SAP solutions and IT operation. Its customers include, for<br />
example, the <strong>Volvo</strong> <strong>Group</strong>, <strong>Volvo</strong> Cars and other large industrial companies. Number of employees: 4,952 (4,984).<br />
<strong>Volvo</strong> <strong>Group</strong> Real Estate, <strong>Volvo</strong> Technology, <strong>Volvo</strong> Technology Transfer, <strong>Volvo</strong> <strong>Group</strong> NAP<br />
26
Business Units<br />
<strong>The</strong> business units are organized globally and<br />
combine expertise in key areas. <strong>The</strong>y have the<br />
overall responsibility for product planning and<br />
purchasing and for developing and delivering<br />
components, subsystems, services, and service<br />
and support to the <strong>Group</strong>’s business areas. <strong>The</strong><br />
structure creates economies of scale in product<br />
development, production, parts supply, logistics,<br />
administration and support functions.<br />
In addition to the business units in the overview<br />
below, there is <strong>Volvo</strong> Technology that<br />
de velops new technology and new concepts for<br />
products and services in the transportation and<br />
automotive industries. <strong>Volvo</strong> <strong>Group</strong> Real Estate<br />
conducts property management and development.<br />
<strong>Volvo</strong> Technology Transfer invests in companies<br />
with projects of technical and commercial<br />
interest. <strong>Volvo</strong> <strong>Group</strong> NAP (Non-Automotive Purchasing)<br />
is a global procurement organization<br />
sourcing the goods and services that are<br />
not used in the manufacturing of the <strong>Group</strong>’s<br />
products.<br />
Buses<br />
has a product range comprising<br />
city and intercity buses, coaches<br />
and chassis.<br />
Number of employees: 7,665<br />
(8,095).<br />
Number of delivered<br />
buses: 10,229 (9,857).<br />
Construction Equipment<br />
manufactures equipment for<br />
construction applications and<br />
related industries.<br />
Number of employees: 13,599<br />
(13,456).<br />
Number of machines sold:<br />
66,000 (38,800).<br />
<strong>Volvo</strong> Penta<br />
offers engines and drive systems<br />
for leisure and commercial boats<br />
and for industrial applications such<br />
as gensets and materials handling.<br />
Number of employees: 1,211<br />
(1,358).<br />
Delivered marine and industrial<br />
engines: 51,588 (44,983).<br />
<strong>Volvo</strong> Aero<br />
offers advanced components for<br />
aircraft engines and space applications<br />
with a focus on lightweight<br />
technology for reduced<br />
fuel consumption.<br />
Number of employees: 2,863<br />
(2,991).<br />
<strong>Volvo</strong> Financial Services<br />
Conducts operations in customer<br />
and dealer financing.<br />
Number of employees: 1,235<br />
(1,234).<br />
Total assets: SEK 89 billion (99).<br />
8% (8) 20% (16)<br />
3% (4) 3% (4)<br />
3% (5)<br />
27
Board of directors’ report <strong>2010</strong><br />
Trucks<br />
Strong earnings improvement<br />
<strong>2010</strong> was characterized by a recovery in demand in the <strong>Group</strong>’s mature markets<br />
and continued strong growth in the emerging markets.<br />
During the year, order intake in Europe and North<br />
America increased successively from low initial<br />
levels. <strong>The</strong> Japanese market grew during the first<br />
half of the year and then stumbled after the government<br />
incentive program for investments in<br />
new trucks ceased. Throughout the year, demand<br />
remained strong in many emerging markets,<br />
including Brazil and India.<br />
Total market<br />
<strong>The</strong> total market for heavy-duty trucks in <strong>2010</strong> in<br />
the 27 EU countries, plus Norway and Switzerland,<br />
amounted to 179,185 vehicles, an increase of 8%<br />
compared with 165,269 vehicles in the preceding<br />
year. <strong>The</strong> recovery of the European truck market<br />
was divided between North and South and<br />
between fleets and smaller customers, with the<br />
former categories recording stronger growth. In<br />
2011, the European market is estimated to amount<br />
to approximately 220,000 heavy-duty trucks.<br />
In North America, the total market for heavyduty<br />
trucks (Class 8) increased 20% to 142,096<br />
vehicles, compared with 117,983 in the preceding<br />
year. Viewed as a whole, higher levels of activity<br />
among customers in the long-haulage industry<br />
offset a continued weak market for trucks in the<br />
building and construction industry. In 2011, the<br />
total market in North America is estimated to<br />
amount to approximately 220,000 heavy-duty<br />
trucks.<br />
<strong>The</strong> total market for heavy-duty trucks in<br />
Japan rose 29% to 24,453 vehicles (18,889).<br />
<strong>The</strong> Japanese market is expected to grow 10% in<br />
2011. <strong>The</strong> market for heavy-duty trucks in India<br />
amounted to 211,543 vehicles (125,173), in <strong>2010</strong>.<br />
In Brazil, the total market rose 64% to 109,760<br />
heavy-duty trucks (66,950), primarily driven by<br />
the country’s strong economy, but also by advantageous<br />
loan terms for investments in new trucks.<br />
Earnings<br />
In <strong>2010</strong>, net sales in the truck operations<br />
increased by 20% to SEK 167,305 M (138,940).<br />
<strong>The</strong> operating income improved to SEK 10,112 M<br />
(loss: 10,805), while the operating margin was<br />
6.0% (neg: 7.8).<br />
<strong>The</strong> improvement in operating income is principally<br />
due to improved sales and the considerable<br />
cost savings implemented in 2009. Higher<br />
capacity utilization as a side effect of increased<br />
production levels in most plants contributed to<br />
improved operating income.<br />
<strong>Volvo</strong> Trucks<br />
<strong>Volvo</strong> Trucks can look back on<br />
a successful <strong>2010</strong> despite<br />
difficult market conditions.<br />
Following the financial crisis<br />
in 2009, the employees’ full<br />
commitment assisted in the rapid adaptation to<br />
substantially lower demand in parallel with the<br />
completion of long-term investments in the<br />
future. As a result, <strong>Volvo</strong> Trucks has exited the<br />
crisis a much stronger company.<br />
Consistent implementation<br />
Cost savings and measures to improve cash flow<br />
were implemented consistently. Breakeven levels<br />
were reduced considerably and maintained at the<br />
new levels through consistent cost discipline.<br />
Non-European markets recovered strongly led by<br />
South America, where Brazil proved extremely<br />
successful and profitable due to the company’s<br />
strong position and presence. Combined with<br />
improved demand in parts of Europe, this resulted<br />
in the company being able to rehire personnel. In<br />
North America, demand for trucks for long-haulage<br />
transports increased successively throughout<br />
the year.<br />
In <strong>2010</strong>, the challenge comprised responding<br />
and adapting delivery capacity to rapidly rising<br />
demand. This was achieved through beneficial<br />
collaboration between employees and suppliers,<br />
which resulted in significantly increased deliveries<br />
and growing market shares. Also, delivery<br />
times were kept relatively short.<br />
<strong>The</strong> truck operations consist<br />
of <strong>Volvo</strong> Trucks, Renault<br />
Trucks, UD Trucks, Mack<br />
Trucks and VECV in India<br />
(50% direct and indirect<br />
ownership). <strong>The</strong> product<br />
offer stretches from heavyduty<br />
trucks for long-haulage<br />
and construction work to<br />
light-duty trucks for distribution.<br />
Number of employees<br />
38,533<br />
Position on world market<br />
In total, the <strong>Volvo</strong> <strong>Group</strong> is Europe’s<br />
largest and the world’s second largest<br />
Western manufacturer of heavy<br />
trucks.<br />
Brands<br />
<strong>Volvo</strong>, Renault, UD, Mack and Eicher.<br />
Staffan Jufors<br />
President of <strong>Volvo</strong><br />
Trucks.<br />
Dennis Slagle<br />
President and CEO of<br />
North American Trucks.<br />
Stefano Chmielewski<br />
President of Renault Trucks.<br />
Pär Östberg<br />
President of Trucks Asia.<br />
Ambitions <strong>2010</strong><br />
• Capture growth in emerging markets.<br />
• Increase industrial productivity in up-turn.<br />
• Control costs.<br />
• Successful introduction of new engine generations<br />
in the US and Japan.<br />
28
Net sales as percentage<br />
of <strong>Volvo</strong><br />
<strong>Group</strong>’s sales<br />
63% (63)<br />
Net sales<br />
SEK bn<br />
06 07 08 09 10<br />
171.3 187.9 203.6 138.9 167.3<br />
Operating income (loss)<br />
and operating margin<br />
167.3 10,112<br />
06<br />
13,116<br />
7.7<br />
07 08 09 10<br />
15,193 12,167 (10,805) 10,112<br />
8.1 6.0 (7.8) 6.6<br />
SEK M<br />
%<br />
Deliveries by market<br />
Trucks 2009 <strong>2010</strong><br />
Europe 49,145 65,503<br />
North America 17,574 24,282<br />
South America 12,587 21,483<br />
Asia 34,800 53,833<br />
Other markets 13,575 14,888<br />
Total 127,681 179,989<br />
Net sales by market<br />
Trucks, SEK M 2009 <strong>2010</strong><br />
Europe 65,874 69,606<br />
North America 21,563 26,901<br />
South America 12,490 21,680<br />
Asia 26,943 35,231<br />
Other markets 12,069 13,888<br />
Total 138,940 167,305<br />
Consistent product development<br />
Throughout the crisis, <strong>Volvo</strong> Trucks maintained its<br />
investments in the dealer network, production<br />
system and product development. Two new<br />
trucks were launched in <strong>2010</strong> in line with longterm<br />
plans. <strong>The</strong> company consolidated its position<br />
in the building and construction segment<br />
through the launch of a new truck specialized for<br />
the segment, the <strong>Volvo</strong> FMX. Additionally, a new<br />
version of the <strong>Volvo</strong> FM distribution truck was<br />
launched. Both trucks were well-received by customers<br />
throughout the world.<br />
In North America, customers responded very<br />
positively to <strong>Volvo</strong>’s new trucks equipped with<br />
engines that meet the EPA <strong>2010</strong> emission requirement,<br />
which entered force on January 1, <strong>2010</strong>,<br />
thus strengthening the market position.<br />
<strong>The</strong> year has seen the company make significant<br />
progress in the environmental area through<br />
presentation of new solutions and field testing<br />
with key customers of alternative fuels, including<br />
bio-DME, methane-diesel and hybrid technology.<br />
Market shares in Europe,<br />
heavy-duty trucks<br />
Market shares in Europe,<br />
medium-duty trucks<br />
Market shares in North America,<br />
heavy-duty trucks<br />
Market shares in Japan,<br />
heavy-duty trucks<br />
09 10<br />
13.2% 14.2%<br />
<strong>Volvo</strong><br />
09 10<br />
10.6% 10.2%<br />
Renault<br />
09 10<br />
5.4% 5.2%<br />
<strong>Volvo</strong><br />
09 10<br />
11.6% 10.9%<br />
Renault<br />
09 10<br />
7.4% 8.8%<br />
<strong>Volvo</strong><br />
09 10<br />
7.4% 7.4%<br />
Mack<br />
09 10<br />
23.3% 22.2%<br />
UD<br />
Outcome <strong>2010</strong><br />
• Strong increase in deliveries in Asia (+55%) and South America (+71%).<br />
• Turned loss into profit of SEK 10 billion.<br />
• <strong>The</strong> trucks with new engines captured market shares in the U.S.<br />
• <strong>The</strong> new Quon truck with <strong>Group</strong> engine well-received by customers in Japan.<br />
Ambitions 2011<br />
• Manage to ramp up production in line with demand.<br />
• Increase productivity in all parts of the business.<br />
• Continued cost control.<br />
• Secure delivery of product development projects according to plan.<br />
29
Board of directors’ report <strong>2010</strong><br />
Renault Trucks<br />
For Renault Trucks, <strong>2010</strong> was<br />
a year in which the company<br />
proved its ability to make a<br />
comeback. After an extremely<br />
trying 2009, with many challenges,<br />
<strong>2010</strong> was about initiating the recovery,<br />
aided by the strong commitment of all employees.<br />
Deliveries by market<br />
<strong>Volvo</strong> Trucks 2009 <strong>2010</strong><br />
Europe 19,749 29,635<br />
North America 8,028 12,749<br />
South America 10,349 18,639<br />
Asia 5,573 10,071<br />
Other markets 3,712 4,135<br />
Total 47,411 75,229<br />
Renault Trucks 2009 <strong>2010</strong><br />
Europe 29,396 35,867<br />
North America 458 54<br />
South America 574 656<br />
Asia 1,794 3,448<br />
Other markets 5,263 5,563<br />
Total 37,485 45,588<br />
UD Trucks 2009 <strong>2010</strong><br />
Europe – –<br />
North America 853 1,010<br />
South America 445 300<br />
Asia 16,753 23,908<br />
Other markets 3,458 4,130<br />
Total 21,509 29,348<br />
Mack Trucks 2009 <strong>2010</strong><br />
Europe 0 1<br />
North America 8,235 10,469<br />
South America 1,219 1,888<br />
Asia 505 47<br />
Other markets 1,142 1,060<br />
Total 11,101 13,465<br />
Eicher 1 2009 <strong>2010</strong><br />
Europe – –<br />
North America – –<br />
South America – –<br />
Asia 10,175 16,359<br />
Other markets – –<br />
Total 10,175 16,359<br />
1 <strong>The</strong> joint venture together with Eicher Motor Limited is to<br />
50% consolidated into the <strong>Volvo</strong> <strong>Group</strong>. <strong>The</strong> deliveries in the<br />
table pertain to the <strong>Volvo</strong> <strong>Group</strong>’s share of Eicher’s deliveries.<br />
Recovery<br />
After the first half of <strong>2010</strong> with a reduced working<br />
week for blue and white collar workers, the<br />
second half of the year brought a dramatic<br />
change. A gradual, steady increase in the order<br />
intake meant that by the summer, Renault Trucks<br />
was back in full production; however, the recovery<br />
was modest, slow and fragile. In view of the weak<br />
demand, focus was placed on the continued<br />
reduction of costs.<br />
Renault Trucks retained its permanent employees<br />
with the assistance of government measures<br />
that permitted a reduced working week with layoff<br />
pay. <strong>The</strong>se measures enabled the company to<br />
retain its workforce pending the expected upturn,<br />
and were ended during the summer of <strong>2010</strong>.<br />
Presence<br />
Renault Trucks maintained its presence at the<br />
forefront of key social issues, including the reduction<br />
in carbon emissions through the use of the<br />
hybrid and electric trucks delivered to customers.<br />
<strong>The</strong> Renault Premium long-haulage truck<br />
proved best in respect of fuel consumption and<br />
operating costs in an independent test of a<br />
pan-European truck fleet at a German freight<br />
company.<br />
Renault Trucks continues to invest in product<br />
development to be able to launch new, competitive<br />
trucks in the next few years.<br />
During the year, production of trucks started at<br />
the plant in Kaluga, Russia.<br />
UD Trucks<br />
<strong>2010</strong> was a significant year<br />
for Nissan Diesel. On February<br />
1, Nissan Diesel changed<br />
its name to UD Trucks with<br />
the aim of building UD into a<br />
global truck brand. UD Trucks has a wide range of<br />
light, medium-duty and heavy-duty trucks, as well<br />
as buses and bus chassis.<br />
Market shares<br />
In the first half of <strong>2010</strong>, the Japanese market was<br />
positively affected by the scrapping premiums for<br />
old trucks if owners concurrently invested in new,<br />
greener products. Since UD Trucks had a substantial<br />
percentage of trucks that met the new<br />
environmental requirements, the company captured<br />
market shares. When the scrapping premiums<br />
ceased in August, demand weakened. <strong>The</strong><br />
total market for heavy-duty trucks rose 29% to<br />
24,453 vehicles (18,889). During the year, UD<br />
Trucks had 22.2% of the Japanese market for<br />
heavy-duty trucks compared with 23.3% in 2009.<br />
UD – Ultimate Dependability<br />
UD, which stands for Ultimate Dependability,<br />
became the new brand since the abbreviation<br />
was already recognized by customers, who call<br />
the vehicles UD products. <strong>The</strong> UD name is widely<br />
known since the letters are engraved in the<br />
emblem, which since the 1950s, has been<br />
located on both sides of the vehicles. In conjunction<br />
with this change, the name of the company<br />
was changed from Nissan Diesel Motor Co. Ltd to<br />
UD Trucks Corporation.<br />
New trucks launched<br />
<strong>The</strong> new generation of heavy-duty trucks in the<br />
Quon range was launched in the Japanese market<br />
in April and the first version of the new Condor<br />
range in August. Sales of the new Condor<br />
truck have also started in the US. <strong>The</strong>se new<br />
truck models are equipped with SCR engines<br />
based on the <strong>Group</strong>’s joint engine platforms. <strong>The</strong>y<br />
meet with the latest emission legislation in Japan<br />
and the USA and have improved fuel efficiency.<br />
Additionally, UD Trucks launched the UD Genuine<br />
After Market program to provide customers with<br />
access to original service and original spares,<br />
which will help customers reduce their operating<br />
expenses.<br />
30
Mack Trucks<br />
In North America, the overall<br />
economic environment, along<br />
with demand for heavy-duty<br />
highway trucks, gradually improved<br />
moving through the year.<br />
As large competitor inventories of pre-<br />
EPA<strong>2010</strong> engines were finally drawn down and a<br />
more level playing field was established, both<br />
Mack and <strong>Volvo</strong> capitalized on their more extensively<br />
tested, highly fuel efficient, fully certified<br />
EPA<strong>2010</strong> products that comply with the new<br />
emission standards introduced in North America<br />
in January <strong>2010</strong>.<br />
Positive response from customers<br />
Feedback regarding both Mack and <strong>Volvo</strong><br />
EPA<strong>2010</strong> trucks, particularly on fuel economy<br />
and engine performance, grew ever more positive<br />
throughout the year, as more and more customers<br />
gained experience with the products. To meet<br />
increasing demand, production was gradually<br />
ramped up in all manufacturing facilities during<br />
the second half of the year.<br />
Many new products launched<br />
For Mack, the ongoing weakness in the construction<br />
segment remained a significant challenge.<br />
Despite essentially no market for the dump and<br />
mixer trucks that are core to its business, the<br />
brand finished the year with a U.S. retail share<br />
equal to 2009, reflecting a determined effort to<br />
increase volumes in other segments.<br />
Mack maintained its longtime leadership position<br />
in low cabover straight trucks used primarily<br />
in refuse applications. <strong>The</strong> brand also moved from<br />
the number four to the number two position in the<br />
day cab and small sleeper segment of the highway<br />
market. Both Chrysler <strong>Group</strong> Transport and<br />
global logistics leader UPS placed significant<br />
orders for Mack EPA<strong>2010</strong>-certified Pinnacle day<br />
cabs (325 and 475 respectively).<br />
In line with the <strong>Group</strong>’s commitment to ongoing<br />
investment despite difficult market conditions,<br />
Mack introduced the mDRIVE automated manual<br />
transmission based on highly regarded <strong>Group</strong><br />
architecture. <strong>The</strong> mDRIVE is developed to work<br />
with Mack’s MP engines to deliver better fuel<br />
economy, driveability and safety. Mack also<br />
expanded its line-up of natural gas (NG) trucks,<br />
introducing an NG-powered version of its Terra-<br />
Pro cabover model for refuse and construction<br />
customers.<br />
Eicher<br />
VE Commercial Vehicles<br />
(VECV), which is a joint-venture<br />
company opened by the<br />
<strong>Volvo</strong> <strong>Group</strong> and Eicher<br />
Motors, designs, develops, manufactures and<br />
markets trucks and buses under the Eicher<br />
brand. 50% of VECV is consolidated in the <strong>Volvo</strong><br />
<strong>Group</strong>.<br />
Eicher’s product range comprises light,<br />
medium-heavy and heavy-duty trucks and buses<br />
in the weight classes 5–40 tons and complete<br />
bus chassis in the 5–15 ton range. <strong>The</strong> company<br />
has an extensive dealer and service network principally<br />
located in India.<br />
Eicher’s industrial operations comprise the<br />
manufacture of cabs, axles, gearboxes and<br />
engines as well as assembly of trucks and buses.<br />
Key investments are currently being made in painting,<br />
expansion of capacity, a new engine plant, in<br />
the wholly-owned distribution network and in a<br />
product development center for developing the<br />
next generation of trucks and buses.<br />
Increased market shares<br />
In <strong>2010</strong>, the total market for medium-duty trucks<br />
(7–16 tons) rose by 50% in India while deliveries<br />
of Eicher trucks in the medium-duty segment<br />
increased by 51%.<br />
In India, demand for heavy-duty trucks over 16<br />
tons showed solid growth of 69% in <strong>2010</strong>. Deliveries<br />
of Eicher trucks in the heavy-duty segment<br />
rose by 105%, significantly outperforming the<br />
market and leading to increased market shares.<br />
Deliveries by segment<br />
<strong>Volvo</strong> Trucks 2009 <strong>2010</strong><br />
Light trucks (under 7 tons) – –<br />
Medium trucks (7–16 tons) 1,556 1,758<br />
Heavy trucks (over 16 tons) 45,855 73,471<br />
Total 47,411 75,229<br />
Renault Trucks 2009 <strong>2010</strong><br />
Light trucks (under 7 tons) 13,993 14,140<br />
Medium trucks (7–16 tons) 5,556 7,385<br />
Heavy trucks (over 16 tons) 17,936 24,063<br />
Total 37,485 45,588<br />
UD Trucks 2009 <strong>2010</strong><br />
Light trucks (under 7 tons) 8,248 9,657<br />
Medium trucks (7–16 tons) 6,651 9,572<br />
Heavy trucks (over 16 tons) 6,610 10,119<br />
Total 21,509 29,348<br />
Mack Trucks 2009 <strong>2010</strong><br />
Light trucks (under 7 tons) – –<br />
Medium trucks (7–16 tons) 1 2<br />
Heavy trucks (over 16 tons) 11,100 13,463<br />
Total 11,101 13,465<br />
Eicher 1 2009 <strong>2010</strong><br />
Light trucks (under 7 tons) 1,113 2,014<br />
Medium trucks (7–16 tons) 7,889 11,940<br />
Heavy trucks (over 16 tons) 1,174 2,406<br />
Total 10,175 16,359<br />
1 <strong>The</strong> joint venture together with Eicher Motor Limited is to<br />
50% consolidated into the <strong>Volvo</strong> <strong>Group</strong>. <strong>The</strong> deliveries in the<br />
table pertain to the <strong>Volvo</strong> <strong>Group</strong>’s share of Eicher’s deliveries.<br />
31
Board of directors’ report <strong>2010</strong><br />
Buses<br />
Increased sales and improved<br />
profitability<br />
During<br />
<strong>2010</strong>, <strong>Volvo</strong> Buses strongly improved its income due to a<br />
customized product range, higher sales and a strong focus on cost<br />
reductions.<br />
<strong>Volvo</strong> Buses is one of the world’s largest manufacturers<br />
of heavy buses. <strong>The</strong> range comprises<br />
complete buses, chassis, transport solutions,<br />
telematic systems, financial solutions, as well as<br />
service and maintenance contracts. <strong>The</strong> company<br />
offers global products adapted to local conditions,<br />
with manufacturing in Europe, Asia, North<br />
America, South America and Africa.<br />
<strong>Volvo</strong> Buses has sales in about 85 countries<br />
and one of the bus industry’s strongest service<br />
networks, with more than 1,500 retailers and<br />
service workshops globally.<br />
Focus on cost-efficient solutions<br />
In the bus industry, focus remains on developing<br />
cost-efficient transport solutions and reducing<br />
energy consumption and the impact on the environment.<br />
It is about lower fuel consumption, alternative<br />
fuels and alternative energy sources.<br />
During the year, <strong>Volvo</strong> Buses began delivering<br />
buses that comply with the tough Euro V emission<br />
requirements in Europe and EPA<strong>2010</strong> in<br />
North America, including buses with the new<br />
13-liter engine. <strong>The</strong> response from customers<br />
has been very positive, both in terms of improved<br />
performance and reduced fuel consumption.<br />
Serial production of hybrid buses<br />
During the year, the company also took an important<br />
step toward significantly reducing energy<br />
consumption in terms of city buses. In May, serial<br />
production commenced on the <strong>Volvo</strong> 7700 Hybrid<br />
buses and <strong>Volvo</strong> B5L Hybrid double-decker<br />
buses. By recycling the brake energy, the buses<br />
will be able to operate partly on electricity, which<br />
will contribute to a reduction in fuel consumption<br />
of up to 35% and, accordingly emissions of the<br />
greenhouse gas, carbon dioxide. <strong>Volvo</strong>’s hybrid<br />
buses currently operate in several cities around<br />
Europe. Interest is high worldwide and during the<br />
year, the hybrid buses were test-driven in Brazil,<br />
Colombia and Mexico.<br />
Developing aftermarket<br />
However, high-quality buses are not sufficient.<br />
Customers need a strong support in the aftermarket.<br />
This applies to telematics, which assists<br />
customers in controlling traffic, conducting follow-ups<br />
of fuel consumption, for example, and in<br />
planning service. <strong>Volvo</strong> Buses’ telematic system,<br />
ITS4mobility, is one of the world’s best and a third<br />
step, Vehicle Management, was introduced during<br />
the year. This means that customers are able<br />
to remotely read all signals from the buses’ control<br />
system and thus plan future service measures,<br />
resulting in reduced costs.<br />
Increased deliveries<br />
Despite the weak trend reported during the year<br />
for the total market for <strong>Volvo</strong> Buses’ key markets<br />
in Europe and the coach market in North America,<br />
<strong>Volvo</strong> succeeded in increasing deliveries<br />
compared with 2009. During the year, 10,229<br />
buses and bus chassis (9,857) were delivered.<br />
Sales increased in several locations in Asia, for<br />
example, in India and Australia, as well as in<br />
South America and in the Nordic region. During<br />
the year, <strong>Volvo</strong> Buses was able to strengthen its<br />
market shares in several markets.<br />
Increased sales and improved profits<br />
Net sales rose in <strong>2010</strong> to SEK 20,516 M (18.465).<br />
Operating income rose from a negative SEK 350<br />
Buses has a product range<br />
comprising city and intercity<br />
buses, coaches and chassis.<br />
Number of employees<br />
7,665<br />
Position on world market<br />
<strong>The</strong> business area is one of the<br />
world’s largest producers of buses.<br />
Brands<br />
<strong>Volvo</strong>, Prevost, Nova, Sunwin and<br />
Silver.<br />
Håkan Karlsson<br />
President of <strong>Volvo</strong><br />
Buses.<br />
Ambitions <strong>2010</strong><br />
• Profitable growth in all regions.<br />
• Continued focus on cost-cutting and lower inventory levels.<br />
• Increased sales of services and aftermarket products.<br />
• Secure successful introductions of Euro V, EPA <strong>2010</strong> and hybrids.<br />
32
Net sales as percentage<br />
of <strong>Volvo</strong><br />
<strong>Group</strong> sales<br />
8% (8)<br />
Net sales<br />
SEK bn<br />
Operating income (loss) and<br />
operating margin<br />
20.5 780<br />
Deliveries by market<br />
Buses 2009 <strong>2010</strong><br />
Europe 3,164 2,395<br />
North America 1,539 2,092<br />
South America 690 1,174<br />
Asia 3,839 3,477<br />
Other markets 625 1,091<br />
Total 9,857 10,229<br />
Net sales by market<br />
Buses, SEK M 2009 <strong>2010</strong><br />
Europe 7,707 6,242<br />
North America 5,673 7,200<br />
South America 1,235 1,737<br />
Asia 2,749 3,299<br />
Other markets 1,101 2,038<br />
Total 18,465 20,516<br />
06 07 08 09 10 06 07 08 09 10<br />
17.3 16.6 17.3 18.5 20.5 745 231 (76) (350) 780 SEK M<br />
4.3 1.4 (0.4) (1.9) 3.8 %<br />
M to a positive SEK 780 and the operating margin<br />
was 3.8% (neg: 1.9). An important explanation<br />
for the strong income improvement is higher<br />
sales. Another explanation is the effort from the<br />
company to reduce costs and streamline the<br />
product offering and production.<br />
New bus generates rational production<br />
During the year, <strong>Volvo</strong> Buses launched a new<br />
intercity bus in Europe, the <strong>Volvo</strong> 8900. It is<br />
lighter and more fuel-efficient and will replace<br />
two similar bus models. <strong>The</strong> new bus is built in<br />
a module system and can be manufactured in<br />
<strong>Volvo</strong>’s plants in Sweden and Poland. This will<br />
generate a more rational and flexible production.<br />
Outcome <strong>2010</strong><br />
• Increased sales in all regions and the company reported positive results.<br />
• Costs decreased and inventories levels were lower.<br />
• Higher sales and income in the aftermarket operations.<br />
• <strong>The</strong> new products were introduced and were received very well by customers.<br />
Ambitions 2011<br />
• Profitable growth in all regions.<br />
• Increased aftermarket operations.<br />
• Increased utilization of global production presence.<br />
• Focus on cost and capital efficiency.<br />
33
Board of directors’ report <strong>2010</strong><br />
Construction Equipment<br />
Good growth in sales<br />
and profit<br />
<strong>Volvo</strong> CE is one of the world’s leading manufacturers of articulated<br />
haulers and one of the leading manufacturers of wheel loaders, excavators,<br />
road construction equipment and compact machines.<br />
<strong>Volvo</strong> CE’s products, spare parts and services are<br />
available in more than 125 countries. <strong>The</strong> products<br />
are mainly used in such segments as general<br />
construction, road construction and maintenance,<br />
as well as in the refuse, mining and<br />
forestry industries.<br />
Recovery<br />
Measured in units sold, the total world market for<br />
heavy, compact and road machinery equipment<br />
increased by 44%, compared to 2009. During<br />
<strong>2010</strong>, the European markets rose 15%, while<br />
North America rose 20%. Both Asia and Other<br />
markets rose 60%. <strong>The</strong> strong growth in the<br />
BRIC countries, Brazil, Russia, India and China,<br />
propelled development to a large extent.<br />
Increase in delivery and sales<br />
During <strong>2010</strong>, <strong>Volvo</strong> CE sold 66,000 machines,<br />
compared with 38,800 machines in 2009. Net<br />
sales amounted to SEK 53,810 M, an increase of<br />
51%, compared with SEK 35,658 M in 2009.<br />
Operating profit totaled SEK 6,180 M (loss:<br />
4,005). <strong>The</strong> operating margin improved significantly<br />
and amounted to 11.5%, compared with a<br />
negative 11.2% in 2009. <strong>The</strong> improved operating<br />
profit was attributable to increased sales, internal<br />
cost-reduction measures, improved cost coverage<br />
in the production system and higher productivity.<br />
Secure development in the BRIC countries<br />
During the year, several initiatives were implemented<br />
to support development in the BRIC<br />
countries (Brazil, Russia, India and China).<br />
Investments to expand excavator manufacturing<br />
were made in India and decided upon in Brazil.<br />
<strong>The</strong> investments include assembly and manufacture<br />
of components for the models in the<br />
domestic markets. In China, excavator capacity<br />
was also increased by a decision to commence<br />
manufacturing four new models of the SDLG<br />
excavators.<br />
In March, a decision was made to build a new<br />
technology center in Jinan, China. <strong>The</strong> technology<br />
center will focus on the development of products<br />
and components for equipment for the BRIC<br />
countries and includes the <strong>Volvo</strong> and Lingong<br />
brands.<br />
Presence in the Russian market was strengthened<br />
further by an agreement with Ferronordic,<br />
which is planning to expand its distribution network<br />
with more affiliates to increase sales and<br />
service.<br />
Joint product plan<br />
As the Chinese economy is growing, so is demand<br />
for excavators. Supported by <strong>Volvo</strong> CE, Lingong<br />
has now launched its own excavators. <strong>The</strong><br />
co operation between <strong>Volvo</strong> and Lingong has also<br />
been strengthened by a joint product plan.<br />
Key aftermarket<br />
Service and aftermarket products play a key role<br />
for <strong>Volvo</strong> CE as a supplier of turnkey solutions.<br />
Service and aftermarket products accounted for<br />
23% of the total earnings in <strong>2010</strong>. For instance,<br />
the sale of attachments increased from SEK<br />
540 M to SEK 1,270 M.<br />
Increased usage of telematics<br />
Through continuous equipment monitoring, <strong>Volvo</strong><br />
CE’s telematic system, CareTrack, is able to facilitate<br />
additional productivity and accessibility. By<br />
using GPS or satellite technology, information<br />
about the machines may be forwarded to any<br />
possible location. Through error reports and<br />
warnings, the system offers diagnostic assistance,<br />
which, in turn, facilitates identifying and<br />
repairing problems more rapidly. During <strong>2010</strong>, a<br />
decision was made that all newly produced large<br />
machines (wheel loaders in excess of 10 tons,<br />
haulers and excavators in excess of 12 tons, as<br />
well as graders) will include a three-year Care-<br />
Track service agreement as a standard feature.<br />
Focus on efficiency in production<br />
and development<br />
To additionally streamline the industrial system,<br />
three North American plants were reduced to one.<br />
<strong>The</strong> plants in Asheville and Goderich were closed<br />
and production relocated to the plant in Shippens-<br />
Construction Equipment<br />
manufactures equipment for<br />
construction applications<br />
and related industries.<br />
34<br />
Number of employees<br />
13,599<br />
Position on world market<br />
<strong>Volvo</strong> CE is the world’s largest manufacturer<br />
of articulated haulers and<br />
one of the world’s largest manufacturers<br />
of wheel loaders, excavators,<br />
road development machines and<br />
compact construction equipment.<br />
Brands<br />
<strong>Volvo</strong> and SDLG (Lingong).<br />
Olof Persson<br />
President of <strong>Volvo</strong><br />
Construction Equipment.<br />
Ambitions <strong>2010</strong><br />
• Secure market penetration and product adaptation in BRIC countries.<br />
• Integrate Lingong with a joint business plan for a broader offer in<br />
emerging markets.<br />
• Prioritize hard and soft products for new markets and customer<br />
segments.<br />
• Increase the use of telematics in products.<br />
• Optimize the industrial footprint to become more efficient in production<br />
and development.
Net sales as percentage<br />
of <strong>Volvo</strong><br />
<strong>Group</strong> sales<br />
20% (16)<br />
Net sales<br />
SEK bn<br />
06<br />
42.1<br />
07<br />
53.6<br />
08<br />
56.3<br />
09<br />
35.7<br />
10<br />
53.8<br />
Operating income (loss) and<br />
operating margin<br />
53.8 6,180<br />
06<br />
4,072<br />
9.7<br />
07<br />
4,218<br />
7.9<br />
08<br />
1,808<br />
3.2<br />
09<br />
(4,005)<br />
(11.2)<br />
10<br />
6,180<br />
11.5<br />
SEK M<br />
%<br />
Net sales by market<br />
Construction Equipment, SEK M 2009 <strong>2010</strong><br />
Europe 12,987 16,138<br />
North America 5,475 6,267<br />
South America 2,578 4,130<br />
Asia 12,957 24,352<br />
Other markets 1,661 2,923<br />
Total 35,658 53,810<br />
burg. USD 30 M was invested to expand the plant<br />
to improve production flow and increase capacity.<br />
At the same time, the plant meets all requirements<br />
to be classified as a sustainable facility in accordance<br />
with the U.S. Green Building Council.<br />
<br />
Product launches<br />
<strong>Volvo</strong> CE is moving ahead with its plans to deliver<br />
turnkey solutions adapted for various customer<br />
groups. At the same time, the investment in soft<br />
products continues and <strong>Volvo</strong> CE will continue to<br />
launch new value-adding products and services<br />
for customers.<br />
Product launches in <strong>2010</strong> include compact<br />
excavators EC15, EC17, EC21 and EC23, as well<br />
as compact wheel loaders L20F and L25F. In<br />
addition to these, large wheel loaders L150, 180<br />
and L220 also included OptiShift as a standard<br />
feature.<br />
An additional key event in <strong>2010</strong> was that <strong>Volvo</strong><br />
CE was awarded the Tier 4i certificate from the<br />
U.S. Environmental Protection Agency, EPA,<br />
which certifies low emissions from heavy equipment<br />
equipped with the D11, D13 and D16<br />
engines. This occurred after a similar certificate<br />
was received from the EU earlier in the year certifying<br />
that the engines complied with requirements<br />
in Europe’s Stage IIIB legislation.<br />
Outcome <strong>2010</strong><br />
• Expansion of excavator production in India and Brazil. Decision to establish a technology center<br />
in China.<br />
• Increased cooperation and synergies between <strong>Volvo</strong> and Lingong, with, among others, a joint<br />
product plan.<br />
• Equipment and service optimized for prioritized markets.<br />
• Telematic system, CareTrack, introduced as standard in all major machines.<br />
• Production in North America consolidated from three plants to one.<br />
Ambitions 2011<br />
• Further strengthen the position in the BRIC countries.<br />
• Continue to reduce the break-even level by cost reductions<br />
– material, as well as variable and fixed costs.<br />
• Successful launch of Tier4i and Stage IIIB engines in North America<br />
and Europe.<br />
• Continued development and launch of new products and services.<br />
35
Board of directors’ report <strong>2010</strong><br />
volvo penta<br />
Improved profitability despite<br />
weak leisure boat market<br />
<strong>Volvo</strong> Penta conducts its operations in two overall business segments: Marine and Industrial. For a broader general public,<br />
<strong>Volvo</strong> Penta is mostly known for its marine engines and world-leading innovations, such as the Aquamatic drive and the<br />
counter-rotating propellers, Duoprop. Boat owners worldwide associate <strong>Volvo</strong> Penta’s products with fuel-efficiency, environmental<br />
consideration, comfort, performance and operating safety.<br />
Market-leading boat builders French Beneteau/<br />
Jeanneau, German Bavaria, British Sunseeker,<br />
Italian Sessa Marine, US Tiara, Brazilian Intermarine,<br />
Swedish Hallberg-Rassy and Australian<br />
Riviera choose <strong>Volvo</strong> Penta because of one of the<br />
marine industry’s broadest product programs and<br />
to have access to the world’s most global service<br />
and retail network.<br />
However, the most rapidly growing operation<br />
for <strong>Volvo</strong> Penta in the past decade has been<br />
sales of industrial engines, which currently represent<br />
about 40% of <strong>Volvo</strong> Penta’s total sales<br />
value.<br />
<strong>The</strong> basis for the industrial engine business is<br />
the strength in the <strong>Volvo</strong> <strong>Group</strong>’s total product<br />
and service offering. Assisted by these, <strong>Volvo</strong><br />
Penta is able to offer high-technological products,<br />
as well as global support for such industrial<br />
applications as diesel-operated gensets, cranes<br />
and container handlers.<br />
Customers include such world-leading industrial<br />
companies as Finnish Cargotec, French-<br />
American SDMO, Turkish Genpower and Swedish<br />
Sandvik.<br />
<strong>The</strong> ambition is to expand industrial engine<br />
sales through increased market shares in an<br />
increasing number of segments, for example, mining<br />
and construction equipment, and in emerging<br />
markets in, for example, Asia and Africa.<br />
Through sales of marine and industrial engines,<br />
<strong>Volvo</strong> Penta will contribute significant synergies<br />
and economies of scale to the <strong>Volvo</strong> <strong>Group</strong>’s<br />
manufacture of engines and transmissions.<br />
Approximately 10% of the <strong>Group</strong>’s total diesel<br />
volume represents engines sold by <strong>Volvo</strong> Penta.<br />
With respect to the <strong>Volvo</strong> <strong>Group</strong>’s most efficient<br />
engine, the D16, <strong>Volvo</strong> Penta accounts for<br />
approximately two thirds of the <strong>Group</strong>’s total<br />
sales and consequently, delivers a crucial volume<br />
contribution to this engine series.<br />
Total market<br />
<strong>The</strong> strong decline in the total market in the<br />
marine industry in the wake of the global recession<br />
slowed down in <strong>2010</strong>. Global demand for<br />
marine engines remained largely unchanged,<br />
compared with the preceding year. <strong>The</strong> marine<br />
industry was characterized during the year by a<br />
continued cautious attitude among end consumers.<br />
On average, boat builders reported a continued<br />
low production rate in their plants, compared<br />
with the boom years.<br />
However, the total market for industrial engines<br />
strengthened due to increased demand in essentially<br />
all regions. During the year, leading industrial<br />
engine customers gradually raised sales<br />
forecasts and capacity utilization to increasingly<br />
higher levels.<br />
Product renewal<br />
<strong>Volvo</strong> Penta reported a continued high rate of<br />
product renewal. During the year, the introduction<br />
of the IPS drive system was completed with new<br />
and stronger drive units to match the <strong>Volvo</strong><br />
<strong>Group</strong>’s 11 and 13 liter engines. With these systems,<br />
<strong>Volvo</strong> Penta will be able to deliver propulsion<br />
engines in boats up to 100 feet.<br />
On the industrial side, future emission requirements<br />
entail that <strong>Volvo</strong> Penta, with its strong<br />
product program and low emission engines, will<br />
be able to capture new market shares with industrial<br />
customers in Europe, but also in the rest of<br />
the world where the environmental requirements<br />
are successively being intensified.<br />
Financial performance<br />
Net sales amounted to SEK 8,716 M, compared<br />
with SEK 8,159 M in the preceding year. Operat-<br />
<strong>Volvo</strong> Penta provides<br />
engines and power systems<br />
for leisure and commercial<br />
craft, as well as for industrial<br />
applications such as dieselpowered<br />
gensets, cranes<br />
and container handlers.<br />
Number of employees<br />
1,211<br />
Position on world market<br />
<strong>Volvo</strong> Penta is the world’s largest<br />
producer of diesel engines for leisure<br />
boats and a leading, independent<br />
producer of industrial engines.<br />
Göran Gummeson<br />
President of <strong>Volvo</strong><br />
Penta.<br />
Ambitions <strong>2010</strong><br />
• Manage risks towards suppliers and customers.<br />
• Secure positive cash flow and favorable profitability in new market<br />
conditions.<br />
• Strengthen positions within mobile applications for industrial engines.<br />
36
Net sales as percentage<br />
of <strong>Volvo</strong><br />
<strong>Group</strong> sales<br />
3% (4)<br />
Net sales<br />
SEK bn<br />
06<br />
10.8<br />
07<br />
11.7<br />
08<br />
11.5<br />
09<br />
8.2<br />
10<br />
8.7<br />
Operating income (loss)<br />
and oprating margin<br />
8.7 578<br />
06<br />
1,106<br />
10.3<br />
07<br />
1,173<br />
10.0<br />
08<br />
928<br />
8.1<br />
09<br />
(230)<br />
(2.8)<br />
10<br />
578<br />
6.6<br />
SEK M<br />
%<br />
Engine volumes<br />
<strong>Volvo</strong> Penta,<br />
No. of units 2009 <strong>2010</strong><br />
Marine engines 25,755 28,965<br />
Industrial engines 19,228 22,623<br />
Total 44,983 51,588<br />
Net sales by market<br />
<strong>Volvo</strong> Penta, SEK M 2009 <strong>2010</strong><br />
Europe 4,390 4,507<br />
North America 1,100 1,500<br />
South America 284 335<br />
Asia 2,054 2,008<br />
Other markets 331 366<br />
Total 8,159 8,716<br />
ing income amounted to SEK 578 M, compared<br />
with an operating loss of SEK 230 M in the preceding<br />
year. <strong>The</strong> operating margin was 6.6%<br />
(neg: 2.8). Income was positively impacted by primarily<br />
the effects of cost-reduction measures,<br />
but also to a certain extent by increased sales<br />
and higher capacity utilization.<br />
Production and investments<br />
In recent years, <strong>Volvo</strong> Penta made significant<br />
investments in a new global logistics system. <strong>The</strong><br />
new system, which was launched in <strong>2010</strong>, will<br />
facilitate streamlining the entire chain from order<br />
to delivery.<br />
Production in the plants in Vara, Sweden and<br />
Lexington, USA had low capacity utilization<br />
resulting from continued weak demand for<br />
marine engines globally.<br />
As a result of the increasingly strong demand<br />
for industrial engines, <strong>Volvo</strong> Penta was able to<br />
contribute to higher capacity utilization in the<br />
<strong>Volvo</strong> <strong>Group</strong>’s joint diesel engine plants in<br />
Skövde, Sweden and Lyon, France.<br />
Outcome <strong>2010</strong><br />
• Customer credit losses and deliveries from subsuppliers under control.<br />
• Continued favorable growth in the industrial engine segment.<br />
Ambitions 2011<br />
• Increased growth rate and improved profitability in both Marine<br />
and Industrial.<br />
• Secure complete customer offers for fully-integrated drive systems<br />
and instruments.<br />
• Secure product and geographic balance in terms of sales and<br />
profitability.<br />
37
Board of directors’ report <strong>2010</strong><br />
volvo Aero<br />
Improved profitability in<br />
the core business<br />
<strong>Volvo</strong><br />
Aero is playing an increasingly major role in the<br />
aircraft-engine industry. <strong>The</strong> business area is specialized<br />
in sophisticated structures, engine cases and rotating parts<br />
of aircraft engines.<br />
In recent years, <strong>Volvo</strong> Aero has taken more design<br />
responsibility and currently develops components<br />
for both aircraft and rocket engines, which are<br />
based on a proprietary design system and proprietary<br />
manufacturing technologies. <strong>The</strong> business<br />
area’s engine components are found in more than<br />
90% of all new major civil aircraft worldwide.<br />
Focus on core operations<br />
<strong>The</strong> aim of most of the technological development<br />
is to reduce the weight of proprietary components<br />
in various manners, since weight is<br />
highly significant in fuel consumption and emissions<br />
of carbon dioxide. This is an area that is<br />
becoming increasingly important to the aviation<br />
industry, both in terms of the climate and economy.<br />
Naturally, quality and safety are also in focus<br />
in the effort to reduce weight.<br />
In recent years, <strong>Volvo</strong> Aero has focused<br />
increasingly on its core operations: maintenance<br />
of a few selected engines and developing and<br />
manufacturing sophisticated components for aircraft<br />
and rocket engines. As a result of this strategy,<br />
certain other operations have been divested<br />
or discontinued.<br />
Major engine programs<br />
During <strong>2010</strong>, <strong>Volvo</strong> Aero was highly involved in all<br />
four new major engine projects that are occupying<br />
the aircraft-engine industry and will be highly significant<br />
to the development of the aircraft of the<br />
future. During the year, a number of key milestones<br />
were achieved in the development of these engines:<br />
<strong>The</strong>se include the starting of the new Rolls-<br />
Royce engine, Trent XWB, in a test cell for the<br />
first time in June. <strong>Volvo</strong> Aero is a joint-venture<br />
partner in the XWB engine, responsible for<br />
design, development and manufacture of the<br />
intermediate case, the first in titanium to be<br />
developed and manufactured entirely within<br />
<strong>Volvo</strong> Aero’s new design system. <strong>The</strong> Trent XWB<br />
will be used in the Airbus A350 XWB, which is<br />
scheduled to enter service in 2013.<br />
Pratt & Whitney completed the assembly of<br />
the first PW1000G engine, “PurePower”, for the<br />
Bombardier C series aircraft and Mitsubishi’s<br />
MRJ aircraft. <strong>Volvo</strong> Aero is a joint-venture partner<br />
in the engine, responsible for the design, development<br />
and manufacture of a couple of components.<br />
Following the final assembly, a comprehensive<br />
evaluation and certification program<br />
commenced, which will continue for the next 24<br />
months, with engine certification and the first<br />
flight with the aircraft scheduled for 2012. <strong>The</strong><br />
aircraft is scheduled for commercial use in 2013.<br />
<strong>The</strong> first flight of Boeing’s upgraded 747-8 aircraft<br />
was successfully executed in the spring,<br />
using four GEnx-2B General Electric engines.<br />
<strong>Volvo</strong> Aero is joint-venture partner in the GEnx<br />
engine, with responsibility for design and development<br />
of three components, and will manufacture a<br />
total of five different components for the engine.<br />
In 2007, <strong>Volvo</strong> Aero was contacted by Pratt &<br />
Whitney about redesigning the intermediary case<br />
for the GP7000 engine for the Airbus A380. One<br />
of several requirements specified was that the<br />
weight should be reduced by at least 10%. At the<br />
end of the year, <strong>Volvo</strong> Aero was able to present a<br />
solution that met these requirements.<br />
Key agreements<br />
<strong>The</strong> Defence Materiel Administration (FMV) and<br />
<strong>Volvo</strong> Aero signed an agreement entailing that<br />
<strong>Volvo</strong> Aero will be responsible for engine maintenance,<br />
spare parts supply and technical product<br />
support for the Gripen aircraft engine in Sweden,<br />
Hungary and the Czech Republic. <strong>The</strong> agreement,<br />
which is valid for two years, with an option<br />
for an additional three years, is estimated to be<br />
worth approximately SEK 1.2 billion for <strong>Volvo</strong><br />
Aero if the option is exercised.<br />
In terms of maintenance, a key partnership<br />
agreement was signed with Lufthansa Technik<br />
(LTH), whereby <strong>Volvo</strong> Aero has already provided<br />
the first repairs to an engine in service. <strong>The</strong><br />
repairs were approved by General Electric.<br />
Lufthansa and <strong>Volvo</strong> Aero now has exclusive<br />
rights to implementation.<br />
<strong>Volvo</strong> Aero made a strategic decision to focus on<br />
its core operations and as a result, the US subsidiary<br />
<strong>Volvo</strong> Aero offers advanced<br />
components for aircraft<br />
engines and space applications<br />
with a focus on lightweight<br />
technology for<br />
reduced fuel consumption.<br />
Services for the aerospace<br />
industry and for stationary<br />
gas turbines are also<br />
offered.<br />
Number of employees<br />
2,863<br />
Position on world market<br />
<strong>Volvo</strong> Aero holds a leading position as<br />
an independent producer, with engine<br />
components in about 90% of all large<br />
commercial aircraft delivered in <strong>2010</strong>.<br />
Staffan Zackrisson<br />
President of <strong>Volvo</strong><br />
Aero.<br />
Ambitions <strong>2010</strong><br />
• Manage the continued development responsibility and supply test hardware<br />
for the new engine programs Trent XWB and PWG1000G.<br />
• Increase productivity in carried-out investments, shorten lead times and<br />
reduce costs.<br />
• Continue to gain market share within engine services.<br />
• Conduct a strategic overhaul of the American aftermarket business.<br />
38
Net sales as percentage<br />
of <strong>Volvo</strong><br />
<strong>Group</strong> sales<br />
3% (4)<br />
Net sales<br />
SEK bn<br />
Operating income (loss)<br />
and operating margin<br />
7.7 286<br />
Net sales by market<br />
<strong>Volvo</strong> Aero, SEK M 2009 <strong>2010</strong><br />
Europe 3,942 3,768<br />
North America 3,508 3,599<br />
South America 34 27<br />
Asia 205 233<br />
Other markets 114 81<br />
Total 7,803 7,708<br />
06<br />
8.2<br />
07<br />
7.6<br />
08<br />
7.6<br />
09<br />
7.8<br />
10<br />
7.7<br />
06<br />
359<br />
4.4<br />
07<br />
529<br />
6.9<br />
08<br />
359<br />
4.7<br />
09<br />
50<br />
0.6<br />
10<br />
286<br />
3.7<br />
SEK M<br />
%<br />
<strong>Volvo</strong> Aero Services was divested at the beginning<br />
of October to investment company H.I.G. Capital.<br />
Increased air traffic<br />
During the year, international passenger traffic rose<br />
8.2% following the deep recession in 2009. <strong>The</strong><br />
load factor rose to 78.4%. <strong>The</strong> international cargo<br />
traffic rose 20.6% in <strong>2010</strong> compared with 2009.<br />
Aircraft manufacturers Airbus and Boeing<br />
delivered 972 aircraft during <strong>2010</strong>, which was 1%<br />
less than 2009. <strong>The</strong> total order intake was 1,269<br />
aircraft, 121% more than in 2009. <strong>The</strong> manufacturers’<br />
total order intake rose 2% to 6,995 aircraft<br />
at the end of <strong>2010</strong>.<br />
Improved profitability<br />
Net sales decreased 1% during the year to SEK<br />
7,708 M, compared with SEK 7,803 M in 2009, primarily<br />
due to the lower USD and the divestment of<br />
<strong>Volvo</strong> Aero Services. Adjusted for exchange-rate<br />
fluctuations and the sale of <strong>Volvo</strong> Aero Services,<br />
sales rose 9%.<br />
<strong>The</strong> divestment of <strong>Volvo</strong> Aero Services, which<br />
was implemented at the beginning of October, had<br />
a negative impact of SEK 538 M on operating<br />
income. Consequently, the operating profit<br />
amounted to SEK 286 M (50). <strong>The</strong> operating margin<br />
was 3.7% (0.6). Factors behind the improvement<br />
were primarily lower costs, higher productivity<br />
and increased sales in the core operations.<br />
Outcome <strong>2010</strong><br />
• <strong>Volvo</strong> Aero has implemented development and delivery in the main according to plan.<br />
• Successful work with higher productivity, shorter lead times and reduced costs.<br />
• Increased market shares during <strong>2010</strong>.<br />
• Review implemented, resulting in the divestment of <strong>Volvo</strong> Aero Services.<br />
Ambitions 2011<br />
• Deliver design, hardware and serial manufacture of engine<br />
components according to commitments.<br />
• Increase productivity, shorten lead times and reduce costs.<br />
• Increase volumes in engine maintenance.<br />
39
Board of directors’ report <strong>2010</strong><br />
<strong>Volvo</strong> Financial Services<br />
Positioned for growth<br />
<strong>Volvo</strong> Financial Services (VFS) supports the <strong>Volvo</strong> <strong>Group</strong> product<br />
range with integrated financing solutions to help customers<br />
acquire the products they need to build their business.<br />
Stabilization of portfolio<br />
As the world began to emerge from the global<br />
economic and financial crisis, <strong>2010</strong> was a year of<br />
stabilization for VFS. While the first half of the<br />
year continued to be plagued by a challenging<br />
economic environment, the second half began to<br />
demonstrate more positive trends, characterized<br />
by a reduction in overall levels of customer delinquencies,<br />
inventories of repossessed vehicles<br />
and default activity.<br />
Throughout this period, VFS executed on<br />
enhanced portfolio management and collection<br />
techniques while strengthening and standardizing<br />
its operations. As VFS stabilized its portfolio,<br />
it did so in close alignment with the other <strong>Volvo</strong><br />
<strong>Group</strong> business areas and distributors, with a<br />
focus on building and maintaining customer relationships.<br />
Market development<br />
VFS is a stronger and more agile organization<br />
today than before the downturn and is well positioned<br />
for growth. Continuing to develop scalable<br />
and efficient business platforms will provide the<br />
capacity for VFS to grow its global portfolio.<br />
In mature markets such as North America and<br />
Europe, operational leverage is essential to future<br />
development. In Asia Pacific, VFS is making further<br />
investment in support of prudent growth. <strong>The</strong><br />
development of the BRIC markets remains in<br />
focus while maintaining stable and standardized<br />
operations and systems.<br />
Developing integrated offers with the other<br />
<strong>Volvo</strong> <strong>Group</strong> business areas will also continue, as<br />
VFS supports the <strong>Volvo</strong> <strong>Group</strong> in developing<br />
sales opportunities and building close customer<br />
relationships.<br />
Financial performance<br />
Total new financing volume in <strong>2010</strong> amounted to<br />
SEK 35 billion (29). Adjusted for changes in<br />
exchange rates, new business volume increased<br />
by 26% compared to 2009 as a result of<br />
increased sales volumes of the <strong>Volvo</strong> <strong>Group</strong> products<br />
and good penetration levels. In total, 34,522<br />
new vehicles and machines (25,782) were<br />
financed during the year. In the markets where<br />
financing is offered, the average penetration rate<br />
was 25% (25).<br />
At December 31, <strong>2010</strong> total assets amounted<br />
to SEK 89 billion (99). During <strong>2010</strong> the credit<br />
portfolio decreased by 4.4% (decrease: 15.6),<br />
adjusted for exchange-rate movements, to gross<br />
credit portfolio SEK 84,550 M (94,988). <strong>The</strong><br />
funding of the credit portfolio is matched in terms<br />
of maturity, interest rates and currencies in<br />
accordance with <strong>Volvo</strong> <strong>Group</strong> policy. For further<br />
information, see note 36.<br />
<strong>The</strong> operating income for the year amounted to<br />
SEK 167 M compared to operating loss of SEK<br />
680 M in the previous year. Return on shareholders’<br />
equity was 0.4% (neg: 6.2). <strong>The</strong> equity ratio<br />
at the end of the year was 9.0% (8.7). <strong>The</strong><br />
income is driven mainly by lower credit provisions.<br />
During the year, credit provision expenses<br />
amounted to SEK 1,438 M (2,327), while writeoffs<br />
of SEK 1,460 M (2,223) were recorded. <strong>The</strong><br />
write-off ratio for <strong>2010</strong> was 1.65% (2.09). At<br />
December 31, <strong>2010</strong>, credit reserves were 1.69%<br />
(1.67%) of the credit portfolio.<br />
As a consequence of the strong volume growth<br />
in Brazil, it was decided to syndicate approximately<br />
SEK 4 billion of the Brazilian credit portfolio<br />
as a risk mitigation measure and to free up<br />
capital for reinvestment in the country. <strong>The</strong> transaction<br />
generated a positive impact on operating<br />
income of SEK 38 M.<br />
In May, VFS successfully completed its first<br />
asset-backed securitization in many years. Under<br />
the terms of the transaction, USD 616 M of securities<br />
tied to U.S.-based loans on trucking and<br />
construction equipment assets were issued.<br />
Conducts operations in customer<br />
and dealer financing.<br />
Number of employees<br />
1,235<br />
Position on world market<br />
<strong>Volvo</strong> Financial Services operates<br />
exclusively to support the sales and<br />
leasing of vehicles and machines<br />
which are produced by the other<br />
Business Areas, enhancing their<br />
competitiveness.<br />
Martin Weissburg<br />
President of <strong>Volvo</strong><br />
Financial Services.<br />
Ambitions <strong>2010</strong><br />
• Support customer and dealer downturn activities while mitigating the<br />
frequency and severity of credit losses.<br />
• Adapt commercial strategy to lessons learned from the downturn to achieve<br />
sustainable profitability.<br />
• Operational improvement and efficiency.<br />
• Secure diversification of funding channels in cooperation with <strong>Volvo</strong><br />
Treasury.<br />
40
Net sales as percentage<br />
of <strong>Volvo</strong><br />
<strong>Group</strong> sales<br />
3% (5)<br />
Operating income (loss)<br />
167<br />
06 07 08 09 10<br />
1,686 1,649 1,397 (680) 167 SEK M<br />
Penetration 1<br />
30 29 20 17 14 20 16 11 34 35<br />
<strong>Volvo</strong> Renault Mack Buses <strong>Volvo</strong><br />
Trucks Trucks Trucks<br />
CE<br />
4 12<br />
UD<br />
Trucks<br />
%<br />
10<br />
09<br />
Distribution of credit portfolio<br />
<strong>Volvo</strong> Trucks 46%<br />
<strong>Volvo</strong> CE 24%<br />
Renault Trucks 13%<br />
Mack Trucks 8%<br />
Buses 5%<br />
UD Trucks 3%<br />
Other 1%<br />
1 Share of business financed by <strong>Volvo</strong> Financial Services in<br />
markets where financial services are offered.<br />
Outcome <strong>2010</strong><br />
• Re-established positive portfolio trends and maintained strong customer and dealer relationships.<br />
• Improved segmentation analysis and institutionalized best practices across all regions.<br />
• Aligned regional resources and operations to market conditions and rationalized cost structure.<br />
• Executed on capital strategies including asset-backed securitization, syndication and private label<br />
finance programs.<br />
Ambitions 2011<br />
• Achieve profitable growth in all markets.<br />
• Continue to improve operational leverage and efficiency.<br />
• Increase standardization of processes and systems.<br />
• Continue to develop BRIC markets.<br />
41
Board of directors’ report <strong>2010</strong><br />
Moving the world<br />
<strong>Volvo</strong> trucks are the backbone<br />
in the long-haul transports that deliver mail<br />
to an entire continent<br />
From the earth to the moon and back – 32 times over<br />
Distances in Australia are huge. From Sydney on the east coast to Perth on the west coast, the route covers<br />
4,110 kilometers. That’s the same distance as the crow flies between Madrid and Moscow. Australia Post’s<br />
line haul vehicles cover a total of 25 million kilometers every year, the distance from the earth to the moon<br />
and back – 32 times over.<br />
42
All over the world, people are waiting for the mailman. Distributing mail<br />
is a complex and challenging logistical task, especially in Australia. 21<br />
million letters and parcels reach their destination every day, despite vast<br />
distances and some of the toughest road conditions in the world. Without<br />
reliable trucks, it wouldn’t be possible.<br />
Twin beams of light cut through the darkness and driver Rick Hoyne is on the<br />
alert as he pilots his <strong>Volvo</strong> FH through the Australian night. Based in Melbourne,<br />
Rick is a 22 year veteran with Australia Post. This particular night<br />
he is heading for Dubbo, a route covering more than 700 kilometers. <strong>The</strong>re,<br />
another driver takes over, continuing the long journey to Brisbane.<br />
Rick is driving on a long straight stretch of the Newell Highway near the<br />
isolated town of Jerilderie in Western New South Wales. <strong>The</strong> region is in the<br />
grip of drought and kangaroos flock to the roadside where the grass growing<br />
along the verge is moist from dew. Rick stares intently through the windscreen,<br />
ready to take evasive action should the need arise.<br />
Australia is known for having among the world’s toughest road conditions<br />
for trucks. <strong>The</strong> weather in Australia varies from tropical storms with temperatures<br />
approaching 40 degrees Celsius in the far north, to snow and ice in<br />
the Australian Alps in the south.<br />
“Australia is a big country. <strong>The</strong> distances are vast so it is important that all<br />
aspects are taken into consideration to ensure on-time delivery,” says Chris<br />
Pearce, Manager Surface Transport, Network Distribution Transport at Australia<br />
Post.<br />
<strong>The</strong> company handles postal distribution to all cities and towns in the<br />
country. Its fleet consists of vehicles ranging from motorcycles to tractors with<br />
double semi-trailers. Delivering mail in Australia is a huge logistical task.<br />
Australia Post handles 21 million postal items daily, of which two million<br />
parcels, and the figure rises to more than double that around the Christmas<br />
peak period.<br />
125 <strong>Volvo</strong> FH trucks make up the core of the line haul transports. 65 of the<br />
trucks pull double semi trailers, so called B-doubles. By using larger rigs,<br />
many smaller trucks can be replaced. This means more fuel-efficient transportation,<br />
lower emissions, less congestion and less road wear. With the<br />
installation of front underrun protection and high cab safety as standard,<br />
<strong>Volvo</strong> was one of the first truck makers to meet the legislation for 26-meter<br />
B-Double rigs in the country.<br />
All the trucks are fitted with <strong>Volvo</strong>’s transport information and driver alert<br />
systems. <strong>The</strong> strong and safe cab also plays a role in the operation as Australia<br />
has an ongoing problem with kangaroos crossing highways, as well as<br />
loose livestock in unfenced regions.<br />
Rick Hoyne remains on the lookout for kangaroos on his night route.<br />
“You need to be comfortable to be safe. On long-distance routes, fatigue is<br />
reduced when the truck you are driving is comfortable”, he says.<br />
43
Board of directors’ report <strong>2010</strong><br />
Sustainable de velopment<br />
A responsibility that is the<br />
continuous focus of the <strong>Group</strong><br />
To be a responsible company with the ability to adapt to changes in the surrounding<br />
world is becoming increasingly important to the success of the <strong>Volvo</strong> <strong>Group</strong>. <strong>The</strong><br />
<strong>Group</strong> is responsible for developing transport solutions that convey cargo and passengers<br />
as efficiently as possible, while contributing to the economic development of customers<br />
and society as a whole.<br />
<strong>The</strong> world is facing major challenges. <strong>The</strong> need<br />
for transport will increase due to higher financial<br />
prosperity, increased urbanization and higher<br />
population. Through active dialog with the<br />
<strong>Group</strong>’s stakeholders and by weighing their<br />
expectations against internal strategies, the<br />
<strong>Volvo</strong> <strong>Group</strong> endeavors to create solutions for the<br />
future that are adapted to a sustainable society.<br />
We have identified four key areas within sustainable<br />
development:<br />
1 Products’ environmental impact<br />
2 Responsible sourcing<br />
3 High-performing organization<br />
4 Company culture<br />
44
1 Products’ environmental impact<br />
Fuel costs represent approximately one third of costs for a transport company.<br />
More than 95% of the energy consumption in the transport sector is oil-based.<br />
<strong>The</strong> supply of easily accessible and cheap crude oil is diminishing, which will lead<br />
to higher fuel prices. In 2013, the Euro VI emission legislation will come into<br />
force, entailing that emission of NO x<br />
and particles will decrease to very low levels.<br />
In several parts of the world, carbon-dioxide legislation for heavy vehicles is<br />
being prepared. <strong>The</strong> <strong>Volvo</strong> <strong>Group</strong> continued to invest in the development of environmentally<br />
adapted, efficient products, even during the financial crisis from<br />
which we are now exiting.<br />
Road transport emissions in the EU<br />
120<br />
100<br />
80<br />
60<br />
40<br />
20<br />
0<br />
1995 2000 2005 <strong>2010</strong> 2015 2020<br />
Carbon monoxide (CO)<br />
Nitrogen oxides (NO X<br />
)<br />
Solvents (VOCs)<br />
Benzene<br />
Particulate matter (PM)<br />
from diesels<br />
Carbon dioxide (CO 2<br />
)<br />
Sulphur dioxide SO 2<br />
Source: ACEA – European<br />
Automobile Manufacturers'<br />
Association.<br />
Within the EU all road transport emissions except for CO 2<br />
are expected<br />
to decrease in the future. This is the result of stringent emission regulations.<br />
2 Responsible sourcing<br />
<strong>The</strong> <strong>Volvo</strong> <strong>Group</strong> has a significant impact on the societies in which we operate. <strong>The</strong><br />
companies in the <strong>Group</strong> are major employers and also generate employment opportunities<br />
for many suppliers. <strong>The</strong> <strong>Volvo</strong> <strong>Group</strong> endeavors to conduct responsible<br />
enterprise based on the <strong>Group</strong>’s Code of Conduct, its core values and other established<br />
guidelines. In terms of the environment, responsibility for social and business<br />
ethics is integrated in the operations and the <strong>Group</strong> aims to apply these policies with<br />
its business partners. This is a part of the risk management process and a way for<br />
the <strong>Group</strong> to reduce the impact on the environment, while contributing to a positive<br />
social development.<br />
Number of<br />
suppliers, total<br />
Number of replies<br />
Total CSR<br />
approved<br />
6,868 1,519 899<br />
<strong>Volvo</strong> <strong>Group</strong> expect its suppliers to be<br />
compliant with the <strong>Group</strong>'s CSR<br />
requirements. <strong>The</strong> requirements are an<br />
integrated part of the <strong>Group</strong>'s sourcing<br />
process. Potential and existing suppliers<br />
are monitored from a CSR perspective<br />
to increase the awareness and to follow<br />
up on compliance. 15 months after the<br />
launch of the program almost every<br />
fourth supplier has been monitored and<br />
of these 59% are compliant with <strong>Group</strong><br />
requirements. <strong>The</strong> most common reason<br />
for non-compliance is that suppliers did<br />
not pass the requirements further on in<br />
the supply chain.<br />
3 A high-performing organization<br />
Increased global presence, new products, introduction of new technology, demographic<br />
changes and more rapid fluctuations in the global economy will lead to<br />
challenges in the supply of expertise and resources, as well as increased focus<br />
on the organization’s ability to adapt to changing market conditions. It will also<br />
place high demand on the <strong>Group</strong> to generate commitment and motivate employees<br />
to develop and propel the implementation of the <strong>Group</strong>’s strategy. <strong>The</strong>se<br />
factors entail risks as well as opportunities.<br />
4 Company culture<br />
<strong>The</strong> company’s culture is a critical prerequisite for sustainable growth. Unlike<br />
technologies, strategies, business concepts or organizational structures, culture<br />
is a unique asset. In the document <strong>Volvo</strong> Way we described our corporate culture<br />
for the first time in 1999. <strong>Volvo</strong> Way describes our values and how the employees<br />
may contribute to generating added value for customers and shareholders.<br />
Active work with company culture<br />
Informed<br />
Discussed<br />
95% of responding leaders have informed<br />
their team about updated content in <strong>The</strong><br />
<strong>Volvo</strong> Way (2004: 68%)<br />
86% of respondents has discussed how <strong>The</strong><br />
<strong>Volvo</strong> Way principles should influence the<br />
team’s daily work (2004: 55%)<br />
04 10<br />
68% 95%<br />
04 10<br />
55% 86%<br />
45
Board of directors’ report <strong>2010</strong><br />
1<br />
Products’ environmental<br />
impact<br />
Cost for, access to and availability of fuel, as well<br />
as legislation in the environmental area impacts<br />
the <strong>Volvo</strong> <strong>Group</strong>. Problems with air pollution and<br />
climate change entail more stringent legislations.<br />
<strong>The</strong>se are some of the factors which <strong>Volvo</strong> must<br />
handle and its work has focused on the development<br />
of energy-efficient engines, hybrid engines<br />
and vehicles that can operate on alternative fuels.<br />
Since 1975, fuel consumption in <strong>Volvo</strong>’s trucks<br />
has decreased by approximately 40%. Over the<br />
past 30 years, diesel engines have seen an<br />
almost hundredfold reduction of regulated emissions<br />
of nitrogen oxide (NO x<br />
) and particles (PM).<br />
When Euro VI gains legal force in the EU in 2013,<br />
emissions of NO x<br />
and PM will be at very low levels,<br />
but CO 2<br />
emissions will remain.<br />
Hybrids<br />
<strong>The</strong> <strong>Volvo</strong> <strong>Group</strong> has a number of environmentally<br />
adapted products in its customer offering and<br />
future solutions that are now being tested in the<br />
field in cooperation with customers.<br />
Emissions regulations for trucks and buses<br />
Particles, g/kWh<br />
0,16<br />
0,14<br />
0,12<br />
0,10<br />
0,08<br />
0,06<br />
0,04<br />
0,02<br />
EPA 2002<br />
Euro III, 2002<br />
Euro VI, 2013<br />
Euro V, 2009<br />
Euro IV, 2006<br />
Euro II, 1996<br />
0,00<br />
0 1 2 3 4 5 6 7 8<br />
EPA 2007 NO x<br />
, g/kWh<br />
EPA <strong>2010</strong><br />
<strong>The</strong> <strong>Volvo</strong> <strong>Group</strong>’s unique diesel-electric hybrid<br />
concept, I-SAM, has made the <strong>Group</strong> the leader<br />
in hybrid heavy vehicles. Because the <strong>Group</strong><br />
develops and manufactures solutions, this facilitates<br />
coordination and optimization of products<br />
and components to produce the most efficient<br />
driveline. <strong>The</strong> <strong>Volvo</strong> <strong>Group</strong>’s development program<br />
comprises city buses and distribution trucks, as<br />
well as construction equipment. Measurements<br />
on customers’ hybrid buses show significantly<br />
lower fuel consumption of up to 35%, corresponding<br />
to the same reduction of CO 2<br />
emissions,<br />
strongly reduced emissions of PM, which generate<br />
cleaner air, and also lower noise levels since diesel<br />
engines switch off at bus stops.<br />
Alternative fuels<br />
Three years ago, the <strong>Volvo</strong> <strong>Group</strong> presented<br />
seven different demonstration vehicles that can<br />
all be driven without net emissions of climateimpacting<br />
carbon dioxide. This resulted in a<br />
development project pertaining to two of the<br />
alternatives: methane diesel and DME (dimethylether).<br />
<strong>The</strong> benefit of methane diesel technolgoy<br />
is that methane fuel already today is available as<br />
a fuel for vehicles. Trucks, buses, construction<br />
equipment and industrial engines are being field<br />
tested and sales of trucks with methanedieselengines<br />
is planned to begin in 2011. BioDME is<br />
currently available only on a small scale in the<br />
market. Since the <strong>Volvo</strong> <strong>Group</strong> believes that this<br />
fuel is the most energy-efficient from a lifecycle<br />
perspective, <strong>Volvo</strong> plays an active role in the<br />
BioDME project. <strong>The</strong> aim of the project is to<br />
involve the entire chain from the production and<br />
distribution of BioDME, to it being used as fuel in<br />
vehicles. <strong>The</strong> project is financed by the EU and<br />
the Swedish Energy Agency. <strong>Volvo</strong>’s portion of<br />
the project is to be project coordinator and to<br />
build vehicles for field testing.<br />
Cooperation with WWF<br />
<strong>The</strong> <strong>Volvo</strong> <strong>Group</strong> has a vision that future transport<br />
will be CO 2<br />
neutral. As part of this, the <strong>Volvo</strong><br />
<strong>Group</strong> was the first manufacturer in the automotive<br />
industry to be affiliated with WWF’s Climate<br />
Savers. As a participant in WWF’s program, the<br />
<strong>Volvo</strong> <strong>Group</strong>’s truck company undertakes to<br />
reduce CO 2<br />
emissions from vehicles produced<br />
between 2009 and 2014 by 13 million tons,<br />
which corresponds to Sweden’s total emissions<br />
for three months. Independent technical experts<br />
will review the results.<br />
In September 2009, Euro V was implemented in<br />
Europe and in January <strong>2010</strong>, EPA <strong>2010</strong> was<br />
implemented in North America. Euro V entails a<br />
50% reduction of NO x<br />
emissions compared to Euro<br />
IV. With the implementation of EPA <strong>2010</strong>, emission<br />
levels for particulates and NO x<br />
are close to zero.<br />
46
2<br />
Responsible<br />
sourcing<br />
It is becoming increasingly important for the<br />
<strong>Group</strong>’s stakeholders that the <strong>Volvo</strong> <strong>Group</strong> conducts<br />
responsible business operations. In dialog<br />
with investors, representatives of affiliated organizations,<br />
financiers, customers, employees, etc.,<br />
expectations of <strong>Volvo</strong> are expressed. Several<br />
requested that the <strong>Group</strong> must assume responsibility<br />
not only for its own operations but also for<br />
issues pertaining to suppliers’ efforts concerning<br />
social, environmental and business ethics. <strong>The</strong><br />
<strong>Volvo</strong> <strong>Group</strong> endeavors to assume responsibility<br />
by placing demands on its suppliers.<br />
<strong>The</strong> <strong>Volvo</strong> <strong>Group</strong>’s CSR program (Corporate<br />
Social Responsibility) for suppliers aims at<br />
de veloping working conditions and environmental<br />
performance with suppliers that do not already<br />
comply with the <strong>Group</strong>’s demands, by monitoring,<br />
communicating and training them. Since 1996,<br />
<strong>Volvo</strong> has placed demands on suppliers’ environmental<br />
performance and in 2006, social and<br />
business ethics requirements were introduced. In<br />
2008, the <strong>Volvo</strong> <strong>Group</strong> introduced a paragraph in<br />
agreements with new suppliers, which pledges<br />
them to comply with the policies in the <strong>Group</strong>’s<br />
Code of Conduct. In October 2009, the new<br />
<strong>Group</strong>wide CSR program for suppliers was<br />
launched. This means that there is now a joint<br />
process for the evaluation of potential suppliers,<br />
as well as to monitor current suppliers. During<br />
<strong>2010</strong>, <strong>Volvo</strong> worked on evaluating the processes’<br />
efficiency and this will be used as the basis for<br />
the way in which the CSR program will develop in<br />
the future.<br />
Approximately 35,000 companies deliver<br />
products and services to the <strong>Volvo</strong> <strong>Group</strong>. Of<br />
these, about 6,000 deliver direct material, i.e.<br />
material that is used in the products. Currently,<br />
the control group for responsible purchasing is<br />
focusing on existing suppliers in countries that<br />
have challenges in terms of non-compliance with<br />
legislation within work environment, human rights<br />
and business ethics.<br />
We monitor suppliers’ CSR performance by<br />
evaluation. During the 15 months of the program,<br />
approximately 1,500 suppliers of direct material<br />
were audited and of these, 59% complied with<br />
the requirements. <strong>The</strong> absolutely most common<br />
reason for non-compliance with the requirements<br />
is that the suppliers did not pass on the requirements<br />
of the <strong>Volvo</strong> <strong>Group</strong> to their own suppliers.<br />
<strong>The</strong> Global Compact<br />
<strong>The</strong> <strong>Volvo</strong> <strong>Group</strong> supports the UN’s<br />
Global Compact, which was designed to<br />
promote responsible business enterprise<br />
worldwide, and commits itself to implementing<br />
and integrating ten principles regarding<br />
human rights, working conditions, business ethics<br />
and the environment in its operations.<br />
3<br />
High-performing<br />
organization<br />
A crucial factor for the implementation of the<br />
<strong>Group</strong>’s strategy is the contribution from employees,<br />
their expertise and commitment. To secure<br />
and develop strategic expertise and resources in<br />
the long-term is fundamental in order to maintain<br />
an efficient and adaptable organization.<br />
Employee engagement<br />
A positive and challenging work environment is a<br />
prerequisite for high-performing and committed<br />
employees. To create the conditions for this, the<br />
<strong>Group</strong> focuses on a number of different areas, for<br />
example competency and leadership development,<br />
work environment and preventive health<br />
care.<br />
<strong>The</strong> <strong>Group</strong>’s employees are annually requested<br />
to respond to the <strong>Volvo</strong> <strong>Group</strong> Attitude Survey<br />
(VGAS), which will focus on employee engagement<br />
starting in 2011. <strong>The</strong> response frequency<br />
for the most recent survey was 94%. <strong>The</strong><br />
responses from the survey are discussed in<br />
work groups and result in activity plans. VGAS<br />
also facilitates comparisons with other global<br />
organizations.<br />
Secure strategic competence<br />
<strong>The</strong> <strong>Volvo</strong> <strong>Group</strong> works proactively with threeyear<br />
rolling competency plans, where strategic<br />
competency needs are identified, gaps analyzed<br />
and action plans established. This is followed up<br />
in the annually recurring processes, President’s<br />
review and Talent Review, where succession<br />
planning is also secured.<br />
To prepare leaders of today and the future for<br />
upcoming assignments, work is in progress to<br />
develop a strategy for leader development,<br />
including training programs, tools and methods,<br />
for leaders at all levels within the organization,<br />
according to the <strong>Group</strong>’s “Leadership Pipeline”<br />
concept. This is a structured method that is<br />
based on global research and that different competencies<br />
are required at various decision levels<br />
47
Board of directors’ report <strong>2010</strong><br />
in the organization. <strong>The</strong> concept is connected to<br />
<strong>Volvo</strong> Way, the company culture, and strategic<br />
goals.<br />
Internal mobility between companies, across<br />
national borders and between functions is<br />
another way in which to secure competency and<br />
succession planning. This also contributes to a<br />
more efficient organization by increased experience<br />
exchange and diversity. A strategic initiative<br />
aimed at increasing internal mobility is in progress.<br />
Leverage diversity through inclusive<br />
leadership<br />
Diversity and an inclusive leadership approach<br />
have a positive impact on innovation and productivity.<br />
<strong>The</strong> <strong>Volvo</strong> <strong>Group</strong> works actively on fostering<br />
a corporate culture aimed at capitalizing on the<br />
strength in the organization’s diversity, including<br />
through leadership training courses.<br />
New numerical values were introduced in<br />
<strong>2010</strong>: Balanced Team Indicator that measures<br />
the quantitative aspect of diversity (nationality,<br />
gender, age and experience from the <strong>Group</strong>’s<br />
various companies), and the Inclusiveness Index,<br />
which measures the qualitative diversity, meaning<br />
how diversity work is perceived by the employees.<br />
<strong>The</strong> results are followed up annually in the President’s<br />
Review.<br />
An adaptable organization<br />
<strong>The</strong> sudden decline in the global market in 2009<br />
resulted in an increased focus on the organization’s<br />
ability to adapt. A strategic goal is to secure<br />
optimal structure and staffing levels to cope with<br />
changing market conditions, but to also support<br />
the launch of new technology and be able to execute<br />
decisions and implement changes rapidly<br />
and efficiently. A <strong>Group</strong>-wide follow-up process<br />
pertaining to flexibility was introduced in <strong>2010</strong>.<br />
Key figures 2009 <strong>2010</strong><br />
Number of employees at year-end 90,208 90,409<br />
Share of women, % 17 16<br />
Share of women, Board Members, % 11 12<br />
Share of women, Presidents and other senior executives, % 19 15<br />
Absence due to illness in the <strong>Group</strong>'s Swedish companies<br />
Total absence due to illness of regular working hours, % 3.6 3.3<br />
of which continuous sick leave for 60 days or more, % 35.8 38.0<br />
Absence due to illness (as percentage of regular working hours) by gender<br />
Men, % 3.5 3.2<br />
Women, % 3.9 3.6<br />
Absence due to illness (as percentage of regular working hours) by age<br />
29 years or younger, % 2.7 2.3<br />
30–49 years, % 3.6 3.1<br />
50 years and older, % 3.7 3.8<br />
Geographic distribution of employees<br />
Sweden 26%<br />
Europe, excl. Sweden 32%<br />
North America 14%<br />
South America 5%<br />
Asia 21%<br />
Other countries 2%<br />
4<br />
Company culture<br />
<strong>The</strong> company culture is a critical prerequisite for<br />
sustainable growth. Unlike technologies, strategies,<br />
business models or organizational structure,<br />
the company culture is hard to copy.<br />
<strong>Volvo</strong> Way shows what we stand for and aspire<br />
to be in the future. It expresses the culture,<br />
behaviors and values shared across the <strong>Volvo</strong><br />
<strong>Group</strong>.<br />
It expresses the cohesive culture, behavior and<br />
values shared across the <strong>Volvo</strong> <strong>Group</strong>. <strong>Volvo</strong> Way<br />
was first introduced in October 1999. Several<br />
new businesses with different brands have since<br />
been acquired. <strong>The</strong> industrial systems have been<br />
integrated, and concerted efforts were underway<br />
to enhance performance.<br />
“Managing the global financial downturn in<br />
2008 and 2009, <strong>Volvo</strong> <strong>Group</strong> learned some<br />
important lessons. We need to be lean. We need<br />
empowered employees. We need to be accountable,<br />
aligned, agile and able to execute decisions.<br />
We need to turn outward, add customer value and<br />
drive change,” wrote CEO Leif Johansson in a letter<br />
to all managers introducing the new <strong>Volvo</strong><br />
Way in October 2009.<br />
<strong>The</strong> new <strong>Volvo</strong> Way reflects an ambitious<br />
endeavor of creating a cohesive culture throughout<br />
the whole <strong>Volvo</strong> <strong>Group</strong>. This is a culture of<br />
enablement, based on global principles and<br />
shared values:<br />
Our culture is how we work together with<br />
energy, passion and respect for the individual. It is<br />
about involvement, open dialogue and feedback.<br />
It is about diversity, teamwork and leadership. It is<br />
how we build trust, focus on customers and drive<br />
change. Our culture embodies individual responsibility<br />
and accountability for results. This means<br />
a clear orientation towards common goals and<br />
solutions, and a strong determination to grow,<br />
develop and improve. It is how we conduct our<br />
business around the world.<br />
<strong>The</strong> new <strong>Volvo</strong> Way supports the strategy for<br />
delivering added value to demanding customers<br />
in selected segments. In this customer centric<br />
48
culture, there is a strong focus on responsiveness,<br />
agility and the ability to execute with speed.<br />
Truly making the organization more efficient,<br />
demands further developing employee engagement<br />
and commitment to the company’s strategic<br />
objectives for future business success.<br />
To be involved means that we take individual<br />
responsibility for decisions. This employee<br />
engagement results in a strong driving force to<br />
meet agreed objectives and goals. All of us feel<br />
accountable for driving improvements and building<br />
the future. Only engaged employees can<br />
deliver the highest quality and efficiency.<br />
During the first half of <strong>2010</strong>, the new <strong>Volvo</strong><br />
Way was disseminated to all employees by their<br />
immediate manager. Nearly two out of three<br />
teams have identified local improvement actions.<br />
To build a high commitment and high performance<br />
working culture will require continuous<br />
attention and support by management. <strong>The</strong> result<br />
is a more resilient organization.<br />
We are convinced that a cohesive culture<br />
based on global values strengthens our brands<br />
and makes <strong>Volvo</strong> <strong>Group</strong> a more attractive<br />
employer, business partner and industry leader.<br />
Production<br />
<strong>The</strong> environmental effort is and has long been<br />
one of the cornerstones in the <strong>Group</strong>’s work. <strong>The</strong><br />
joint environmental policy is one of the most<br />
important documents for control. <strong>The</strong> policy is the<br />
foundation of the <strong>Group</strong>’s environmental management<br />
system, strategies and targets, audits<br />
and measures.<br />
Already in 1995, the first environmental management<br />
system was certified. At the end of<br />
<strong>2010</strong>, 96% of the employees in production units<br />
were working in accordance with the certified<br />
environmental management system, primarily<br />
ISO 14001:2008. At each production unit, there<br />
is an environmental coordinator.<br />
<strong>The</strong> <strong>Group</strong>’s environmental goals are used to<br />
control, develop and monitor the environmental<br />
effort. Strategies to achieve the goals are<br />
included in the business plan. During the 2004–<br />
2008 period, the <strong>Volvo</strong> <strong>Group</strong> focused on energy<br />
reduction in its own production process. Energy<br />
consumption decreased during the period by<br />
43% per produced unit.<br />
<strong>The</strong> energy-saving goal for <strong>2010</strong>–2012 is<br />
divided into two parts:<br />
• Continue the work with investigating the possibility<br />
of making the <strong>Group</strong>’s facilities carbonneutral.<br />
• Standby loss, i.e. energy consumption during<br />
non-production hours, must decrease by 50%<br />
and an additional 15% energy-saving per produced<br />
unit by 2012, compared with 2008.<br />
Focusing on energy-savings measures is good<br />
for both the environment and the <strong>Group</strong>’s financial<br />
results. A couple of years ago, when the <strong>Volvo</strong><br />
<strong>Group</strong> launched the world’s first carbon-neutral<br />
plant, the primary reason was to reduce the environmental<br />
load, but it soon became quite clear<br />
that it was also a solid financial investment, which<br />
will generate significant cost savings in the long<br />
term.<br />
All production plants must comply with the<br />
common minimum requirements pertaining to<br />
chemicals, energy consumption, emissions to air<br />
and water, waste management, environmental<br />
organization and improvement work. Since 1989,<br />
environmental audits have been conducted to<br />
ensure compliance with the environmental policy<br />
and in the event of acquisitions, a review is conducted<br />
of the company and properties to observe<br />
environmental factors and risks.<br />
In <strong>2010</strong>, there were 17 facilities in Sweden that<br />
required permits. All have the necessary environmental<br />
permits and no permits needs to be<br />
renewed in 2011. <strong>The</strong> existence of contaminated<br />
land in our properties is documented annually.<br />
During <strong>2010</strong>, the after-treatment of contaminated<br />
land was in progress on one property.<br />
<strong>The</strong>se have historical origins. During <strong>2010</strong>, no<br />
spills were reported, no major environmental incidents<br />
occurred and no environmental disputes<br />
are ongoing.<br />
<strong>Volvo</strong> <strong>Group</strong> Sustainable <strong>Report</strong> will<br />
be available on www.volvogroup.com in<br />
mid-April.<br />
<strong>Volvo</strong> <strong>Group</strong>’s environmental<br />
performance For information on the<br />
<strong>Volvo</strong> <strong>Group</strong>’s environmental performance<br />
see the Eleven-year summary.<br />
49
Board of directors’ report <strong>2010</strong><br />
Moving the world<br />
Fourteen centimeters of<br />
newly-fallen snow and ready for take-off<br />
in ten minutes<br />
About the snow-clearing operations at Arlanda Airport<br />
Two centimeters of snow means 1,200 truck-loads to be transported to the<br />
snow dump. One centimeter of snow means four days of work, round-theclock.<br />
All told, snow from an area covering 700 hectares is cleared between<br />
10 and 50 times daily during a typical winter’s day. Arlanda has among the<br />
world’s largest snow blowers, and they are powered by <strong>Volvo</strong>. <strong>The</strong>re are 17<br />
<strong>Volvo</strong> A25D articulated haulers, nine wheel loaders of various <strong>Volvo</strong> models<br />
and a number of <strong>Volvo</strong> trucks.<br />
50
Each year, 2 billion people fly all over the world. This means high demands on<br />
the maintenance of the airports, especially when the snow falls. In less than<br />
ten minutes, <strong>Volvo</strong>’s specially-built articulated haulers clear the runways at<br />
Stockholm’s Arlanda Airport, which has never had to close because of the snow.<br />
When the snow and cold temperatures take a steady grip the affect on<br />
our airports is obvious. During early <strong>2010</strong> Frankfurt Airport, the third<br />
largest in Europe, was forced to cancel more than 200 flights in one single day.<br />
At Arlanda Airport just north of Stockholm, aircraft take off and land<br />
almost every second minute round the clock. More than 18 million people<br />
travelled to or from Arlanda in 2008 and more than 200,000 tons of<br />
cargo was handled by the airport. During the winter months, heavy<br />
snowfall is not unusual and even if flights are occasionally delayed<br />
owing to particularly heavy snowfall, the airport has never once been<br />
shut down by snow since its opening back in 1962.<br />
To keep the airport moving, a team of 130 people work with tackling<br />
snow and ice in the high season. <strong>The</strong>y are aided by a wide-ranging fleet<br />
of <strong>Volvo</strong> products featuring specially built accessories. <strong>The</strong> most advanced<br />
vehicles are the PSB machines. PSB stands for Plow, Sweep and Blow,<br />
and they are based on <strong>Volvo</strong> Construction Equipment articulated hauler.<br />
At the front of the vehicle is a 7.3 meter wide plow that shovels most of<br />
the snow off the tarmac. It is followed by a brush that sweeps away snow<br />
and ice, and the job is rounded off by a blower which with an extraction<br />
speed of 130 m/s blows away the rest. <strong>The</strong> system is also in operation at,<br />
among others, Brussel’s airport Zaventem.<br />
By driving nine such machines alongside each other, it is possible to<br />
clear a 3.3 kilometer long and 45 meter wide runway in less than ten<br />
minutes.<br />
“This makes us the world’s fastest airport snow-plow team,” says Stefan<br />
Sundkvist, field coordinator at Arlanda Airport.<br />
In the fleet, there is also a number of <strong>Volvo</strong> wheel loaders that are<br />
equipped with snow-plows, sweepers and snow blowers in the winter. At<br />
an airport, safety is absolutely everything. That is why the snow “sweepers”<br />
as they are called in the language of international aviation are an<br />
integrated part of traffic planning and are in constant contact with the<br />
control tower. Just as an aircraft gets its take-off and landing times, so too<br />
do the sweepers get a slot to clear the snow and ice off the tarmac.<br />
“We have a total of 250,000 square meters to clear from snow and ice,<br />
at the same time as the aircraft have to continue taking off and landing.<br />
<strong>The</strong>re’s absolutely no room for driving around haphazardly – all the traffic<br />
has to be controlled and planned down to the most minute detail,” says<br />
Stefan Sundkvist.<br />
51
Board of directors’ report <strong>2010</strong><br />
Financial str ategy<br />
Balancing return and security<br />
<strong>The</strong> purpose of <strong>Volvo</strong>’s long-term financial strategy is to ensure<br />
the best use of <strong>Group</strong> resources in providing shareholders with a<br />
favorable return and offering creditors reliable security.<br />
<strong>Volvo</strong>’s goals are strong and stable credit<br />
ratings<br />
A long-term competitive market position requires<br />
availability of capital to implement investments.<br />
<strong>The</strong> financial strategy ensures that the <strong>Group</strong>’s<br />
capital is used in the best possible manner by:<br />
• balancing shareholders’ expectations on returns<br />
with creditors’ demands for reliable security<br />
• strong and stable credit ratings<br />
• diversified access to financing from the capital<br />
markets<br />
• margin in the balance sheet to cope with a<br />
strong decline in the economy<br />
• customer financing at competitive conditions to<br />
our customers<br />
• favorable return to shareholders.<br />
<strong>The</strong> goal concerning capital structure is defined<br />
as the financial net debt for the Industrial Operations<br />
and it shall under normal circumstances be<br />
below 40% of shareholders’ equity.<br />
<strong>Volvo</strong> carefully monitors the trend of financial<br />
key ratios to confirm that the financial position is in<br />
line with the <strong>Group</strong>’s policy. <strong>The</strong> financial key ratios<br />
include order intake, operational development and<br />
financial development.<br />
Measures to improve the financial position<br />
<strong>The</strong> strong upswing in demand for the <strong>Group</strong>’s<br />
products in <strong>2010</strong> improved the <strong>Volvo</strong> <strong>Group</strong>’s<br />
financial position. <strong>The</strong> financial net debt in Industrial<br />
Operations declined during the year from<br />
70.9% of shareholders’ equity to 37.4%. <strong>The</strong><br />
<strong>Group</strong> implemented comprehensive measures<br />
during the year to improve its financial position.<br />
During the global financial crisis, the <strong>Volvo</strong><br />
<strong>Group</strong> increased the ratio of liquidity relative to<br />
sales. As a consequence of the financial markets<br />
stabilizing, the ratio was lowered during <strong>2010</strong>. To<br />
further support the goal of improving the financial<br />
position, the <strong>2010</strong> <strong>Annual</strong> General Meeting<br />
resolved not to pay any dividend for the 2009<br />
fiscal year.<br />
<strong>Volvo</strong> strives for strong, stable credit<br />
ratings<br />
<strong>The</strong> <strong>Volvo</strong> <strong>Group</strong> has continual meetings with the<br />
credit rating agencies Moody’s and Standard &<br />
Poor’s (S&P) to update them on the company’s<br />
development. <strong>The</strong>se meetings contribute to the<br />
credit rating agencies’ ability to assess the<br />
<strong>Group</strong>’s future ability to repay loans. A high longterm<br />
credit rating provides access to additional<br />
sources of financing and improved access to the<br />
financial market.<br />
On November 15, S&P changed <strong>Volvo</strong>’s credit<br />
rating from BBB-/Baa3 with negative outlook to<br />
BBB-/Baa3 with stable outlook. <strong>The</strong> change was<br />
attributable to a change in <strong>Volvo</strong>’s credit measurement.<br />
S&P also changed <strong>Volvo</strong>’s financial risk profile<br />
to “Medium” from earlier “Significant”.<br />
Moody’s corporate rating of <strong>Volvo</strong> is BBB/Baa2<br />
with stable outlook since July 24, 2009.<br />
Funding<br />
<strong>Volvo</strong> works actively for good balance between<br />
short and long-term loans, as well as loan preparedness<br />
in the form of credit facilities, to satisfy<br />
the <strong>Volvo</strong> <strong>Group</strong>’s long-term financing needs.<br />
During the year, the <strong>Group</strong> diversified its loans<br />
by issuing an Asset Backed Security loan in the<br />
US for the first time.<br />
At the end of <strong>2010</strong>, the <strong>Group</strong> had the equivalent<br />
of SEK 32.7 billion in cash and cash equivalents<br />
and short-term investments. In addition, the<br />
<strong>Group</strong> had SEK 35.3 billion in granted but unutilized<br />
credit facilities.<br />
Credit rating at February 15, 2011<br />
Short-term Long-term<br />
Moody’s P-2 Baa2 stable<br />
Standard & Poor's A-3 BBB- stable<br />
DBRS R-2 (high) –<br />
R&I (Japan) a-1 A- positive<br />
52
Risks and uncertainties<br />
Managed risk-taking<br />
All business operations involve risk – managed risk-taking is a<br />
condition of maintaining a sustained favorable profitability.<br />
Risk may be due to events in the world and can<br />
affect a given industry or market. Risk can be specific<br />
to a single company. At <strong>Volvo</strong> work is carried<br />
out daily to identify, measure and manage risk – in<br />
some cases the <strong>Group</strong> can influence the likelihood<br />
that a risk-related event will occur. In cases in<br />
which such events are beyond the <strong>Group</strong>’s control,<br />
the <strong>Group</strong> strives to minimize the consequences.<br />
<strong>The</strong> risks to which the <strong>Volvo</strong> <strong>Group</strong> are exposed<br />
are classified into three main categories:<br />
• External-related risks – such as the cyclical<br />
nature of the commercial vehicles business,<br />
intense competition, changes in prices for<br />
commercial vehicles and government regulations.<br />
• Financial risks – such as currency fluctuations,<br />
interest levels fluctuations, valuations of<br />
shares or similar instruments, credit risk and<br />
liquidity risk.<br />
• Operational risks – such as market reception<br />
of new products, reliance on suppliers, protection<br />
and maintenance of intangible assets, complaints<br />
and legal actions by customers and other<br />
third parties and risk related to human capital.<br />
External-related risk<br />
<strong>The</strong> commercial vehicles industry is cyclical<br />
<strong>The</strong> <strong>Volvo</strong> <strong>Group</strong>’s markets undergoes significant<br />
changes in demand as the general economic<br />
environment fluctuates. Investments in infrastructure,<br />
major industrial projects, mining and<br />
housing construction all impact the <strong>Group</strong>’s operations<br />
as its products are central to these sectors.<br />
Adverse changes in the economic conditions<br />
for the <strong>Volvo</strong> <strong>Group</strong>’s customers may also<br />
impact existing order books through cancellations<br />
of previously placed orders. <strong>The</strong> cyclical<br />
demand for the <strong>Group</strong>’s products makes the<br />
financial result of the operations dependable on<br />
the <strong>Group</strong>’s ability to react to changes in demand,<br />
in particular to the ability to adapt production levels<br />
and production and operating expenses.<br />
Intense competition<br />
Continued consolidation in the industry is<br />
expected to create fewer but stronger competitors.<br />
Our major competitors are Daimler, Paccar,<br />
Navistar, MAN, Scania, Caterpillar, Komatsu,<br />
Cummins and Brunswick. In recent years, new<br />
competitors have emerged in Asia, particularly in<br />
China. <strong>The</strong>se new competitors are mainly active<br />
in their domestic markets, but are expected to<br />
increase their presence in other parts of the<br />
world.<br />
Prices may change<br />
<strong>The</strong> prices of commercial vehicles have, at times,<br />
changed considerably in certain markets over a<br />
short period. This instability is caused by several<br />
factors, such as short-term variations in demand,<br />
shortages of certain component products, uncertainty<br />
regarding underlying economic conditions,<br />
changes in import regulations, excess inventory<br />
and increased competition. Overcapacity within<br />
the industry can occur if there is a lack of demand,<br />
potentially leading to increased price pressure.<br />
Extensive government regulation<br />
Regulations regarding exhaust emission levels,<br />
noise, safety and levels of pollutants from production<br />
plants are extensive within the industry.<br />
Most of the regulatory challenges regarding<br />
products relate to reduced engine emissions. <strong>The</strong><br />
<strong>Volvo</strong> <strong>Group</strong> is a significant player in the commercial<br />
vehicle industry and one of the world’s largest<br />
producers of heavy-duty diesel engines. <strong>The</strong><br />
product development capacity within the <strong>Volvo</strong><br />
<strong>Group</strong> is well consolidated to be able to focus<br />
resources for research and development to meet<br />
tougher emission regulations. Future product<br />
regulations are well known, and the product<br />
development strategy is well tuned to the introduction<br />
of new regulations.<br />
Financial risk<br />
In its operations, the <strong>Volvo</strong> <strong>Group</strong> is exposed to<br />
various types of financial risks. <strong>Group</strong>-wide policies,<br />
which are updated and decided upon annually, form<br />
the basis of each <strong>Group</strong> company’s management of<br />
these risks. <strong>The</strong> objectives of the <strong>Group</strong>’s policies<br />
for management of financial risks are to optimize<br />
the <strong>Group</strong>’s capital costs by utilizing economies of<br />
scale, to minimize negative effects on income as a<br />
result of changes in currency or interest rates, to<br />
optimize risk exposure and to clarify areas of<br />
responsibility. Monitoring and control that established<br />
policies are adhered to is continuously conducted.<br />
Information about key aspects of the<br />
<strong>Group</strong>’s system for internal constrols and risk management<br />
in conjunction with the financial reporting<br />
is provided in the Corporate Governance <strong>Report</strong> on<br />
pages 146 –147. Most of the <strong>Volvo</strong> <strong>Group</strong>’s financial<br />
transactions are carried out through <strong>Volvo</strong>’s inhouse<br />
bank, <strong>Volvo</strong> Treasury, that conducts its operations<br />
within established risk mandates and limits.<br />
Credit risks are mainly managed by the different<br />
business areas.<br />
<strong>The</strong> nature of the various financial risks and<br />
objectives and the policies for the management<br />
of these risks are described in detail in notes 36<br />
and 37. Various aspects of financial risk are<br />
described briefly in the following paragraphs. <strong>Volvo</strong>’s<br />
ac counting policies for financial instruments<br />
are described in note 1. <strong>The</strong> overall impact on a<br />
company’s competitiveness is also affected however<br />
by how various macro-economic factors interact.<br />
53
Board of directors’ report <strong>2010</strong><br />
Currency-related risk<br />
More than 90% of the net sales of the <strong>Volvo</strong><br />
<strong>Group</strong> are generated in countries other than<br />
Sweden. Changes in exchange rates have a<br />
direct impact on the <strong>Volvo</strong> <strong>Group</strong>’s operating<br />
income, balance sheet and cash flow, as well as<br />
an indirect impact on <strong>Volvo</strong>’s competitiveness,<br />
which over time affects the <strong>Group</strong>’s earnings.<br />
Interest-related risk<br />
Interest-related risk includes risks that changes<br />
in interest rates will impact the <strong>Group</strong>’s income<br />
and cash flow (cash-flow risks) or the fair value of<br />
financial assets and liabilities (price risks).<br />
Market risk from investments in shares or<br />
similar instruments<br />
<strong>The</strong> <strong>Volvo</strong> <strong>Group</strong> is indirectly exposed to market<br />
risks from shares and other similar instruments,<br />
as a result of managed capital transferred to<br />
independent pension plans being partly invested<br />
in instruments of these types.<br />
Credit-related risk<br />
An important part of the <strong>Group</strong>’s credit risk is<br />
related to how the financial assets of the <strong>Group</strong><br />
have been placed. <strong>The</strong> majority are placed in<br />
Swedish Government bonds and interest-bearing<br />
bonds issued by Swedish real estate financing<br />
institutions.<br />
Liquidity risk<br />
<strong>Volvo</strong> ensures its financial preparedness by<br />
always maintaining a certain portion of revenues<br />
in liquid assets.<br />
Operational risk<br />
<strong>The</strong> profitability depends on successful<br />
new products<br />
<strong>The</strong> <strong>Volvo</strong> <strong>Group</strong>’s long-term profitability depends<br />
on the Company’s ability to successfully launch<br />
and market its new products. Product life cycles<br />
continue to shorten, putting increased focus on<br />
the success of the <strong>Group</strong>’s product development.<br />
Reliance on suppliers<br />
<strong>Volvo</strong> purchases raw materials, parts and components<br />
from numerous external suppliers. A significant<br />
part of the <strong>Group</strong>’s requirements for raw<br />
materials and supplies is filled by single-source<br />
suppliers. <strong>The</strong> effects of delivery interruptions<br />
vary depending on the item or component. Certain<br />
items and components are standard throughout<br />
the industry, whereas others are internally<br />
developed and require unique tools that are timeconsuming<br />
to replace.<br />
<strong>The</strong> <strong>Volvo</strong> <strong>Group</strong>’s costs for raw materials and<br />
components can vary significantly over a business<br />
cycle. Cost variations may be caused by<br />
changes in world market prices for raw materials<br />
or by an inability of our suppliers to deliver.<br />
Intangible assets<br />
AB <strong>Volvo</strong> owns or otherwise has rights to patents<br />
and brands that refer to the products the Company<br />
manufactures and markets. <strong>The</strong>se have<br />
been acquired over a number of years and are<br />
valuable to the operations of the <strong>Volvo</strong> <strong>Group</strong>.<br />
<strong>Volvo</strong> does not consider that any of the <strong>Group</strong>’s<br />
operations are heavily dependent on any single<br />
patent or group of patents.<br />
Through <strong>Volvo</strong> Trademark Holding AB, AB<br />
<strong>Volvo</strong> and <strong>Volvo</strong> Car Corporation jointly own the<br />
<strong>Volvo</strong> brand. AB <strong>Volvo</strong> has the exclusive right to<br />
use the <strong>Volvo</strong> name and trademark for its products<br />
and services. Similarly, <strong>Volvo</strong> Car Corporation<br />
has the exclusive right to use the <strong>Volvo</strong> name<br />
and trademark for its products and services.<br />
Currencies<br />
Interest rates in Sweden, Europe and the U.S.<br />
Sweden<br />
Europe<br />
<strong>The</strong> U.S.<br />
00<br />
9.2<br />
8.4<br />
8.2<br />
01<br />
10.3<br />
9.2<br />
7.9<br />
02<br />
9.7<br />
9.1<br />
7.3<br />
03<br />
8.0<br />
9.1<br />
6.7<br />
04<br />
7.3<br />
9.1<br />
05<br />
7.5<br />
9.2<br />
06<br />
7.4<br />
9.3<br />
07<br />
6.8<br />
9.3<br />
08<br />
7.8<br />
10.9<br />
6.5 6.7 5.8 5.8 8.6<br />
09<br />
7.2<br />
10.4<br />
7.7<br />
10<br />
6.7<br />
9.0<br />
8.3<br />
Source: Reuters<br />
SEK/USD<br />
SEK/EUR<br />
SEK/100 JPY<br />
00<br />
5.4<br />
5.3<br />
6.0<br />
01<br />
5.1<br />
4.8<br />
5.0<br />
02<br />
5.3<br />
4.8<br />
4.5<br />
03<br />
4.6<br />
4.1<br />
4.0<br />
04<br />
4.4<br />
4.0<br />
4.2<br />
05<br />
3.4<br />
3.4<br />
4.3<br />
06<br />
3.7<br />
3.8<br />
4.8<br />
07<br />
4.3<br />
4.3<br />
4.0<br />
08<br />
2.4<br />
2.9<br />
2.2<br />
09<br />
3.4<br />
3.4<br />
3.8<br />
10<br />
3.3<br />
3.0<br />
3.3<br />
Source: Reuters<br />
Government bonds, 10 year benchmarks<br />
%<br />
%<br />
%<br />
54
<strong>The</strong> <strong>Volvo</strong> <strong>Group</strong>’s rights to use the Renault<br />
brand are restricted to the truck operations only<br />
and are regulated by a license from Renault s.a.s.,<br />
which owns the Renault brand.<br />
Complaints and legal actions<br />
<strong>The</strong> <strong>Volvo</strong> <strong>Group</strong> could be the target of complaints<br />
and legal actions initiated by customers,<br />
employees and other third parties alleging health,<br />
environmental, safety or business related issues,<br />
or failure to comply with applicable legislation<br />
and regulations. Even if such disputes were to be<br />
resolved successfully, without having adverse<br />
financial consequences, they could negatively<br />
impact the <strong>Group</strong>’s reputation and take up<br />
resources that could be used for other purposes.<br />
Risk related to human capital<br />
A decisive factor for the realization of the <strong>Volvo</strong><br />
<strong>Group</strong>’s vision is our employees and their knowledge<br />
and competence. Future development depends on<br />
the company’s ability to maintain its position as<br />
an attractive employer. To this end, the <strong>Volvo</strong><br />
<strong>Group</strong> strives for a work environment in which<br />
energy, passion and respect for the individual are<br />
guiding principles. Every year a <strong>Group</strong>-wide survey<br />
is conducted, and according to the survey the<br />
share of satisfied employees has been on a high<br />
level in recent years.<br />
Short-term risk factors<br />
An increase in demand could potentially result in<br />
delivery disturbances due to suppliers’ financial<br />
instability or shortage of resources.<br />
Uncertainty regarding customers’ access to<br />
the financing of products in emerging markets<br />
might have a negative impact on demand.<br />
<strong>Volvo</strong> verifies annually, or more frequently if<br />
necessary, the goodwill value of its business<br />
areas and other intangible assets for possible<br />
impairment. <strong>The</strong> size of the overvalue differs<br />
between the business areas and they are, to a<br />
varying degree, sensitive to changes in the business<br />
environment. Instability in the business<br />
recovery and volatility in interest and currency<br />
rates may lead to indications of impairment.<br />
<strong>The</strong> reported amounts for contingent liabilities<br />
reflect a part of <strong>Volvo</strong>’s risk exposure, see note<br />
29 for contingent liabilities.<br />
Contractual conditions related to<br />
take over bids<br />
Some of AB <strong>Volvo</strong>’s long term loan agreements<br />
contain conditions stipulating the right for a<br />
bondholder to request repayment in advance<br />
under certain conditions following a change of<br />
the control of the company. In <strong>Volvo</strong>’s opinion it<br />
has been necessary to accept those conditions in<br />
order to receive financing on otherwise acceptable<br />
terms. Provisions stipulating that an agreement<br />
can be changed or terminated if the control<br />
of the company is changed are also included in<br />
some of the agreements whereby Renault Trucks’<br />
has been given the right to sell Renault s.a.s.’ and<br />
Nissan Motor Co. Ltd’s light-duty trucks as well<br />
as in some of the <strong>Group</strong>’s purchasing agreements.<br />
Further information<br />
Note 34 Personnel contains information<br />
concerning rules on severance payments<br />
applicable for the <strong>Group</strong> Executive Committee<br />
and certain other senior executives.<br />
Note 36 and 37 contain information<br />
regarding financial risks as well as goals<br />
and policies in financial risk management.<br />
Further risk information is provided in<br />
note 2 and note 29.<br />
55
Board of directors’ report <strong>2010</strong><br />
<strong>The</strong> share<br />
Rose by 93% during <strong>2010</strong><br />
After the recovery that began in 2009, the trend continued to be positive for<br />
both the <strong>Volvo</strong> share and the world’s leading stock markets in <strong>2010</strong>.<br />
<strong>The</strong> <strong>Volvo</strong> share is listed on the Nasdaq OMX<br />
Nordic Exchange in Sweden. One A share entitles<br />
the holder to one vote at <strong>Annual</strong> General<br />
Meetings and one B share entitles the holder to<br />
one tenth of a vote. Dividends are the same for<br />
both classes of shares.<br />
<strong>The</strong> <strong>Volvo</strong> share is included in a large number<br />
of indexes that are compiled by Dow Jones,<br />
FTSE, S&P and Nasdaq OMX Nordic.<br />
Positive development on the stock market<br />
In general, the development on the world’s leading<br />
stock exchanges was positive after the recovery<br />
that began in 2009. On Nasdaq OMX Nordic,<br />
the OMXSPI index rose by 23% during the year.<br />
Trading in <strong>Volvo</strong> A shares on Nasdaq OMX Nordic<br />
increased by 38% compared to 2009 and the<br />
share price increased by 89%. At year-end the price<br />
for the <strong>Volvo</strong> A share was SEK 115. <strong>The</strong> highest<br />
price paid was SEK 115.70 on December 30, <strong>2010</strong>.<br />
Trading in <strong>Volvo</strong> B shares on Nasdaq OMX<br />
Nordic decreased by 16% compared to 2009.<br />
<strong>The</strong> share price increased by 93% and was SEK<br />
118.50 per share at year-end. <strong>The</strong> highest price<br />
paid was SEK 118.80 on December 30, <strong>2010</strong>.<br />
In <strong>2010</strong>, a total of 2.5 billion (2.9) <strong>Volvo</strong> shares<br />
were traded in Stockholm, corresponding to a<br />
daily average of 9.8 million (11.4). At year-end<br />
<strong>2010</strong>, <strong>Volvo</strong>’s market capitalization totaled SEK<br />
238 billion (124).<br />
An increasing portion of the trading in <strong>Volvo</strong><br />
shares is carried out on alternative exchanges<br />
such as Bats Europe, Burgundy and Chi-X.<br />
Ownership changes<br />
In October <strong>2010</strong>, AB <strong>Volvo</strong>’s main shareholder,<br />
Renault, sold its entire holding of 302,915,940 B<br />
shares. Buyers of the shares were a large number of<br />
institutions from around the world. Through the sale,<br />
Renault’s holding in AB <strong>Volvo</strong> decreased from<br />
21.8% of the capital and 21.3% votes to 6.8% of<br />
the capital and 17.5% of the votes. Even after the<br />
sale, Renault continues to be AB <strong>Volvo</strong>’s largest<br />
owner based both on capital and on voting rights.<br />
Dividend<br />
Based on the much improved profitability and a<br />
significantly reduced debt level, the Board proposes<br />
to resume dividends with a pay-out of SEK<br />
2.50 per share for the financial year of <strong>2010</strong>,<br />
which means a total of SEK 5,069 M is being<br />
transferred to AB <strong>Volvo</strong>’s shareholders. No dividend<br />
was paid for the preceding year.<br />
Communication with the shareholders<br />
Dialog with the shareholders is important for<br />
<strong>Volvo</strong>. In addition to the <strong>Annual</strong> General Meeting<br />
and a number of larger activities aimed at professional<br />
investors, private shareholders and stock<br />
market analysts, the relationship between <strong>Volvo</strong><br />
and the stock market is maintained through such<br />
events as press and telephone conferences in<br />
conjunction with the publication of interim<br />
reports, meetings with retail shareholders’ associations,<br />
investor meetings and visits, as well as<br />
road shows in Europe, the U.S. and Asia.<br />
During <strong>2010</strong> a number of large events were held:<br />
• An investor day in Shanghai in May in cooperation<br />
with five other Swedish capital goods<br />
companies. On the agenda was a visit to <strong>Volvo</strong><br />
Construction Equipment’s production facilities<br />
among other topics.<br />
• In June, the annual capital markets day was held<br />
in Skövde, Sweden with a tour of the <strong>Group</strong>’s<br />
foundry and engine manufacturing.<br />
• An investor day in Curitiba, Brazil was held in September.<br />
It included a factory tour and presentations<br />
of the business and strategy in South America.<br />
• An investor day in New York City in November<br />
contained a presentation of the <strong>Group</strong> strategy<br />
and in-depth information on the North American<br />
market.<br />
On the website www.volvogroup.com it is po ssible<br />
to access financial reports, search for information<br />
concerning the share, insider trading in <strong>Volvo</strong> and<br />
statistics for truck deliveries. It is also possible to<br />
access information concerning the <strong>Group</strong>’s governance,<br />
including information about the <strong>Annual</strong><br />
General Meeting, the Board of Directors, <strong>Group</strong><br />
Management and other areas that are regulated<br />
in the “Swedish Code of Corporate Governance.”<br />
<strong>The</strong> website also offers the possibility to subscribe<br />
to information from <strong>Volvo</strong>.<br />
Earnings and dividend per share<br />
Total return, <strong>Volvo</strong> B<br />
06 07<br />
8.03 7.37<br />
5.00 5.50<br />
5.00<br />
56<br />
08<br />
4.90<br />
2.00<br />
09<br />
(7.26)<br />
0.00<br />
10<br />
5.36<br />
2.50 1<br />
Earnings per share<br />
Dividend per share<br />
Extraordinary payment<br />
1 Proposed by the Board of Directors<br />
180<br />
160<br />
140<br />
120<br />
100<br />
80<br />
60<br />
40<br />
06 07 08 09 10<br />
B Share<br />
(incl. re-invested dividends)<br />
SIX Return Index<br />
Source: NASDAQ OMX
Price trend, <strong>Volvo</strong> Series B shares, 2006–<strong>2010</strong>, SEK<br />
160<br />
140<br />
120<br />
100<br />
80<br />
60<br />
<strong>The</strong> largest shareholders in AB <strong>Volvo</strong>,<br />
December 31 1 Voting rights, %<br />
2009 <strong>2010</strong><br />
Renault s.a.s. 21.3 17.5<br />
Industrivärden 8.8 11.1<br />
Violet Partners LP 5.5 5.5<br />
SHB 2 6.2 4.8<br />
AMF Insurance & Funds 3.9 3.9<br />
1 AB <strong>Volvo</strong> held 20,728,135 class A shares and 80,265,060 class<br />
B shares comprising in total 4.7% of the number of registered<br />
shares on December 31, <strong>2010</strong>.<br />
2 Comprises shares held by SHB, SHB Pension Fund, SHB<br />
Employee Fund, SHB Pensionskassa and Oktogonen.<br />
Share capital, December 31, <strong>2010</strong><br />
40<br />
20<br />
06 07 08 09 10<br />
<strong>Volvo</strong> B<br />
OMX Stockholm PI<br />
Source: NASDAQ OMX<br />
OMX Stockholm Machinery PI<br />
Registered number of shares 1 2,128,420,220<br />
of which, Series A shares 2 677,601,630<br />
of which, Series B shares 3 1,450,818,590<br />
Quota value, SEK 1.20<br />
Share capital, SEK M 2,554<br />
Number of shareholders 240,043<br />
Private persons 223,600<br />
Legal entities 16,443<br />
Price trend, <strong>Volvo</strong> Series B shares, <strong>2010</strong>, SEK<br />
120<br />
110<br />
7&8<br />
100<br />
6<br />
11 12&13 14<br />
90<br />
9<br />
10<br />
15<br />
16&17<br />
18 19<br />
20<br />
More details on the <strong>Volvo</strong> share, see note 23.<br />
1 <strong>The</strong> number of outstanding shares was 2,027,427,025 at<br />
December 31, <strong>2010</strong>.<br />
2 Series A shares carry one vote each.<br />
3 Series B shares carry one tenth of a vote each.<br />
80<br />
4 5<br />
70<br />
1&2<br />
3<br />
60<br />
Q1 Q2 Q3 Q4<br />
<strong>Volvo</strong> B<br />
OMX Stockholm PI<br />
OMX Stockholm Machinery PI<br />
Source: NASDAQ OMX<br />
Events<br />
1 Truck deliveries for December 2009,<br />
February 5<br />
2 Year-end report 2009, February 5<br />
3 Truck deliveries for January, February 24<br />
4 <strong>Annual</strong> report 2009, March 17<br />
5 Truck deliveries for February, March 24<br />
6 <strong>Annual</strong> General Meeting, April 14<br />
7 Truck deliveries for March, April 23<br />
8 First quarter report, April 23<br />
9 Truck deliveries for April, May 5<br />
10 Investor day in Shanghai, China, May 12<br />
11 Capital markets day in Skövde,<br />
sweden, June 22<br />
12 Truck deliveries for June, July 22<br />
13 Second quarter report, July 22<br />
14 Truck deliveries for July, August 25<br />
15 Truck deliveries for August,<br />
september 15<br />
16 Truck deliveries for September, October 22<br />
17 Third quarter report, October 22<br />
18 Investor day in New York, November 2<br />
19 Truck deliveries for October, November 17<br />
20 Truck deliveries for November,<br />
December 15<br />
Ownership by country 1 Ownership categories 1<br />
Sweden, 57%<br />
Great Britain, 14%<br />
USA, 13%<br />
France, 7%<br />
Luxenbourg, 2%<br />
Switzerland, 2%<br />
Norway, 1%<br />
Others, 4%<br />
Non-Swedish owners, 43%<br />
Private shareholders, 11%<br />
Pension funds and insurance<br />
companies, 10%<br />
Savings funds, 14%<br />
Others, 22%<br />
More details on the <strong>Volvo</strong> share are<br />
provided in note 23 to the financial<br />
statements and in the Eleven-year<br />
summary.<br />
1 Share of capital, registered shares.<br />
1 Share of capital, registered shares.<br />
<strong>The</strong> employees' ownership of shares in <strong>Volvo</strong> through pension foundations is remote.<br />
57
Board of directors’ report <strong>2010</strong><br />
Financial performance<br />
Strong earnings improvement<br />
<strong>The</strong> <strong>Volvo</strong> <strong>Group</strong> made a turnaround in profitability and recorded operating<br />
income of SEK 18 billion thanks to higher sales volumes, strict cost control,<br />
increased capacity utilization and a good productivity trend in the industrial system.<br />
Net sales by business area<br />
SEK M 2009 <strong>2010</strong> %<br />
Trucks 138,940 167,305 20<br />
Construction<br />
equipment 35,658 53,810 51<br />
Buses 18,465 20,516 11<br />
<strong>Volvo</strong> Penta 8,159 8,716 7<br />
<strong>Volvo</strong> Aero 7,803 7,708 (1)<br />
Eliminations and<br />
other (538) (680) –<br />
Industrial<br />
Operations 1 208,487 257,375 23<br />
Customer Finance 11,712 9,031 (23)<br />
Reclassifications<br />
and eliminations (1,838) (1,658) –<br />
<strong>Volvo</strong> <strong>Group</strong> 218,361 264,749 21<br />
1 Adjusted for acquired and divested units and changes in<br />
currency rates, net sales for Industrial operations<br />
increased by 29%.<br />
Net sales by market area<br />
SEK M 2009 <strong>2010</strong> %<br />
Western Europe 84,452 87,241 3<br />
Eastern Europe 9,632 12,570 31<br />
North America 37,291 45,409 22<br />
South America 16,610 27,876 68<br />
Asia 44,842 65,072 45<br />
Other markets 15,660 19,207 23<br />
Total Industrial<br />
Operations 208,487 257,375 23<br />
Operating income (loss) by business area<br />
SEK M 2009 <strong>2010</strong><br />
Trucks (10,805) 10,112<br />
Construction Equipment (4,005) 6,180<br />
Buses (350) 780<br />
<strong>Volvo</strong> Penta (230) 578<br />
<strong>Volvo</strong> Aero 50 286<br />
Eliminations and other (994) (102)<br />
Industrial Operations (16,333) 17,834<br />
Customer Finance (680) 167<br />
<strong>Volvo</strong> <strong>Group</strong> (17,013) 18,000<br />
Operating margin<br />
% 2009 <strong>2010</strong><br />
Trucks (7.8) 6.0<br />
Construction Equipment (11.2) 11.5<br />
Buses (1.9) 3.8<br />
<strong>Volvo</strong> Penta (2.8) 6.6<br />
<strong>Volvo</strong> Aero 0.6 3.7<br />
Industrial Operations (7.8) 6.9<br />
<strong>Volvo</strong> <strong>Group</strong> (7.8) 6.8<br />
<strong>The</strong> <strong>Volvo</strong> <strong>Group</strong><br />
Net sales<br />
Net sales for the <strong>Volvo</strong> <strong>Group</strong> increased by<br />
21% to SEK 264,749 M in <strong>2010</strong>, compared<br />
with SEK 218,361 M in 2009.<br />
Operating income<br />
<strong>Volvo</strong> <strong>Group</strong> operating income amounted to<br />
SEK 18,000 M (loss: 17,013).<br />
Operating income for the Industrial Operations<br />
increased to SEK 17,834 M compared<br />
with an operating loss of SEK 16,333 M in<br />
the preceding year. <strong>The</strong> Customer Finance<br />
operations’ operating income rose to SEK<br />
167 M (loss: 680).<br />
Net financial items<br />
Net interest expense was SEK 2,700 M, compared<br />
with SEK 3,169 M in 2009. <strong>The</strong> improvement<br />
is mainly attributable to lower expense<br />
for post-employment benefits.<br />
During the year, market valuation of derivatives,<br />
mainly used for the customer financing<br />
portfolio, had a positive effect on Other financial<br />
income and expenses in an amount of<br />
SEK 871 M (neg: 90).<br />
<strong>The</strong> currency in Venezuela was devalued<br />
twice during <strong>2010</strong>, which negatively impacted<br />
Other financial income and expenses by SEK<br />
116 M during the first quarter and an additional<br />
SEK 158 M during the fourth quarter.<br />
Income taxes<br />
<strong>The</strong> tax expense for the year amounted to<br />
SEK 4,302 M corresponding to a tax rate of<br />
28%. In 2009 the tax income amounted to SEK<br />
5,889 M and a tax rate of 29%.<br />
Income for the period and earnings<br />
per share<br />
<strong>The</strong> income for the period amounted to SEK<br />
11,212 M (loss: 14,685), corresponding to basic<br />
and diluted earnings per share of SEK 5.36 (neg:<br />
7.26). <strong>The</strong> return on shareholders’ equity was<br />
16.0% (neg: 19.7).<br />
Industrial Operations<br />
In <strong>2010</strong>, net sales for the <strong>Volvo</strong> <strong>Group</strong>’s Industrial<br />
Operations increased by 23% to SEK 257,375 M<br />
(208,487). Hard products accounted for SEK<br />
166,945 M and soft products (services and<br />
aftermarket products) for SEK 90,430 M of net<br />
sales.<br />
Compared with 2009, sales increased in all of<br />
the <strong>Group</strong>’s market areas. Demand in Europe and<br />
North America recovered gradually during the<br />
year at the same time as the emerging economies<br />
in South America and Asia continued to<br />
have strong growth. However, development in<br />
Japan continued to be weak.<br />
Considerable earnings improvement<br />
In <strong>2010</strong>, the operating income for the <strong>Volvo</strong><br />
<strong>Group</strong>’s Industrial Operations amounted to SEK<br />
17,834 M, compared with an operating loss of<br />
SEK 16,333 M in 2009. <strong>The</strong> operating margin for<br />
the Industrial Operations amounted to 6.9%<br />
(neg: 7.8).<br />
<strong>The</strong> earnings improvement is the result of<br />
increased sales, improved cost coverage in the<br />
58
industrial system, as an effect of increased production<br />
levels, and continued cost control.<br />
During <strong>2010</strong>, operating profit was negatively<br />
impacted by higher costs for raw material and<br />
components amounting to approximately SEK<br />
300 M compared to the preceding year.<br />
In <strong>2010</strong>, research and development expenses<br />
amounted to SEK 12,970 M (13,193). Even<br />
though costs decreased compared with 2009,<br />
they remained at a relatively high level primarily a<br />
consequence of projects relating to new emission<br />
regulations in Europe, USA and Japan.<br />
Selling expenses decreased by 5% and administration<br />
expenses by 3% compared to 2009,<br />
depsite net sales increasing by 23%.<br />
Since return on equity was 16%, SEK 350 M<br />
was provisioned for profit-sharing to employees<br />
Impact of exchange rates on operating<br />
income<br />
<strong>The</strong> combined effect of changed exchange rates<br />
had a positive effect on operating income of<br />
approximately SEK 3.2 billion in <strong>2010</strong>, compared<br />
with 2009. This is mainly attributable to positive<br />
effects from forward exchange rate contracts in<br />
<strong>2010</strong> compared to major negative effects in<br />
2009.<br />
Research and development costs<br />
06<br />
8.4<br />
3.4<br />
07<br />
11.1<br />
3.9<br />
08<br />
14.3<br />
4.9<br />
09<br />
13.2<br />
6.3<br />
10<br />
13.0<br />
5.0<br />
Research and<br />
development<br />
costs, SEK bn<br />
Research and<br />
development<br />
costs, % of<br />
net sales<br />
Income Statement <strong>Volvo</strong> <strong>Group</strong><br />
SEK M 2009 <strong>2010</strong><br />
Net sales <strong>Volvo</strong> <strong>Group</strong> 218,361 264,749<br />
Operating Income (loss) <strong>Volvo</strong> <strong>Group</strong> (17,013) 18,000<br />
Operating income (loss) Industrial Operations (16,333) 17,834<br />
Operating income (loss) Customer Finance (680) 167<br />
Interest income and similar credits 390 442<br />
Interest expense and similar credits (3,559) (3,142)<br />
Other financial income and costs (392) 213<br />
Income after financial items (20,573) 15,514<br />
Income taxes 5,889 (4,302)<br />
Income for the period (14,685) 11,212<br />
Income Statement Industrial Operations<br />
SEK M 2009 <strong>2010</strong><br />
Net sales 208,487 257,375<br />
Cost of sales (179,578) (197,480)<br />
Gross income 28,909 59,895<br />
Gross margin, % 13.9 23.3<br />
Research and development expenses (13,193) (12,970)<br />
Selling expenses (23,752) (22,649)<br />
Administrative expenses (5,838) (5,640)<br />
Other operating income and expenses (2,432) (659)<br />
Income from investments in associated companies (15) (86)<br />
Income from other investments (13) (57)<br />
Operating income (loss) Industrial Operations (16,333) 17,834<br />
Operating margin, % (7.8) 6.9<br />
Change in operating income<br />
SEK bn<br />
Operating income 2009 (17.0)<br />
Gross income 27.2<br />
Provisions for healthcare benefits<br />
according to agreement with United Auto<br />
Workers, UAW 0.9<br />
Additional provisions for<br />
residual value commitments 1.0<br />
Changes in currency exchange rates 3.2<br />
Higher capitalization of<br />
development costs 0.7<br />
Higher research and development<br />
expenditures (0.7)<br />
Lower selling and<br />
administrative expenses 0.4<br />
Lower credit losses 1.7<br />
Other 0.6<br />
Operating income <strong>2010</strong> 18.0<br />
Impact of exchange rates on operating<br />
income<br />
Compared with preceding year, SEK bn<br />
Net sales 1 (10.5)<br />
Cost of sales 12.3<br />
Research and development expenses 0.3<br />
Selling and administrative expenses 1.1<br />
Total effect of changes in exchange<br />
rates on operating income 3.2<br />
1 <strong>Group</strong> sales are reported at monthly spot rates and the<br />
effects of currency hedges are reported among Cost of<br />
sales.<br />
Operating net flow per currency<br />
Local currency, million 2009 <strong>2010</strong><br />
USD 1,803 2,410<br />
EUR 595 373<br />
GBP 315 405<br />
CAD 192 241<br />
JPY(x100) (83) (103)<br />
59
Board of directors’ report <strong>2010</strong><br />
Customer Finance Operations<br />
Total new financing volume in <strong>2010</strong> amounted to<br />
SEK 35 billion (29). Adjusted for changes in<br />
exchange rates, new business volume increased<br />
by 26% compared to 2009 as a result of<br />
increased sales volumes of the <strong>Volvo</strong> <strong>Group</strong> products<br />
and good penetration levels. In total, 34,522<br />
new vehicles and machines (25,782) were<br />
financed during the year. In the markets where<br />
financing is offered, the average penetration rate<br />
was 25% (25).<br />
At December 31, <strong>2010</strong>, total assets amounted<br />
to SEK 89 billion (99). During <strong>2010</strong> the credit<br />
portfolio decreased by 4.4% (decrease: 15.6),<br />
adjusted for exchange-rate movements, to gross<br />
credit portfolio SEK 84,550 M (94,988). <strong>The</strong><br />
funding of the credit portfolio is matched in terms<br />
of maturity, interest rates and currencies in<br />
accordance with <strong>Volvo</strong> <strong>Group</strong> policy. For further<br />
information see note 36.<br />
<strong>The</strong> operating income for the year amounted to<br />
SEK 167 M compared to operating loss of SEK<br />
680 M in the previous year. Return on shareholders’<br />
equity was 0.4% (neg: 6.2). <strong>The</strong> equity ratio<br />
at the end of the year was 9.0% (8.7). <strong>The</strong><br />
income is driven mainly by lower credit provisions.<br />
During the year, credit provision expenses<br />
amounted to SEK 1,438 M (2,327) while writeoffs<br />
of SEK 1,460 M (2,223) were recorded. <strong>The</strong><br />
write-off ratio for <strong>2010</strong> was 1.65% (2.09). At the<br />
end of December 31, <strong>2010</strong>, credit reserves were<br />
1.69% (1.67%) of the credit portfolio.<br />
Income Statement Customer Finance<br />
SEK M 2009 <strong>2010</strong><br />
Finance and lease income 11,712 9,031<br />
Finance and lease expenses (8,427) (5,974)<br />
Gross income 3,285 3,057<br />
Selling and administrative expenses (1,608) (1,526)<br />
Credit provision expenses (2,327) (1,438)<br />
Other operating income and expenses (30) 73<br />
Operating income (loss) (680) 167<br />
Income taxes 114 (134)<br />
Income (Loss) for the period (566) 32<br />
Return on Equity (6.2) 0.4<br />
Key ratios<br />
Customer Finance 1 2009 <strong>2010</strong><br />
Credit portfolio net, SEK bn 93.5 83.1<br />
Operating income, SEK M (680) 167<br />
Return on shareholders' equity, % (6.2) 0.4<br />
Total penetration rate, % 24.8 24.5<br />
Penetration by business area, %<br />
<strong>Volvo</strong> CE 34 35<br />
<strong>Volvo</strong> Trucks 30 29<br />
Renualt Trucks 20 17<br />
Mack Trucks 14 20<br />
Buses 16 11<br />
UD Trucks 4 12<br />
1 Share of business financed by <strong>Volvo</strong> Financial Services in<br />
markets where financial services are offered.<br />
60
Board of directors’ report <strong>2010</strong><br />
Financial position<br />
Improved during the year<br />
Net debt in the <strong>Volvo</strong> <strong>Group</strong>’s Industrial Operations amounted to SEK 24.7 billion at December 31, <strong>2010</strong>, equal to 37.4%<br />
of shareholders’ equity. Excluding provisions for post-employment benefits the <strong>Volvo</strong> <strong>Group</strong>’s net debt amounted to SEK<br />
18.8 billion, which was equal to 28.5% of shareholders’ equity.<br />
<strong>Volvo</strong> <strong>Group</strong>’s liquid funds, cash and cash equivalents<br />
and marketable securities combined,<br />
amounted to SEK 32.7 billion on December 31,<br />
<strong>2010</strong>. Of this, SEK 0.7 billion was restricted for<br />
use by the <strong>Volvo</strong> <strong>Group</strong> and SEK 7.4 billion consisted<br />
of liquid funds in countries where exchange<br />
controls or other legal restrictions apply. In addition<br />
to this, granted but unutilized credit facilities<br />
amounted to SEK 35.3 billion.<br />
Total assets in the <strong>Group</strong> amounted to SEK 318,0<br />
billion on December 31, <strong>2010</strong>, a decrease of SEK<br />
14.3 billion compared to year-end 2009. Fluctuations<br />
in currency decreased the total assets by SEK<br />
12.9 billion during <strong>2010</strong>. Other changes are mainly a<br />
result of higher working capital due to increased<br />
inventories, accounts receivable and account payable<br />
offset by decreased customer financing receivables<br />
due to lower levels of financial leasing, installment<br />
credits and dealer financing as well as<br />
fluctuations in currency.<br />
<strong>The</strong> <strong>Group</strong>’s intangible assets amounted to SEK<br />
40.7 billion on December 31, <strong>2010</strong>. Investments in<br />
research and development amounted to SEK 3.2 billion<br />
in <strong>2010</strong>, resulting in a net value of development<br />
costs of SEK 11.6 billion at the end of the year. <strong>The</strong><br />
<strong>Group</strong>’s total goodwill amounted to SEK 22.9 billion<br />
on December 31, <strong>2010</strong>, a decrease by SEK 0.9 billion<br />
compared to year-end 2009. <strong>The</strong> decrease is a<br />
result of fluctuations in currency. <strong>The</strong> tangible assets<br />
decreased by SEK 1.8 billion during <strong>2010</strong>, mainly as<br />
a result of divesture of subsidiaries.<br />
<strong>The</strong> value of the inventories increased by SEK 2.1<br />
billion during <strong>2010</strong>. <strong>The</strong> increase is mainly related to<br />
finished products within the truck operations and<br />
construction equipment. Currency fluctuations<br />
decreased the value of inventories by SEK 1.8 billion<br />
at the end of <strong>2010</strong>.<br />
<strong>The</strong> net value of assets and liabilities related to<br />
pensions and similar obligations amounted to SEK<br />
5.9 billion on December 31, <strong>2010</strong>, a decrease of<br />
Net financial position<br />
Industrial Operations<br />
<strong>Volvo</strong> <strong>Group</strong><br />
SEK M<br />
Dec 31<br />
2009<br />
Dec 31<br />
<strong>2010</strong><br />
Dec 31<br />
2009<br />
Dec 31<br />
<strong>2010</strong><br />
Non-current interest-bearing assets<br />
Non-current customer-financing receivables – – 39,713 36,025<br />
Non-current interest-bearing receivables 1,095 941 585 766<br />
Current interest-bearing assets<br />
Customer-financing receivables – – 42,264 36,663<br />
Interest-bearing receivables 1,215 1,071 410 342<br />
Internal funding 3,662 7,505 – –<br />
Interest-bearing assets held for sale 8 0 8 0<br />
Marketable securities 16,655 9,735 16,676 9,767<br />
Cash and bank 20,749 21,756 21,234 22,966<br />
Total financial assets 43,384 41,008 120,890 106,529<br />
Non-current interest-bearing liabilities<br />
Bond loans 49,191 38,767 49,191 38,767<br />
Other loans 48,684 37,180 56,035 45,327<br />
Internal funding (30,908) (26,971) – –<br />
Current interest-bearing liabilities<br />
Loans 44,196 32,101 51,626 39,601<br />
Internal funding (32,273) (21,220) – –<br />
Total financial liabilities 78,890 59,857 156,852 123,695<br />
Net financial position excl.<br />
post employment benefits (35,506) (18,849) (35,962) (17,166)<br />
Provision for post employment benefits, net 5,983 5,842 6,002 5,862<br />
Net financial position incl.<br />
post employment benefits (41,489) (24,691) (41,964) (23,028)<br />
Change in net financial position, Industrial Operations<br />
SEK bn 2009 <strong>2010</strong><br />
Beginning of period (29.8) (41.5)<br />
Cash flow from operating activities (1.6) 28.8<br />
Investments in fixed assets (to)/from (10.5) (10.6)<br />
Disposals 0.7 0.8<br />
Operating cash-flow (11.4) 19.0<br />
Investments and divestments of shares 0.0 (0.1)<br />
Acquired and divested operations, net 0.2 0.2<br />
Capital injections (to)/from Customer Finance Operations 0.4 (0.5)<br />
Currency effect 3.0 (1.6)<br />
Payment to AB <strong>Volvo</strong> shareholders (4.1) –<br />
Revaluation of loans 0.9 –<br />
Provision UAW agreement (0.9) –<br />
Dividend paid to minority shareholders 0.0 (0.1)<br />
Other 0.2 (0.1)<br />
Total change (11.7) 16.8<br />
Net financial position at end of period (41.5) (24.7)<br />
62
Balance Sheets <strong>Volvo</strong> <strong>Group</strong><br />
SEK M<br />
Assets<br />
Industrial Operations Customer Finance Eliminations <strong>Volvo</strong> <strong>Group</strong><br />
Dec 31<br />
2009<br />
Dec 31<br />
<strong>2010</strong><br />
Non-current assets<br />
Intangible assets 41,532 40,613 96 101 0 0 41,628 40,714<br />
Tangible assets<br />
Property, plant and equipment 55,208 54,169 72 72 0 0 55,280 54,242<br />
Assets under operating leases 13,539 13,217 10,955 10,055 (4,106) (3,625) 20,388 19,647<br />
Financial assets<br />
Shares and participation 2,025 2,080 19 18 0 0 2,044 2,098<br />
Non-current customer-financing receivables 531 598 39,720 36,270 (538) (843) 39,713 36,025<br />
Deferred tax assets 12,277 12,019 318 291 0 0 12,595 12,310<br />
Prepaid pensions 2,038 1,636 10 12 0 0 2,049 1,648<br />
Non-current interest-bearing receivables 1,095 941 0 204 (510) (379) 585 766<br />
Other non-current receivables 3,033 3,401 42 41 (36) (24) 3,038 3,418<br />
Total non-current assets 131,278 128,674 51,232 47,064 (5,190) (4,871) 177,320 170,868<br />
Current assets<br />
Inventories 35,765 38,956 1,962 882 0 0 37,727 39,837<br />
Current receivables<br />
Customer-financing receivables 836 830 42,443 36,897 (1,015) (1,064) 42,264 36,663<br />
Tax assets 1,362 1,045 161 90 0 0 1,523 1,135<br />
Interest-bearing receivables 1,215 1,071 66 1,283 (872) (2,012) 410 342<br />
Internal funding 3,662 7,505 0 0 (3,662) (7,505) – –<br />
Accounts receivable 20,877 24,332 460 101 0 0 21,337 24,433<br />
Other receivables 11,459 11,561 1,701 1,352 (1,077) (1,056) 12,082 11,857<br />
Non interest-bearing assets held for sale 1,684 136 – – – – 1,684 136<br />
Interest-bearing assets held for sale 8 0 – – – – 8 0<br />
Marketable securities 16,655 9,735 21 32 0 0 16,676 9,767<br />
Cash and cash equivalents 20,749 21,756 726 1,545 (241) (335) 21,234 22,966<br />
Total current assets 114,272 116,928 47,540 42,182 (6,867) (11,970) 154,945 147,139<br />
Total assets 245,550 245,602 98,772 89,246 (12,057) (16,841) 332,265 318,007<br />
Shareholders’ equity and liabilities<br />
Equity attributable to the equity holders of the Parent Company 57,856 65,090 8,549 8,020 0 0 66,405 73,110<br />
Minority interests 629 1,011 0 0 0 0 629 1,011<br />
Total shareholders’ equity 58,485 66,101 8,549 8,020 0 0 67,034 74,121<br />
Non-current provisions<br />
Provisions for post-employment benefits 8,021 7,478 30 32 0 0 8,051 7,510<br />
Provisions for deferred taxes 1,858 3,026 1,780 1,496 0 0 3,638 4,522<br />
Other provisions 6,277 5,785 80 150 2 1 6,360 5,936<br />
Non-current liabilities<br />
Bond loans 49,191 38,767 0 0 0 0 49,191 38,767<br />
Other loans 48,684 37,180 7,458 8,225 (107) (78) 56,035 45,327<br />
Internal funding (30,908) (26,971) 32,758 25,927 (1,849) 1,044 – –<br />
Other liabilities 11,762 11,172 479 389 (2,353) (2,330) 9,888 9,231<br />
Current provisions 9,321 8,429 164 105 2 1 9,487 8,534<br />
Current liabilities<br />
Loans 44,196 32,101 8,305 8,299 (876) (799) 51,626 39,601<br />
Internal funding (32,273) (21,220) 36,457 33,643 (4,184) (12,423) – –<br />
Non interest-bearing liabilities held for sale 272 135 – – – – 272 135<br />
Trade payables 35,754 47,111 201 139 0 0 35,955 47,250<br />
Tax liabilities 369 1,571 254 161 0 0 623 1,732<br />
Other liabilities 34,541 34,937 2,257 2,660 (2,692) (2,257) 34,105 35,341<br />
Total shareholders’ equity and liabilities 245,550 245,602 98,772 89,246 (12,057) (16,841) 332,265 318,007<br />
Contingent liabilities 9,607 11,003<br />
Dec 31<br />
2009<br />
Dec 31<br />
<strong>2010</strong><br />
Dec 31<br />
2009<br />
Dec 31<br />
<strong>2010</strong><br />
Dec 31<br />
2009<br />
Dec 31<br />
<strong>2010</strong><br />
SEK 0.1 billion compared to year-end 2009. Postemployment<br />
benefits valued at SEK 7.3 billion were<br />
reported outside the <strong>Volvo</strong> <strong>Group</strong>’s balance sheet.<br />
For further information see Note 24.<br />
At year-end, the equity ratio in the Industrial<br />
Operations was 26.9% and in the <strong>Volvo</strong> <strong>Group</strong><br />
23.3%. Shareholder’s equity in the <strong>Volvo</strong> <strong>Group</strong><br />
amounted to SEK 74.1 billion at December 31, <strong>2010</strong>.<br />
63
Board of directors’ report <strong>2010</strong><br />
Cash-flow statement<br />
Strong operating cash-flow<br />
Operating cash flow in the Industrial Operations amounted to SEK 19.0 billion<br />
(neg: SEK 11.4 billion).<br />
<strong>The</strong> strong cash flow was generated through the<br />
operating income and a reduction of working<br />
capital.<br />
Financial items and paid income taxes had a<br />
SEK 5.1 billion negative effect on cash flow<br />
within Industrial Operations, mainly through payments<br />
of interests and income tax.<br />
Operating cash flow within Customer Finance<br />
was a positive SEK 1.4 billion in <strong>2010</strong> (15.1).<br />
Investments<br />
<strong>The</strong> Industrial Operations’ investments in fixed<br />
assets and capitalized R&D during <strong>2010</strong><br />
amounted to SEK 10.3 billion (10.3).<br />
Capital expenditures in Trucks amounted to<br />
SEK 7.2 billion (7.4). <strong>The</strong> capital expenditures<br />
within Trucks consist to a large extent of investments<br />
related to product renewals in our product<br />
program, within product development and adaptations<br />
in the plants. Examples of product renewals<br />
are the new <strong>Volvo</strong> FMX construction truck<br />
and UD Trucks’ launches of a new version of the<br />
Quon heavy truck and a new Condor medium<br />
duty truck equipped with a new medium-duty<br />
engine. <strong>The</strong> ongoing investments aiming for<br />
increased capacity and flexibility have more or<br />
less been finalized during the year. Those relate<br />
to the cab plant in Umeå, Sweden, and the engine<br />
plants with the new foundry but also investments<br />
in machining and assembly processes in Skövde,<br />
Sweden, and the assembly line in Ageo, Japan.<br />
During <strong>2010</strong>, Trucks invested in the dealer network<br />
and workshops, mainly in Europe, however<br />
on a lower level than previous year.<br />
Capital investments for Construction Equipment<br />
increased to SEK 1.4 billion from SEK 1.0<br />
billion previous year. A majority of the investments<br />
refer to expansion of the excavator business<br />
in the BRIC countries, during <strong>2010</strong> especially<br />
in China. It includes product offerings as the<br />
new EC200B <strong>Volvo</strong> excavator for the Chinese<br />
market, and increased manufacturing capacity in<br />
China, Lingong with SDLG, and also in Korea,<br />
Changwon, for components and assembly. Product<br />
related investments during the year also refer<br />
to the emission regulations with Tier4i and Stage<br />
IIIB engines.<br />
<strong>The</strong> investments within <strong>Volvo</strong> Aero during<br />
<strong>2010</strong> were SEK 0.8 billion (0.6). <strong>The</strong> majority of<br />
the investments refer to the involvement in the<br />
new engine programs, PW1000G with Pratt &<br />
Whitney, and Trent XWB with Rolls-Royce. <strong>The</strong><br />
investments also refer to finalization of a number<br />
of investments in Aero’s production facilities in<br />
order to secure the capacity required for the<br />
GEnx program, carried out in cooperation with<br />
General Electrics, and capacity investments in<br />
the Low Pressure Turbine shop.<br />
<strong>The</strong> investments in Buses were SEK 0.2 billion<br />
(0.4). <strong>The</strong>y were mainly related to maintenance<br />
and efficiency-enhancing investments in the factories.<br />
Product related investments during the<br />
year relate mainly to emission standards and<br />
product renewals.<br />
<strong>The</strong> level of investments in <strong>Volvo</strong> Penta were<br />
SEK 0.2 billion (0.3) and consist mainly of product-related<br />
investments in the new D13 engine<br />
and IPS3, the finalization phase of investments in<br />
the new logistics system as well as tooling and<br />
other development activities.<br />
Investments in leasing assets amounted to<br />
SEK 0.3 billion (0.2).<br />
For 2011, the <strong>Volvo</strong> <strong>Group</strong> estimates that<br />
investments in property, plant and equipment will<br />
be around SEK 10 billion. This is higher than in<br />
<strong>2010</strong> as investments in future product programs<br />
will increase, as well as the expansion of the business<br />
in the BRIC countries. <strong>The</strong> process in which<br />
ongoing and future investments are continuously<br />
reviewed and prioritized is still in focus.<br />
Capital expenditures, Industrial Operations<br />
Property, plant and<br />
equipment, SEK bn<br />
Capitalized development<br />
costs, SEK bn<br />
Capital expenditures,<br />
% of net sales<br />
Self-financing ratio, Industrial operations %<br />
Cash-flow from<br />
operating activities<br />
divided by net<br />
investments in fixed<br />
assets and leasing<br />
assets.<br />
06<br />
6.8<br />
2.9<br />
3.9<br />
07<br />
8.0<br />
2.1<br />
3.6<br />
08<br />
10.5<br />
2.1<br />
4.3<br />
09<br />
7.7<br />
2.6<br />
5.0<br />
10<br />
7.1<br />
3.2<br />
4.0<br />
06<br />
235<br />
07<br />
265<br />
08<br />
78<br />
09<br />
(16)<br />
10<br />
294<br />
64
Consolidated cash-flow statements<br />
Industrial Operations Customer Finance Eliminations <strong>Volvo</strong> <strong>Group</strong><br />
SEK bn 2009 <strong>2010</strong> 2009 <strong>2010</strong> 2009 <strong>2010</strong> 2009 <strong>2010</strong><br />
Operating activities<br />
Operating income (16.3) 17.8 (0.7) 0.2 0.0 0.0 (17.0) 18.0<br />
Depreciation tangible assets 6.5 6.1 0.0 0.0 0.0 0.0 6.5 6.1<br />
Amortization intangible assets 3.6 3.3 0.0 0.0 0.0 0.0 3.6 3.3<br />
Depreciation leasing vehicles 2.3 2.0 2.8 2.4 0.0 0.0 5.1 4.4<br />
Other non-cash items 2.3 0.1 2.0 1.3 0.1 0.2 4.4 1.6<br />
Total change in working capital, of which 4.7 4.6 11.8 0.1 0.4 0.1 16.9 4.8<br />
Change in accounts receivables 8.2 (4.0) 0.0 0.3 0.0 0.0 8.2 (3.7)<br />
Change in inventories 16.3 (4.8) (1.1) 0.8 0.0 0.1 15.2 (3.9)<br />
Change in trade payables (14.4) 13.1 (0.1) 0.0 0.1 (0.1) (14.4) 13.0<br />
Other changes in working capital (5.4) 0.3 13.0 (1.0) 0.3 0.1 7.9 (0.6)<br />
Net of interest and other financial items (3.0) (2.8) 0.0 0.0 0.0 (0.1) (3.0) (2.9)<br />
Income taxes paid (1.7) (2.3) 0.1 (0.3) 0.0 0.0 (1.6) (2.6)<br />
Cash flow from operating activities (1.6) 28.8 16.0 3.7 0.5 0.2 14.9 32.7<br />
Investing activities<br />
Investments in tangible assets (7.5) (6.7) 0.0 (0.1) (0.2) 0.0 (7.7) (6.8)<br />
Investments in intangible assets (2.8) (3.6) 0.0 0.0 0.0 0.0 (2.8) (3.6)<br />
Investment in leasing vehicles (0.2) (0.3) (4.0) (4.5) 0.0 0.0 (4.2) (4.8)<br />
Disposals of fixed assets and leasing vehicles 0.7 0.8 3.1 2.3 0.0 0.0 3.8 3.1<br />
Operating cash flow (11.4) 19.0 15.1 1.4 0.3 0.2 4.0 20.6<br />
Investments and divestments of shares, net 0.0 (0.1)<br />
Acquired and divested operations, net 0.2 0.6<br />
Interest-bearing receivables including marketable securites (8.9) 6.8<br />
Cash-flow after net investments (4.7) 27.9<br />
Financing activities<br />
Change in loans, net 12.6 (25.7)<br />
Payment to AB <strong>Volvo</strong> shareholders (4.1) 0.0<br />
Payment to minority shareholders 0.0 (0.1)<br />
Other (0.1) 0.0<br />
Change in cash and cash equivalents excluding translation differences 3.7 2.1<br />
Translation difference on cash and cash equivalents (0.2) (0.4)<br />
Change in cash and cash equivalents 3.5 1.7<br />
Acquisitions and divestments<br />
Investments and divestments in shares and participation<br />
had a negative impact on cash flow of<br />
SEK 0.1 billion (0.0).<br />
Acquired and divested companies <strong>2010</strong> had a<br />
positive impact on cash flow of SEK 0.6 billion<br />
(positive 0.2).<br />
Financing and dividend<br />
Net borrowings decreased cash and cash equivalents<br />
by SEK 25.7 billion during <strong>2010</strong>.<br />
No dividend was paid during the year to the<br />
shareholders of AB <strong>Volvo</strong>.<br />
Change in cash and cash equivalents<br />
<strong>The</strong> <strong>Group</strong>’s cash and cash equivalents increased<br />
by SEK 1.7 billion during the year and amounted to<br />
SEK 23.0 billion at December 31, <strong>2010</strong>.<br />
65
Financial information <strong>2010</strong><br />
Financial information <strong>2010</strong><br />
67 Consolidated income<br />
statement<br />
67 Other comprehensive<br />
income<br />
68 Consolidated balance<br />
sheet<br />
69 Changes in consolidated<br />
Shareholders’ equity<br />
70 Consolidated cash-flow<br />
statement<br />
71 Notes to consolidated<br />
financial statements<br />
114 Parent Company AB <strong>Volvo</strong><br />
126 Proposed remuneration<br />
policy<br />
127 Proposed disposition of<br />
unappropriated earnings<br />
128 Audit report for AB <strong>Volvo</strong><br />
129 Eleven-year summary<br />
p. Note <strong>The</strong> <strong>Volvo</strong> <strong>Group</strong><br />
71 1 Accounting principles<br />
76 2 Key sources of estimation uncertainty<br />
77 3 Change of accounting principles<br />
78 4 Acquisitions and divestments of<br />
shares in subsidiaries<br />
80 5 Joint ventures<br />
80 6 Associated companies<br />
81 7 Segment reporting<br />
83 8 Other operating income<br />
and expenses<br />
83 9 Income from investments<br />
in associated companies<br />
83 10 Income from other investments<br />
83 11 Other financial income and expenses<br />
84 12 Income taxes<br />
85 13 Minority interests<br />
85 14 Intangible and tangible assets<br />
88 15 Shares and participations<br />
89 16 Non-current customer-financing<br />
receivables<br />
89 17 Non-current receivables<br />
90 18 Inventories<br />
90 19 Current customer-financing receivables<br />
90 20 Current receivables<br />
91 21 Marketable securities<br />
91 22 Cash and cash equivalents<br />
91 23 Shareholders’ equity<br />
93 24 Provisions for post-employment benefits<br />
97 25 Other provisions<br />
97 26 Non-current liabilities<br />
98 27 Current liabilities<br />
99 28 Assets pledged<br />
99 29 Contingent liabilities<br />
100 30 Cash-flow<br />
100 31 Leasing<br />
101 32 Transactions with related parties<br />
101 33 Government grants<br />
101 34 Personnel<br />
105 35 Fees to the auditors<br />
105 36 Goals and policies in<br />
financial risk management<br />
109 37 Financial instruments<br />
p. Note Parent Company<br />
118 1 Accounting principles<br />
118 2 Intra-<strong>Group</strong> transactions<br />
118 3 Administrative expenses<br />
119 4 Other operating income and<br />
expenses<br />
119 5 Income from investments in<br />
group companies<br />
119 6 Income from investments in<br />
associated companies<br />
119 7 Income from other investments<br />
119 8 Interest income and expenses<br />
119 9 Other financial income and<br />
expenses<br />
119 10 Allocations<br />
120 11 Income taxes<br />
120 12 Intangible and tangible assets<br />
121 13 Investments in shares and<br />
participations<br />
121 14 Other short-term receivables<br />
121 15 Untaxed reserves<br />
122 16 Provisions for pensions<br />
122 17 Non-current liabilities<br />
122 18 Other current liabilities<br />
122 19 Contingent liabilities<br />
122 20 Cash-flow<br />
66
Consolidated income statement<br />
SEK M 2009 <strong>2010</strong><br />
Net sales Note 7 218,361 264,749<br />
Cost of sales (186,167) (201,797)<br />
Gross income 32,194 62,952<br />
Research and development expenses Note 7 (13,193) (12,970)<br />
Selling expenses (25,334) (24,149)<br />
Administrative expenses (5,863) (5,666)<br />
Other operating income and expenses Note 8 (4,798) (2,023)<br />
Income from investments in associated companies Note 7, 9 (14) (86)<br />
Income from other investments Note 10 (6) (58)<br />
Operating income Note 7 (17,013) 18,000<br />
Interest income and similar credits 390 442<br />
Interest expenses and similar charges (3,559) (3,142)<br />
Other financial income and expenses Note 11 (392) 213<br />
Income after financial items (20,573) 15,514<br />
Income taxes Note 12 5,889 (4,302)<br />
Income for the period (14,685) 11,212<br />
Attributable to:<br />
Equity holders of the Parent Company (14,718) 10,866<br />
Minority interests Note 13 33 346<br />
(14,685) 11,212<br />
Basic earnings per share, SEK Note 23 (7.26) 5.36<br />
Diluted earnings per share, SEK Note 23 (7.26) 5.36<br />
Other comprehensive income<br />
Income for the period (14,685) 11,212<br />
Translation differences on foreign operations (1,246) (3,891)<br />
Translation differences on hedge instruments of net<br />
investment in foreign operations 159 113<br />
Accumulated translation difference reversed to income (136) (95)<br />
Available-for-sale investments 86 148<br />
Change in cash flow hedge reserve 2,313 (156)<br />
Other comprehensive income, net of income taxes 1,176 (3,881)<br />
Total comprehensive income for the period (13,509) 7,331<br />
Attributable to:<br />
Equity holders of the Parent Company (13,561) 7,016<br />
Minority interests 52 315<br />
(13,509) 7,331<br />
67
Financial information <strong>2010</strong><br />
Consolidated balance sheet<br />
SEK M December 31, 2009 December 31, <strong>2010</strong><br />
Assets<br />
Non-current assets<br />
Intangible assets Note 14 41,628 40,714<br />
Tangible assets Note 14<br />
Property, plant and equipment 54,289 53,294<br />
Investment property 991 948<br />
Assets under operating leases 20,388 75,668 19,647 73,889<br />
Financial assets<br />
Associated companies Note 15 588 684<br />
Other shares and participations Note 15 1,456 1,414<br />
Non-current customer-financing receivables Note 16 39,713 36,025<br />
Deferred tax assets Note 12 12,595 12,310<br />
Prepaid pensions Note 24 2,049 1,648<br />
Non-current interest-bearing receivables Note 17 585 766<br />
Other non-current receivables Note 17 3,038 60,024 3,418 56,265<br />
Total non-current assets 177,320 170,868<br />
Current assets<br />
Inventories Note 18 37,727 39,837<br />
Current receivables<br />
Customer-financing receivables Note 19 42,264 36,663<br />
Tax assets 1,523 1,135<br />
Interest-bearing receivables Note 20 410 342<br />
Accounts receivable Note 20 21,337 24,433<br />
Other receivables Note 20 12,082 11,857<br />
Non interest-bearing assets held for sale Note 4 1,684 136<br />
Interest-bearing assets held for sale 8 79,308 0 74,566<br />
Marketable securities Note 21 16,676 9,767<br />
Cash and cash equivalents Note 22 21,234 22,966<br />
Total current assets 154,945 147,139<br />
Total assets 332,265 318,007<br />
Shareholders’ equity and liabilities<br />
Shareholders’ equity Note 23<br />
Share capital 2,554 2,554<br />
Additional contributed capital – –<br />
Reserves 6,235 2,386<br />
Retained earnings 72,334 57,304<br />
Income for the period (14,718) 10,866<br />
Equity attributable to the equity holders of the Parent Company 66,405 73,110<br />
Minority interests 629 1,011<br />
Total shareholders’ equity 67,034 74,121<br />
Non-current provisions<br />
Provisions for post-employment benefits Note 24 8,051 7,510<br />
Provisions for deferred taxes Note 12 3,638 4,522<br />
Other provisions Note 25 6,360 18,049 5,936 17,968<br />
Non-current liabilities Note 26<br />
Bond loans 49,191 38,767<br />
Other loans 56,035 45,327<br />
Other liabilities 9,888 115,114 9,231 93,325<br />
Current provisions Note 25 9,487 8,534<br />
Current liabilities Note 27<br />
Loans 51,626 39,601<br />
Non interest-bearing liabilities held for sale Note 4 272 135<br />
Trade payables 35,955 47,250<br />
Tax liabilities 623 1,732<br />
Other liabilities 34,105 122,581 35,341 124,059<br />
Total shareholders’ equity and liabilities 332,265 318,007<br />
Assets pledged Note 28 958 3,339<br />
Contingent liabilities Note 29 9,607 11,003<br />
68
Changes in consolidated Shareholders’ equity<br />
Shareholders’ equity attributable to equity holders<br />
of the Parent Company<br />
Share Other Translation Retained<br />
Minority Total<br />
SEK M<br />
capital reserves 1 reserve earnings Total interests equity<br />
Balance at December 31, 2008 2,554 (2,263) 7,341 76,378 84,010 630 84,640<br />
Income for the period – – – (14,718) (14,718) 33 (14,685)<br />
Other comprehensive income<br />
Translation differences on foreign operations – – (1,252) – (1,252) 6 (1,246)<br />
Translation differences on hedge instruments of net<br />
investments in foreign operations – – 159 – 159 – 159<br />
Accumulated translation differences reversed to income – – (136) – (136) – (136)<br />
Available-for-sale investments: Note 15, 23<br />
Gains/losses at valuation to fair value – 86 – – 86 – 86<br />
Change in cash flow hedge reserve Note 23 – 2,300 – – 2,300 13 2,313<br />
Other comprehensive income – 2,386 (1,229) – 1,157 19 1,176<br />
Total income for the period – 2,386 (1,229) (14,718) (13,561) 52 (13,509)<br />
Transactions with shareholders<br />
Dividends – – – (4,055) (4,055) (15) (4,070)<br />
Share based payments Note 34 – – – 4 4 – 4<br />
Changes in minority interests – – – – – (2) (2)<br />
Other changes – – – 7 7 (36) (29)<br />
Transactions with shareholders (4,044) (4,044) (53) (4,097)<br />
Balance at December 31, 2009 2,554 123 6,112 57,616 66,405 629 67,034<br />
Transition effect IFRS 3, capitalized transaction costs Note 3 – – – (135) (135) – (135)<br />
Total equity at beginning of period 2,554 123 6,112 57,481 66,270 629 66,899<br />
Income for the period – – – 10,866 10,866 346 11,212<br />
Other comprehensive income<br />
Translation differences on foreign operations – – (3,859) – (3,859) (32) (3,891)<br />
Translation differences on hedge instruments of net<br />
investments in foreign operations – – 113 – 113 – 113<br />
Accumulated translation differences reversed to income – – (95) – (95) – (95)<br />
Available-for-sale investments: Note 15, 23<br />
Gains/losses at valuation to fair value – 148 – – 148 – 148<br />
Change in cash flow hedge reserve Note 23 – (156) – – (156) – (156)<br />
Other comprehensive income for the period – (8) (3,841) – (3,849) (32) (3,881)<br />
Total income for the period – (8) (3,841) 10,866 7,017 314 7,331<br />
Transactions with shareholders<br />
Dividends – – – – – (412) (412)<br />
Capital contribution – – – – – 358 358<br />
Share based payments Note 34 – – – – – – –<br />
Changes in minority interests – – – (180) (180) 115 (65)<br />
Other changes – – – 3 3 7 10<br />
Transactions with shareholders – – – (177) (177) 68 (109)<br />
Balance at December 31, <strong>2010</strong> 2,554 115 2,271 68,170 73,110 1,011 74,121<br />
1 For specification of other reserves, see Note 23.<br />
69
Financial information <strong>2010</strong><br />
Consolidated cash-flow statement<br />
SEK M 2009 <strong>2010</strong><br />
Operating activities<br />
Operating income (17,013) 18,000<br />
Depreciation and amortization Note 14 15,227 13,792<br />
Other items not affecting cash Note 30 4,397 1,561<br />
Changes in working capital:<br />
(Increase)/decrease in receivables 10,271 (4,330)<br />
(Increase)/decrease in customer finance receivables 12,806 (1,347)<br />
(Increase)/decrease in inventories 15,225 (3,921)<br />
Increase/(decrease) in liabilities and provisions (21,387) 14,399<br />
Interest and similar items received 353 429<br />
Interest and similar items paid (2,905) (2,732)<br />
Other financial items (514) (604)<br />
Income taxes paid (1,604) (2,590)<br />
Cash-flow from operating activities 14,856 32,657<br />
Investing activities<br />
Investments in fixed assets (10,464) (10,334)<br />
Investments in leasing assets (4,246) (4,811)<br />
Disposals of fixed assets and leasing assets 3,849 3,067<br />
Shares and participations, net Note 30 (38) (106)<br />
Acquired and divested subsidiaries and other business units, net Note 4, 30 149 617<br />
Interest-bearing receivables including marketable securities (8,866) (19,616) 6,813 (4,754)<br />
Cash-flow after net investments (4,760) 27,903<br />
Financing activities<br />
Increase/(decrease) in bond loans and other loans Note 30 12,655 (25,711)<br />
Cash payment to AB <strong>Volvo</strong> shareholders’ (4,055) –<br />
Dividends to minority shareholders (15) (75)<br />
Other (58) 8,527 (25) (25,811)<br />
Change in cash and cash equivalents,<br />
excluding translation differences 3,767 2,092<br />
Translation difference on cash and cash equivalents (245) (360)<br />
Change in cash and cash equivalents 3,522 1,732<br />
Cash and cash equivalents, January 1 Note 22 17,712 21,234<br />
Cash and cash equivalents, December 31 Note 22 21,234 22,966<br />
<strong>The</strong> effects of major acquisitions and divestments of subsidiaries in<br />
each year have been excluded from other changes for the balance<br />
sheet items in the cash-flow statement. <strong>The</strong> effects of currency movements<br />
in translation of foreign <strong>Group</strong> companies have also been<br />
excluded since these effects do not affect cash flow. Cash and cash<br />
equivalents include cash and bank balances but also bank certificates<br />
which matures within 3 months from aquisition.<br />
70
Notes to consolidated financial statements<br />
Amounts in SEK M unless otherwise specified. <strong>The</strong> amounts within parentheses refer to the preceding year, 2009.<br />
Note 1 Accounting principles<br />
<strong>The</strong> consolidated financial statements for AB <strong>Volvo</strong> and its subsidiaries<br />
have been prepared in accordance with International Financial Re porting<br />
Standards (IFRS) issued by the International Accounting Standards<br />
Board (IASB), as adopted by the EU. <strong>The</strong> portions of IFRS not adopted<br />
by the EU have no material effect on this report. This <strong>Annual</strong> report is<br />
prepared in accordance with IAS 1 Presentation of Financial Statements<br />
and in accordance with the Swedish Companies Act. In addition,<br />
RFR 1 Supplementary Rules for <strong>Group</strong>s, has been applied, issued by<br />
the Swedish Financial <strong>Report</strong>ing Board. Effective in 2005 <strong>Volvo</strong> has<br />
applied International Financial <strong>Report</strong>ing Standards (IFRS) in its financial<br />
reporting. In accordance with the IFRS transitions rules in IFRS 1,<br />
<strong>Volvo</strong> applies retrospective application from the IFRS transition date at<br />
January 1, 2004. <strong>The</strong> details of the transition from Swedish GAAP to<br />
IFRS are set out in Note 3 in the annual reports of 2005 and 2006.<br />
Refer to the 2004 <strong>Annual</strong> <strong>Report</strong> for a description of the previous<br />
Swedish accounting principles applied by <strong>Volvo</strong>.<br />
In the preparation of these financial statements, the company management<br />
has made certain estimates and assumptions that affect the<br />
value of assets and liabilities as well as contingent liabilities at the<br />
balance sheet date. <strong>Report</strong>ed amounts for income and expenses in<br />
the reporting period are also affected. <strong>The</strong> actual future outcome of<br />
certain transactions may differ from the estimated outcome when<br />
these financial statements were issued. Any such differences will<br />
affect the financial statements for future accounting periods. <strong>The</strong> key<br />
sources of estimation uncertainty are set out in Note 2.<br />
Consolidated financial statements<br />
Principles for consolidation<br />
<strong>The</strong> consolidated financial statements have been prepared in accordance<br />
with the principles set forth in IAS 27, Consolidated and Separate<br />
Financial Statements. Accordingly, intra-<strong>Group</strong> transactions and<br />
gains on transactions with associated companies are eliminated. <strong>The</strong><br />
consolidated financial statements comprise the Parent Company,<br />
subsidiaries, joint ventures and associated companies.<br />
– Subsidiaries are defined as companies in which <strong>Volvo</strong> holds more<br />
than 50% of the voting rights or in which <strong>Volvo</strong> otherwise has a controlling<br />
interest.<br />
– Joint ventures are companies over which <strong>Volvo</strong> has joint control<br />
together with one or more external parties. Joint ventures are reported<br />
by use of the proportionate method of consolidation.<br />
- Associated companies are companies in which <strong>Volvo</strong> has a significant<br />
influence, which is normally when <strong>Volvo</strong>’s holdings equals to at<br />
least 20% but less than 50% of the voting rights. Holdings in associated<br />
companies are reported in accordance with the equity method.<br />
<strong>The</strong> <strong>Group</strong>’s share of reported income in such companies is included<br />
in the consolidated income statement in Income from investments in<br />
associated companies, reduced in appropriate cases by depreciation<br />
of surplus values and the effect of applying different accounting principles.<br />
Income from associated companies is included in operating<br />
income as the <strong>Volvo</strong> investments are of operating nature. For practical<br />
reasons, some of the associated companies are included in the consolidated<br />
accounts with a certain time lag, normally one quarter. Dividends<br />
from associated companies are not included in consolidated<br />
income. In the consolidated balance sheet, the book value of shareholdings<br />
in associated companies is affected by <strong>Volvo</strong>’s share of the<br />
company’s net income, reduced by depreciation of surplus values and<br />
by the amount of dividends received.<br />
<strong>Volvo</strong> applies IFRS 3 (revised), Business Combinations, for acquisitions.<br />
Prior acquisitions are not restated. All business combinations<br />
are accounted for in accordance with the purchase method. <strong>Volvo</strong> values<br />
acquired identifiable assets, tangible and intangible, and liabilities<br />
at fair value. Surplus amount from purchase price, possible minority<br />
and fair value of previous possessions at the acquisition date compared<br />
to the <strong>Group</strong>’s share of acquired net assets are reported as<br />
goodwill. Any lesser amount, so-called negative goodwill, is reported<br />
in the income statement.<br />
At step acquisitions a business combination occurs only at the date<br />
control is achieved, at the same time goodwill is calculated. Transactions<br />
with the minority are reported as equity as long as control of the<br />
subsidiary is retained. For each business combination <strong>Volvo</strong> chooses<br />
if the minority should be valued either at fair value or at the minority’s<br />
proportionate share of the acquiree’s net assets. All acquisitionrelated<br />
costs are expensed. Companies acquired during the year are<br />
consolidated as of the date of acquisition. Companies that have been<br />
divested are included in the consolidated financial statements up to<br />
and including the date of divestment.<br />
Translation to Swedish kronor when consolidating<br />
companies using foreign currencies<br />
AB <strong>Volvo</strong>’s functional currency is the Swedish krona. All reporting in<br />
group companies for group purposes is made in the currency, in which<br />
the company has the majority of its revenues and expenses; normally<br />
the currency of the country where the company is located. AB <strong>Volvo</strong>’s<br />
and the <strong>Volvo</strong> <strong>Group</strong>’s presentation currency is Swedish kronor. In preparing<br />
the consolidated financial statements, all items in the income<br />
statements of foreign subsidiaries and joint ventures (except for subsidiaries<br />
in highly inflationary economies) are translated to Swedish<br />
kronor at monthly exchange rates. All balance sheet items are translated<br />
at exchange rates at the respective year-ends (closing rate). <strong>The</strong><br />
differences in consolidated shareholders’ equity, arising as a result of<br />
variations between closing rates, for the current and previous year are<br />
charged or credited directly to shareholders’ equity as a separate<br />
component.<br />
<strong>The</strong> accumulated translation difference related to a certain subsidiary,<br />
joint venture or associated company is reversed to income as<br />
a part of the gain/loss arising from the divestment or liquidation of<br />
such a company.<br />
IAS 29, Financial <strong>Report</strong>ing in Hyperinflationary Economies, is<br />
applied to financial statements of subsidiaries operating in highly<br />
inflationary economies. <strong>Volvo</strong> applies reporting based on historical<br />
value. Translation differences due to inflation are charged against<br />
earnings for the year. Currently, <strong>Volvo</strong> has no subsidiaries with a functional<br />
currency that could be considered a hyperinflationary currency.<br />
Receivables and liabilities in foreign currency<br />
Receivables and liabilities in foreign currency are valued at closing<br />
rates. Translation differences on operating assets and liabilities are recognized<br />
in operating income, while translation differences arising in<br />
financial assets and liabilities are charged to other financial income and<br />
expenses. Financial assets and liabilities are defined as items included<br />
in the net financial position of the <strong>Volvo</strong> <strong>Group</strong> (see Definitions at the<br />
end of this report). Derivative financial instruments used for hedging of<br />
exchange and interest risks are reported at fair value. Gains on<br />
exchange rates are reported as receivables and losses on exchange<br />
rates are reported as liabilities. Depending on the lifetime of the financial<br />
instrument it is reported as current or non-current in the balance<br />
sheet. Exchange rate differences on loans and other financial instruments<br />
in foreign currency, which are used to hedge net assets in foreign<br />
subsidiaries and associated companies, are offset against translation<br />
differences in the shareholders’ equity of the respective companies.<br />
Exchange rate gains and losses on payments during the year and on<br />
the valuation of assets and liabilities in foreign currencies at year-end<br />
are credited to, or charged against, income in the year they arise. <strong>The</strong><br />
more important exchange rates applied are shown in the table.<br />
71
Financial information <strong>2010</strong><br />
Notes to consolidated financial statements<br />
Exchange rates Average rate Closing rate<br />
Country Currency 2009 <strong>2010</strong> 2009 <strong>2010</strong><br />
Brazil BRL 3.8444 4.0925 4.1375 4.0560<br />
Canada CAD 6.7006 6.9973 6.8885 6.8085<br />
China CNY 1.1192 1.0643 1.0600 1.0300<br />
Denmark DKK 1.4275 1.2823 1.3926 1.2086<br />
Euro EUR 10.6305 9.5502 10.3623 9.0113<br />
Great Britain GBP 11.9322 11.1319 11.4913 10.5538<br />
Japan JPY 0.0819 0.0823 0.0785 0.0835<br />
Norway NOK 1.2172 1.1926 1.2440 1.1530<br />
South Korea KRW 0.0060 0.0062 0.0062 0.0060<br />
United States USD 7.6470 7.2060 7.2138 6.8038<br />
Net sales and revenue recognition<br />
<strong>The</strong> <strong>Group</strong>’s reported net sales pertain mainly to revenues from sales<br />
of goods and services. Net sales are reduced by the value of discounts<br />
granted and by returns.<br />
Income from the sale of goods is recognized when significant risks<br />
and rewards of ownership have been transferred to external parties,<br />
normally when the goods are delivered to the customer. If, however,<br />
the sale of goods is combined with a buy-back agreement or a re sidual<br />
value guarantee, the sale is accounted for as an operating lease<br />
transaction if significant risks of the goods are retained in <strong>Volvo</strong>.<br />
revenues are then recognized over the period of the residual value<br />
commitment. If the residual value risk commitment is not significant,<br />
independent from the sale transaction or in combination with a commitment<br />
from the customer to buy a new <strong>Volvo</strong> product in connection<br />
to a buy-back option, the revenue is recognized at the time of sale and<br />
a provision is reported to reflect the estimated residual value risk (see<br />
Provisions below)<br />
Revenue from the sale of workshop services is recognized when<br />
the service is provided. Interest income in conjunction with finance<br />
leasing or installment contracts are recognized during the underlying<br />
contract period. Revenue for maintenance contracts are recognized<br />
according to how costs associated with the contracts are distributed<br />
during the contract period.<br />
Interest income is recognized on a continuous basis and dividend<br />
income when the right to receive dividend is obtained.<br />
Leasing<br />
<strong>Volvo</strong> as the lessor<br />
Leasing contracts are defined in two categories, operating and<br />
finance leases, depending on the contract’s financial implications.<br />
Operating leasing contracts are reported as non-current assets in<br />
Assets under operating leases. Income from operating leasing is<br />
reported equally distributed over the leasing period. Straight-line<br />
depreciation is applied to these assets in accordance with the terms<br />
of the undertaking and the deprecation amount is adjusted to correspond<br />
to the estimated realizable value when the undertaking expires.<br />
Assessed impairments are charged to the income statement. <strong>The</strong><br />
product’s assessed realizable value at expiration of the undertaking is<br />
reviewed continuously on an individual basis.<br />
Finance leasing agreements are reported as either Non-current or<br />
current receivables in the customer finance operations. Payments from<br />
finance leasing contracts are distributed between interest income and<br />
amortization of the receivable in the customer finance operations.<br />
<strong>Volvo</strong> as the lessee<br />
<strong>Volvo</strong> evaluates leasing contracts in accordance with IAS 17, Leases.<br />
In those cases in which risks and rewards that are related to ownership<br />
are substantially held by <strong>Volvo</strong>, so called finance leases, <strong>Volvo</strong><br />
reports the asset and related obligation in the balance sheet at the<br />
lower of the leased asset’s fair value or the present value of minimum<br />
lease payments. Future leasing fee commitments are reported as<br />
loans. <strong>The</strong> lease asset is depreciated in accordance with <strong>Volvo</strong>’s policy<br />
for the respective non-current asset. <strong>The</strong> lease payments when made<br />
are allocated between amortization and interest expenses. If the leasing<br />
contract is considered to be a so called operating lease, lease<br />
payments are charged to the income statement over the lease contract<br />
period.<br />
<strong>Report</strong>ing of financial assets and liabilities<br />
Financial assets treated within the framework of IAS 39 are classified<br />
either as<br />
– Financial assets at fair value through profit and loss,<br />
– Investments held to maturity,<br />
– Loans and receivables, or as<br />
– Available-for-sale financial assets<br />
Financial liabilities are reported either at amortized cost or at fair value<br />
through profit and loss.<br />
Purchases and sales of financial assets and liabilities are recognized<br />
on the transaction date. A financial asset is derecognized (extinguished)<br />
in the balance sheet when all significant risks and benefits<br />
linked to the asset have been transferred to a third party. <strong>The</strong> same<br />
principles are applied for financial assets in the segment reporting of<br />
<strong>Volvo</strong> <strong>Group</strong>.<br />
<strong>The</strong> fair value of assets is determined based on the market prices in<br />
such cases they exist. If market prices are unavailable, the fair value is<br />
determined for each asset using various valuation techniques. Transaction<br />
expenses are included in the asset’s fair value except in cases<br />
in which the change in value is recognized in the income statement.<br />
<strong>The</strong> transaction costs arising in conjunction with assuming financial<br />
liabilities are amortized over the term of the loan as a financial cost.<br />
Embedded derivatives are detached from the related main contract, if<br />
applicable. Contracts containing embedded derivatives are valued at fair<br />
value in the income statement if the contracts’ inherent risk and other<br />
characteristics indicate a close relation to the embedded derivative.<br />
Financial assets at fair value through profit and loss<br />
All of <strong>Volvo</strong>’s financial assets that are recognized at fair value in the<br />
income statement are classified as held for trading. Included are<br />
derivatives that <strong>Volvo</strong> has decided not to apply hedge accounting on,<br />
and derivates that are not part of an evidently effective hedge<br />
accounting. Gains and losses on these assets are recognized in the<br />
income statement. Short-term investments that are reported at fair<br />
value through profit and loss mainly consist of interest-bearing financial<br />
instruments and are reported in note 21. Derivatives used for<br />
hedging interest-rate exposure in the customer financing portfolio are<br />
72
included in this category as it is not practically possible to apply hedge<br />
accounting in accordance with IAS 39 due to the large number of<br />
contracts that the customer finance portfolio consist of. <strong>Volvo</strong> intends<br />
to keep these derivatives to maturity, why, over time, the market valuation<br />
will be offset as a consequence of the interest-rate fixing on<br />
borrowing and lending for the customer finance operations, and<br />
accordingly not affect result or cash flow.<br />
Financial assets held to maturity<br />
Held-to-maturity investments are non-derivative assets with fixed<br />
payments and terms and that <strong>Volvo</strong> intends and is able to hold to<br />
maturity. After initial recognition, these assets are measured in<br />
accordance with the effective interest method, with adjustment for<br />
any impairment. Gains and losses are recognized in the income statement<br />
when assets are divested or impaired as well as in pace with the<br />
accrued interest being reported. At present <strong>Volvo</strong> has no financial<br />
instruments classified in this category.<br />
Loan receivables and other receivables<br />
Loans and receivables are non-derivative financial assets with fixed or<br />
determinable payments, originated or acquired, that are not quoted in<br />
an active market. After initial recognition, loans and receivables are<br />
measured in accordance with the effective interest method. Gains and<br />
losses are recognized in the income statement when the loans or<br />
receivables are divested or impaired as well as in pace with the<br />
accrued interested being reported.<br />
Accounts receivables are recognized initially at fair value, which<br />
normally corresponds to the nominal value. In the event that the payment<br />
terms exceed one year, the receivable is recognized at the discounted<br />
present value.<br />
Assessment of impairment – loan receivables and other receivables<br />
<strong>Volvo</strong> conducts routine controls to ensure that the carrying value of<br />
assets valued at amortized cost, such as loans and receivables, has<br />
not decreased, which would result in an impairment loss reported in<br />
the income statement. Allowances for doubtful receivables are continuously<br />
reported based on an assessment of a possible change in<br />
the customer’s ability to pay.<br />
Impairments consist of the difference between carrying value and<br />
current value of the estimated future payment flow attributable to the<br />
specific asset with consideration to the fair value of any collateral.<br />
Discounting of future cash flow is based on the effective rate used<br />
initially. Initially, the impairment requirement is evaluated for each<br />
respective asset. If, based on objective grounds, it cannot be determined<br />
that one or more assets are subject to an impairment loss, the<br />
assets are grouped in units based, for example, on similar credit risks<br />
to evaluate the impairment loss requirement collectively. Individually<br />
written down assets or assets written down during previous periods<br />
are not included when grouping assets for impairment test.<br />
If the conditions for a completed impairment loss later prove to no<br />
longer be present the impairment loss is reversed in the income statement<br />
as long as the carrying value does not exceed the amortized<br />
cost at the time of the reversal.<br />
<strong>Volvo</strong> discloses loan receivables and accounts receivables in the<br />
notes 16, 17, 19 and 20.<br />
Available-for-sale assets<br />
This category includes assets available for sales or those that have<br />
not been classified in any of the other three categories. <strong>The</strong>se assets<br />
are initially measured at fair value including transaction costs. Fair<br />
value changes are recognized directly in other comprehensive income.<br />
<strong>The</strong> cumulative gain or loss that was recognized in other comprehensive<br />
income is recognized in profit or loss when an available-for-sale<br />
financial asset is sold. Unrealized value declines are recognized in<br />
other comprehensive income, unless the decline is significant or prolonged.<br />
<strong>The</strong>n the impairment is recognized in the income statement. If<br />
the event causing the impairment no longer exists, impairment can be<br />
reversed in the income statement if it does not involve an equity<br />
instrument.<br />
Earned or paid interest attributable to these assets is recognized in<br />
the income statement as part of net financial items in accordance with<br />
the effective interest method. Dividends received attributable to these<br />
assets are recognized in the income statement as Income from other<br />
investments.<br />
<strong>Volvo</strong> reports shares and participations in listed companies at market<br />
value on the balance-sheet date, with the exception of investments<br />
classified as associated companies and joint ventures. Holdings<br />
in unlisted companies for which a market value is unavailable are<br />
recognized at acquisition value. <strong>Volvo</strong> classifies these types of investments<br />
as assets available for sale. See note 15 for <strong>Volvo</strong>’s holdings of<br />
shares and participations in listed companies.<br />
Assessment of impairment – available-for-sale assets<br />
If an asset available for sale is to be impaired, it shall be effected by<br />
taking the difference between the asset’s acquisition value (adjusted<br />
for any accrued interest if it involves that type of asset) and its fair<br />
value. If it instead involves equity instruments such as shares, a completed<br />
impairment shall not be reversed in the income statement. On<br />
the other hand, impairments that have been made on debt instruments<br />
(interest-bearing instruments) shall in whole or part be reversed<br />
in the income statement, in those instances where an event that is<br />
proven to have occurred after the impairment was performed is identified<br />
and impacts the valuation of that asset.<br />
Hedge accounting<br />
Derivatives used for hedging of firm future commercial currency exposure<br />
as well as forecasted electricity consumption have, in accordance<br />
with IAS 39, been reported at fair value in the balance sheet.<br />
Since the fourth quarter 2009 hedge accounting is not applied on<br />
new financial instruments used for hedging commercial flows. However<br />
for previously entered financial instruments hedge accounting is<br />
continuously applied. <strong>The</strong> majority of those financial instruments have<br />
expired during the year.<br />
When hedge accounting is not applied, unrealized gains and losses<br />
from fluctuations in the fair values of the financial instruments are<br />
reported in the income statement in the segment <strong>Group</strong> headquarter<br />
functions and other. When the derivative financial instrument have been<br />
realized the income effect is reported within the respective segments.<br />
As from January 1, 2011 unrealized changes in fair value of financial<br />
instruments related to a receivable or payable will be reported within the<br />
respective segments. All other unrealized changes in fair value of<br />
financial instruments will henceforth be reported in the income statement<br />
in the segment <strong>Group</strong> headquarter functions and other.<br />
During <strong>2010</strong> <strong>Volvo</strong> has partly applied hedge accounting for financial<br />
instruments used to hedge interest and currency risks on loans<br />
only for cases when hedge accounting requirements are fulfilled. This<br />
concerns a loan of 1 billion euro borrowed in 2007. <strong>The</strong> changes<br />
in the fair value of the outstanding hedge instruments and the<br />
changes in the carrying value of the loan are reported in the income<br />
statement. For cases where hedge accounting is not considered to be<br />
fulfilled, unrealized gains and losses up until the maturity date of the<br />
financial instrument will be charged to the financial net in the income<br />
statement.<br />
73
Financial information <strong>2010</strong><br />
Notes to consolidated financial statements<br />
During <strong>2010</strong> <strong>Volvo</strong> has applied hedge accounting for certain net<br />
investments in foreign operations. <strong>The</strong> current result for such hedges<br />
is reported in a separate component in shareholders’ equity. In the<br />
event of a divestment, the accumulated result from the hedge is recognized<br />
in the income statement.<br />
See notes 36 and 37 for the valuation of all financial instruments in<br />
the <strong>Volvo</strong> <strong>Group</strong> and for details and further description on principles<br />
for economic hedging, hedge accounting and changes to the policies<br />
for hedging and hedge accounting during <strong>2010</strong> and going forward.<br />
Research and development expenses<br />
<strong>Volvo</strong> applies IAS 38, Intangible Assets, for reporting of research and<br />
development expenses. In accordance with this standard, expenditures<br />
for development of new products, production systems and software<br />
shall be reported as intangible assets if such expenditures with<br />
a high degree of certainty will result in future financial benefits for the<br />
company. <strong>The</strong> acquisition value for such intangible assets shall be<br />
amortized over the estimated useful life of the assets. In order for<br />
these development expenditures to be reported as assets, a number<br />
of criteria must be met. For example, it must be possible to prove the<br />
technical functionality of a new product or software prior to its development<br />
being reported as an asset. In normal cases, this means that<br />
expenditures are capitalized only during the industrialization phase of<br />
a product development project. Other research and development<br />
expenses are charged to income as incurred.<br />
Intangible and tangible non-current assets<br />
<strong>Volvo</strong> applies acquisition values for valuation of intangible and tangible<br />
assets. Borrowing costs are included in the acquisition value of<br />
assets that necessarily takes more than 12 months to get ready for its<br />
intended use or sale, so called qualifying assets.<br />
Investment property is reported at acquisition cost. Information<br />
regarding estimated fair value of investment property is based on discounted<br />
cash flow projections. <strong>The</strong> estimation is performed by the<br />
<strong>Group</strong>’s Real Estate business unit. <strong>The</strong> required return is based on<br />
current property market conditions for comparable properties in comparable<br />
locations.<br />
In connection with participation in industrial cooperation projects<br />
together with other companies, such as the aircraft engine projects<br />
that <strong>Volvo</strong> Aero participates in, <strong>Volvo</strong> pays in certain cases an entrance<br />
fee to participate. <strong>The</strong>se entrance fees are capitalized as intangible<br />
assets.<br />
Depreciation, amortization and impairment<br />
Depreciation is made on a straight-line basis based on the acquisition<br />
value of the assets, adjusted in appropriate cases by write-downs, and<br />
estimated useful lives. Depreciation is reported in the respective function<br />
to which it belongs. Impairment tests for depreciable non-current<br />
assets are performed if there are indications of impairment at the balance<br />
sheet date.<br />
Goodwill is reported as an intangible non-current asset with<br />
indefin ite useful life. For non-depreciable non-current assets such as<br />
goodwill, impairment tests are performed annually, as well as if there<br />
are indications of impairments during the year, through calculation of<br />
the asset’s recovery value. If the calculated recovery value is less than<br />
the carrying value, a write-down is made to the asset’s recovery value.<br />
See note 14 for goodwill.<br />
Depreciation periods<br />
Capitalized type-specific tools 2 to 8 years<br />
Operational leases 3 to 5 years<br />
Machinery 5 to 20 years<br />
Buildings and Investment property 25 to 50 years<br />
Land improvements 20 years<br />
Trademarks 20 years<br />
Distribution networks 10 years<br />
Product and software development 3 to 8 years<br />
Aircraft engine projects<br />
20 years<br />
Non-current assets held for sale and discontinued operations<br />
<strong>Volvo</strong> applies IFRS 5, Non-current Assets Held for Sale and Discontinued<br />
Operations. <strong>The</strong> standard also includes current assets. In a<br />
global group like <strong>Volvo</strong>, processes are continuously ongoing regarding<br />
the sale of assets or groups of assets at minor values. In cases in<br />
which the criteria for being classified as a non-current asset held for<br />
sale are fulfilled and the asset or group of assets is not of minor value,<br />
the asset or group of assets and the related liabilities are reported on<br />
a separate line in the balance sheet. <strong>The</strong> asset or group of assets are<br />
tested for impairment and, if impaired valued at fair value after deduction<br />
for selling expenses. <strong>The</strong> balance sheet items and the income<br />
effect resulting from the revaluation to fair value less costs to sell are<br />
normally reported in the segment <strong>Group</strong> headquarter functions and<br />
other, until the sale is completed and the result from it is assigned to<br />
the other segments.<br />
Inventories<br />
Inventories are reported at the lower of cost, in accordance with the<br />
first-in, first-out method (FIFO), or net realizable value. <strong>The</strong> acquisition<br />
value is based on the standard cost method, including costs for all<br />
direct manufacturing expenses and the apportionable share of the<br />
capacity and other related manufacturing costs. <strong>The</strong> standard costs<br />
are tested regularly and adjustments are made based on current conditions.<br />
Costs for research and development, selling, administration<br />
and financial expenses are not included. Net realizable value is calculated<br />
as the selling price less costs attributable to the sale.<br />
Share-based payments<br />
<strong>Volvo</strong> applies IFRS 2, Share-based Payments for share-based incentive<br />
programs. IFRS 2 distinguishes between “cash-settled” and<br />
“equity-settled”, in <strong>Volvo</strong>’s case, shares. <strong>The</strong> <strong>Volvo</strong> program includes<br />
both a cash-settled and an equity-settled part, however this is not<br />
applicable for <strong>2010</strong> as there were no program in <strong>2010</strong>. <strong>The</strong> value of<br />
the equity-settled payments is determined at the grant-date, recognized<br />
as an expense during the vesting period and off-set in equity.<br />
<strong>The</strong> fair value is calculated according to share price reduced by dividend<br />
connected to the share before the allotment. <strong>The</strong> additional<br />
social costs are reported as a liability, revalued at each balance sheet<br />
date in accordance with UFR 7, issued by the Swedish Financial<br />
<strong>Report</strong>ing Board. <strong>The</strong> cash-settled payment is revalued at each balance<br />
sheet day and is reported as an expense during the vesting<br />
period and as a short term liability. An assessment whether the terms<br />
for allotment will be fulfilled is made continuously. If the assessment<br />
changes, the expense will be adjusted. See note 34.<br />
Provisions<br />
Provisions are reported on balance when a legal or constructive obligation<br />
exists as a result of a past event and it is probable that an<br />
outflow of resources will be required to settle the obligation and the<br />
amount can be reliably estimated.<br />
74
Pensions and similar obligations (Post-employment benefits)<br />
<strong>Volvo</strong> applies IAS 19, Employee Benefits, for pensions and similar<br />
obligations. In accordance with IAS 19, actuarial calculations should<br />
be made for all defined-benefit plans in order to determine the present<br />
value of obligations for benefits vested by its current and former<br />
employees. <strong>The</strong> actuarial calculations are prepared annually and are<br />
based upon actuarial assumptions that are determined close to the<br />
balance sheet date each year. Changes in the present value of obligations<br />
due to revised actuarial assumptions and experience adjustments<br />
are treated as actuarial gains or losses. <strong>The</strong>se are amortized<br />
according to function over the employees’ average remaining service<br />
period to the extent they exceed the corridor value for each plan.<br />
Deviations between expected return on plan assets and actual<br />
return are also treated as actuarial gains or losses. Provisions for<br />
post-employment benefits in <strong>Volvo</strong>’s balance sheet correspond to the<br />
present value of obligations at year-end, less fair value of plan assets,<br />
unrecognized actuarial gains or losses and unrecognized unvested<br />
past service costs. See note 24.<br />
As a supplement to IAS 19, <strong>Volvo</strong> applies UFR 4, in accordance with<br />
the recommendation from the Swedish Financial <strong>Report</strong>ing Board in<br />
calculating the Swedish pension liabilities.<br />
For defined contribution plans premiums are expensed as incurred<br />
over the income statement according to function.<br />
Provisions for residual value risks<br />
Residual value risks are attributable to operating lease contracts or<br />
sales transactions combined with buy-back agreements or residual<br />
value guarantees. Residual value risks are the risks that <strong>Volvo</strong> in the<br />
future would have to dispose used products at a loss if the price development<br />
of these products is worse than what was expected when the<br />
contracts were entered. Provisions for residual value risks are made<br />
on a continuing basis based upon estimations of the used products’<br />
future net realizable values. <strong>The</strong> estimations of future net realizable<br />
values are made with consideration to current prices, expected future<br />
price development, expected inventory turnover period and expected<br />
direct and indirect selling expenses. If the residual value risks pertain<br />
to products that are reported as tangible assets in <strong>Volvo</strong>’s balance<br />
sheet, these risks are reflected by depreciation or write-down of the<br />
carrying value of these assets. If the residual value risks pertain to<br />
products, which are not reported as assets in <strong>Volvo</strong>’s balance sheet,<br />
these risks are reflected under the line item current provisions.<br />
Contingent liabilities<br />
A contingent liability is reported for a possible obligation, for which it<br />
is not yet confirmed that a present obligation exists that could lead to<br />
an outflow of resources; or for a present obligation that does not meet<br />
the definitions of a provision or a liability as it is not probable that an<br />
outflow of resources will be required to settle the obligation or when a<br />
sufficiently reliable estimate of the amount cannot be made.<br />
Warranty expenses<br />
Estimated costs for product warranties are charged to operating<br />
expenses when the products are sold. Estimated costs include both<br />
expected contractual warranty obligations as well as expected goodwill<br />
warranty obligations. Estimated costs are determined based upon<br />
historical statistics with consideration of known changes in product<br />
quality, repair costs or similar. Costs for campaigns in connection with<br />
specific quality problems are charged to operating expenses when the<br />
campaign is decided and announced.<br />
Restructuring costs<br />
Restructuring costs are reported as a separate line item in the income<br />
statement if they relate to a considerable change of the <strong>Group</strong> structure.<br />
Other restructuring costs are included in Other operating income<br />
and expenses. A provision for decided restructuring measures is<br />
reported when a detailed plan for the implementation of the measures<br />
is complete and when this plan is communicated to those who are<br />
affected.<br />
Income taxes<br />
Tax legislation in Sweden and other countries sometimes contains<br />
rules other than those identified with generally accepted accounting<br />
principles, pertaining to the timing of taxation and measurement of<br />
certain commercial transactions. Deferred taxes are reported on differences<br />
that arise between the taxable value and reported value of<br />
assets and liabilities (temporary differences) as well as on tax-loss<br />
carryforwards. However, with regard to the valuation of deferred tax<br />
assets, that is, the value of future tax reductions, these items are recognized<br />
provided that it is probable that the amounts can be utilized<br />
against future taxable income.<br />
Deferred taxes on temporary differences on participations in subsidiaries<br />
and associated companies are only reported when it is probable<br />
that the difference will be recovered in the near future.<br />
Tax laws in Sweden and certain other countries allow companies to<br />
defer payment of taxes through allocations to untaxed reserves.<br />
<strong>The</strong>se items are treated as temporary differences in the consolidated<br />
balance sheet, that is, a split is made between deferred tax liability<br />
and equity capital. In the consolidated income statement an allocation<br />
to, or withdrawal from, untaxed reserves is divided between deferred<br />
taxes and net income for the year.<br />
Cash-flow statement<br />
<strong>The</strong> cash-flow statement is prepared in accordance with IAS 7, Cash<br />
flow statement, indirect method. <strong>The</strong> cash-flow statements of foreign<br />
<strong>Group</strong> companies are translated at the average rate. Changes in<br />
<strong>Group</strong> structure, acquisitions and divestments, are reported net,<br />
excluding cash and cash equivalents, in the item Acquisition and<br />
divestment of subsidiaries and other business units and are included<br />
in cash flow from Investing activities.<br />
Cash and cash equivalents include cash, bank balances and parts<br />
of marketable securities, with date of maturity within three months at<br />
the time for investment. Marketable securities comprise interestbearing<br />
securities, the majority of which with terms exceeding three<br />
months. However, these securities have high liquidity and can easily<br />
be converted to cash. In accordance with IAS 7, certain investment in<br />
marketable securities are excluded from the definition of cash and<br />
cash equivalents in the cash-flow statement if the date of maturity of<br />
such instruments is later than three months after the investment was<br />
made.<br />
Earnings per share<br />
Earnings per share are calculated as the income for the period attributed<br />
to the shareholders of the Parent Company, divided with the<br />
average number of outstanding shares per reporting period. To calculate<br />
the diluted earnings per share, the average number of shares in<br />
the denominator is adjusted with the average number of shares that<br />
would be issued as an effect of ongoing share-based incentive programs<br />
that have been exercised or cancelled during the period. See<br />
note 23.<br />
75
Financial information <strong>2010</strong><br />
Notes to consolidated financial statements<br />
Note 2 Key sources of estimation uncertainty<br />
<strong>Volvo</strong>’s significant accounting principles are set out in note 1, Accounting<br />
Principles and conform to IFRS as endorsed by the EU. <strong>The</strong> preparation<br />
of <strong>Volvo</strong>’s Consolidated Financial Statements requires the use of<br />
estimates, judgements and assumptions that affect the reported<br />
amounts of assets, liabilities and provisions at the date of the financial<br />
statements and the reported amounts of sales and expenses during<br />
the periods presented. In preparing these financial statements, <strong>Volvo</strong>’s<br />
management has made its best estimates and judgements of<br />
certain amounts included in the financial statements, giving due consideration<br />
to materiality. <strong>The</strong> application of these accounting principles<br />
involves the exercise of judgement and use of assumptions as<br />
future uncertainties and accordingly actual results could differ from<br />
these estimates. In accordance with IAS 1, preparers are required to<br />
provide additional disclosure of accounting principles in which estimates,<br />
judgments and assumptions are particularly sensitive and<br />
which, if actual results are different, may have a material impact on the<br />
financial statements. <strong>The</strong> accounting principles applied by <strong>Volvo</strong> that<br />
are deemed to meet these criteria are discussed below.<br />
Impairment of goodwill, other intangible assets<br />
and other non-current assets<br />
Property, plant and equipment, intangible assets other than goodwill,<br />
and certain other non-current assets are amortized and depreciated<br />
over their useful lives. Useful lives are based on management’s estimates<br />
of the period that the assets will generate revenue. If, at the<br />
date of the financial statements, there is any indication that a tangible<br />
or intangible non-current asset has been impaired, the recoverable<br />
amount of the asset should be estimated. <strong>The</strong> recoverable amount is<br />
the higher of the asset’s net selling price and its value in use, estimated<br />
with reference to management’s projections of future cash<br />
flows. If the recoverable amount of the asset is less than the carrying<br />
amount, an impairment loss is recognized and the carrying amount of<br />
the asset is reduced to the recoverable amount. Determination of the<br />
recoverable amount is based upon management’s projections of<br />
future cash flows, which are generally made by use of internal business<br />
plans or forecasts. While management believes that estimates of<br />
future cash flows are reasonable, different assumptions regarding<br />
such cash flows could materially affect valuations. Intangible and tangible<br />
non-current assets amounted to 114,603 (117,296 ) whereof<br />
22,936 (23,827) represents goodwill. For Goodwill and certain other<br />
intangible assets with indefinite useful lives, an annual, or more frequently<br />
if necessary, impairment review is performed. Such an impairment<br />
review will require management to determine the fair value of<br />
<strong>Volvo</strong>’s cash generating units, on the basis of projected cash flows<br />
and internal business plans and forecasts. Overvalues differ between<br />
the business areas and they are, to a varying degree, sensitive to<br />
changes in the business environment. <strong>Volvo</strong> has since 2002 performed<br />
a similar impairment review. No impairment charges were<br />
required for the period 2002 until <strong>2010</strong>. See note 14 for the allocation<br />
and impairment tests of goodwill.<br />
Revenue recognition<br />
Revenue from the sale of products is recognized when significant<br />
risks and rewards of ownership have been transferred to external<br />
parties, normally when the products are delivered to the customers. If,<br />
however, the sale of products is combined with a buy-back agreement<br />
or a residual value guarantee, as described below regarding residual<br />
value risks, the sale is accounted for as an operating lease transaction<br />
under the condition that significant risks of the products are retained<br />
by <strong>Volvo</strong>. In certain cases <strong>Volvo</strong> enters into a buy-back agreement or<br />
residual value guarantee after <strong>Volvo</strong> has sold the product to an independent<br />
party or in combination with an undertaking from the customer<br />
that in the event of a buy-back to purchase a new <strong>Volvo</strong> product.<br />
In such cases, there may be a question of judgement regarding<br />
whether or not significant risks and rewards of ownership have been<br />
transferred to the customer. If it is determined that such an assessment<br />
was incorrect, <strong>Volvo</strong>’s reported revenue and income for the<br />
period will decline and instead be distributed over several reporting<br />
periods.<br />
Residual value risks<br />
In the course of its operations, <strong>Volvo</strong> is exposed to residual value risks<br />
through operating lease agreements and sales combined with repurchase<br />
agreements. Residual value commitments amount to SEK<br />
13,339 (14,954) at December 31, <strong>2010</strong>. Residual value risks are<br />
reflected in different ways in the <strong>Volvo</strong> consolidated financial statements<br />
depending on the extent to which the risk remains with <strong>Volvo</strong>.<br />
In cases where significant risks pertaining to the product remain<br />
with <strong>Volvo</strong>, the products, primarily trucks, are generally recognized in<br />
the balance sheet as assets under operating leases. Depreciation<br />
expenses for these products are charged on a straight-line basis over<br />
the term of the commitment in amounts required to reduce the value<br />
of the product to its estimated net realizable value at the end of the<br />
commitment. <strong>The</strong> estimated net realizable value of the products at the<br />
end of the commitments is monitored individually on a continuing<br />
basis. A decline in prices for used trucks and construction equipment<br />
may negatively affect the consolidated operating income. High inventories<br />
in the truck industry and the construction equipment industry<br />
and low demand may have a negative impact on the prices of new and<br />
used trucks and construction equipment. In monitoring estimated net<br />
realizable value of each product under a residual value commitment,<br />
management makes consideration of current price-level of the used<br />
product model, value of options, mileage, condition, future price<br />
de terioration due to expected change of market conditions, alternative<br />
distribution channels, inventory lead-time, repair and reconditioning<br />
costs, handling costs and overhead costs in the used product divisions.<br />
Additional depreciations and estimated impairment losses are<br />
immediately charged to income.<br />
<strong>The</strong> total risk exposure for assets under operating lease is reported as<br />
current and non-current residual value liabilities. See notes 26 and 27.<br />
If the residual value risk commitment is not significant, independent<br />
from the sale transaction or in combination with a commitment from<br />
the customer to buy a new <strong>Volvo</strong> product in connection to a buy-back<br />
option, the asset is not recognized on balance. Instead, the risk<br />
ex posure is reported as a residual value provision equivalent to the<br />
estimated residual value risk. See note 25.<br />
To the extent the residual value exposure does not meet the definition<br />
of a provision, the remaining residual value risk exposure is<br />
reported as a contingent liability. See note 29.<br />
Deferred taxes<br />
Under IFRS, deferred taxes are recognized for temporary differences,<br />
which arise between the taxable value and reported value of assets<br />
and liabilities as well as for unutilized tax-loss carryforwards. <strong>Volvo</strong><br />
records valuation allowances for deferred tax assets where management<br />
does not expect such assets to be realized based upon current<br />
forecasts. In the event that actual results differ from these estimates<br />
or adjustments are made to future periods in these estimates, changes<br />
76
in the valuation allowance may be needed that could materially impact<br />
the financial position and the income for the period. At December 31,<br />
<strong>2010</strong>, the valuation allowance amounted to 339 (296) for the value of<br />
deferred tax assets. Net of this valuation allowance, deferred tax<br />
assets of 20,109 (21,533 ) were recognized in the <strong>Group</strong>’s balance<br />
sheet.<br />
<strong>Volvo</strong> has significant tax-loss carryforwards which are related to<br />
countries with long or indefinite periods of utilization, mainly Sweden<br />
and France. Of the total deferred tax asset for loss carryforwards<br />
7,327 (8,939), an amount of 3,665 (4,653) relates to Sweden with<br />
indefinite time of utilization. <strong>Volvo</strong> considers it to be most certain that<br />
the <strong>Volvo</strong> <strong>Group</strong> will be able to generate sufficient income in the coming<br />
years to utilize the tax-loss carryforwards.<br />
Inventory obsolescence<br />
Inventories are reported at the lower of cost, in accordance with the<br />
first-in, first-out method (FIFO), and net realizable value. <strong>The</strong> estimated<br />
net realizable value includes management consideration of<br />
outdated articles, over-stocking, physical damages, inventory leadtime,<br />
handling and other selling costs. If the estimated net realizable<br />
value is lower than cost, a valuation allowance is established for inventory<br />
obsolescence. <strong>The</strong> total inventory value, net of inventory obsolescence<br />
allowance, is per December 31, <strong>2010</strong>, 39,837 (37,727).<br />
Credit loss reserves<br />
<strong>The</strong> establishment of credit loss reserves on customer financing<br />
receivables is dependent on estimates including assumptions regarding<br />
past dues, repossession rates and the recovery rate on the underlying<br />
collaterals. At December 31, <strong>2010</strong>, the total credit loss reserves in the<br />
segment Customer Finance segment amounted to 1.69% (1.67) of<br />
the total credit portfolio in the segment. See note 36 for a description<br />
of the credit risk.<br />
Pensions and other post-employment benefits<br />
Provisions and costs for post-employment benefits, mainly pensions<br />
and health-care benefits, are dependent on assumptions used by<br />
actuaries in calculating such amounts. <strong>The</strong> appropriate assumptions<br />
and actuarial calculations are made separately for the respective<br />
countries of <strong>Volvo</strong>’s operations which result in obligations for postemployment<br />
benefits. <strong>The</strong> assumptions include discount rates, health<br />
care cost trends rates, inflation, salary growth, long-term return on<br />
plan assets, retirement rates, mortality rates and other factors. <strong>Volvo</strong>’s<br />
assumptions regarding discount rate are presented in note 24. Health<br />
care cost trend assumptions are based on historical cost data, the<br />
near-term outlook, and an assessment of likely long-term trends. Inflation<br />
assumptions are based on an evaluation of external market indicators.<br />
<strong>The</strong> salary growth assumptions reflect the long-term actual<br />
experience, the near-term outlook and assumed inflation. Retirement<br />
and mortality rates are based primarily on officially available mortality<br />
statistics. <strong>The</strong> actuarial assumptions are reviewed on an annual basis<br />
and modifications are made to them when it is deemed appropriate to<br />
do so. Actual results that differ from management’s assumptions are<br />
accumulated and amortized over future periods. See Note 24 for more<br />
information regarding costs and assumptions for post-employment<br />
benefits. At December 31, <strong>2010</strong> net provisions for post-employment<br />
benefits amounted to 5,862 (6,002).<br />
Product warranty costs<br />
Estimated costs for product warranties are charged to cost of sales<br />
when the products are sold. Estimated warranty costs include contractual<br />
warranty and goodwill warranty (warranty cover in excess of<br />
contractual warranty or campaigns which is accepted as a matter of<br />
policy or normal practice in order to maintain a good business relation<br />
with the customer). Warranty provisions are estimated with consideration<br />
of historical claims statistics, the warranty period, the average time-lag<br />
between faults occurring and claims to the company and anticipated<br />
changes in quality indexes. Differences between actual warranty<br />
claims and the estimated claims generally affect the recognized<br />
expense and provisions in future periods. Refunds from sup pliers, that<br />
decrease <strong>Volvo</strong>’s warranty costs, are recognized to the extent these<br />
are considered to be certain. At December 31, <strong>2010</strong> warranty cost<br />
provisions amounted to 7,841 (7,947).<br />
Legal proceedings<br />
<strong>Volvo</strong> recognizes obligations in the <strong>Group</strong> accounts as provisions or<br />
other liabilities only in cases where <strong>Volvo</strong> has a present obligation<br />
from a past event, where a financial responsibility is probable and<br />
<strong>Volvo</strong> can make a reliable estimate of the size of the amount. In<br />
instances where these criteria are not met, a contingent liability may<br />
be disclosed in the notes to the accounts.<br />
<strong>Volvo</strong> regularly reviews the development of significant outstanding<br />
legal disputes in which <strong>Group</strong> companies are parties, both civil law<br />
and tax disputes, in order to assess the need for provisions and contingent<br />
liabilities in the financial statements. Among the factors that<br />
<strong>Volvo</strong> considers in making decisions on provisions and contingent<br />
liabilities are the nature of the dispute, the amount claimed, the<br />
progress of the case, the opinions or views of legal counsels and other<br />
advisers, experience in similar cases, and any decision of <strong>Volvo</strong>’s management<br />
as to how <strong>Volvo</strong> intends to handle the dispute. <strong>The</strong> actual<br />
outcome of a legal dispute may deviate from the expected outcome of<br />
the dispute. <strong>The</strong> difference between actual and expected outcome of<br />
a dispute might materially affect future financial statements, with an<br />
adverse impact upon the <strong>Group</strong>’s results of operation, financial position<br />
and liquidity. See note 29 for the <strong>Volvo</strong> <strong>Group</strong>’s gross exposure to<br />
contingent liabilities.<br />
Note 3 Change of accounting principles<br />
New accounting principles in <strong>2010</strong><br />
<strong>The</strong> following new accounting principles are effective from January 1,<br />
<strong>2010</strong> and have been applied by the <strong>Volvo</strong> <strong>Group</strong> unless stated otherwise:<br />
Revised IFRS 3 Business combinations<br />
<strong>The</strong> standard became effective on July 1, 2009 and applies to fiscal<br />
years beginning on or after that date. <strong>The</strong> standard entails changes to<br />
the reporting of future acquisitions regarding for example the accounting<br />
of transaction costs, any contingent considerations and step<br />
acquisitions. <strong>The</strong> <strong>Group</strong> applies the amendment as of January 1,<br />
<strong>2010</strong>. <strong>The</strong> application affects the accounting for business combinations<br />
made from the application date. Capitalized transaction costs<br />
of 135 relating to ongoing acquisition projects is transferred to equity<br />
by <strong>Volvo</strong>.<br />
77
Financial information <strong>2010</strong><br />
Notes to consolidated financial statements<br />
IAS 27 amendment Consolidated and separate financial statements<br />
<strong>The</strong> standard became effective on July 1, 2009, as a consequence of<br />
the revised IFRS 3, and applies to fiscal years beginning on or after<br />
that date. <strong>The</strong> amendment brings about changes in IAS 27 regarding,<br />
for example, how to report changes in ownership in cases where the<br />
Parent Company retains or loses the control of the owned entity. <strong>The</strong><br />
<strong>Group</strong> applies the amendment as of January 1, <strong>2010</strong>. <strong>The</strong> application<br />
prospectively affects the accounting for changes in share ownership<br />
made from the application date.<br />
In addition to the above-mentioned, the below amendments to<br />
standards and new interpretations from IFRIC have been applicable<br />
for the <strong>Volvo</strong> <strong>Group</strong> from January 1, <strong>2010</strong>, but have not had a significant<br />
impact on the <strong>Group</strong>’s financial statements during the year.<br />
– IAS 39 amendment Financial instruments: Recognition and Measurement:<br />
Eligible hedge items<br />
– IFRS 1 amendments Additional exemptions for first-time adopters<br />
– IFRIC 16 Hedges of a net investment in a foreign operation<br />
– IFRIC 17 Distribution of non-cash assets to owners<br />
– IFRIC 18 Transfers of assets from customers<br />
– Revised IFRS 1 First time adoption of IFRS<br />
– IFRIC 9 and IAS 39 amendment Embedded derivatives<br />
– IFRS 2 amendment <strong>Group</strong> Cash-settled Share-based Payment<br />
Transactions<br />
– IFRS 1 amendments Limited exemption from comparative IFRS 7<br />
Disclosures for First-time Adopters<br />
– <strong>Annual</strong> improvements<br />
New accounting principles 2011 and later<br />
When preparing the consolidated accounts as of December 31, <strong>2010</strong>,<br />
a number of standards and interpretations have been published, but<br />
have not yet become effective. <strong>The</strong> following is a preliminary assessment<br />
of the effect that the implementation of these standards and<br />
statements could have on the <strong>Volvo</strong> <strong>Group</strong>’s financial statements.<br />
IFRS 9 Financial instruments*<br />
IFRS 9 Financial instruments has been published in three parts:<br />
classification and Measurement, Impairment and Hedge accounting,<br />
which will replace IAS 39 with effective date January 1, 2013 or later.<br />
Earlier adoption is permitted given endorsement. <strong>Volvo</strong> is currently<br />
reviewing the effects implementation of IFRS 9 will have on the <strong>Group</strong>.<br />
When all three parts of the project are completed a common standpoint<br />
will be given.<br />
In addition to the above-mentioned, the below amendments to<br />
standards and interpretations from IFRIC are applicable for the <strong>Volvo</strong><br />
<strong>Group</strong> from January 1, 2011 or later, but are not expected to have a<br />
significant impact on the <strong>Group</strong>’s financial statements.<br />
– IFRS 7 Amendments Financial Instruments: Disclosures<br />
– IFRIC 14 <strong>The</strong> limit on a defined benefit asset, minimum funding<br />
requirements and their interaction<br />
– IFRIC 19 Extinguishing Financial Liabilities with Equity Instruments<br />
– IFRIC 12 Service Concession Arrangements<br />
– Revised IAS 24 Related Party Disclosures<br />
– IAS 32 amendment Classification of rights issues<br />
– <strong>Annual</strong> improvements<br />
*<strong>The</strong>se standards/interpretations have not been adopted by the EU at the publication<br />
of the annual report. Accordingly, stated dates for adoption may change<br />
as a consequence of decisions within the EU endorsement process.<br />
Note 4 Acquisitions and divestments of shares in subsidiaries<br />
AB <strong>Volvo</strong>’s holding of shares in subsidiaries as of December 31, <strong>2010</strong><br />
is shown in the disclosures of AB <strong>Volvo</strong>’s holding of shares. Significant<br />
acquisitions, formations and divestments within the <strong>Group</strong> are listed<br />
below.<br />
Acquisitions<br />
<strong>The</strong> <strong>Volvo</strong> <strong>Group</strong> has not made any acquisitions during 2009 and<br />
<strong>2010</strong> which solely or jointly have had a significant impact on the <strong>Volvo</strong><br />
<strong>Group</strong>’s financial statements.<br />
Valuation of acquisitions<br />
For acquisitions in 2009 and <strong>2010</strong>, the fair-value adjustments to the<br />
purchase price allocations have not been significant for the <strong>Volvo</strong><br />
<strong>Group</strong>. <strong>The</strong> effects on the <strong>Volvo</strong> <strong>Group</strong>’s balance sheet and cash-flow<br />
statement in connection with the acquisition of subsidiaries and other<br />
business units are specified in the following table based on valuations<br />
on the respective acquisition dates:<br />
78
Acquisitions 2009 <strong>2010</strong><br />
Intangible assets 3 0<br />
Property, plant and equipment 4 32<br />
Assets under operating lease 19 468<br />
Inventories 20 56<br />
Current receivables 2 99<br />
Cash and cash equivalents 0 15<br />
Other assets 9 12<br />
Minority interests 0 20<br />
Provisions 6 (22)<br />
Loans 0 (374)<br />
Liabilities (48) (143)<br />
15 163<br />
Goodwill 41 52<br />
Acquired net assets 56 215<br />
Cash and cash equivalents paid (56) (229)<br />
Cash and cash equivalents according<br />
to acquisition analysis 0 15<br />
Effect on <strong>Group</strong> cash<br />
and cash equivalents (56) (214)<br />
Acquisitions after the end of the period<br />
<strong>Volvo</strong> has not made any acquisitions after the end of the period that<br />
have had a significant impact on the <strong>Volvo</strong> <strong>Group</strong>.<br />
Divestments<br />
<strong>The</strong> divestment of <strong>Volvo</strong> Aero’s US subsidiary, <strong>Volvo</strong> Aero Services,<br />
was completed in the beginning of October. A total of SEK 515 M has<br />
negatively affected <strong>Volvo</strong> <strong>Group</strong>’s operating result, of which SEK<br />
368 M was reported in 2009. As a consequence of the <strong>Group</strong>’s<br />
accounting principles described in note 1 the same transaction<br />
affected <strong>Volvo</strong> Aero’s operating result negatively by SEK 538 M. <strong>The</strong><br />
sale of VAS is due to <strong>Volvo</strong> Aero’s strategy of focusing on its core<br />
operations of developing and manufacturing components for aircraft<br />
engines, combined with the goal of reducing the company’s tied-up<br />
capital.<br />
In May <strong>Volvo</strong> CE sold its Russian distribution network with assets<br />
amounting to SEK 200 M, the transaction had a minor effect on <strong>Volvo</strong>’s<br />
result. In July <strong>Volvo</strong> CE sold its Turkish distribution network with assets<br />
and liabilities of SEK 232 M and SEK 36 M, respectively, classified as<br />
assets held for sale. <strong>The</strong> transaction had a positive impact on the<br />
<strong>Group</strong>’s operating income of SEK 107 M.<br />
<strong>The</strong> effects on the <strong>Volvo</strong> <strong>Group</strong>’s balance sheet and cash-flow statement<br />
in connection with the divestment of subsidiaries and other business<br />
units are specified in the following table:<br />
Divestments 2009 <strong>2010</strong><br />
Intangible assets (3) 0<br />
Property, plant and equipment (59) (32)<br />
Assets under operating lease (42) (190)<br />
Shares and participations 65 0<br />
Inventories (280) (1,096)<br />
Other receivables (112) (334)<br />
Cash and cash equivalents (116) (176)<br />
Provisions 80 (10)<br />
Other liabilities 254 540<br />
(213) (1,298)<br />
Goodwill 0 (122)<br />
Divested net assets (213) (1,420)<br />
Cash and cash equivalents received 321 1,007<br />
Cash and cash equivalents, divested companies (116) (176)<br />
Effect on <strong>Group</strong> cash and cash equivalents 205 831<br />
Assets and liabilities held for sale<br />
At the end of <strong>2010</strong> the <strong>Volvo</strong> <strong>Group</strong> reports assets amounting to 136<br />
and liabilities amounting to 135 as assets and liabilities held for sale.<br />
Depending on the progress with the sales process, changes in the<br />
business environment, access to liquidity, market outlook, etc. the fair<br />
value of remaining assets held for sale may change in the forthcoming<br />
periods or when the transactions are finalized. Reclassified assets<br />
and liabilities pertain to smaller operations. For the comparison year<br />
2009, the <strong>Volvo</strong> <strong>Group</strong> reported assets amounting to 1,692 and liabilities<br />
to 272 as assets and liabilities classified as held for sale.<br />
Assets and liabilities held for sale 2009 <strong>2010</strong><br />
Intangible assets 54 0<br />
Tangible assets 618 43<br />
Inventories 776 8<br />
Accounts receivable 109 56<br />
Other current receivables 111 24<br />
Other assets 24 5<br />
Total assets 1,692 136<br />
Trade payables 108 31<br />
Other current liabilities 164 104<br />
Total liabilities 272 135<br />
79
Financial information <strong>2010</strong><br />
Notes to consolidated financial statements<br />
Note 5 Joint ventures<br />
Joint ventures are companies over which <strong>Volvo</strong> has joint control<br />
together with one or more external parties. Joint ventures are reported<br />
by applying the proportionate consolidation method, in accordance<br />
with IAS 31 Joint ventures. <strong>Group</strong> holdings of shares in joint ventures<br />
are listed below.<br />
Dec 31, <strong>2010</strong><br />
Holding<br />
Shares in joint ventures<br />
percentage<br />
Shanghai Sunwin Bus Corp., China 50<br />
Xian Silver Bus Corp., China 50<br />
Dong Feng Nissan Diesel Motor Co., Ltd., China 50<br />
VE Commercial Vehicles, Ltd., India 50 1<br />
1 Direct and indirect ownership.<br />
<strong>Volvo</strong>’s share of joint ventures’ income<br />
statements 2009 <strong>2010</strong><br />
Net sales 3,171 4,178<br />
Operating income (12) 127<br />
Income after financial items 25 169<br />
Income taxes (9) (66)<br />
<strong>Volvo</strong>’s share of income for the period 16 103<br />
<strong>Volvo</strong>’s share of joint ventures’<br />
balance sheets<br />
Dec 31,<br />
2009<br />
Dec 31,<br />
<strong>2010</strong><br />
Non-current assets 2,019 1,932<br />
Current assets 2,141 2,206<br />
Total assets 4,160 4,138<br />
Shareholders’ equity 2,598 2,627<br />
Provisions 286 294<br />
Long-term liabilities 23 12<br />
Current liabilities 1,253 1,205<br />
Total shareholders’ equity and liabilities 4,160 4,138<br />
At the end of <strong>2010</strong> guarantees amounting to 78 (80) were issued for<br />
the benefit of joint ventures by AB <strong>Volvo</strong>. At the same date <strong>Volvo</strong>’s<br />
share of contingent liabilities issued by its joint ventures amounted to<br />
46 (29).<br />
Number of<br />
employees<br />
2009 <strong>2010</strong><br />
of which<br />
women, %<br />
Number of<br />
employees<br />
of which<br />
women, %<br />
<strong>Volvo</strong>’s share of total number of employees<br />
Shanghai Sunwin Bus Corp. 458 17 455 16<br />
Xian Silver Bus Corp. 172 17 144 21<br />
Dong Feng Nissan Diesel Motor Co., Ltd. 138 12 141 14<br />
VE Commercial Vehicles, Ltd. 1,363 2 1,479 1<br />
<strong>Volvo</strong>’s share of total number of employees 2,131 7 2,219 7<br />
Note 6 Associated companies<br />
<strong>The</strong> following table presents summarized financial information for the associated companies partly owned by <strong>Volvo</strong>. <strong>Volvo</strong> consolidates the<br />
associated companies according to the equity method. <strong>The</strong> income statement and balance sheet below reflects the total associated companies,<br />
not only the part consolidated by <strong>Volvo</strong>. For more information about <strong>Volvo</strong>’s shareholding, see notes 9 and 15.<br />
Income statement data 2009 <strong>2010</strong><br />
Net sales 4,027 3,794<br />
Cost of sales (3,991) (3,840)<br />
Financial income and expense (7) (32)<br />
Income before taxes 29 (78)<br />
Income taxes (28) (46)<br />
Income of the period 1 (124)<br />
Dec 31,<br />
2009<br />
Dec 31,<br />
<strong>2010</strong><br />
Balance sheet data<br />
Non-current assets 1,471 2,085<br />
Current assets 1,353 1,558<br />
Total assets 2,824 3,643<br />
Shareholders’ equity 1,322 1,686<br />
Provisions 59 61<br />
Long-term liabilities 57 452<br />
Current liabilities 1,386 1,444<br />
Total shareholders’ equity and liabilities 2,824 3,643<br />
80
Note 7 Segment reporting<br />
<strong>Report</strong>ing by business segment<br />
<strong>The</strong> <strong>Volvo</strong> <strong>Group</strong>’s operations are organized in nine business areas:<br />
<strong>Volvo</strong> Trucks, Renault Trucks, North American Trucks, Trucks Asia,<br />
Buses, Construction Equipment, <strong>Volvo</strong> Penta, <strong>Volvo</strong> Aero and Customer<br />
Finance. In addition to the nine business areas, there are other operations<br />
consisting mainly of business units that are designed to support<br />
the business areas’ operations. <strong>The</strong> business units include <strong>Volvo</strong><br />
Power train, <strong>Volvo</strong> 3P, <strong>Volvo</strong> IT, <strong>Volvo</strong> Logistics and <strong>Volvo</strong> Parts. As the<br />
four truck brands share product development, production and other<br />
activities in business units such as <strong>Volvo</strong> 3P and <strong>Volvo</strong> Powertrain and<br />
also share certain infrastructure in distribution such as dealers, the four<br />
truck brands are reported as one aggregated business segment. <strong>The</strong><br />
<strong>Volvo</strong> <strong>Group</strong> is thus reported divided in six segments in which net sales<br />
and operating income are reported for each product area.<br />
Each business area, except for Customer Finance, has total responsibility<br />
for its operating income, operating capital and operating cash<br />
flow. <strong>Volvo</strong> Financial Services within Customer Finance has responsibility<br />
for its net income and total balance sheet within certain restrictions<br />
and principles that are established centrally. <strong>The</strong> supervision and coordination<br />
of treasury and tax matters is organized centrally to obtain the<br />
benefits of a <strong>Group</strong>-wide approach. <strong>The</strong> legal structure of the <strong>Volvo</strong><br />
<strong>Group</strong> is based on optimal handling of treasury, tax and administrative<br />
matters and, accordingly, differs from the operating structure.<br />
<strong>The</strong> business units are designated to support the business areas and<br />
are therefore not reportable business segments. <strong>The</strong> results from the<br />
synergies created in the business units are transferred back to the various<br />
product areas. <strong>The</strong> allocation is based on the degree to which individual<br />
product areas have utilized the services of the business units. <strong>The</strong><br />
heading Other contains mainly earnings linked to corporate functions<br />
including the <strong>Group</strong>’s treasury operations. <strong>The</strong> <strong>Group</strong>’s real estate, held<br />
in <strong>Volvo</strong> <strong>Group</strong> Real Estate, is reported under industrial operations, and<br />
earnings are transferred back to the business areas.<br />
<strong>Report</strong>ed segment information is based on the information used<br />
internally by the chief operating decision maker, which in <strong>Volvo</strong> is the<br />
<strong>Volvo</strong> <strong>Group</strong> Executive Committee.<br />
Net sales 2009 <strong>2010</strong><br />
Trucks 138,940 167,305<br />
Construction Equipment 35,658 53,810<br />
Buses 18,465 20,516<br />
<strong>Volvo</strong> Penta 8,159 8,716<br />
<strong>Volvo</strong> Aero 7,803 7,708<br />
Other and eliminations (538) (680)<br />
Industrial Operations 208,487 257,375<br />
Customer Finance 11,712 9,031<br />
Reclassifications and eliminations (1,838) (1,657)<br />
<strong>Volvo</strong> <strong>Group</strong> 218,361 264,749<br />
<strong>The</strong> above sales figures include internal sales in the following amounts:<br />
Net sales to <strong>Group</strong> companies 2009 <strong>2010</strong><br />
Trucks 1,558 1,421<br />
Construction Equipment 234 347<br />
Buses 461 490<br />
<strong>Volvo</strong> Penta 87 129<br />
<strong>Volvo</strong> Aero 37 21<br />
Other and eliminations (782) (984)<br />
Industrial Operations 1,595 1,424<br />
Customer Finance 243 231<br />
Eliminations (1,838) (1,655)<br />
<strong>Volvo</strong> <strong>Group</strong> 0 0<br />
Internal sales between business areas are generally made at standard<br />
cost of sales, including calculated interest and product improvement<br />
expenses. Internal sales from service companies are generally made<br />
at market prices.<br />
Operating income 2009 <strong>2010</strong><br />
Trucks (10,805) 10,112<br />
Construction Equipment (4,005) 6,180<br />
Buses (350) 780<br />
<strong>Volvo</strong> Penta (230) 578<br />
<strong>Volvo</strong> Aero 50 286<br />
Other (994) (102)<br />
Industrial Operations (16,333) 17,834<br />
Customer Finance (680) 167<br />
<strong>Volvo</strong> <strong>Group</strong> (17,013) 18,000<br />
Depreciation and amortization 2009 <strong>2010</strong><br />
Trucks 9,618 8,721<br />
Construction Equipment 2,036 1,975<br />
Buses 555 464<br />
<strong>Volvo</strong> Penta 515 453<br />
<strong>Volvo</strong> Aero 435 436<br />
Other (777) (710)<br />
Industrial Operations 12,382 11,338<br />
Customer Finance 2,845 2,454<br />
<strong>Volvo</strong> <strong>Group</strong> total 1 15,227 13,792<br />
1 Of which write-down 33 (221).<br />
Research and development<br />
expenses 2009 <strong>2010</strong><br />
Trucks 9,525 9,230<br />
Construction Equipment 1,982 1,972<br />
Buses 918 882<br />
<strong>Volvo</strong> Penta 665 670<br />
<strong>Volvo</strong> Aero 170 156<br />
Other (67) 60<br />
<strong>Volvo</strong> <strong>Group</strong> total 13,193 12,970<br />
81
Financial information <strong>2010</strong><br />
Notes to consolidated financial statements<br />
Income from investments in<br />
associated companies 2009 <strong>2010</strong><br />
Trucks (22) 8<br />
Construction Equipment 0 0<br />
Buses 12 15<br />
<strong>Volvo</strong> Penta 0 0<br />
<strong>Volvo</strong> Aero 0 0<br />
Other (5) (109)<br />
Industrial Operations (15) (86)<br />
Customer Finance 1 0<br />
<strong>Volvo</strong> <strong>Group</strong> total (14) (86)<br />
Total assets 2009 <strong>2010</strong><br />
Operating assets, Industrial Operations 1 :<br />
Trucks 112,157 114,305<br />
Construction Equipment 40,454 43,309<br />
Buses 12,462 11,565<br />
<strong>Volvo</strong> Penta 5,444 4,870<br />
<strong>Volvo</strong> Aero 11,326 9,881<br />
Other 936 2,051<br />
Total operating assets<br />
Industrial Operations 182,779 185,981<br />
Interest-bearing financial assets 45,422 42,645<br />
Tax receivables 13,639 13,064<br />
Total assets in Customer Finance 98,772 89,246<br />
Other and eliminations (8,347) (12,929)<br />
<strong>Volvo</strong> <strong>Group</strong> total 332,265 318,007<br />
1 Defined as total assets less interest-bearing financial assets and tax<br />
receivables.<br />
Total shareholders’ equity<br />
and liabilities 2009 <strong>2010</strong><br />
Operating liabilities, Industrial Operations 1 :<br />
Trucks 62,003 69,174<br />
Construction Equipment 14,756 18,697<br />
Buses 7,572 7,762<br />
<strong>Volvo</strong> Penta 2,967 2,519<br />
<strong>Volvo</strong> Aero 4,152 3,517<br />
Other 400 1,259<br />
Total operating liabilities<br />
Industrial Operations 91,850 102,928<br />
Financial liabilities 86,911 67,335<br />
Tax liabilities 2,861 4,702<br />
Total liabilities in Customer Finance 90,223 81,226<br />
Other and eliminations (6,614) (12,305)<br />
Total liabilities 265,231 243,886<br />
Shareholders’ equity 67,034 74,121<br />
<strong>Volvo</strong> <strong>Group</strong> total 332,265 318,007<br />
1 Defined as total liabilities less shareholders’ equity, financial liabilities and<br />
tax liabilities.<br />
Investments in associated companies 2009 <strong>2010</strong><br />
Trucks 217 241<br />
Construction Equipment – –<br />
Buses 51 46<br />
<strong>Volvo</strong> Penta – –<br />
<strong>Volvo</strong> Aero 1 1<br />
Customer Finance 19 18<br />
Other 300 378<br />
<strong>Volvo</strong> <strong>Group</strong> total 588 684<br />
Capital expenditures 2009 <strong>2010</strong><br />
Trucks 7,272 7,650<br />
Construction Equipment 1,307 1,555<br />
Buses 639 343<br />
<strong>Volvo</strong> Penta 687 331<br />
<strong>Volvo</strong> Aero 533 734<br />
Other 104 30<br />
Industrial Operations 10,542 10,643<br />
Customer Finance 4,102 4,600<br />
Eliminations (71) (38)<br />
<strong>Volvo</strong> <strong>Group</strong> total 14,573 15,205<br />
<strong>Report</strong>ing by market<br />
Net sales 2009 <strong>2010</strong><br />
Europe 99,518 102,947<br />
North America 40,223 47,922<br />
South America 17,613 29,013<br />
Asia 45,273 65,487<br />
Other markets 15,734 19,380<br />
<strong>Volvo</strong> <strong>Group</strong> total* 218,361 264,749<br />
*of which:<br />
Sweden 10,412 12,463<br />
United States 31,243 35,752<br />
France 25,344 24,457<br />
Total assets 2009 <strong>2010</strong><br />
Sweden 77,528 73,806<br />
Europe excluding Sweden 105,265 86,645<br />
North America 60,223 53,683<br />
South America 20,322 23,442<br />
Asia 60,286 72,481<br />
Other markets 8,641 7,950<br />
<strong>Volvo</strong> <strong>Group</strong> total 332,265 318,007<br />
Capital expenditures 2009 <strong>2010</strong><br />
Sweden 3,924 3,323<br />
Europe excluding Sweden 6,135 6,733<br />
North America 2,622 2,039<br />
South America 97 292<br />
Asia 1,574 2,707<br />
Other markets 221 111<br />
<strong>Volvo</strong> <strong>Group</strong> total 14,573 15,205<br />
82
Note 8 Other operating income and expenses<br />
2009 <strong>2010</strong><br />
Gains/losses on divestment of <strong>Group</strong> companies 108 (34)<br />
Write down of assets held for sale (368) (65)<br />
Change in allowances and write-offs for doubtful receivables, customer financing (2,327) (1,438)<br />
Change in allowances and write-offs for doubtful receivables, other (692) 112<br />
Damages and litigations (71) (57)<br />
Restructuring cost (635) 11<br />
<strong>Volvo</strong> profit sharing program (9) (360)<br />
Other income and expenses (804) (192)<br />
Total (4,798) (2,023)<br />
Note 9 Income from investments in<br />
associated companies<br />
Income/loss 2009 <strong>2010</strong><br />
UD Trucks Niigata Co (1) 7<br />
JV Fonderie Venissieux 3 (1)<br />
Merkavim Metal Works Ltd 12 15<br />
Blue Chip Jet I & II HB (3) (39)<br />
Holdings of <strong>Volvo</strong> Technology Transfer 1 (1) (58)<br />
Other companies 2 1<br />
Subtotal 12 (75)<br />
Revaluation and write-down of shares<br />
Thomas Hardie Commercials Ltd (11) –<br />
Blue Chip Jet I & II HB – (11)<br />
Other companies (2) –<br />
Subtotal (13) (11)<br />
Gains (losses) on divestment of<br />
shares in associated companies<br />
UD Trucks Niigata Co (13) –<br />
Subtotal (13) –<br />
Total income (loss) from investments<br />
in associated companies (14) (86)<br />
Note 10 Income from other investments<br />
Dividends received 2009 <strong>2010</strong><br />
Deutz AG 2 2<br />
Holdings of UD Trucks 9 14<br />
Other 11 7<br />
Subtotal 22 23<br />
Write-downs of shares<br />
Holdings of <strong>Volvo</strong> Technology Transfer 1 (36) (107)<br />
Other – (1)<br />
Subtotal 2 (36) (108)<br />
Gain on divestment of shares<br />
Holdings of <strong>Volvo</strong> Technology Transfer 1 8 10<br />
Holdings of UD Trucks – 24<br />
Other – (7)<br />
Subtotal 8 27<br />
Total (6) (58)<br />
1 Investments held by the <strong>Volvo</strong> venture-capital company.<br />
2 Write-downs of shares refer entirely to financial assets available for sale for<br />
which a market value can not be calculated..<br />
1 Investments held by the <strong>Volvo</strong> venture-capital company.<br />
Note 11 Other financial income and expenses<br />
SEK M 2009 <strong>2010</strong><br />
Financial instruments at fair value through profit or loss (90) 871<br />
Exchange rate gains and losses on financial assets and liabilities 1 (174) (351)<br />
Financial income and expenses related to taxes 140 (20)<br />
Costs for Treasury function, credit facilities, etc (268) (287)<br />
Total (392) 213<br />
1 In exchange rate gains and losses on financial assets and liabilities the devaluation effect in Venezuela is included with neg 274.<br />
For further information regarding financial instruments please see note 37.<br />
83
Financial information <strong>2010</strong><br />
Notes to consolidated financial statements<br />
Note 12 Income taxes<br />
Income taxes were distributed as follows:<br />
2009 <strong>2010</strong><br />
Current taxes relating to the period (989) (3,668)<br />
Adjustment of current taxes<br />
for prior periods (73) 180<br />
Deferred taxes originated or<br />
reversed during the period 6,981 (747)<br />
Recognition and derecognition<br />
of deferred tax assets (30) (67)<br />
Total income taxes 5,889 (4,302)<br />
Provisions have been made for estimated tax charges that may arise<br />
as a result of prior tax audits in the <strong>Volvo</strong> <strong>Group</strong>. <strong>Volvo</strong> evaluates tax<br />
processes on a regular basis and makes provisions for possible outcome<br />
when it is probable that <strong>Volvo</strong> will have to pay more taxes and<br />
when it is possible to make a reasonably assessment of the possible<br />
outcome. Tax claims for which no provision has been deemed necessary<br />
were reported as contingent liabilities.<br />
Deferred taxes relate to income taxes payable or recoverable in<br />
future periods in respect of taxable temporary differences, deductible<br />
temporary differences, unused tax-loss carryforwards or unused tax<br />
credit carryforwards. Deferred tax assets are recognized to the extent<br />
that it is probable that the amount can be utilized against future taxable<br />
income. At December 31, <strong>2010</strong>, the valuation allowance attributable<br />
to deductible temporary differences, unused tax-loss carry forwards<br />
and unused tax credit carryforwards for which no deferred tax<br />
asset was recognized amounted to 339 (296). <strong>The</strong> major part of the<br />
reserve consists of unused loss carryforwards.<br />
Deferred taxes amounting to 93 (neg: 816) have been reported in<br />
other comprehensive income, attributable to fair value of derivative<br />
instruments.<br />
At year-end <strong>2010</strong>, the <strong>Group</strong> had unused tax-loss carryforwards<br />
amounting to 25,000 (30,200). <strong>The</strong>se loss carryforwards expire<br />
according to the table below:<br />
Due date 2009 <strong>2010</strong><br />
2011 300 100<br />
2012 100 100<br />
2013 100 200<br />
2014 400 400<br />
2015 800 800<br />
2016– 28,500 23,400<br />
Total 30,200 25,000<br />
<strong>The</strong> Swedish corporate income tax rate is 26.3%. <strong>The</strong> table below<br />
shows the principal reasons for the difference between this rate and<br />
the <strong>Group</strong>'s tax rate, based on income after financial items.<br />
2009, % <strong>2010</strong>, %<br />
Swedish corporate income tax rates 26 26<br />
Difference in tax rate in various countries 2 4<br />
Capital gains 0 0<br />
Other non-taxable income 0 (3)<br />
Other non-deductible expenses 0 1<br />
Adjustment of current taxes for prior years 1 (1)<br />
Recognition and derecognition<br />
of deferred tax assets 1 1<br />
Other, net (1) 0<br />
Income tax rate for the <strong>Group</strong> 29 28<br />
84
Specification of deferred tax assets<br />
and tax liabilities 2009 <strong>2010</strong><br />
Deferred tax assets:<br />
Unused tax-loss carryforwards 8,939 7,327<br />
Other unused tax credits 85 121<br />
Intercompany profit in inventories 459 711<br />
Allowance for inventory obsolescence 860 439<br />
Valuation allowance for doubtful receivables 702 587<br />
Provisions for warranties 1,071 1,722<br />
Provisions for residual value risks 387 306<br />
Provisions for<br />
post-employment benefits 2,066 2,068<br />
Provisions for restructuring measures 169 61<br />
Adjustment to fair value at company<br />
acquisitions 0 12<br />
Fair value of derivative instruments 240 45<br />
Land 2,377 2,455<br />
Other deductible temporary differences 4,474 4,594<br />
Deferred tax assets before<br />
deduction for valuation allowance 21,829 20,448<br />
Valuation allowance (296) (339)<br />
Deferred tax assets after<br />
deduction for valuation allowance 21,533 20,109<br />
Netting of deferred tax assets/liabilities (8,938) (7,799)<br />
Deferred tax assets, net 12,595 12,310<br />
<strong>The</strong> significant tax-loss carryforwards are related to countries with long<br />
or indefinite periods of utilization, mainly Sweden and France. Of the<br />
total deferred tax asset for loss carryforwards 7,327 (8,939), an amount<br />
of 3,665 (4,653) in income (loss) for the period and in equity relates to<br />
Sweden with indefinite time of utilization. <strong>Volvo</strong> considers it most probable<br />
that the <strong>Volvo</strong> <strong>Group</strong> will be able to generate sufficient income in<br />
the coming years to utilize the tax loss carryforwards. See note 2.<br />
2009 <strong>2010</strong><br />
Deferred tax liabilities:<br />
Accelerated depreciation on property,<br />
plant and equipment 4,046 4,094<br />
Accelerated depreciation on leasing<br />
assets 2,073 2,111<br />
LIFO valuation of inventories 228 224<br />
Capitalized product and<br />
software development 3,724 3,597<br />
Untaxed reserves 98 97<br />
Fair value of derivative instruments 67 20<br />
Other taxable temporary differences 2,340 2,178<br />
Deferred tax liabilities 12,576 12,321<br />
Netting of deferred tax assets/liabilities (8,938) (7,799)<br />
Deferred tax liabilities, net 3,638 4,522<br />
Deferred tax assets/liabilities, net 1 8,957 7,788<br />
1 Deferred taxes are partially recognized in the balance sheet on a net basis<br />
after taking into account offsetting possibilities. Changes in tax rates during<br />
<strong>2010</strong> and 2011 have been considered when measuring deferred tax assets<br />
and deferred tax liabilities and have affected the income tax cost of the<br />
year. Deferred tax assets and liabilities have been measured to the tax rates<br />
that are expected to apply to the period when the asset is realized or the<br />
liability is settled.<br />
<strong>The</strong> cumulative amount of undistributed earnings in foreign subsidiaries,<br />
which <strong>Volvo</strong> currently intends to indefinitely reinvest outside of<br />
Sweden and upon which deferred income taxes have not been provided<br />
is approximately SEK 47 billion (40) at year end. <strong>The</strong>re are different<br />
taxation rules depending on country. In some countries dividends are<br />
not taxable and in some countries there are withholding taxes. See note<br />
36 about how <strong>Volvo</strong> handles equity currency risk.<br />
Note 13 Minority interests<br />
Minority interests in income (loss) for the period and in shareholders' equity consisted mainly of the minority interests in <strong>Volvo</strong> Aero Norge A/S<br />
(22%), in Berliet Maroc S.A (30%), in Shandong Lingong Construction Machinery Co, Ltd (30%) as well as in UD Trucks South Africa (Pty)<br />
Ltd (20%).<br />
Note 14 Intangible and tangible assets<br />
Intangible assets, acquisition costs Goodwill 1 programs<br />
Entrance<br />
fees, industrial<br />
Product and<br />
software<br />
development<br />
Other<br />
intangible<br />
assets 2<br />
Total<br />
intangible<br />
assets<br />
Value in balance sheet 2009 23,827 3,833 25,148 6,719 59,527<br />
Capital expenditures 3 – 15 3,255 54 3,324<br />
Sales/scrapping – 0 (156) (79) (235)<br />
Acquired and divested operations (70) 0 0 0 (70)<br />
Translation differences (847) (49) (400) 138 (1,158)<br />
Reclassifications and other 26 1 4 57 88<br />
Value in balance sheet <strong>2010</strong> 22,936 3,800 27,851 6,889 61,476<br />
85
Financial information <strong>2010</strong><br />
Notes to consolidated financial statements<br />
Entrance<br />
fees, industrial<br />
programs<br />
Product and<br />
software<br />
development<br />
Other<br />
intangible<br />
assets<br />
Total<br />
intangible<br />
assets<br />
Accumulated depreciation and amortization<br />
Goodwill<br />
Value in balance sheet 2009 – 1,762 13,739 2,398 17,899<br />
Depreciation and amortization 6 – 59 2,857 389 3,305<br />
Sales/scrapping – 0 (45) (78) (123)<br />
Acquired and divested operations – 0 0 0 0<br />
Translation differences – (1) (285) (84) (370)<br />
Reclassifications and other – 0 5 46 51<br />
Value in balance sheet <strong>2010</strong> – 1,820 16,271 2,671 20,762<br />
Net carrying value in balance sheet 2009 4 23,827 2,071 11,409 4,321 41,628<br />
Net carrying value in balance sheet <strong>2010</strong> 4 22,936 1,980 11,580 4,218 40,714<br />
Construction<br />
in progress,<br />
including<br />
advance<br />
payments<br />
Total<br />
investment<br />
property,<br />
property,<br />
plant and<br />
equipment<br />
Assets under<br />
operating<br />
leases<br />
Total<br />
tangible<br />
assets<br />
Tangible assets,<br />
acquisition costs<br />
Buildings<br />
Land and land<br />
improvements<br />
Machinery<br />
and equipment 5<br />
Value in balance sheet 2009 31,859 12,641 68,851 4,578 117,929 31,993 149,922<br />
Capital expenditures 3 617 119 3,806 2,446 6,988 4,893 11,881<br />
Sales/scrapping (472) (105) (1,730) (7) (2,314) (5,459) (7,773)<br />
Acquired and divested operations 0 0 0 0 0 223 223<br />
Translation differences (912) 50 (1,308) (148) (2,318) (2,843) (5,161)<br />
Reclassifications and other 466 (138) 895 (1,160) 63 288 351<br />
Value in balance sheet <strong>2010</strong> 31,558 12,567 70,514 5,709 120,348 29,095 149,443<br />
Construction<br />
in progress,<br />
including<br />
advance<br />
payments<br />
Total<br />
investment<br />
property,<br />
property,<br />
plant and<br />
equipment<br />
Assets under<br />
operating<br />
leases<br />
Total<br />
tangible<br />
assets<br />
Accumulated depreciation<br />
and amortization<br />
Buildings<br />
Land and land<br />
improvements<br />
Machinery<br />
and equipment 5<br />
Value in balance sheet 2009 14,780 1,042 46,827 – 62,649 11,605 74,254<br />
Depreciation and amortization 6 1,207 98 4,772 – 6,077 4,410 10,487<br />
Sales/scrapping (224) (22) (1,549) – (1,795) (3,082) (4,877)<br />
Acquired and divested operations 0 0 0 – 0 (55) (55)<br />
Translation differences (192) (20) (691) – (903) (1,142) (2,045)<br />
Reclassifications and other (4) (32) 114 – 78 (2,288) (2,210)<br />
Value in balance sheet <strong>2010</strong> 15,567 1,066 49,473 – 66,106 9,448 75,554<br />
Net carrying value in balance<br />
sheet 2009 4 17,079 11,599 22,024 4,578 55,280 20,388 75,668<br />
Net carrying value in balance<br />
sheet <strong>2010</strong> 4, 7 15,991 11,501 21,041 5,709 54,242 19,647 73,889<br />
1 Includes on the date of IFRS adoption, acquisition costs of 14,184 and<br />
accumulated amortization of 3,863.<br />
2 Other intangible assets mainly consist of trademarks and distribution<br />
networks.<br />
3 Includes capitalized borrowing costs of 92 (73).<br />
4 Acquisition costs less accumulated depreciation, amortization and<br />
write-downs.<br />
5 Machinery and equipment pertains mainly to production equipment.<br />
6 Of which write-down 33 (221).<br />
7 Of which, investment property 948 and property, plant and equipment<br />
53,294.<br />
Reclassifications and other mainly consist of assets under operating<br />
leases related to legal sales transactions, where revenue is deferred<br />
and accounted for as operating lease revenue. Assets classified as<br />
inventory will, when the operating lease model is applied for revenue<br />
recognition, be reclassified from inventory to assets under operating<br />
leases, when the legal sales transaction occurs. If the product is<br />
returned after the lease period, there will again be a reclassification<br />
from assets under operating leases to inventory. When a buy-back<br />
agreement has expired, but the related product is not returned, the<br />
acquisition cost and the accumulated depreciation are reversed in<br />
reclassification and other, within the line item assets under operating<br />
leases. Some of the reclassifications within tangible assets relate to<br />
construction in progress, which are reclassified to the respective category<br />
within property, plant and equipment.<br />
86
Depreciation and<br />
amortization by type of asset 2009 <strong>2010</strong><br />
Intangible assets 3,589 3,305<br />
Property, plant and equipment 6,562 6,077<br />
Assets under operating leases 5,076 4,410<br />
Total 15,227 13,792<br />
Capital expenditures by type of asset 2009 <strong>2010</strong><br />
Intangible assets 2,935 3,324<br />
Property, plant and equipment 7,392 6,988<br />
Assets under operating leases 4,246 4,893<br />
Total 14,573 15,205<br />
Goodwill<br />
<strong>Volvo</strong> verifies annually, or more frequently if necessary, the value of its<br />
operations to ensure that they do not fall below the carrying value. If<br />
impairment is detected, the carrying value, in the first place goodwill,<br />
has to be written down. <strong>Volvo</strong>’s evaluation model is based on a discounted<br />
cash-flow model, with a forecast period of four to seven<br />
years. Evaluation is made on cash-generating units, identified as <strong>Volvo</strong>’s<br />
business areas.<br />
Goodwill assets are allocated to these cash-generating units on<br />
the basis of anticipated future utility. <strong>The</strong> evaluation is based on management’s<br />
best estimation of the operations’ development. <strong>The</strong> basis<br />
for this estimation is long-term forecasts of the market’s growth, two<br />
to four percent, in relation to the development of <strong>Volvo</strong>’s operations. In<br />
the model, <strong>Volvo</strong> is expected to maintain stable capital efficiency over<br />
time. <strong>The</strong> evaluation is made on nominal values and a general rate of<br />
inflation in line with the European target is used. <strong>Volvo</strong> uses a discounting<br />
factor calculated to 12% (12) before tax for <strong>2010</strong>.<br />
During <strong>2010</strong>, the value of <strong>Volvo</strong>’s operations has exceeded the<br />
carry ing value of goodwill for all business areas, and accordingly, no<br />
impairment has been recognized. <strong>Volvo</strong> has also evaluated whether<br />
there still is an overvalue with reasonable changed assumptions,<br />
negatively adjusted with one percentage point, where of no adjustment,<br />
individually, would have such a big effect that there would be an<br />
impairment.<br />
Since the overvalue differs between the business areas they are to<br />
a varying degree sensitive to changes in the assumptions described<br />
above. <strong>Volvo</strong> therefore continuously follows the development of the<br />
business areas whose overvalue is dependent on the fulfilment of<br />
<strong>Volvo</strong>’s assessments. Instability in the business recovery and volatility<br />
in interest and currency rates may lead to indications of impairment.<br />
<strong>The</strong> most important factors for the future operations of <strong>Volvo</strong> are<br />
described in the <strong>Volvo</strong> business area section, as well as in the Risk<br />
management section.<br />
Goodwill per Business Area 2009 <strong>2010</strong><br />
<strong>Volvo</strong> Trucks 3,905 3,913<br />
Renault Trucks 2,580 2,249<br />
Trucks Asia 5,752 6,041<br />
North American Trucks 1,387 1,334<br />
Construction Equipment 8,607 7,806<br />
Buses 1,178 1,174<br />
Other business areas 418 419<br />
Total goodwill value 23,827 22,936<br />
Investment property<br />
Investment property is property owned for the purpose of obtaining<br />
rental income and/or appreciation in value. <strong>The</strong> acquisition cost of<br />
investment property was 1,692 (1,681) at year-end. Capital expenditures<br />
during <strong>2010</strong> amounted to 11 (87). Accumulated depreciation<br />
was 744 (690) at year-end, of which 55 (54) during <strong>2010</strong>. <strong>The</strong> estimated<br />
fair value of investment property was SEK 1.8 billion (2.5) at<br />
year-end, based on the yield. <strong>The</strong> required return is based on current<br />
property market conditions for comparable properties in comparable<br />
locations. 89% of the investment properties were leased out during<br />
the year (93). Net income for the year was affected by 223 (268) in<br />
rental income from investment properties and 63 (45) in direct costs.<br />
87
Financial information <strong>2010</strong><br />
Notes to consolidated financial statements<br />
Note 15 Shares and participations<br />
<strong>Group</strong> holdings of shares and<br />
participations in non-<strong>Group</strong> companies<br />
Registration<br />
number<br />
Percentage<br />
holding<br />
Dec 31, 2009<br />
Carrying value<br />
Dec 31, <strong>2010</strong><br />
Carrying value<br />
Shares in associated companies, equity method of accounting<br />
Blue Chip Jet II HB, Sweden 969717-2105 50 284 319<br />
UD Trucks Doto Corporation, Japan – 38 83 94<br />
UD Trucks Niigata Corporation, Japan – 34 54 61<br />
Merkavim Metal Works Ltd, Israel – 27 41 37<br />
JV Fonderie Venissieux, France – 49 38 32<br />
PK-UD Axle Co.,Ltd. (HangZhou), China – 45 18 30<br />
Diamond Finance Ltd, Great Britain – 40 19 18<br />
Blue Chip Jet HB, Sweden 969639-1011 45 17 3<br />
Quingdao Sunwin Bus Corp, China – 43 9 9<br />
Arabian Vehicle & Truck Industry Ltd, Saudi Arabia – 25 9 9<br />
Effpower AB, Sverige 556570-8541 34 – 29<br />
Powercell Sweden AB, Sweden 556759-8353 47 – 27<br />
Other holdings – – 16 16<br />
Total shares and participations in associated companies 1 588 684<br />
Shares and participations in other companies<br />
Deutz AG, Germany – 7 286 458<br />
Nippon Express Co.,Ltd., Japan – – 128 131<br />
Nishi-Nippon Railroad Co Ltd, Japan – – 47 –<br />
Sankyu Inc., Japan – 1 64 53<br />
Iron Planet.com Inc., USA – 4 34 34<br />
TBK Co.,Ltd., Japan – 7 26 68<br />
Vantage Equipment. LLC, USA – 46 18 15<br />
Scott Van Keppel, USA – 40 14 14<br />
Other holdings – – 839 641<br />
Total shares and participations in other companies 1 1,456 1,414<br />
Total value of <strong>Group</strong> holdings of shares and participations in<br />
non-<strong>Group</strong> companies 2,044 2,098<br />
1 <strong>Volvo</strong>’s share of shareholders' equity in associated companies (incl. equity in untaxed reserves) amounted to 684 (588).<br />
<strong>The</strong> carrying values of <strong>Volvo</strong>'s holdings of shares and participations in listed companies as of December 31, <strong>2010</strong> are shown in the table below.<br />
<strong>The</strong> carrying value is equal to the market value for holdings in listed companies.<br />
Carrying value<br />
Deutz AG, Germany 458<br />
Nippon Express Co.,Ltd., Japan 131<br />
TBK Co.,Ltd., Japan 68<br />
Sankyu Inc., Japan 53<br />
Fukuyama Transporting Co.,Ltd., Japan 15<br />
Senko Co.,Ltd, Japan 30<br />
Tonami Holdings Co.,Ltd., Japan 14<br />
Yamato Holdings Co.,Ltd., Japan 21<br />
Holdings in other listed companies 46<br />
Total holdings in listed other companies 836<br />
Holdings in non-listed companies 1 578<br />
Total shares and participations in other companies 1,414<br />
1 Unlisted shares, for which a reliable fair value cannot be determined, are<br />
reported at the acquisition value reduced in appropriate cases by write-downs.<br />
88
Changes in the <strong>Volvo</strong> <strong>Group</strong>’s holdings of shares and participations: 2009 <strong>2010</strong><br />
Balance sheet, December 31, preceding year 1,953 2,044<br />
Change in <strong>Group</strong> structure (15) –<br />
Acquisitions and divestments, net 45 104<br />
Write-downs (48) (119)<br />
Capital contribution 2 31<br />
Share of income in associated companies 12 (75)<br />
Revaluation of shares to fair value 92 148<br />
Translation differences (74) 22<br />
Dividends (21) (1)<br />
Revaluation of holdings of <strong>Volvo</strong> Technology Transfer 80 –<br />
Reclassifications – (42)<br />
Other 18 (14)<br />
Balance sheet, December 31 2,044 2,098<br />
Note 16 Non-current customer-financing receivables<br />
2009 <strong>2010</strong><br />
Installment credits 18,517 15,673<br />
Financial leasing 20,478 19,620<br />
Other receivables 718 732<br />
Total 39,713 36,025<br />
Effective interest rate for non-current customer-financing receivables<br />
was 6.54% as per December 31, <strong>2010</strong>.<br />
During <strong>2010</strong> SEK 4.1 billion, of which SEK 2.6 billion of the noncurrent<br />
customer-financing receivables, in Brazil were sold as a risk<br />
mitigation measure and to release capital for reinvestment in the<br />
country.<br />
Non-current customer-financing receivables maturities<br />
2012 16,814<br />
2013 11,668<br />
2014 4,929<br />
2015 2,120<br />
2016 or later 494<br />
Total 36,025<br />
See notes 36 and 37 for financial instruments and goals and policies<br />
in financial risk management.<br />
Note 17 Non-current receivables<br />
2009 <strong>2010</strong><br />
Other interest-bearing loans to external parties 287 204<br />
Other interest-bearing financial receivables 298 562<br />
Other financial receivables 1,425 1,741<br />
Other receivables 1,613 1,676<br />
Total 3,623 4,184<br />
See notes 36 and 37 for financial instruments and goals and policies in financial risk management.<br />
89
Financial information <strong>2010</strong><br />
Notes to consolidated financial statements<br />
Note 18 Inventories<br />
2009 <strong>2010</strong><br />
Finished products 23,612 24,572<br />
Production materials, etc. 14,115 15,265<br />
Total 37,727 39,837<br />
Inventories recognized as cost of sale during the period amounted to 170,723 (153,014).<br />
Increase (decrease) in allowance for inventory obsolescence 2009 <strong>2010</strong><br />
Balance sheet, December 31, preceding year 3,522 4,101<br />
Increase in allowance for inventory obsolescence charged to income 1,045 (79)<br />
Scrapping (399) (439)<br />
Translation differences (79) (191)<br />
Reclassifications, etc. 12 (10)<br />
Balance sheet, December 31 4,101 3,382<br />
Note 19 Current customer-financing receivables<br />
2009 <strong>2010</strong><br />
Installment credits 15,070 11,988<br />
Financial leasing 13,589 10,860<br />
Dealer financing 12,435 12,598<br />
Other receivables 1,170 1,217<br />
Total 42,264 36,663<br />
Effective interest rate for short-term customer-financing receivables<br />
was 6.38% as per December 31, <strong>2010</strong>.<br />
During <strong>2010</strong> SEK 4.1 billion, of which SEK 1.5 billion of the current<br />
customer-financing receivables, in Brazil were sold as a risk mitigation<br />
measure and to release capital for reinvestment in the country.<br />
See notes 36 and 37 for financial instruments and goals and<br />
po licies in financial risk management.<br />
Note 20 Current receivables<br />
2009 <strong>2010</strong><br />
Loans to external parties 7 11<br />
Other interest-bearing financial receivables 403 331<br />
Accounts receivable 21,337 24,433<br />
Prepaid expenses and accrued income 3,027 3,043<br />
VAT receivables 2,237 2,662<br />
Other financial receivables 1 2,195 1,715<br />
Other receivables 4,623 4,436<br />
Total, after deduction of valuation allowances for doubtful accounts receivable 33,829 36,633<br />
1 Fair value financial derivatives.<br />
90
Change of valuation allowances for doubtful accounts receivable 2009 <strong>2010</strong><br />
Balance sheet, December 31, preceding year 1,749 1,301<br />
New valuation allowance charged to income 638 187<br />
Reversal of valuation allowance charged to income (274) (609)<br />
Utilization of valuation allowance related to actual losses (664) (86)<br />
Acquired and divested operations (7) (1)<br />
Translation differences (88) (44)<br />
Reclassifications, etc. (53) (28)<br />
Balance sheet, December 31 1,301 721<br />
See notes 36 and 37 for financial instruments and goals and policies in financial risk management.<br />
Note 21Marketable securities<br />
Marketable securities consist mainly of interest-bearing securities, distributed as shown below:<br />
2009 <strong>2010</strong><br />
Government securities 147 146<br />
Banks and financial institutions 3,387 3,527<br />
Real estate financial institutions 13,142 6,094<br />
Total 16,676 9,767<br />
Note 22 Cash and cash equivalents<br />
2009 <strong>2010</strong><br />
Cash in banks 13,540 16,858<br />
Bank certificates 1 2,999 2,286<br />
Time deposits in banks 4,695 3,822<br />
Total 21,234 22,966<br />
1 Bank certificates which matures within three months from acquisition.<br />
Cash and cash equivalents at December 31, <strong>2010</strong>, include SEK 0.7<br />
billion (1.2) restricted for use by the <strong>Volvo</strong> <strong>Group</strong> and SEK 7.4 billion<br />
(5.3) that are liquid funds in countries where exchange controls or<br />
other legal restrictions apply.<br />
Note 23 Shareholders’ equity<br />
<strong>The</strong> share capital of the Parent Company is divided into two series of<br />
shares, A and B. Both series carry the same rights, except that each<br />
Series A share carries the right to one vote and each Series B share carries<br />
the right to one tenth of a vote. <strong>The</strong> shares quota value is SEK 1.20.<br />
Cash dividend decided by the <strong>Annual</strong> General Meeting <strong>2010</strong> was SEK<br />
0.00 (2.00) per share or total of SEK 0.0 million (4,054.8).<br />
Unrestricted equity in the Parent Company at December 31, <strong>2010</strong><br />
amounted to SEK 31,962 million (21,462).<br />
<strong>The</strong> cumulative amount of the exchange difference deferred to equity<br />
relating to assets held for sale amount to positive SEK 3 million (60).<br />
91
Financial information <strong>2010</strong><br />
Notes to consolidated financial statements<br />
Information regarding number of shares 2009 <strong>2010</strong><br />
Own Series A shares 20,728,135 20,728,135<br />
Own Series B shares 80,265,060 80,265,060<br />
Total own shares 100,993,195 100,993,195<br />
Own shares in % of total registered shares 4.74 4.74<br />
Outstanding Series A shares 656,873,495 656,873,495<br />
Outstanding Series B shares 1,370,553,530 1,370,553,530<br />
Total outstanding shares 2,027,427,025 2,027,427,025<br />
Total registered Series A shares 677,601,630 677,601,630<br />
Total registered Series B shares 1,450,818,590 1,450,818,590<br />
Total registered shares 2,128,420,220 2,128,420,220<br />
Average number of outstanding shares 2,027,419,396 2,027,419,396<br />
Change in other reserves (SEK M)<br />
Hedge reserve<br />
Available- forsale<br />
reserve<br />
Total<br />
Balance at January 1, <strong>2010</strong> 243 (120) 123<br />
Change in fair value of contracts hedging currency risks 3 – 3<br />
Tax on change in fair value of contracts hedging currency risks (1) – (1)<br />
Transfers to income (354) – (354)<br />
Tax on transfers to income statement 93 – 93<br />
Change in fair value of commodity contracts 103 – 103<br />
Fair value adjustments regarding holding in Deutz – 172 172<br />
Fair value adjustments regarding shares held by UD Trucks – (14) (14)<br />
Fair value adjustments regarding holding in Vindic AB – (10) (10)<br />
Balance at December 31, <strong>2010</strong> 87 28 115<br />
Earnings per share<br />
Earnings per share are calculated as income for the period, attributable<br />
to the Parent Company's shareholders, divided by the Parent<br />
Company’s average number of shares outstanding for the fiscal year.<br />
Diluted earnings per share is calculated as income for the period<br />
attributable to the Parent Company’s shareholders divided by the<br />
average number of shares outstanding plus the average number of<br />
shares that would be issued as an effect of ongoing share-based<br />
incentive programs. If during the year there were potential shares<br />
redeemed or expired during the period, these are also included in the<br />
average number of shares used to calculate the earnings per share<br />
after dilution.<br />
<strong>The</strong> share-based incentive program creates a dilution effect when<br />
the non-market-based financial goals are achieved for the fiscal year.<br />
<strong>The</strong> requirement for 2009 was not met. For <strong>2010</strong> AB <strong>Volvo</strong> had no<br />
share-based incentive program. No other transactions have occured<br />
that affected, or will have an effect on, the compilation of the reported<br />
share capital.<br />
2009 <strong>2010</strong><br />
Number of shares, December 31, in millions 2,027 2,027<br />
Average number of shares<br />
before dilution in millions 2,027 2,027<br />
Average number of shares after<br />
dilution in millions 2,027 2,027<br />
Average share price, SEK 53.65 85.75<br />
Net income attributable to<br />
Parent Company shareholders (14,718) 10,866<br />
Basic earnings per share, SEK (7.26) 5.36<br />
Diluted earnings per share, SEK (7.26) 5.36<br />
92
Note 24 Provisions for post-employment benefits<br />
Post-employment benefits, such as pensions, healthcare and other<br />
benefits are mainly settled by means of regular payments to independent<br />
authorities or bodies that assume pension obligations and<br />
administer pensions through defined-contribution plans. <strong>The</strong> remaining<br />
post-employment benefits are defined-benefit plans; that is, the obligations<br />
remain within the <strong>Volvo</strong> <strong>Group</strong> or are secured by own pension<br />
foundations. Costs and the obligations at the end of the period for<br />
defined-benefit plans are calculated based on actuarial assumptions<br />
and measured on a discounted basis. <strong>The</strong> <strong>Volvo</strong> <strong>Group</strong> defined-benefit<br />
plans relate mainly to subsidiaries in the U.S. and comprise both<br />
pensions and other benefits, such as healthcare. Other large-scale<br />
defined-benefit plans apply for salaried employees in Sweden (mainly<br />
through the Swedish ITP pension plan) and employees in France and<br />
Great Britain. See note 1 for further information about the accounting<br />
principles.<br />
<strong>The</strong> following tables disclose information about defined-benefit<br />
plans in the <strong>Volvo</strong> <strong>Group</strong>. <strong>Volvo</strong> reports the difference between the<br />
obligations and the plan assets adjusted for unrecognized actuarial<br />
gains and losses in the balance sheet. <strong>The</strong> information refers to<br />
assumptions applied for actuarial calculations, periodical costs and<br />
the value of obligations and plan assets at year-end. <strong>The</strong> tables also<br />
include reconciliation of obligations and plan assets during the year<br />
and the difference between fair values and carrying amounts reported<br />
on the balance sheet date.<br />
Summary of provision for<br />
post-employment benefits 2009 <strong>2010</strong><br />
Obligations 38,070 36,121<br />
Fair value of plan assets 22,610 22,954<br />
Funded status (15,460) (13,167)<br />
Unrecognized actuarial (gains)<br />
and losses 9,155 6,995<br />
Unrecognized past service costs 303 310<br />
Net provisions for postemployment<br />
benefits (6,002) (5,862)<br />
Assumptions applied for<br />
actuarial calculations, %<br />
December 31,<br />
2009<br />
December 31,<br />
<strong>2010</strong><br />
Sweden<br />
Discount rate 1 4.00 4.75<br />
Expected return on plan assets 2 6.00 6.00<br />
Expected salary increases 3.00 3.00<br />
Inflation 1.50 1.50<br />
United States<br />
Discount rate 1, 3 4.00–5.75 3.25–5.50<br />
Expected return on plan assets 2 7.65 7.65<br />
Expected salary increases 3.00 3.00<br />
Inflation 2.00 2.00<br />
France<br />
Discount rate 1 4.50 4.50<br />
Expected salary increases 1.00–3.00 1.00-3.00<br />
Inflation 1.50 1.50<br />
Great Britain<br />
Discount rate 1 5.50 5.40-5.50<br />
Expected return on plan assets 2 5.00–6.30 5.00<br />
Expected salary increases 3.50 3.70–3.85<br />
Inflation 3.00 3.20<br />
1 <strong>The</strong> discount rate for each country is determined by reference to market<br />
yields on high-quality corporate bonds. In countries where there is no deep<br />
market in such bonds, the market yields on government bonds are used. <strong>The</strong><br />
discount rate for the Swedish pension obligation <strong>2010</strong> is determined by reference<br />
to mortgage bonds.<br />
2 Applicable for the following accounting period. <strong>The</strong>se assumptions reflect<br />
the expected long-term return rate on plan assets, based upon historical<br />
yield rates for different categories of investments and weighted in accordance<br />
with the foundation's investment policy. <strong>The</strong> expected return has been<br />
calculated net of administrative expenses and applicable taxes.<br />
3 For all plans except one the discont rate used is within the range 4.75–5.50%<br />
(5.00–5.75).<br />
93
Financial information <strong>2010</strong><br />
Notes to consolidated financial statements<br />
Pension costs 2009 <strong>2010</strong><br />
Current year service costs 969 896<br />
Interest costs 1,684 1,510<br />
Expected return on plan assets (1,362) (1,402)<br />
Actuarial gains and losses 1 504 420<br />
Past service costs<br />
– Unvested 18 19<br />
– Vested (314) 28<br />
of which effect of agreement with UAW in Mack Trucks (317) –<br />
Curtailments and settlements 36 (38)<br />
Termination benefits 40 34<br />
Pension costs for the period, defined-benefit plans 1,575 1,467<br />
Pension costs for defined-contribution plans 3,116 3,273<br />
Total pension costs for the period 4,691 4,740<br />
1 For each plan, actuarial gains and losses are reported as income or expenses, when the accumulated amount exceeds the so called corridor. <strong>The</strong> income or<br />
expenses are then recognized over the expected average remaining service period of the employees.<br />
Costs for the period, post-employment benefits other than pensions 2009 <strong>2010</strong><br />
Current year service costs 270 49<br />
Interest costs 334 170<br />
Expected return on plan assets (1) –<br />
Actuarial gains and losses 1 4 (1)<br />
Past service costs<br />
– Unvested 7 –<br />
– Vested 0 26<br />
Curtailments and settlements 1,124 2<br />
of which effect of agreement with UAW in Mack Trucks 1,194 –<br />
Termination benefits 20 7<br />
Total costs for the period, post-employment benefits other than pensions 1,758 253<br />
1 For each plan, actuarial gains and losses are reported as income or expenses, when the accumulated amount exceed the so called corridor. <strong>The</strong> income or<br />
expenses are then recognized over the expected average remaining service period of the employees.<br />
An increase of one percentage point per year in healthcare costs<br />
would change the accumulated post-employment benefit obligation<br />
as of December 31, <strong>2010</strong> by approximately 155, and the post-employment<br />
benefit expense for the period by approximately 10. A decrease<br />
of one percentage point would decrease the accumulated value of<br />
obligations by about 132 and reduce costs for the period by approximately<br />
8. Calculations made as of December 31, <strong>2010</strong> show an annual<br />
increase of 8% in the weighted average per capita costs of covered<br />
health care benefits. It is assumed that the percentage will decline<br />
gradually to 4.5% and then remain at that level.<br />
United<br />
States<br />
Pensions<br />
Great<br />
Britain<br />
Pensions<br />
US<br />
Other<br />
benefits<br />
Obligations in<br />
defined-benefit plans<br />
Sweden<br />
Pensions<br />
France<br />
Pensions<br />
Other<br />
plans Total<br />
Obligations at January 1, 2009 9,097 13,648 2,087 4,035 6,971 5,333 41,171<br />
Acquisitions, divestments and other changes – – (53) – – (3) (56)<br />
Current year service costs 323 264 65 52 252 283 1,239<br />
Interest costs 414 774 104 242 328 168 2,030<br />
Past service costs<br />
– Unvested 1 (90) – – – – (89)<br />
– Vested – (316) 3 – 5 – (308)<br />
of which effect of agreement with UAW in Mack Trucks – (317) – – – – (317)<br />
Termination benefits 32 – (1) – – 25 56<br />
Curtailments and settlements (8) (18) – – (3,163) (140) (3,329)<br />
of which effect of agreement with UAW in Mack Trucks – – – – 1,194 – 1,194<br />
of which reclassification to financial liability in Mack Trucks – – – – (4,282) – (4,282)<br />
Employee contributions – – – 24 – (1) 23<br />
Actuarial (gains) and losses 321 1,096 18 187 231 (47) 1,806<br />
Exchange rate translation – (1,008) (110) 73 (320) (148) (1,513)<br />
Benefits paid (299) (992) (216) (175) (607) (671) (2,960)<br />
Obligations at December 31, 2009 9,881 13,358 1,897 4,438 3,697 4,799 38,070<br />
of which<br />
Funded defined-benefit plans 9,465 12,923 – 4,438 – 2,277 29,103<br />
94
United<br />
States<br />
Pensions<br />
Great<br />
Britain<br />
Pensions<br />
US<br />
Other<br />
benefits<br />
Obligations in<br />
defined benefit plans<br />
Sweden<br />
Pensions<br />
France<br />
Pensions<br />
Other<br />
plans Total<br />
Acquisitions, divestments and other changes – 10 – – 2 28 40<br />
Current year service costs 302 258 54 45 39 247 945<br />
Interest costs 401 665 77 233 167 157 1,700<br />
Past service costs<br />
– Unvested – 3 – – (4) (5) (6)<br />
– Vested 27 3 (44) – – – (14)<br />
Termination benefits 33 – (2) – – 5 36<br />
Curtailments and settlements (6) (7) (18) (1) – (11) (43)<br />
Employee contributions – – – 21 – 9 30<br />
Actuarial (gains) and losses (1,170) 571 (2) 28 (33) 78 (528)<br />
Exchange rate translation – (789) (245) (370) (207) (171) (1,782)<br />
Benefits paid (324) (1,074) (112) (168) (220) (429) (2,327)<br />
Obligations at December 31, <strong>2010</strong> 9,144 12,998 1,605 4,226 3,441 4,707 36,121<br />
of which<br />
Funded defined-benefit plans 8,794 11,378 – 4,226 – 2,203 26,601<br />
United<br />
States<br />
Pensions<br />
Great<br />
Britain<br />
Pensions<br />
US<br />
Other<br />
benefits<br />
Fair value of plan assets in<br />
funded plans<br />
Sweden<br />
Pensions<br />
France<br />
Pensions<br />
Other<br />
plans Total<br />
Plan assets at January 1, 2009 5,467 10,672 – 3,992 104 1,870 22,105<br />
Acquisitions, divestments and other changes – (3) – – – (141) (144)<br />
Expected return on plan assets 328 717 – 223 1 89 1,358<br />
Actuarial gains and (losses) 635 644 – 141 – 43 1,463<br />
Employer contributions – – – 113 – 167 280<br />
Employee contributions – – – 24 – 20 44<br />
Exchange rate translation – (1,203) – 72 (3) 36 (1,098)<br />
Benefits paid – (961) – (173) (74) (190) (1,398)<br />
of which reclassification to financial liability in Mack Trucks – – – – (73) – (73)<br />
Plan assets at December 31, 2009 6,430 9,866 – 4,392 28 1,894 22,610<br />
Acquisitions, divestments and other changes – 4 – (1) – 26 29<br />
Expected return on plan assets 386 719 – 216 – 77 1,398<br />
Actuarial gains and (losses) 262 373 – 208 – 18 861<br />
Employer contributions – 156 – 103 – 187 446<br />
Employee contributions – – – 21 – 12 33<br />
Exchange rate translation – (574) – (378) (2) (166) (1,120)<br />
Benefits paid – (1,009) – (168) (2) (124) (1,303)<br />
Plan assets at December 31, <strong>2010</strong> 7,078 9,535 – 4,393 24 1,924 22,954<br />
95
Financial information <strong>2010</strong><br />
Notes to consolidated financial statements<br />
United<br />
States<br />
Pensions<br />
Great<br />
Britain<br />
Pensions<br />
US<br />
Other<br />
benefits<br />
Net provision for<br />
post-employment benefits<br />
Sweden<br />
Pensions<br />
France<br />
Pensions<br />
Other<br />
plans Total<br />
Funded status at December 31, 2009 (3,451) (3,492) (1,897) (46) (3,669) (2,905) (15,460)<br />
Unrecognized actuarial (gains) and losses 3,030 4,373 232 635 384 1 501 9,155<br />
Unrecognized past service costs – (81) 405 – (6) (15) 303<br />
Net provisions for post-employment<br />
benefits at December 31, 2009 (421) 800 (1,260) 589 (3,291) (2,419) (6,002)<br />
of which reported as<br />
Prepaid pensions and other assets – 1,254 – 588 120 87 2,049<br />
Provisions for post-employment benefits (421) (454) (1,260) 1 (3,411) (2,506) (8,051)<br />
Funded status at December 31, <strong>2010</strong> (2,066) (3,463) (1,605) 167 (3,417) (2,783) (13,167)<br />
Unrecognized actuarial (gains) and losses 1,475 4,054 113 388 322 643 6,995<br />
Unrecognized past service costs – (65) 380 – (5) – 310<br />
Net provisions for post-employment<br />
benefits at December 31, <strong>2010</strong> (591) 526 (1,112) 555 (3,100) (2,140) (5,862)<br />
of which reported as<br />
Prepaid pensions and other assets – 900 – 555 110 83 1,648<br />
Provisions for post-employment benefits (591) (374) (1,112) – (3,210) (2,223) (7,510)<br />
1 A decrease by 194 from reclassification to financial liability in Mack Trucks.<br />
Plan assets by category 2009 % <strong>2010</strong> %<br />
Shares and participation, <strong>Volvo</strong> 195 1 403 2<br />
Shares and participations, other 10,893 48 11,494 50<br />
Bonds and interest-bearing securities. 10,167 45 9,100 40<br />
Property 319 1 440 2<br />
Other 1,036 5 1,517 6<br />
Total 22,610 100 22,954 100<br />
Actual return on plan assets amounted to 2,259 (2,821).<br />
Actuarial gains and losses 2009 <strong>2010</strong><br />
Experience-based adjustments in obligations (110) 293<br />
Experience-based adjustments in plan assets 1,463 861<br />
Effects of changes in actuarial assumptions (1,696) 235<br />
Actuarial gains and (losses), net (343) 1,389<br />
<strong>Volvo</strong>’s pension foundation in Sweden was formed in 1996 to secure<br />
obligations relating to retirement pensions for salaried employees in<br />
Sweden in accordance with the ITP plan (a Swedish individual pension<br />
plan). Plan assets amounting to 2,456 were contributed to the foundation<br />
at its formation, corresponding to the value of the pension obligations<br />
at that time. Since its formation, net contributions of 1,472<br />
have been made to the foundation. <strong>The</strong> plan assets in <strong>Volvo</strong>’s Swedish<br />
pension foundation are invested in Swedish and foreign stocks and<br />
mutual funds, and in interest-bearing securities, in accordance with a<br />
distribution that is determined by the foundation’s Board of Directors.<br />
At December 31, <strong>2010</strong>, the fair value of the foundation's plan assets<br />
amounted to 7,059 (6,408), of which 57% (46) was invested in shares<br />
or mutual funds. At the same date, retirement pension obligations<br />
attributable to the ITP plan amounted to 8,794 (9,465).<br />
Swedish companies can secure new pension obligations through<br />
balance sheet provisions or pension fund contributions. Furthermore,<br />
a credit insurance must be taken for the value of the obligations. In<br />
addition to benefits relating to retirement pensions, the ITP plan also<br />
includes, for example, a collective family pension, which <strong>Volvo</strong> finances<br />
through insurance with the Alecta insurance company. According to<br />
an interpretation from the Swedish Financial <strong>Report</strong>ing Board, this is<br />
a multi-employer defined-benefit plan. For fiscal year 2009, <strong>Volvo</strong> did<br />
not have access to information from Alecta that would have enabled<br />
this plan to be reported as a defined-benefit plan. Accordingly, the<br />
plan has been reported as a defined-contribution plan. Alecta's funding<br />
ratio is 143% (141).<br />
<strong>Volvo</strong>’s subsidiaries in the United States mainly secure their pension<br />
obligations through transfer of funds to pension plans. At the end<br />
of <strong>2010</strong>, the total value of pension obligations secured by pension<br />
plans of this type amounted to 11,378 (12,923). At the same point in<br />
time, the total value of the plan assets in these plans amounted to<br />
9,535 (9,866), of which 59% (59) was invested in shares or mutual<br />
funds. <strong>The</strong> regulations for securing pension obligations stipulate certain<br />
minimum levels concerning the ratio between the value of the<br />
plan assets and the value of the obligations. As a consequence of the<br />
Master Agreement 2009 between Mack Trucks and United Auto<br />
Workers (UAW) an independent trust has been established that will<br />
completely eliminate Mack's commitments for providing healthcare to<br />
96
etired employees. Instead Mack Trucks has an obligation to fund the<br />
newly established fund over five years. As a result of the agreement<br />
the 2009 operating income of Mack Trucks was charged by 877 (USD<br />
110 M), of which 1,194 concerning settlement of post-employment<br />
benefits other than pensions and 317 in reduced pension costs from<br />
a change in past service costs. <strong>The</strong> obligation increased with the<br />
same amount. Interest on the obligation started accruing from October<br />
1, 2009. By that, SEK 4,015 billion (USD 525 M), formerly reported<br />
as obligation was reclassified a financial liability. Accordingly, the obligation<br />
decreased by 4,282, the plan assets by 73 and unrecognized<br />
actuarial losses by 194. During <strong>2010</strong>, <strong>Volvo</strong> contributed 156 (0) to the<br />
American pension plans.<br />
During <strong>2010</strong> <strong>Volvo</strong> has made extra contributions to the pension<br />
plans in Great Britain in the amount of SEK 103 M (113).<br />
In 2011, <strong>Volvo</strong> estimates to transfer an amount of about SEK 1 billion<br />
to pension plans.<br />
Note 25 Other provisions<br />
Value in<br />
balance<br />
sheet<br />
2009 Provisions Reversals Utili zations<br />
Acquired<br />
and<br />
divested<br />
companies<br />
Translation<br />
differences<br />
Reclassifications<br />
Value in<br />
balance<br />
sheet<br />
<strong>2010</strong><br />
Of which<br />
due<br />
within 12<br />
months<br />
Of which<br />
due after<br />
12 months<br />
Warranties 7,947 6,080 (805) (5,160) (4) (333) 116 7,841 4,844 2,997<br />
Provisions in insurance<br />
operations 505 154 (103) (75) 0 (31) 0 450 3 447<br />
Restructuring measures 707 72 (75) (419) 0 (36) (2) 247 188 59<br />
Provisions for residual value<br />
risks 1,061 319 (40) (461) 0 (25) 5 859 134 725<br />
Provisions for service contracts 465 296 (42) (228) 0 (41) (6) 444 192 252<br />
Dealer bonus 1,315 2,245 (64) (1,684) 5 (142) (24) 1,651 1,435 216<br />
Other provisions 3,847 3,088 (1,035) (2,714) 1 (202) (7) 2,978 1,738 1,240<br />
Total 15,847 12,254 (2,164) (10,741) 2 (810) 82 14,470 8,534 5,936<br />
Long-term provisions as above is expected to be settled within 2 to 3 years.<br />
Note 26 Non-current liabilities<br />
<strong>The</strong> listing below shows the <strong>Group</strong>’s non-current liabilities in which the<br />
largest loans are distributed by currency. Most are issued by <strong>Volvo</strong><br />
Treasury AB. Information on loan terms is as of December 31, <strong>2010</strong>.<br />
<strong>Volvo</strong> hedges foreign-exchange and interest-rate risks using derivative<br />
instruments. See Note 36.<br />
Actual interest rate,<br />
Dec 31, <strong>2010</strong>, %<br />
Effective interest rate,<br />
Dec 31, <strong>2010</strong>, % 2009 <strong>2010</strong><br />
Bond loans<br />
EUR 2007–<strong>2010</strong>/2012-2017 2.19–9.92 2.21–9.92 26,428 20,384<br />
SEK 2007–2009/2012–2017 1.59–8.63 1.60–8.91 16,174 12,553<br />
JPY 79 –<br />
USD 2009/2015 5.98 5.98 5,381 5,075<br />
NOK 2009/2012 5.64 5.76 557 229<br />
GBP 2009/2014 6.28 6.43 572 525<br />
Total 1 49,191 38,767<br />
1 Of which loans raised to finance the credit portfolio of the customer financing operations 14,940 (12,302).<br />
97
Financial information <strong>2010</strong><br />
Notes to consolidated financial statements<br />
Actual interest rate,<br />
Dec 31, <strong>2010</strong>, %<br />
Effective interest rate,<br />
Dec 31, <strong>2010</strong>, % 2009 <strong>2010</strong><br />
Other loans<br />
USD 2007–<strong>2010</strong>/2012–2018 0.52–7.50 0.52–7.76 17,281 13,433<br />
EUR 2004–2009/2012–2027 3.25–6.50 3.28–6.50 5,995 1,485<br />
GBP 2008/2012–2013 1.19 1.2 1,664 337<br />
SEK 2007–<strong>2010</strong>/2012–2017 2.00–3.00 2.02–3.00 1,915 2,942<br />
CAD 2006–<strong>2010</strong>/2012–2013 1.53–2.84 1.54–2.87 2,067 2,928<br />
MXN 2007–2009/2012–2014 5.00–9.04 5.11–9.42 2,145 2,186<br />
JPY 2005–<strong>2010</strong>/2012–2016 0.65–3.52 0.65–3.52 16,374 12,405<br />
CHF 696 –<br />
BRL 2003–2009/2012–2017 6.58–7.0 6.86–7.0 5,940 5,348<br />
Other loans 1.7–7.5 1.71–7.64 1,189 1,871<br />
Revaluation of outstanding derivaties to SEK 769 2,392<br />
Total other non-current loans 2 56,035 45,327<br />
Deferred leasing income 1,965 1,778<br />
Residual value liabilities 3,109 3,170<br />
Accrued expenses service contracts 1,422 1,273<br />
Other non-current financial liabilities 1,672 1,114<br />
Other non-current liabilities 1,720 1,896<br />
Total 115,114 93,325<br />
2 Of which loans raised to finance the credit portfolio of the customer financing operations 21,064 (26,551) and financial derivatives 2.392 (769).<br />
Of the above long-term loans, 1,288 (270) was secured.<br />
See note 28 for a description of changes of assets pledged.<br />
Long-term loans mature as follows:<br />
2012 23,530<br />
2013 13,836<br />
2014 17,591<br />
2015 10,190<br />
2016 6,476<br />
2017 or later 12,471<br />
Total 84,094<br />
See note 16 for maturities of long-term customer financing receivables.<br />
Of other non-current liabilities the majority will mature within five<br />
years.<br />
At year-end <strong>2010</strong>, credit facilities granted but not utilized and which<br />
can be used without restrictions amounted to approximately SEK 35.3<br />
billion (33.2). <strong>The</strong>se facilities consisted of stand-by facilities for loans<br />
with varying maturities through the year 2013. A fee is normally<br />
charged for the unused portion of credit facilities and is reported in<br />
the income statement under other financial income and expenses.<br />
Note 27Current liabilities<br />
Balance sheet amounts for loans were as follows:<br />
2009 <strong>2010</strong><br />
Bank loans 14,083 12,261<br />
Other loans 37,543 27,340<br />
Total 1 51,626 39,601<br />
1 Of which loans raised to finance the credit portfolio of the customer financing<br />
operations 29,690 (40,766) and derivatives 458 (178).<br />
Bank loans include current maturities, 3,246 (4,713), of long-term<br />
loans. Other loans include current maturities of long-term loans,<br />
22,007 (25,108), and commercial paper, 1,416 (8,640).<br />
Non-interest-bearing current liabilities accounted for 84,457<br />
(70,955), or 68% (58) of the <strong>Group</strong>’s total current liabilities.<br />
Balance sheet amounts for other current liabilities were as follows:<br />
2009 <strong>2010</strong><br />
Advances from customers 3,556 3,416<br />
Wages, salaries and withholding taxes 8,504 8,824<br />
VAT liabilities 1,511 2,023<br />
Accrued expenses and prepaid income 11,756 12,626<br />
Deferred leasing income 1,725 1,640<br />
Residual value liability 2,730 2,154<br />
Other financial liabilities 783 242<br />
Other liabilities 3,540 4,416<br />
Total 34,105 35,341<br />
Current liabilities also include trade payables that amounted to 47,250<br />
(35,955), current tax liabilities of 1,732 (623) and non interest-bearing<br />
liabilities held for sale reported within Note 4. Secured bank loans<br />
at year-end <strong>2010</strong> amounted to 216 (329). <strong>The</strong> corresponding amount<br />
for other current liabilities was 1,442 (58).<br />
98
Note 28 Assets pledged<br />
2009 <strong>2010</strong><br />
Property, plant and equipment – mortgages 297 168<br />
Assets under operating leases 109 107<br />
Chattel mortgages 25 –<br />
Receivables 451 2,964<br />
Cash, marketable securities 76 100<br />
Total 958 3,339<br />
<strong>The</strong> liabilities for which the above assets were pledged amounted at<br />
year-end to 2,946 (658).<br />
In <strong>2010</strong> an asset-backed securitization was completed. Under the<br />
terms of the transaction, USD 616 M of securities were issued tied to<br />
US-based loans with trucking and construction equipment assets as<br />
collaterals.<br />
Note 29 Contingent liabilities<br />
2009 <strong>2010</strong><br />
Credit guarantees issued for<br />
customers and others 2,173 3,709<br />
Tax claims 824 490<br />
Other contingent liabilities 6,610 6,804<br />
Total 9,607 11,003<br />
Tax claims amounted to 490 (824) pertain to charges against the<br />
<strong>Volvo</strong> <strong>Group</strong> for which provisions are not considered necessary.<br />
Other contingent liabilities includes residual value guarantees and<br />
legal proceedings.<br />
<strong>The</strong> reported amounts for contingent liabilities reflect the <strong>Volvo</strong><br />
<strong>Group</strong>'s risk exposure on a gross basis. <strong>The</strong> reported amounts have<br />
thus not been reduced because of counter guarantees received or<br />
other collaterals in cases where a legal offsetting right does not exist.<br />
At December 31, <strong>2010</strong>, the estimated value of counter guarantees<br />
received and other collaterals, for example the estimated net selling<br />
price of used products, amounted to 3,893 (3,832). <strong>The</strong>y are mainly<br />
pertaining to credit guarantees and residual value guarantees.<br />
Legal proceedings<br />
<strong>The</strong> former labor agreement between Mack Trucks, Inc. and the<br />
United Auto Workers Union (UAW), expired on September 30, 2007.<br />
<strong>The</strong>reafter Mack Trucks and UAW have entered into a new 40-month<br />
Master Agreement. <strong>The</strong> agreement includes the establishment of an<br />
independent trust that will completely eliminate Mack's commitments<br />
for providing healthcare to retired employees. <strong>The</strong> trust must be<br />
approved by the U.S. District Court for the Eastern District of Pennsylvania,<br />
which is currently scheduled for the last six months of 2011. <strong>The</strong><br />
<strong>Volvo</strong> <strong>Group</strong> will fund the trust with USD 525 M, paid out during a fiveyear<br />
period as from <strong>2010</strong>. <strong>The</strong> funding obligation is reported as a<br />
financial liability and amortizations will be reported as cash flow from<br />
financing activities.<br />
In July 1999, <strong>Volvo</strong> Truck Corporation and <strong>Volvo</strong> Construction<br />
Equipment entered into a Consent Decree with the U.S. Environmental<br />
Protection Agency (EPA). <strong>The</strong> Consent Decree included, among<br />
other provisions, that new stricter emission requirements for certain<br />
engines that would come into force on January 1, 2006, should be<br />
applied by VTC and VCE from January 1, 2005. <strong>The</strong> Consent Decree<br />
was later transferred from VTC and VCE to <strong>Volvo</strong> Powertrain Corporation.<br />
During 2008, the EPA demanded stipulated penalties from<br />
<strong>Volvo</strong> Powertrain Corporation in the amount, including interest, of<br />
USD 72 M, alleging that the stricter standards under the Consent<br />
Decree should have been applied to engines manufactured by <strong>Volvo</strong><br />
Penta during 2005. <strong>Volvo</strong> Powertrain disagrees with EPA's interpretation<br />
and is defending the case vigorously based on, among other<br />
grounds, that the <strong>Volvo</strong> Penta engines were not subject to the Consent<br />
Decree. <strong>The</strong> dispute was referred to a U.S. court. <strong>The</strong> amount<br />
requested by the EPA is included in other contingent liabilities.<br />
Nissan Diesel Thailand Co. Limited (the “Plaintiff”) on November<br />
30, 2009 filed a claim at the Pathumthani Provincial Court of First<br />
Instance, Thailand, against AB <strong>Volvo</strong> and three of its employees<br />
(together the “Defendants”), claiming damages in the sum of Baht<br />
10.5 billion (equivalent to approximately SEK 2.3 billion). <strong>The</strong> Plaintiff<br />
claims that the Defendants' actions caused UD Trucks Corporation<br />
(“UDT”), a wholly-owned subsidiary of AB <strong>Volvo</strong>, to unlawfully terminate<br />
two agreements dated December 27, 2002 between UDT and<br />
the Plaintiff. <strong>The</strong> Plaintiff is one of UDT's private dealers. AB <strong>Volvo</strong><br />
considers that the Plaintiff's claim is of no merit.<br />
<strong>Volvo</strong> Trucks’ and Renault Trucks’ UK subsidiaries have, together<br />
with a number of other international truck companies, become the<br />
subject of an investigation initiated by the OFT (Office of Fair Trading),<br />
the British competition authority. <strong>Volvo</strong> Trucks’ and Renault Trucks’<br />
British subsidiaries have received letters from the OFT as part of the<br />
investigation and will cooperate fully with the OFT during the course<br />
of the investigation.<br />
In January 2011 <strong>Volvo</strong> <strong>Group</strong> and a number of other companies in<br />
the truck industry have become part of an investigation by the European<br />
Commission regarding a possible violation of EU antitrust rules.<br />
<strong>Volvo</strong> <strong>Group</strong> will cooperate fully with the Commission during the<br />
course of the investigative work.<br />
Global actors such as <strong>Volvo</strong> are occasionally involved in tax disputes<br />
of different proportions and in different stages. On a regular<br />
basis <strong>Volvo</strong> evaluates the exposure related to such disputes and, to<br />
the extent it is possible to reasonably estimate what the outcome will<br />
be, makes provisions when it is more likely than not that there will be<br />
additional tax to pay.<br />
<strong>Volvo</strong> is involved in a number of other legal proceedings. <strong>Volvo</strong> does<br />
not believe that any liabilities related to such proceedings are likely to<br />
entail any risk, in the aggregate, of having a material effect on the<br />
financial condition of the <strong>Volvo</strong> <strong>Group</strong>.<br />
99
Financial information <strong>2010</strong><br />
Notes to consolidated financial statements<br />
Note 30 Cash-flow<br />
Other items not affecting<br />
cash amounted to: 2009 <strong>2010</strong><br />
Risk provisions and losses related to doubtful<br />
accounts receivable/customer-financing<br />
receivables 2,779 1,401<br />
Capital gains/losses on the sale of subsidiaries<br />
and other business units (108) 34<br />
Unrealized exchange rate gains/losses<br />
on accounts receivable and payable (26) (44)<br />
Provision for global profit sharing program – 350<br />
Expenses for healthcare benefits as a result of<br />
the Master Agreement between Mack Trucks<br />
and UAW (see note 24) 877 –<br />
Provision for restructuring reserves 334 –<br />
Write-down of assets held for sale 368 65<br />
Other non-cash items 173 (245)<br />
4,397 1,561<br />
Investments in shares and participations: 2009 <strong>2010</strong><br />
New issue of shares (2) (13)<br />
Capital contribution (6) (31)<br />
Acquisitions (61) (154)<br />
Divestments 16 91<br />
Other 15 1<br />
(38) (106)<br />
Acquired and divested subsidiaries<br />
and other business units: 2009 <strong>2010</strong><br />
Acquired subsidiaries and<br />
other business units (56) (214)<br />
Divested subsidiaries and<br />
other business units 205 831<br />
149 617<br />
Important increase/decrease in bond loans and other loans<br />
During <strong>2010</strong> the <strong>Volvo</strong> <strong>Group</strong> has reduced its borrowings as a consequence<br />
of a strong cash flow and lower demands of funding from the<br />
Customer Finance Operations.<br />
During 2009, the <strong>Volvo</strong> <strong>Group</strong> completed a number of important<br />
funding transactions. A five year EUR 700 M bond was issued, followed<br />
by a three year SEK 4.2 billion bond. <strong>The</strong> <strong>Group</strong> also received a seven<br />
year loan from the European Investment Bank equivalent to EUR 400 M.<br />
<strong>Volvo</strong> Treasury AB, a subsidiary of AB <strong>Volvo</strong>, issued a USD 750 M<br />
guaranteed bond offering at an interest rate of 5.95% due 2015.<br />
Note 31 Leasing<br />
<strong>Volvo</strong> as a lessor<br />
At December 31, <strong>2010</strong>, future rental income from non-cancellable<br />
financial and operating leases (minimum leasing fees) amounted to<br />
45,530 (50,522). Future rental income is distributed as follows:<br />
Finance<br />
leases<br />
Operating<br />
leases<br />
2011 12,338 4,083<br />
2012–2015 21,009 6,385<br />
2016 or later 482 1,233<br />
Total 33,829 11,701<br />
Allowance for uncollectible<br />
future rental income (445)<br />
Unearned rental income (2,904)<br />
Present value of future rental income<br />
related to non-cancellable leases 30,480<br />
<strong>Volvo</strong> as a lessee<br />
At December 31, <strong>2010</strong>, future rental payments (minimum leasing<br />
fees) related to non-cancellable leases amounted to 3,916 (4,135).<br />
Future rental payments are distributed as follows:<br />
Finance<br />
leases<br />
Operating<br />
leases<br />
2011 496 815<br />
2012-2015 486 1,605<br />
2016 or later 66 448<br />
Total 1,048 2,868<br />
Rental expenses amounted to:<br />
2009 <strong>2010</strong><br />
Finance leases:<br />
Contingent rents (6) (8)<br />
Operating leases:<br />
Contingent rents (24) (20)<br />
Rental payments (950) (923)<br />
Sublease payments 8 6<br />
Total (972) (945)<br />
100
Book value of assets subject to finance lease:<br />
2009 <strong>2010</strong><br />
Acquisition costs:<br />
Buildings 123 124<br />
Land and land improvements 61 69<br />
Machinery and equipment 1,799 1,863<br />
Assets under operating lease 343 338<br />
Total 2,326 2,394<br />
Accumulated depreciation:<br />
Buildings (41) (41)<br />
Land and land improvements – –<br />
Machinery and equipment (1,090) (1,174)<br />
Assets under operating lease (78) (81)<br />
Total (1,209) (1,296)<br />
Book value:<br />
Buildings 82 83<br />
Land and land improvements 61 69<br />
Machinery and equipment 709 689<br />
Assets under operating lease 265 257<br />
Total 1,117 1,098<br />
Note 32 Transactions with related parties<br />
<strong>The</strong> <strong>Volvo</strong> <strong>Group</strong> has transactions with some of its associated companies.<br />
<strong>The</strong> transactions consist mainly of sales of vehicles to dealers.<br />
Commercial terms and market prices apply for the supply of goods<br />
and services to/from associated companies.<br />
2009 <strong>2010</strong><br />
Sales to associated companies 529 1,082<br />
Purchase from associated companies 91 50<br />
Receivables from associated companies, Dec 31 297 174<br />
Liabilities to associated companies, Dec 31 8 125<br />
<strong>Group</strong> holdings of shares in associated companies are presented in<br />
note 15, Shares and participations.<br />
<strong>The</strong> <strong>Volvo</strong> <strong>Group</strong> also has transactions with Renault s.a.s. and its subsidiaries.<br />
Sales to and purchases from Renault s.a.s. amounted to 52<br />
(85) and 1,654 (2,110). Amounts due from and due to Renault s.a.s.<br />
amounted to 15 (20) and 291 (457) respectively, at December 31,<br />
<strong>2010</strong>. <strong>The</strong> sales were mainly from Renault Trucks to Renault s.a.s. and<br />
consisted of components and spare parts. <strong>The</strong> purchases were mainly<br />
made by Renault Trucks from Renault s.a.s. and consisted mainly of<br />
light trucks. Renault Trucks has a license from Renault s.a.s. for the<br />
use of the trademark Renault.<br />
Note 33 Government grants<br />
During <strong>2010</strong>, government grants amounting to 472 (810) have been<br />
received and 413 (567) have been accounted for in the income statement.<br />
Research and development tax credits are included with 204<br />
(305) and have mainly been received in France and during 2009 also<br />
in the US. Other grants were mainly received from the Swedish government<br />
and the European Commission.<br />
Note 34 Personnel<br />
Remuneration policy decided at the <strong>Annual</strong> General Meeting<br />
in <strong>2010</strong><br />
<strong>The</strong> <strong>Annual</strong> General Meeting of <strong>2010</strong> decided upon principles for<br />
remuneration and other employment terms for the members of <strong>Volvo</strong>'s<br />
<strong>Group</strong> Executive Committee (“Remuneration Policy”). <strong>The</strong> accepted<br />
principles can be summarized as follows:<br />
<strong>The</strong> guiding principle is that remuneration and other employment<br />
terms for company management, shall be competitive to ensure that<br />
<strong>Volvo</strong> can attract and retain skilled persons in the <strong>Group</strong> Executive Committee.<br />
<strong>The</strong> fixed salary shall be competitive and shall reflect the individual's<br />
area of responsibility and performance.<br />
In addition to the fixed salary a variable salary may be paid. <strong>The</strong> variable<br />
salary may for the CEO amount to a maximum of 65% of the fixed<br />
salary and for the other senior executives a maximum of 50% of the<br />
fixed salary. <strong>The</strong> variable salary shall be based on the <strong>Volvo</strong> <strong>Group</strong>’s and/<br />
or the executive’s respective business area’s or business unit’s fulfilment<br />
of certain financial goals. <strong>The</strong>se goals are decided by the Board of AB<br />
<strong>Volvo</strong> and may be related, for example, to operating income and/or cash<br />
flow.<br />
In addition to fixed and variable salary, normally other customary benefits,<br />
such as company car and company healthcare are provided. In<br />
individual cases, accommodation benefits and other benefits may be<br />
provided.<br />
In addition to pension benefits provided by law and collective bargain<br />
agreements, the members of the <strong>Group</strong> Executive Committee domiciled<br />
in Sweden are offered a defined-contribution pension plan whereby<br />
101
Financial information <strong>2010</strong><br />
Notes to consolidated financial statements<br />
the amount of the individual’s pensions comprises the premium paid<br />
and any return. Members of the <strong>Group</strong> Executive Committee resident<br />
outside Sweden or resident in Sweden but having a material connection<br />
to or having been resident in a country other than Sweden are<br />
offered pension solutions that are competitive in the country where<br />
the members are or have been resident or to which the members have<br />
a material connection.<br />
With regard to notice of termination of employment for members of<br />
the <strong>Group</strong> Executive Committee domiciled in Sweden, the notification<br />
period is 12 months if the company terminates the employment and<br />
six months if the individual terminates the employment. In addition, the<br />
employee is entitled to a severance pay of 12 months’ salary if <strong>Volvo</strong><br />
terminates the employment. Members resident outside Sweden or<br />
resident in Sweden but having a material connection to or having been<br />
resident in a country other than Sweden are offered notice periods for<br />
termination and severance payment that are competetive in the country<br />
where the members are or have been resident or to which the members<br />
have a material connection.<br />
Fee paid to the Board of directors<br />
According to a resolution adopted at the <strong>Annual</strong> General Meeting<br />
<strong>2010</strong>, the fee to the Board of Directors appointed at the <strong>Annual</strong> General<br />
Meeting for the period until the close of the <strong>Annual</strong> General Meeting<br />
2011 shall be paid as follows: <strong>The</strong> Chairman of the Board should<br />
be awarded SEK 1,500,000 and each of the other members SEK<br />
500,000 with exception of the President and Chief Executive Officer<br />
of AB <strong>Volvo</strong>. In addition, SEK 250,000 should be awarded to the chairman<br />
of the audit committee and SEK 125,000 to each of the other<br />
two members of the audit commmittee and SEK 75,000 to each of<br />
the members of the remuneration committee<br />
Terms of employment and remuneration to the CEO<br />
<strong>The</strong> President and Chief Executive Officer, Leif Johansson, is entitled<br />
to a remuneration consisting of a fixed annual salary and a variable<br />
salary. <strong>The</strong> variable salary is based on operating income in relation to<br />
the same period last year and/or cash flow for six months moving<br />
periods up to a maximum of 65% of his fixed annual salary.<br />
For the financial year <strong>2010</strong>, Leif Johansson received a fixed salary<br />
of SEK 12,492,450 and a variable salary of SEK 7,986,448. <strong>The</strong> variable<br />
salary corresponded to 64% of the fixed annual salary. Other<br />
benefits, mainly pertaining to car and housing, amounted to SEK<br />
609,542 in <strong>2010</strong>.<br />
Leif Johansson is covered by the <strong>Volvo</strong> executive pension plans,<br />
<strong>Volvo</strong> Management Pension (VMP) and <strong>Volvo</strong> Executive Pension<br />
(VEP). <strong>The</strong> retirement benefit is a defined-contribution plan with<br />
refund protection. <strong>The</strong> disability pension is a defined-benefit plan.<br />
Contributions to VMP and VEP are not tax-deductable, the benefit<br />
from the insurance is not taxable to the company, but pension paid will<br />
be tax-deductable. <strong>The</strong> pensionable salary consists of the annual salary<br />
and the average of the variable salary for the previous five years.<br />
<strong>The</strong> premium for the VMP is SEK 30,000 plus 20% of the pensionable<br />
salary over 30 income base amounts and the premium for VEP is<br />
10% of pensionable salary. <strong>The</strong>re are no commitments other than the<br />
payment of the premiums. <strong>The</strong> disability pension consists of 70% of<br />
pensionable salary up to 30 income base amounts and 40% of the<br />
pensionable salary between 30 and 50 income base amounts. <strong>The</strong><br />
right to disability pension is conditional to employment and will cease<br />
upon termination of duty.<br />
Leif Johansson is also covered by <strong>Volvo</strong> Företagspension, a defined<br />
contribution plan for additional retirement benefit. <strong>The</strong> premium is<br />
negotiated each year, for <strong>2010</strong> the premium amounted to SEK 502 a<br />
month.<br />
Pension premiums for the President and CEO amounted to SEK<br />
4,680,412 for <strong>2010</strong>.<br />
Leif Johansson has a six-month notice of termination on his own<br />
initiative and 12 months notice of termination from AB <strong>Volvo</strong>. He is not<br />
entitled to severance payments. In December <strong>2010</strong> Leif Johansson<br />
informed the Board of AB <strong>Volvo</strong> of his intention to resign in conjunction<br />
with his 60th birthday in the summer of 2011.<br />
Remuneration to other senior executives<br />
Fixed and variable salaries<br />
Members of the <strong>Group</strong> Executive Committee and a number of senior<br />
executives receive variable salaries in addition to fixed salaries. Variable<br />
salaries are in most cases based on the fulfillment of certain<br />
improvement targets or financial targets. <strong>The</strong> targets are decided by<br />
the Board of Directors in AB <strong>Volvo</strong> and may relate to operating income<br />
in relation to corresponding period previous year and/or cash flow for<br />
a six month rolling period. During <strong>2010</strong>, a variable salary could amount<br />
to a maximum of 50% of the fixed annual salary.<br />
For the financial year <strong>2010</strong>, fixed salaries amounted to SEK<br />
55,927,329 and variable salaries amounted to SEK 22,309,808 for<br />
members of the <strong>Group</strong> Executive Committee, excluding the President<br />
and CEO. In addition to the CEO and the <strong>Group</strong> Chief Executive, the<br />
<strong>Group</strong> Executive Committee comprised 17 members at the beginning<br />
and 16 members at the end of the year. Other benefits, mainly pertaining<br />
to car and housing, amounted to SEK 5,900,970 in <strong>2010</strong>.<br />
Severance payments<br />
<strong>The</strong> employment contracts for members of the <strong>Group</strong> Executive Committee<br />
and certain other senior executives contain rules governing<br />
severance payments when the company terminates the employment.<br />
<strong>The</strong> rules provide that, when the company terminates the employment,<br />
an employee is entitled to severance pay equal to the employee’s<br />
monthly salary for a period of 12 or 24 months, depending on age at<br />
date of severance.<br />
In agreements concluded after the spring of 1993, severance pay<br />
is reduced, in the event the employee gains employment during the<br />
severance period, with an amount equal to 75% of the income from<br />
the new employment. In agreements concluded after the spring of<br />
2004, severance pay is reduced by the full income from the new<br />
employment. Furthermore, age limit at date of notice of termination is<br />
removed and with few exceptions, severance pay is entitled for a<br />
period of 12 months.<br />
Pensions<br />
Members of the <strong>Group</strong> Executive Committee and certain other senior<br />
executives are offered pensions that are competitive in the country in<br />
which the person is or have been domiciled or in the country to which<br />
the person is essentially connected.<br />
Previous pension agreements for certain senior executives stipulated<br />
that early retirement could be obtained from the age of 60. Agreements<br />
102
for retirement at age 60 are no longer signed, and are instead replaced<br />
by a defined-contribution plan with pension premium payments at the<br />
longest to the age of 65 years. <strong>The</strong> premium constitutes 10% of the<br />
pensionable salary.<br />
Earlier defined-benefit pension plans, which entitled the employee<br />
to 50% of the pensionable salary after normal retirement age, have<br />
also been replaced by a defined-contribution plan. <strong>The</strong> pension plan<br />
includes employees born before 1979 and is a complement to the<br />
collective agreement regarding occupational pension. <strong>The</strong> premium<br />
constitutes of SEK 30,000 plus 20% of the pensionable salary over<br />
30 income base amounts. <strong>The</strong> pensionable salary consists of the<br />
annual salary and the average of the variable salary for the previous<br />
five years. Pension premiums amounted to SEK 40,478,675 for other<br />
senior executives in <strong>2010</strong>.<br />
<strong>Volvo</strong> <strong>Group</strong>’s total costs for remuneration and benefits to<br />
senior executives<br />
Costs for total remuneration and benefits to the members of the<br />
<strong>Group</strong> Executive Committee (GEC) in <strong>2010</strong> is pertaining to the following:<br />
fixed salary SEK 89 million (91); variable salary SEK 39 million (8);<br />
other benefits SEK 10 million (14) and pensions SEK 51 million (45).<br />
Total costs for members of the GEC include social fees on salaries<br />
and benefits, special pension tax and additional costs for other benefits.<br />
<strong>The</strong> remuneration model of the <strong>Volvo</strong> group is to a main part<br />
designed to follow changes in the profitability of the group.<br />
Incentive programs<br />
<strong>The</strong> <strong>Annual</strong> General Meeting held in 2009 approved a share-based<br />
incentive program for certain senior executives with allotment in<br />
<strong>2010</strong>. <strong>The</strong> financial targets set as conditions for allotment were not<br />
fulfilled and no allotment was therefore made.<br />
<strong>The</strong> Board of Directors will propose to the <strong>Annual</strong> General Meeting<br />
a performance-based long-term share-based incentive program for<br />
maximum 300 of the <strong>Volvo</strong> <strong>Group</strong>’s top executives. <strong>The</strong> program will<br />
require that the participants invest part of their own salary in <strong>Volvo</strong><br />
shares. Details about the program will be announced in connection<br />
with the Notice to attend the <strong>Annual</strong> General Meeting.<br />
103
Financial information <strong>2010</strong><br />
Notes to consolidated financial statements<br />
Number of<br />
employees<br />
2009 <strong>2010</strong><br />
of which<br />
women, %<br />
Number of<br />
employees<br />
of which<br />
women, %<br />
Average number of employees<br />
AB <strong>Volvo</strong><br />
Sweden 190 46 198 51<br />
Subsidiaries<br />
Sweden 23,637 20 23,313 20<br />
Western Europe 25,533 17 23,515 17<br />
Eastern Europe 5,542 21 5,768 22<br />
North America 10,091 18 12,429 19<br />
South America 4,180 14 5,264 14<br />
Asia 16,650 10 21,205 10<br />
Other countries 2,261 17 2,558 15<br />
<strong>Group</strong> total 88,084 17 94,250 17<br />
Number at<br />
year-end<br />
2009 <strong>2010</strong><br />
of which<br />
women, %<br />
Number at<br />
year-end<br />
of which<br />
women, %<br />
Board members 1 and other senior executives<br />
AB <strong>Volvo</strong><br />
Board members 1 12 8 12 17<br />
CEO and GEC 18 6 17 6<br />
<strong>Volvo</strong> <strong>Group</strong><br />
Board members 1 880 11 929 12<br />
Presidents and other senior executives 1,330 19 1,053 15<br />
1 Excluding deputy Board members.<br />
2009 <strong>2010</strong><br />
of which<br />
variable<br />
salaries<br />
of which<br />
variable<br />
salaries<br />
Wages, salaries and other<br />
remunerations, SEK M<br />
Board and<br />
Presidents 1<br />
Other<br />
employees<br />
Board and<br />
Presidents 1<br />
Other<br />
employees<br />
AB <strong>Volvo</strong><br />
Sweden 19.0 1.1 140.6 26.2 8.0 184.6<br />
Subsidiaries<br />
Sweden 56.1 5.0 9,662.6 69.5 16.4 10,144.9<br />
Western Europe 432.8 10.7 9,995.8 447.0 4.4 9,338.4<br />
Eastern Europe 110.0 9.6 904.2 43.9 3.5 913.8<br />
North America 142.1 14.7 4,974.0 182.2 19.9 5,188.1<br />
South America 43.5 29.4 1,015.9 60.1 40.3 1,297.4<br />
Asia 93.1 5.6 4,602.9 155.6 11.8 5,099.3<br />
Other countries 44.6 11.5 625.8 46.7 8.5 665.5<br />
<strong>Group</strong> total 941.2 87.6 31,921.8 1,031.2 112.8 32,832.0<br />
Wages,<br />
salaries, remunerations<br />
2009 <strong>2010</strong><br />
Wages,<br />
salaries,<br />
remunerations<br />
Wages, salaries and other remunerations<br />
and social costs, SEK M<br />
Social<br />
costs<br />
of which<br />
pens. costs<br />
Social<br />
costs<br />
of which<br />
pens. costs<br />
AB <strong>Volvo</strong> 2 159.6 139.5 107.5 210.8 119.9 81.9<br />
Subsidiaries 32,703.4 12,746.0 4,593.2 33,652.4 11,823.6 4,658.0<br />
<strong>Group</strong> total 3 32,863.0 12,885.5 4,700.7 33,863.2 11,943.5 4,739.9<br />
1 Including current and former Board members, Presidents and Executive<br />
Vice Presidents.<br />
2 <strong>The</strong> Parent Company’s pension costs, pertaining to Board members and<br />
Presidents are disclosed in Note 3 in the Parent Company.<br />
3 Of the <strong>Group</strong>’s pension costs, 146.6 (135.1) pertain to Board members and<br />
Presidents, including current and former Board members, Presidents and<br />
Executive Vice Presidents. <strong>The</strong> <strong>Group</strong>’s outstanding pension obligations to<br />
these individuals amount to 334.4 (267.2).<br />
<strong>The</strong> cost for non-monetary benefits in the <strong>Group</strong> amounted to 1,554.3<br />
(1,300.0) of which 59.3 (49.3) to Board members and Presidents.<br />
<strong>The</strong> cost for non-monetary benefits in the Parent Company<br />
amounted to 9.0 (9.8) of which 1.7 (1.7) to Board members and<br />
Presidents.<br />
104
Note 35 Fees to the auditors<br />
Fees to the auditors 2009 <strong>2010</strong><br />
PricewaterhouseCoopers<br />
- Audit fees 110 102<br />
- Audit-related fees 7 6<br />
- Tax advisory services 14 16<br />
- Other fees 3 3<br />
Total 134 127<br />
Audit fees to others 1 1<br />
<strong>Volvo</strong> <strong>Group</strong> Total 135 128<br />
Audit involves examination of the annual report and financial accounting<br />
and the administration by the Board and the President. Auditrelated<br />
assignments mean quality assurance services required by<br />
enactment, articles of association, regulations or agreement. <strong>The</strong><br />
amount includes among other things the fee for the half-year review.<br />
Tax services include both tax consultancy and tax compliance services.<br />
All other tasks are defined as other. 2009 figures are restated<br />
for comparability.<br />
Note 36 Goals and policies in financial risk management<br />
Apart from derivatives, <strong>Volvo</strong>’s financial instruments consist of bank<br />
loans, finance leasing contracts, accounts payable, accounts receivable,<br />
shares and participations, as well as cash and short-term investments.<br />
<strong>The</strong> primary risks deriving from the handling of financial instruments<br />
are interest-rate risk, currency risk, liquidity risk and credit risk.<br />
All of these risks are handled in accordance with an established financial<br />
policy.<br />
Interest-rate risks<br />
Interest-rate risk refers to the risk that changed interest-rate levels will<br />
affect consolidated earnings and cash flow (cash-flow risks) or the fair<br />
value of financial assets and liabilities (price risks). Matching the interest-fixing<br />
terms of financial assets and liabilities reduces the ex posure.<br />
Interest-rate swaps are used to change/influence the interest-fixing<br />
term for the <strong>Group</strong>’s financial assets and liabilities. Currency interestrate<br />
swaps permit borrowing in foreign currencies from different markets<br />
without introducing currency risk. <strong>Volvo</strong> also has standardized<br />
interest-rate forward contracts (futures) and FRAs (forward-rate<br />
agreements). Most of these contracts are used to hedge interest-rate<br />
levels for short-term borrowing or investment.<br />
Cash-flow risks<br />
<strong>The</strong> effect of changed interest-rate levels on future currency and<br />
interest-rate flows refers mainly to the <strong>Group</strong>’s customer financing<br />
operations and net financial items. Within the customer finance operations<br />
the degree of matching interest-rate fixing on borrowing and<br />
lending is measured. <strong>The</strong> calculation of the matching degree excludes<br />
equity, which in the customer finance operations amount to between<br />
8 and 10%. According to the <strong>Group</strong>’s policy, the degree of matching<br />
for interest-rate fixing on borrowing and lending in the customerfinancing<br />
operations must exceed 80%. At year-end <strong>2010</strong>, the degree<br />
of such matching was 100% (100). A part of the short-term financing<br />
of the customer financing operations can however be pertaining to<br />
internal loans from the industrial operations, why the matching ratio in<br />
the <strong>Volvo</strong> group then may be slightly lower. At year-end <strong>2010</strong>, in addition<br />
to the assets in its customer-financing operations, <strong>Volvo</strong>’s interest-bearing<br />
assets consisted primarily of cash, cash equivalents and<br />
liquid assets invested in short-term interest-bearing securities. <strong>The</strong><br />
objective is to achieve an interest-fixing term of three months for the<br />
liquid assets in <strong>Volvo</strong>’s industrial operations through the use of derivatives.<br />
On December 31, <strong>2010</strong>, after taking derivatives into account,<br />
the average interest on these assets was 2.0% (1.1). After taking<br />
derivatives into account, outstanding loans had interest terms corresponding<br />
to an interest-rate fixing term of three months and the average<br />
interest at year-end amounted to 4.3% (4.1).<br />
Price risks<br />
Exposure to price risks as result of changed interest-rate levels refers<br />
to financial assets and liabilities with a longer interest-rate fixing term<br />
(fixed interest). A comparison of the reported values and the fair values<br />
of all of <strong>Volvo</strong>’s financial assets and liabilities, as well as its derivatives,<br />
is provided in note 37, Financial instruments.<br />
Assuming that the market interest rates for all currencies suddenly<br />
rose by one percentage point (100 interest-rate points) over the interest-rate<br />
level on December 31, <strong>2010</strong>, for the next 12-month period, all<br />
other variables remaining unchanged, <strong>Volvo</strong>’s net interest income<br />
would be negatively impacted by 295 (neg: 354) considering an interest<br />
rate fixing term of three months for receivables and liabilities.<br />
Assuming that the market interest rates for all currencies fell in a<br />
similar manner by one percentage point (100 interest-rate points),<br />
<strong>Volvo</strong>’s net interest income would be positively impacted by a corresponding<br />
amount.<br />
<strong>The</strong> following table shows the effect on income before taxes in<br />
<strong>Volvo</strong>’s key financing currencies if the interest-rate level were to<br />
increase by one percentage point, (100 interest-rate points) not considering<br />
interest rate fixing terms.<br />
SEK M<br />
Effect on income<br />
SEK (46)<br />
USD (76)<br />
EUR 55<br />
CNY 17<br />
JPY (221)<br />
INR 13<br />
<strong>The</strong> above sensitivity analysis is based on assumptions that rarely<br />
occur in reality. It is not unreasonable that market interest rates<br />
change with one percentage point (100 interest-rate points) over a<br />
12-month period. However, in reality, market interest rates usually do<br />
not rise or fall at one point in time. Moreover, the sensitivity analysis<br />
also assumes a parallel shift in the yield curve and an identical effect<br />
105
Financial information <strong>2010</strong><br />
Notes to consolidated financial statements<br />
of changed market interest rates on the interest-rates of both assets<br />
and liabilities. Consequently, the effect of actual interest-rate changes<br />
may deviate from the above analysis.<br />
Currency risks<br />
<strong>The</strong> content of the reported balance sheet may be affected by<br />
changes in different exchange rates. Currency risks in <strong>Volvo</strong>’s operations<br />
are related to changes in the value of contracted and expected<br />
future payment flows (commercial currency exposure), changes in the<br />
value of loans and investments (financial currency exposure) and<br />
changes in the value of assets and liabilities in foreign subsidiaries<br />
(currency exposure of shareholders’ equity). <strong>The</strong> aim of <strong>Volvo</strong>’s currency-risk<br />
management is to minimize, over the short term, negative<br />
effects on <strong>Volvo</strong>’s earnings and financial position stemming from<br />
exchange-rate changes.<br />
Commercial currency exposure<br />
In order to hedge the value of future payment flows in foreign currencies,<br />
<strong>Volvo</strong> uses forward contracts and currency options. In the fourth quarter<br />
of 2009, <strong>Volvo</strong> revised its hedging policy in order to only hedge firm flows,<br />
whereof the major part are realised within six months. Also, from the<br />
fourth quarter of 2009, hedge accounting was not applied for new contracts.<br />
For details regarding Hedge accounting, see note 37.<br />
<strong>The</strong> nominal amount of all outstanding forward and option contracts<br />
amounted to SEK 10.9 billion (17.2) at December 31, <strong>2010</strong>. On<br />
the same date, the fair value of these contracts was positive in an<br />
amount of SEK 118 million (186).<br />
<strong>The</strong> table below presents the effect a change of the value of the<br />
Swedish krona in relation to other currencies would have on the fair<br />
value in the respective currencies of outstanding contracts. In reality,<br />
currencies usually do not change in the same direction at any given<br />
time, so the actual effect of exchange-rate changes may differ from<br />
the below sensitivity analysis.<br />
Change in value of SEK in relation to<br />
all foreign currencies, %<br />
Fair value of<br />
outstanding contracts<br />
(10) (218)<br />
0 118<br />
10 454<br />
Financial currency exposure<br />
Loans and investments in the <strong>Group</strong>’s subsidiaries are done mainly<br />
through <strong>Volvo</strong> Treasury in local currencies, which minimizes individual<br />
companies’ financial currency exposure. <strong>Volvo</strong> Treasury uses various<br />
derivatives, in order to facilitate lending and borrowing in different currencies<br />
without increase the company’s own risk. <strong>The</strong> financial net<br />
position of the <strong>Volvo</strong> <strong>Group</strong> is affected by exchange rate fluctuations,<br />
since financial assets and liabilities are distributed among <strong>Group</strong><br />
companies that conduct their operations in different currencies.<br />
Currency exposure of shareholders’ equity<br />
<strong>The</strong> consolidated value of assets and liabilities in foreign subsidiaries<br />
is affected by current exchange rates in conjunction with translation of<br />
assets and liabilities to Swedish kronor. To minimize currency exposure<br />
of shareholders’ capital, the size of shareholders’ equity in foreign<br />
subsidiaries is continuously optimized with respect to commercial and<br />
legal conditions. Currency hedging of shareholders’ equity may occur<br />
in cases where a foreign subsidiary is considered overcapitalized. Net<br />
assets in foreign subsidiaries and associated companies amounted at<br />
year-end <strong>2010</strong> to SEK 60.3 billion (59.4). Of this amount, SEK 0.8<br />
billion (4.1) was currency-hedged through loans in foreign currencies.<br />
<strong>The</strong> remaining loans used as hedging instruments are due in 2011<br />
and SEK 3.1 billion expired in <strong>2010</strong>. <strong>The</strong> need to undertake currency<br />
hedging relating to investments in associated companies and other<br />
companies is assessed on a case-by-case basis.<br />
Credit risks<br />
<strong>Volvo</strong>’s credit granting is steered by <strong>Group</strong>-wide policies and customer-classification<br />
rules. <strong>The</strong> credit portfolio should contain a sound<br />
distribution among different customer categories and industries. <strong>The</strong><br />
credit risks are managed through active credit monitoring, follow-up<br />
routines and, where applicable, product reclamation. Moreover, regular<br />
monitoring ensures that the necessary provisions are made for<br />
incurred losses on doubtful receivables. In the tables below, ageing<br />
analyses are presented of accounts receivables overdue and customer<br />
finance receivables overdue in relation to the reserves made. It<br />
is not unusual that a receivable is settled a couple of days after due<br />
date, which affects the extent of the age interval 1–30 days.<br />
<strong>The</strong> credit portfolio of <strong>Volvo</strong>’s customer-financing operations<br />
amounted at December 31, <strong>2010</strong>, to approximately net SEK 73 billion<br />
(82). <strong>The</strong> credit risk of this portfolio is distributed over a large number<br />
of retail customers and dealers. Collaterals are provided in the form of<br />
the financed products. Credit granting aims for a balance between<br />
risk exposure and expected yield. <strong>The</strong> <strong>Volvo</strong> <strong>Group</strong>’s financial assets<br />
are largely managed by <strong>Volvo</strong> Treasury and invested in the money and<br />
capital markets. All investments must meet the requirements of low<br />
credit risk and high liquidity. According to <strong>Volvo</strong>’s credit policy, counterparties<br />
for investments and derivative transactions should have a<br />
rating of A or better from one of the well-established credit rating<br />
institutions.<br />
<strong>The</strong> use of derivatives involves a counterparty risk, in that a potential<br />
gain will not be realized if the counterparty fails to fulfill its part of<br />
the contract. To reduce the exposure, master netting agreements are<br />
signed, wherever possible, with the counterparty in question. Counterparty<br />
risk exposure for futures contracts is limited through daily or<br />
monthly cash transfers corresponding to the value change of open<br />
contracts. <strong>The</strong> estimated gross exposure to counterparty risk relating<br />
to futures, interest-rate swaps and interest-rate forward contracts,<br />
options and commodities contracts amounted at December 31, <strong>2010</strong>,<br />
to 331 (588), 3,539 (3,560 ), 190 (167) and 168 (42).<br />
Credit portfolio – Accounts receivable and Customer financing<br />
receivables<br />
Accounts receivable 2009 <strong>2010</strong><br />
Accounts receivable gross 22,638 25,154<br />
Valuation allowance for doubtful<br />
accounts receivable (1,301) (721)<br />
Accounts receivable net 21,337 24,433<br />
For details regarding the accounts receivable and the valuation for<br />
doubtful accounts receivable, refer to note 20.<br />
Customer financing receivables 2009 <strong>2010</strong><br />
Customer financing receivables gross 83,490 74,013<br />
Valuation allowance for doubtful customer<br />
financing receivables (1,513) (1,325)<br />
Customer financing receivables net 81,977 72,688<br />
106
Change of valuation allowances for doubtful<br />
customer financing receivables <strong>2010</strong><br />
Balance sheet, December 31, preceding year 1,513<br />
New valuation allowance charged to income 1,586<br />
Reversal of valuation allowance charged to income (207)<br />
Utilization of valuation allowance related to actual losses (1,451)<br />
Translation differences (116)<br />
Balance sheet, December 31 1,325<br />
For details regarding the long-term customer-financing receivables<br />
and the short-term customer receivables, refer to note 16 and 19.<br />
Age analysis of portfolio value – Accounts receivable and Customer financing receivables (days/SEK M)<br />
2009 <strong>2010</strong><br />
Accounts receivable not due 1–30 31–90 >90 Total not due 1–30 31–90 >90 Total<br />
Accounts receivable gross 19,705 1,032 616 1,285 22,638 23,324 799 391 640 25,154<br />
Valuation allowance for doubtful<br />
accounts receivable (493) (37) (46) (725) (1,301) (205) (26) (26) (464) (721)<br />
Accounts receivable not<br />
recognized as impairment losses 19,212 995 570 560 21,337 23,119 773 365 176 24,433<br />
2009 <strong>2010</strong><br />
Customer financing receivables<br />
payments due not due 1–30 31–90 >90 Total not due 1–30 31–90 >90 Total<br />
Overdue amount – 655 560 740 1,955 – 490 405 805 1,700<br />
Valuation allowance for doubtful<br />
customer financing receivables (99) (111) (159) (313) (682) (91) (56) (74) (308) (530)<br />
Customer financing receiv ables<br />
not recognized as impairment<br />
losses (99) 544 401 427 1,273 (91) 434 331 497 1,170<br />
<strong>The</strong> table above presents overdue payments within the customer<br />
financing operations in relation to specific reserves. <strong>The</strong> total contractual<br />
amount that the overdue payments are pertaining to are presented<br />
in the table below. In order to provide for occured but not yet<br />
identified customer financing receivables overdue, there are additional<br />
reserves of 795 (831). <strong>The</strong> remaining exposure is secured by<br />
liens on the purchased equipment, and, in certain circumstances,<br />
other credit enhancements such as personal guarantees, credit insurance,<br />
liens on other property owned by the borrower etc.<br />
Collaterals taken in possession that meet the recognition criteria<br />
amounted to 594 (1,391) at December 31, <strong>2010</strong>.<br />
Customer financing<br />
2009 <strong>2010</strong><br />
receivables total contractual<br />
amount<br />
not due 1–30 31–90 >90 Total not due 1–30 31–90 >90 Total<br />
Customer financing receiv ables 67,692 7,886 4,511 3,401 83,490 63,153 6,425 2,369 2,066 74,013<br />
Renegotiated financial assets<br />
Financial assets that would otherwise have been overdue whose<br />
terms have been renegotiated amount to 6,578 (8,948) and are<br />
mainly related to renegotiated customer contracts within the customer<br />
finance operations.<br />
107
Financial information <strong>2010</strong><br />
Notes to consolidated financial statements<br />
Concentration of credit risk<br />
Customer concentration<br />
<strong>The</strong> ten largest customers in Customer Finance account for 5.8%<br />
(4.8) of the total asset portfolio. <strong>The</strong> rest of the portfolio is pertinent<br />
to a large number of customer. This way the credit risk is spread<br />
across both many markets and among many customers.<br />
Concentration by geographical market<br />
<strong>The</strong> table below shows the concentration of the customer financing<br />
portfolio divided into geographical markets.<br />
Geographical market Percentage of customer financing portfolio<br />
Europe 47.0<br />
North America 27.3<br />
Asia 9.9<br />
Other markets 15.8<br />
Liquidity risks<br />
<strong>Volvo</strong> assures itself of sound financial preparedness by always keeping a<br />
certain percentage of its sales in liquid assets. A sound balance between<br />
short- and long-term borrowing, as well as borrowing preparedness in the<br />
form of overdraft facilities, are intended to meet long-term financing<br />
needs.<br />
<strong>The</strong> table below shows expected future cash-flows including derivatives<br />
related to financial liabilities. Capital flow refers to expected<br />
payments of loans and derivatives. Interest flow refers to the future<br />
interest payments on loans and derivatives based on interests rates<br />
expected by the market. <strong>The</strong> interest flow is reported within cash flow<br />
from operating activities.<br />
See also note 26 for long-term loans maturity analysis and for<br />
credit facilities granted but not utilized as well as note 31 for contractual<br />
duration analysis of future rental payments of noncancellable<br />
finance lease agreements and operating lease agreements.<br />
Future cash-flow including derivatives<br />
related to financial liabilities Capital flow Interest flow<br />
2011 (39,199) (4,842)<br />
2012 (23,497) (3,382)<br />
2013 (13,422) (2,650)<br />
2014 (17,723) (1,718)<br />
2015 (10,210) (1,135)<br />
2016 (6,476) (684)<br />
2017– (12,548) (291)<br />
108
Note 37Financial instruments<br />
<strong>The</strong> financial assets treated within the framework of IAS 39 are classified<br />
either as financial assets at fair value through profit and loss, as<br />
loans and receivables, as investments held to maturity or as availablefor-sale<br />
financial assets. Financial liabilities are classified as financial<br />
liabilities at fair value through profit and loss or as financial liabilities<br />
valued at amortized cost. For more information about the categories<br />
within Financial assets and liabilities see note 1.<br />
Information regarding reported and fair values<br />
In the table below, carrying values are compared with fair values of financial instruments.<br />
December 31, 2009 December 31, <strong>2010</strong><br />
Carrying value Fair value Carrying value Fair value<br />
Assets<br />
Financial assets at fair value through profit and loss<br />
<strong>The</strong> <strong>Volvo</strong> <strong>Group</strong>’s outstanding currency risk contracts – commercial exposure 467 467 197 197<br />
<strong>The</strong> <strong>Volvo</strong> <strong>Group</strong>’s outstanding raw materials contracts 42 42 168 168<br />
<strong>The</strong> <strong>Volvo</strong> <strong>Group</strong>’s outstanding interest risk contracts – financial exposure 3,848 3,848 3,863 3,863<br />
Marketable securities 16,676 16,676 9,767 9,767<br />
21,033 21,033 13,995 13,995<br />
Loans receivable and other receivables<br />
Accounts receivable 21,337 – 24,433 –<br />
Customer financing receivables 3 81,977 – 72,688 –<br />
Loans to external parties and other interest-bearing receivables 349 – 253 –<br />
Conduit loans and other interest-bearing loans 131 – 104 –<br />
103,794 – 97,478 –<br />
Financial assets available for sale<br />
Shares and participations for which:<br />
a market value can be calculated 1 707 707 836 836<br />
a market value can not be calculated 2 1,337 – 1,262 –<br />
2,044 707 2,098 836<br />
Cash and cash equivalents 21,234 21,234 22,966 22,966<br />
Liabilities<br />
Financial liabilities at fair value through profit and loss<br />
<strong>The</strong> <strong>Volvo</strong> <strong>Group</strong>'s outstanding currency risk contracts – commercial exposure 281 281 79 79<br />
<strong>The</strong> <strong>Volvo</strong> <strong>Group</strong>’s outstanding raw materials contract 58 58 41 41<br />
<strong>The</strong> <strong>Volvo</strong> <strong>Group</strong>'s outstanding interest risk contracts – financial exposure 3,285 3,285 4,487 4,487<br />
3,624 3,624 4,607 4,607<br />
Financial liabilities valued at amortized cost<br />
Long term bond loans and other loans 105,427 112,733 82,679 88,304<br />
Short term bank loans and other loans 51,448 51,943 39,142 39,379<br />
156,875 164,676 121,821 127,683<br />
Trade Payables 35,955 – 47,250 –<br />
1 Refers to <strong>Volvo</strong>’s ownership in Deutz AG valued at market value and Trucks<br />
Asia’s holdings in listed shares. <strong>The</strong> carrying value is equal to the market<br />
value for holdings in listed companies<br />
2 Possession in unlisted shares, for which a reliable fair value cannot be determined,<br />
are reported at the acquisition value reduced in appropriate cases by<br />
write-downs. No single block of shares represent a significant amount.<br />
3 <strong>Volvo</strong> does not estimate the risk premium for the customer financing receivables<br />
and chooses therefore not to disclose fair value for this category.re<br />
not to disclose fair value for this category.<br />
109
Financial information <strong>2010</strong><br />
Notes to consolidated financial statements<br />
Financial assets and liabilities measured at fair value<br />
December 31, 2009 December 31, <strong>2010</strong><br />
Assets Level 1 Level 2 Level 3 Total Level 1 Level 2 Level 3 Total<br />
Financial assets<br />
at fair value through profit and loss<br />
Currency risk contracts<br />
– commercial exposure – 467 – 467 – 197 – 197<br />
Raw materials contracts – 42 – 42 – 168 – 168<br />
Interest risk contracts<br />
– financial exposure – 3,848 – 3,848 – 3,863 – 3,863<br />
Marketable securities – 16,676 – 16,676 – 9,767 – 9,767<br />
Available for sale financial assets<br />
Shares and participations for which:<br />
a market value can be calculated 707 – – 707 836 – – 836<br />
Total 707 21,033 – 21,740 836 13,995 14,831<br />
Liabilities<br />
Financial liabilities<br />
at fair value through profit and loss<br />
Currency risk contracts<br />
– commercial exposure – 281 – 281 – 79 – 79<br />
Raw materials contracts – 58 – 58 – 41 – 41<br />
Interest risk contracts<br />
– financial exposure – 3,285 – 3,285 – 4,487 – 4,487<br />
Total – 3,624 – 3,624 – 4,607 – 4,607<br />
<strong>The</strong> levels in the table above reflect to what extent market values have<br />
been used when valuating financial assets and liabilities. Financial<br />
instruments in level 1 are valued based on unadjusted quoted market<br />
prices for identical assets or liabilities. Level 2 instruments are valued<br />
based on inputs, other than quoted prices within level 1, that are<br />
observable either directly (as prices) or indirectly (derived from prices).<br />
Level 3 instruments would be valued based on unobservable inputs,<br />
i.e. using a valuation technique based on assumptions. <strong>Volvo</strong> has no<br />
financial instruments classified as level 3 instruments.<br />
Derecognition of financial assets<br />
Financial assets that have been transferred in such a way that part or<br />
all of the financial assets do not qualify for derecognition, are included<br />
in reported assets of the <strong>Volvo</strong> <strong>Group</strong>. In accordance with IAS 39<br />
Financial Instruments, Recognition and Measurement, an evaluation<br />
is made whether substantially all the risks and rewards have been<br />
transferred to an external party. When <strong>Volvo</strong> has concluded that it is<br />
not the case, the part of the financial assets that reflect <strong>Volvo</strong>’s continuous<br />
involvement are being recognized. On December 31, <strong>2010</strong>,<br />
<strong>Volvo</strong> recognizes SEK 1.2 billion (2.2) corresponding to <strong>Volvo</strong>’s continuous<br />
involvement, mostly within the customer financing operations.<br />
110
Gains, losses, interest income and expenses related to financial instruments<br />
<strong>The</strong> table below shows how gains and losses as well as interest income and expense have affected income after financial items in the <strong>Volvo</strong><br />
<strong>Group</strong> divided on the different categories of financial instruments.<br />
2009 <strong>2010</strong><br />
Gains/<br />
Losses<br />
Interest<br />
income<br />
Interest<br />
expenses<br />
Gains/<br />
Losses<br />
Interest<br />
income<br />
Interest<br />
expenses<br />
Financial assets and liabilities<br />
at fair value through profit and loss 1<br />
Marketable securities 248 0 0 290 0 0<br />
Derivatives for financial exposure (1,272) 0 0 319 0 0<br />
Loans receivable and other receivables 0 10 0 0 7 0<br />
Financial assets available for sale<br />
Shares and participations for which<br />
a market value can be calculated 11 – – 40 – –<br />
Shares and participations for which<br />
a market value cannot be calculated 19 – – 10 – –<br />
Cash and cash equivalents 0 299 0 0 423 0<br />
Financial liabilities valued at amortized cost 0 0 (6,007) 0 0 (5,486)<br />
Effect on income (994) 309 (6,007) 659 430 (5,486)<br />
1 Accrued and realized interest is included in gains and losses related to Financial assets and liabilities at fair value through profit and loss.<br />
Accrued and realized interest on derivates for commercial exposure is neg 17 (neg: 68).<br />
Net effect of foreign exchange gains and losses<br />
Foreign exchange gains and losses pertaining to financial instruments have affected income after financial items in<br />
the <strong>Volvo</strong> <strong>Group</strong> according to the table below:<br />
2009 <strong>2010</strong><br />
Derivatives for financial exposure (1,205) (1,545)<br />
Cash and cash equivalents 1 – (274)<br />
Loans originated by the company and financial liabilities value at amortized cost - <strong>Volvo</strong> internal 958 1,560<br />
Effect on income (247) (259)<br />
1 <strong>The</strong> net effect of forein exchange gains and losses on Cash and cash equivalents pertains to the devaluation in Venezuela, loss 274.<br />
Net effect of foreign exchange gains and losses on derivatives for commercial exposure have affected operating income in the <strong>Volvo</strong> group with 676 (neg: 3,322).<br />
Various categories of financial instruments are treated separately in<br />
specific notes. See note 15 for Shares and participations, notes 16<br />
and 19 for Customer-financing receivables, note 20 for Other shortterm<br />
receivables, note 21 for Marketable securities, note 22 for Cash<br />
and cash equivalents, note 26 for Non-current liabilities and note 27<br />
for Current liabilities.<br />
111
Financial information <strong>2010</strong><br />
Notes to consolidated financial statements<br />
Below is a presentation of derivative instruments and options.<br />
Outstanding derivative instruments for dealing with currency<br />
and interest-rate risks related to financial assets and liabilities<br />
Dec 31, 2009 Dec 31, <strong>2010</strong><br />
Notional<br />
amount<br />
Carrying<br />
value<br />
Notional<br />
amount<br />
Carrying<br />
value<br />
Interest-rate swaps<br />
– receivable<br />
position 64,162 3,560 70,067 3,539<br />
– payable<br />
position 100,460 (2,948) 65,576 (3,924)<br />
Forwards and futures<br />
– receivable<br />
position 0 0 900 0<br />
– payable<br />
position 30,274 (3) 400 0<br />
Foreign exchange derivative contracts<br />
– receivable<br />
position 16,165 172 13,336 143<br />
– payable<br />
position 15,424 (214) 25,192 (381)<br />
Options purchased<br />
– receivable<br />
position 1,985 116 1,126 181<br />
– payable<br />
position 353 (3) 0 0<br />
Options written<br />
– receivable<br />
position 13 0 0 0<br />
– payable<br />
position 2,572 (117) 976 (182)<br />
Total 563 (624)<br />
Outstanding forward contracts and options contracts for<br />
hedging of currency risk and interest risk of commercial<br />
receivables and liabilities<br />
Dec 31, 2009 Dec 31, <strong>2010</strong><br />
Notional<br />
amount<br />
Carrying<br />
value<br />
Notional<br />
amount<br />
Carrying<br />
value<br />
Foreign exchange derivative contracts<br />
– receivable<br />
position 9,307 416 6,418 188<br />
– payable<br />
position 5,448 (281) 3,381 (75)<br />
Options purchased<br />
– receivable<br />
position 1,222 51 558 9<br />
– payable<br />
position – – – –<br />
Options written<br />
– receivable<br />
position – – – –<br />
– payable<br />
position 1,193 – 558 (4)<br />
Subtotal 186 118<br />
Raw materials derivative contracts<br />
– receivable<br />
position 367 42 579 168<br />
– payable<br />
position 106 (58) 39 (41)<br />
Total 170 245<br />
112
Hedge accounting<br />
Cash-flow hedging<br />
<strong>Volvo</strong> only hedges firm flows whereof the major part is realized within<br />
six months. <strong>The</strong> hedged amount of firm flows for all periods are within<br />
the framework of <strong>Volvo</strong>’s currency policy.<br />
Derivative financial instruments used for hedging of future commercial<br />
currency exposure that is firm and forecasted electricity consumption<br />
have, in accordance with IAS 39, been reported at fair value<br />
in the balance sheet. Since the fourth quarter 2009 hedge accounting<br />
is not applied on new financial instruments used for hedging of<br />
commercial flows. However, for the major part of previously entered<br />
financial instruments hedge accounting is continuously applied. <strong>The</strong><br />
majority of those financial instruments have expired during the year.<br />
When hedge accounting is not applied, unrealized gains and losses<br />
from fluctuations in the fair values of the financial instruments are<br />
reported in the income statement in the segment <strong>Group</strong> headquarter<br />
functions and other. This has positivley affected the <strong>Group</strong>’s operating<br />
income by 124 (neg: 27) in <strong>2010</strong>. When the derivative financial instrument<br />
has been realized the income effect is reported within the<br />
respective segments.<br />
When cash-flow hedge accounting is applied for previously entered<br />
financial instruments <strong>Volvo</strong> tests for effectiveness. Hedging is considered<br />
to be effective when the forecasted future cash flow’s currency<br />
fluctuation and maturity date coincide with those of the financial<br />
instrument. <strong>The</strong> hedging relationship is regularly tested up until its<br />
maturity date. If the identified relationships are no longer deemed<br />
effective, the currency fluctuations on the hedging instrument from<br />
the last period the instrument was considered effective are reported<br />
in the <strong>Group</strong>’s income statement. For <strong>2010</strong>, <strong>Volvo</strong> reported 4 (loss 36)<br />
as a gain related to the ineffectiveness of cash-flow hedging.<br />
As of January 1, 2011 unrealized changes in fair value of financial<br />
instruments related to a receivable or payable will be reported within<br />
the respective segments. All other unrealized changes in fair value of<br />
financial instruments will henceforth be reported in the income statement<br />
in the segment <strong>Group</strong> headquarter functions and other.<br />
Hedge accounting is applied on the financial instruments hedging<br />
forecasted electricity consumption. <strong>The</strong> fair value is debited or credited<br />
to a separate component in other comprehensive income to the<br />
extent the requirements for cash-flow hedge accounting are fulfilled.<br />
Accumulated changes in the value of the hedging instruments are<br />
reported in the income statement of the same time as the underlying<br />
hedged transaction affects the <strong>Group</strong>s results. <strong>The</strong> table in note 23,<br />
Shareholders’ equity shows how the electricity consumption reserve<br />
has changed during the year. To the extent that the requirements for<br />
hedge accounting are not met, any changes in the value attributable<br />
to derivatives are immediately charged to the income statement.<br />
Hedging of forecasted electricity is considered to be effective<br />
when predetermined factors that affect electricity prices are in agreement<br />
with forecasts of future electricity consumption and designated<br />
derivative instruments. <strong>The</strong> hedging relationship is regularly tested up<br />
until its maturity date. If the identified relationships are no longer<br />
deemed effective, the currency fluctuations on the hedging instrument<br />
from the last period the instrument was considered effective are<br />
reported in the <strong>Group</strong>’s income statement. For 2009, <strong>Volvo</strong> reported<br />
4 (4) related to the ineffectiveness of the hedging of forecasted electricity<br />
consumption.<br />
Hedging of currency and interest rate risks on loans<br />
<strong>Volvo</strong> has chosen to apply hedge accounting for a loan of approximately<br />
EUR 1 billion borrowed in the second quarter of 2007. Fair<br />
value of the outstanding hedge instrument amounts to 1,168 (1,159).<br />
<strong>The</strong> carrying value of the loan related to hedge accounting amounts<br />
to a negative 977 (neg: 970). <strong>The</strong> changes in the fair value of the<br />
outstanding hedge instruments and the changes in the carrying value<br />
of the loan are reported in the income statement.<br />
Changes in market value on the instruments used for hedging of<br />
risk in financial assets and liabilities for which hedge accounting has<br />
not been applied are reported in net financial income and expense,<br />
see note 11. In the future, in applicable cases when the requirements<br />
for hedge accounting are considered to be fulfilled, <strong>Volvo</strong> will consider<br />
to apply hedge accounting for this kind of instruments.<br />
Hedging of net investments in foreign operations<br />
<strong>Volvo</strong> applies hedge accounting for certain net investments in foreign<br />
operations. Current earnings from such hedging shall be accounted<br />
for in a separate item within shareholders’ equity. A total of negative<br />
202 (neg 314) in shareholders’ equity relating to hedging of net<br />
investments in foreign operations was reported in <strong>2010</strong>.<br />
<strong>The</strong> <strong>Volvo</strong> <strong>Group</strong>’s outstanding forward contracts and options contracts for hedging of commercial currency risks<br />
Other<br />
Currencies<br />
currencies<br />
Million USD GBP EUR JPY Net SEK<br />
Due date 2011 amount 687 68 93 (2,488) 570<br />
Due date 2012 amount (4) – – – 313<br />
Due date 2013 amount (3) – – – 20<br />
Total 680 68 93 (2,488) 903<br />
Fair<br />
value<br />
Average contract rate 7.04 11.03 9.37 0.08<br />
Fair value of outstanding forward contracts 85 14 28 3 (12) 118<br />
<strong>The</strong> hedged amount of firm flows for all periods are within the framework of <strong>Volvo</strong>’s currency policy.<br />
113
Financial information <strong>2010</strong><br />
Parent Company AB <strong>Volvo</strong><br />
Corporate registration number 556012-5790.<br />
Amounts in SEK M unless otherwise specified. Amounts within parentheses<br />
refer to preceding year.<br />
Board of Directors’ report<br />
AB <strong>Volvo</strong> is Parent Company of the <strong>Volvo</strong> <strong>Group</strong> and its operations comprise<br />
the <strong>Group</strong>’s head office with staff together with some corporate<br />
functions.<br />
Income from investments in <strong>Group</strong> companies includes dividends<br />
amounting to 8,145 (10,275) and <strong>Group</strong> contributions and transfer price<br />
adjustments, net of 5,126 (neg: 16,859). Dividends were received from<br />
<strong>Volvo</strong> Holding Sverige AB, 5,200, <strong>Volvo</strong> Construction Equipment NV,<br />
1,801 and from <strong>Volvo</strong> Korea Holding AB, 1,000.<br />
<strong>The</strong> carrying value of shares and participations in <strong>Group</strong> companies<br />
amounted to 59,429 (57,062), of which 58,903 (56,536) pertained to<br />
shares in wholly owned subsidiaries. <strong>The</strong> corresponding shareholders’<br />
equity in the subsidiaries (including equity in untaxed reserves but excluding<br />
minority interests) amounted to 90,261 (91,944).<br />
In <strong>2010</strong> shareholders’ contributions were made to <strong>Volvo</strong> <strong>Group</strong> Japan<br />
Corporation, 3,493, consisting of preference shares in UD Trucks Corporation,<br />
and to Kommersiella Fordon Europa AB, 1,801.<br />
Other shares and participations include the direct and indirect ownership<br />
in <strong>Volvo</strong> Eicher Commercial Vehicles (VECV) for total amount of<br />
1,845. In the consolidated accounts of the <strong>Volvo</strong> <strong>Group</strong>, VECV is reported<br />
as a joint venture and consolidated according to the proportional method.<br />
<strong>The</strong> indirect ownership is an effect of the acquisition of 8.1% of Eicher<br />
Motors Limited, which is the other venturer of VECV. <strong>The</strong>se shares are not<br />
separately valued as they form a part of the indirect ownership in VECV.<br />
Shares and participations in non-<strong>Group</strong> companies included 170<br />
(206) in associated companies that are reported in accordance with<br />
the equity method in the consolidated accounts. <strong>The</strong> portion of shareholders’<br />
equity in associated companies accruing to AB <strong>Volvo</strong> totaled<br />
322 (300). Shares and participations in non-<strong>Group</strong> companies include<br />
listed shares in Deutz AG with a carrying value of 458, corresponding<br />
to the quoted market price at year-end. In <strong>2010</strong> revaluation of the<br />
ownership has increased the value by 172, recognized in equity and<br />
included in Other comprehensive income in the income statement.<br />
Financial net debt amounted to 30,376 (18,922).<br />
AB <strong>Volvo</strong>’s risk capital (shareholders’ equity plus untaxed reserves)<br />
amounted to 41,857 corresponding to 54% of total assets. <strong>The</strong> comparable<br />
figure at year-end 2009 was 45%.<br />
Income statement<br />
SEK M 2009 <strong>2010</strong><br />
Net sales Note 2 698 564<br />
Cost of sales Note 2 (698) (564)<br />
Gross income 0 0<br />
Administrative expenses Note 2, 3 (485) (652)<br />
Other operating income and expenses Note 4 (13) 8<br />
Income from investments in <strong>Group</strong> companies Note 5 (6,584) 13,252<br />
Income from investments in associated companies Note 6 4 (94)<br />
Income from other investments Note 7 2 3<br />
Operating income (7,076) 12,517<br />
Interest income and similar credits Note 8 1 0<br />
Interest expenses and similar charges Note 8 (393) (893)<br />
Other financial income and expenses Note 9 (8) (65)<br />
Income after financial items (7,476) 11,559<br />
Allocations Note 10 700 0<br />
Income taxes Note 11 4,537 (1,231)<br />
Income for the period (2,239) 10,328<br />
Other comprehensive income<br />
Income for the period (2,239) 10,328<br />
Available-for-sale investments 74 172<br />
Other comprehensive income, net of income taxes 74 172<br />
Total comprehensive income for the period (2,165) 10,500<br />
114
Balance sheet<br />
SEK M December 31, 2009 December 31, <strong>2010</strong><br />
Assets<br />
Non-current assets<br />
Intangible assets Note 12 96 103<br />
Tangible assets Note 12 16 16<br />
Financial assets<br />
Shares and participations in <strong>Group</strong> companies Note 13 57,062 59,429<br />
Other shares and participations Note 13 2,363 2,498<br />
Deferred tax assets Note 11 4,712 3,657<br />
Other long-term receivables 0 64,137 0 65,584<br />
Total non-current assets 64,249 65,703<br />
Current assets<br />
Short-term receivables from <strong>Group</strong> companies 4,707 12,226<br />
Current tax receivables 0 0<br />
Other short-term receivables Note 14 247 261<br />
Cash and bank accounts 0 0<br />
Total current assets 4,954 12,487<br />
Total assets 69,203 78,190<br />
Shareholders’ equity and liabilities<br />
Shareholders’ equity<br />
Restricted equity<br />
Share capital (2,128,420,220 shares, quota value SEK 1.20) 2,554 2,554<br />
Statutory reserve 7,337 9,891 7,337 9,891<br />
Unrestricted equity<br />
Non-restricted reserves 211 383<br />
Retained earnings 23,490 21,251<br />
Income for the period (2,239) 21,462 10,328 31,962<br />
Total shareholders’ equity 31,353 41,853<br />
Untaxed reserves Note 15 4 4<br />
Provisions<br />
Provisions for pensions Note 16 136 133<br />
Other provisions 0 136 1 134<br />
Non-current liabilities Note 17<br />
Liabilities to <strong>Group</strong> companies 7 7<br />
Other non-current liabilities – 7 10 17<br />
Current liabilities<br />
Trade payables 94 78<br />
Other liabilities to <strong>Group</strong> companies 37,370 35,835<br />
Other current liabilities Note 18 239 37,703 269 36,182<br />
Total shareholders' equity and liabilities 69,203 78,190<br />
Assets pledged – –<br />
Contingent liabilities Note 19 254,299 250,606<br />
115
Financial information <strong>2010</strong><br />
Changes in Shareholders’ equity<br />
Restricted equity Unrestricted equity Total<br />
SEK M<br />
Share<br />
capital<br />
Statutory<br />
reserve<br />
Share<br />
premium<br />
reserve<br />
Fair value<br />
reserve<br />
Retained<br />
earnings Total<br />
shareholders’<br />
equity<br />
Balance at December 31, 2008 2,554 7,337 188 (53) 27,543 27,678 37,569<br />
Income for the period - – – – (2,239) (2,239) (2,239)<br />
Other comprehensive income<br />
Available-for-sale investments:<br />
Gain/(loss) at valuation to fair value – – – 74 – 74 74<br />
Other comprehensive income – – – 74 – 74 74<br />
Total income for the period – – – 74 (2,239) (2,165) (2,165)<br />
Transactions with shareholders<br />
Cash dividend – – – – (4,055) (4,055) (4,055)<br />
Share-based payments – – 2 – 2 4 4<br />
Transactions with shareholders – – 2 – (4,053) (4,051) (4,051)<br />
Balance at December 31, 2009 2,554 7,337 190 21 21,251 21,462 31,353<br />
Income for the period – – – – 10,328 10,328 10,328<br />
Other comprehensive income<br />
Available-for-sale investments:<br />
Gain/(loss) at valuation to fair value – – – 172 – 172 172<br />
Other comprehensive income – – – 172 – 172 172<br />
Total income for the period – – – 172 10,328 10,500 10,500<br />
Balance at December 31, <strong>2010</strong> 2,554 7,337 190 193 31,579 31,962 41,853<br />
Further information regarding the share capital of the Parent Company is shown in Note 23 to the consolidated financial statements.<br />
116
Cash-flow statement<br />
SEK M 2009 <strong>2010</strong><br />
Operating activities<br />
Operating income (7,076) 12,517<br />
Depreciation and amortization 14 16<br />
Other adjustments of operating income Note 20 15,361 (20,543)<br />
Changes in working capital:<br />
(Increase)/decrease in receivables (48) 148<br />
Increase/(decrease) in liabilities and provisions (27) (6)<br />
Interest and similar items received 45 0<br />
Interest and similar items paid (431) (888)<br />
Other financial items (8) (65)<br />
Income taxes (paid)/received 423 (176)<br />
Cash-flow from operating activities 8,253 (8,997)<br />
Investing activities<br />
Investments in fixed assets 0 (11)<br />
Shares and participations in <strong>Group</strong> companies, net Note 20 (11,091) (2,386)<br />
Shares and participations in non-<strong>Group</strong> companies, net Note 20 (1) (11,092) (63) (2,460)<br />
Cash-flow after net investments (2,839) (11,457)<br />
Financing activities<br />
Increase/(decrease) in loans Note 20 6,894 11,457<br />
Cash payment to AB <strong>Volvo</strong> shareholders (4,055) 2,839 – 11,457<br />
Change in liquid funds 0 0<br />
Liquid funds, January 1 0 0<br />
Liquid funds, December 31 0 0<br />
Liquid funds<br />
Liquid funds include cash and bank balances.<br />
117
Financial information <strong>2010</strong><br />
Notes and comments<br />
General information<br />
Amounts in SEK M unless otherwise specified. <strong>The</strong> amounts within parentheses refer to the preceding year, 2009.<br />
Note 1 Accounting principles<br />
<strong>The</strong> accounting principles applied by <strong>Volvo</strong> are described in note 1 to<br />
the consolidated financial statements.<br />
<strong>The</strong> Parent Company also applies RFR 2 including the exception in<br />
the application of IAS 39 which concerns accounting and valuation<br />
of financial contracts of guarantee in favour of subsidiaries and associated<br />
companies. <strong>The</strong> Parent Company decided to early adopt the presentation<br />
of comprehensive income applied as of <strong>2010</strong>, from January 1,<br />
2009.<br />
<strong>The</strong> share-based incentive programs adopted at the <strong>Annual</strong> General<br />
Meeting from 2004–2009 are covered by IFRS 2 Share-based<br />
payments.<br />
<strong>The</strong> <strong>Volvo</strong> <strong>Group</strong> has adopted IAS 19 Employee Benefits in its<br />
financial reporting. <strong>The</strong> Parent Company is still applying the principles<br />
of FAR SRS’s Recommendation No. 4 “Accounting of pension liabilities<br />
and pension costs” as in previous years. Consequently there are<br />
differences between the <strong>Volvo</strong> <strong>Group</strong> and the Parent Company in the<br />
accounting for defined-benefit pension plans as well as in valuation of<br />
plan assets invested in the <strong>Volvo</strong> Pension Foundation.<br />
<strong>The</strong> difference between depreciation according to plan and tax<br />
depreciation is reported as accumulated additional depreciation,<br />
which is included in untaxed reserves. In the consolidated balance<br />
sheet a split is made between deferred tax liability and equity.<br />
<strong>Report</strong>ing of <strong>Group</strong> contributions is in accordance with UFR 2,<br />
a statement issued by the Swedish Financial <strong>Report</strong>ing Board. <strong>Group</strong><br />
contributions are reported among Income from investments in <strong>Group</strong><br />
companies.<br />
Note 2 Intra-<strong>Group</strong> transactions<br />
Of the Parent Company’s net sales, 499 (578) pertained to <strong>Group</strong> companies while purchases from <strong>Group</strong> companies amounted to 449 (357).<br />
Note 3 Administrative expenses<br />
Depreciation<br />
Administrative expenses include depreciation of 16 (14) of which 1 (0)<br />
pertains to machinery and equipment, 0 (0) to buildings and 15 (14) to<br />
other intangible assets.<br />
Fees to the auditors 2009 <strong>2010</strong><br />
PricewaterhouseCoopers<br />
– Audit fees 17 17<br />
– Audit-related fees 1 1<br />
– Tax advisory services 1 0<br />
Total 19 18<br />
See note 35 for the <strong>Group</strong> for a description of the different categories<br />
of fees to the auditiors.<br />
Personnel<br />
Wages, salaries and other remunerations amounted to 211 (160).<br />
Social costs amounted to 142 (87) of which pension costs, 104 (55).<br />
Of the pension costs, 9 (8) pertained to Board members and Presidents.<br />
<strong>The</strong> Parent Company does not have any outstanding pension<br />
obligations to these individuals.<br />
<strong>The</strong> number of employees at year-end was 198 (190). Information on<br />
the average number of employees, wages, salaries and other remunerations<br />
including option programs as well as Board members and<br />
senior executives by gender is shown in note 34 to the consolidated<br />
financial statements.<br />
Absence due to illness 2009 <strong>2010</strong><br />
Total absence due to illness in percentage<br />
of regular working hours 1.2 1.1<br />
of which, continuous sick leave for 60 days<br />
or more, % 21.4 41.4<br />
Absence due to illness in percentage of<br />
regular working hours<br />
Men, % 0.7 1.1<br />
Women, % 1.8 1.1<br />
29 years or younger, % 0.2 3.0<br />
30–49 years, % 1.2 1.1<br />
50 years or older, % 1.3 0.9<br />
118
Note 4 Other operating income and expenses<br />
Other operating income and expenses include profit-sharing payments to employees in the amount of 1 (1).<br />
Note 5 Income from investments in <strong>Group</strong> companies<br />
Of the income reported, 8,145 (10,275) pertain to dividends from<br />
<strong>Group</strong> companies. Of the dividends, 5,200 (6,000) pertain to dividend<br />
from <strong>Volvo</strong> Holding Sverige AB, 1,801 (–) from <strong>Volvo</strong> Construction<br />
Equipment NV and 1,000 (2,000) from <strong>Volvo</strong> Korea Holding AB. <strong>The</strong><br />
shares in Alviva AB were written down by 19.<br />
Transfer price adjustments and <strong>Group</strong> contributions total a net of<br />
5,126 (neg 16,859).<br />
Note 6 Income from investments in associated companies<br />
Income from associated companies that are reported in the <strong>Group</strong> accounts in accordance with the equity method amounted to a negative 94 (4).<br />
Dividend of 14 (–) was received from VE Commercial Vehicles. <strong>The</strong> participations in Blue Chip Jet I HB and Blue Chip Jet II HB have effected the<br />
income with 8 (neg: 4) and a negative 116 (8) respectively.<br />
Note 7 Income from other investments<br />
A dividend of 2 (2) reveived from Eicher Motors Ltd. is included in Income from other investments.<br />
Note 8 Interest income and expenses<br />
Interest income and similar credits amounting to 0 (1) included interest in the amount of 0 (0) from subsidiaries, and interest expenses and<br />
similar charges totalling 893 (393) included interest of 888 (386) to subsidiaries.<br />
Note 9 Other financial income and expenses<br />
Other financial income and expenses include guarantee commissions<br />
from subsidiaries, costs for credit facilities, costs for credit rating,<br />
financial costs pertaining to changed taxable income previous years<br />
and costs of having <strong>Volvo</strong> shares registered.<br />
Note 10 Allocations<br />
2009 <strong>2010</strong><br />
Allocation to additional depreciation 0 0<br />
Tax allocation reserve 700 –<br />
Total 700 0<br />
119
Financial information <strong>2010</strong><br />
Notes and comments<br />
Note 11 Income taxes<br />
2009 <strong>2010</strong><br />
Current taxes 59 (176)<br />
Deferred taxes 4,478 (1,055)<br />
Total income taxes 4,537 (1,231)<br />
Current taxes relate to prior periods.<br />
Claims as a consequence of tax audit carried out previously for which<br />
provisions are not deemed necessary amount to – (249). <strong>The</strong> amount<br />
is included in contingent liabilities.<br />
Deferred taxes relate to estimated tax on the change in tax-loss<br />
carryforwards and temporary differences. Deferred tax assets are<br />
reported to the extent that it is probable that the amount can be utilized<br />
against future taxable income.<br />
Deferred taxes related to change in tax-loss carryforwards amount<br />
to an expense of 1,063 (4,472) and to changes in other temporary<br />
differences to 8 (6).<br />
<strong>The</strong> table below shows the principal reasons for the difference<br />
between the corporate income tax of 26.3% and the tax for the period.<br />
2009 <strong>2010</strong><br />
Income before taxes (6,776) 11,559<br />
Income tax according to applicable tax rate 1,782 (3,040)<br />
Capital gains/losses 0 0<br />
Non-taxable dividends 2,703 2,146<br />
Non-taxable revaluations of shareholdings (1) (8)<br />
Other non-deductible expenses (23) (156)<br />
Other non-taxable income 17 3<br />
Adjustment of current taxes for prior periods 59 (176)<br />
Income taxes for the period 4,537 (1,231)<br />
Specification of deferred tax assets 2009 <strong>2010</strong><br />
Tax-loss carryforwards 4,550 3,487<br />
Valuation allowance for doubtful receivables 1 1<br />
Provision for post-employment benefits 161 169<br />
Deferred tax assets 4,712 3,657<br />
Note 12 Intangible and tangible assets<br />
Acquisition cost Value in balance sheet 2009 Investments Value in balance sheet <strong>2010</strong><br />
Rights 52 52<br />
Other intangible assets 116 22 138<br />
Total intangible assets 168 22 190<br />
Buildings 6 – 6<br />
Land and land improvements 3 – 3<br />
Machinery and equipment 45 1 46<br />
Total tangible assets 54 1 55<br />
Value in balance<br />
Value in balance<br />
sheet 2009 1 Depreciation 2 sheet <strong>2010</strong><br />
Net carrying<br />
value in balance<br />
sheet <strong>2010</strong> 3<br />
Accumulated depreciation<br />
Rights 52 – 52 0<br />
Other intangible assets 20 15 35 103<br />
Total intangible assets 72 15 87 103<br />
Buildings 2 0 2 4<br />
Land and land improvements 0 0 0 3<br />
Machinery and equipment 36 1 37 9<br />
Total tangible assets 38 1 39 16<br />
<strong>The</strong> assessed value of buildings was 3 (3) and of land 3 (3). Capital<br />
expenditures in intangible and tangible assets amounted to 22 (–) and<br />
1 (0) respectively. Capital expenditures approved but not yet implemented<br />
at year-end <strong>2010</strong> amounted to 0 (–).<br />
1 Including accumulated write-downs.<br />
2 Including write-downs.<br />
3 Acquisition value, less accumulated depreciation, amortization and writedowns.<br />
120
Note 13 Investments in shares and participations<br />
Holdings of shares and participations are specified in AB <strong>Volvo</strong>’s holding of shares. Changes in holdings of shares and participations are shown<br />
below.<br />
<strong>Group</strong> companies<br />
Non-<strong>Group</strong> companies<br />
2009 <strong>2010</strong> 2009 <strong>2010</strong><br />
Balance December 31, previous year 46,122 57,062 2,280 2,363<br />
Acquisitions/New issue of shares 85 – 2 87<br />
Divestments – (3,493) – 0<br />
Shareholder contributions 10,855 5,879 1 –<br />
Write-downs/participations in partnerships – (19) 6 (124)<br />
Revaluation of shares in listed companies – – 74 172<br />
Balance, December 31 57,062 59,429 2,363 2,498<br />
Shares and participations in <strong>Group</strong> companies<br />
In December, <strong>2010</strong>, AB <strong>Volvo</strong> transferred the company’s holding of<br />
preference shares in UD Trucks Corporation, with the book value of<br />
3,493, as shareholders’ contribution to <strong>Volvo</strong> <strong>Group</strong> Japan Corporation.<br />
Shareholders’ contribution was also made to Kommersiella Fordon<br />
Europa AB, 1,801, <strong>Volvo</strong> Financial Services AB, 225, <strong>Volvo</strong> China<br />
Investment Co Ltd, 217, and <strong>Volvo</strong> Holding Mexico, 143.<br />
Write-down was made at year-end of the holding of shares in Alviva<br />
AB with 19.<br />
During 2009, AB <strong>Volvo</strong> acquired total number of shares in <strong>Volvo</strong><br />
Logistics AB from Fortos Ventures AB in an amount of 85.<br />
During 2009, shareholders’ contributions were made to <strong>Volvo</strong><br />
Treasury AB, 10,000, <strong>Volvo</strong> Information Technology AB, 500, and<br />
<strong>Volvo</strong> China Investment Co Ltd, 355.<br />
Shares and participations in non-<strong>Group</strong> companies<br />
AB <strong>Volvo</strong> acquired <strong>Volvo</strong> Personvagnar AB’s participation (5%) in<br />
Blue Chip Jet I HB in <strong>2010</strong> and in 2009 half of Skandia’s participation<br />
in Blue Chip Jet I HB (5%) was acquired. AB <strong>Volvo</strong>’s participation in<br />
Blue Chip Jet I HB is 50% after the acquisitions. During <strong>2010</strong> a capital<br />
contribution of 76 was made to Blue Chip Jet II HB. <strong>The</strong> book value<br />
of the participations in the partnerships Blue Chip Jet I HB and Blue<br />
Chip Jet II HB decreased during the year by a net of 113 (8).<br />
<strong>The</strong> revaluation of AB <strong>Volvo</strong>’s ownership in the listed company Deutz<br />
AG has increased the value by 172 (74), recognized in other comprehensive<br />
income.<br />
Other shares and participations include the direct and indirect holdings<br />
of VE Commercial Vehicles (VECV) for total amount of 1,845. In<br />
the consolidated accounts of the <strong>Volvo</strong> group, VECV is reported as a<br />
joint venture and consolidated according to the proportionate method.<br />
<strong>The</strong> indirect ownership is an effect of the acquisition of 8.1% of Eicher<br />
Motors Limited, which is the other venturer of VECV. <strong>The</strong>se shares are<br />
not separately valued as they form a part of the indirect ownership<br />
VECV.<br />
Note 14 Other short-term receivables<br />
2009 <strong>2010</strong><br />
Accounts receivable 35 3<br />
Prepaid expenses and accrued income 199 226<br />
Other receivables 13 32<br />
Total 247 261<br />
<strong>The</strong> valuation allowance for doubtful receivables amounted to 4 (15)<br />
at the end of the year.<br />
Note 15 Untaxed reserves<br />
Value in balance<br />
sheet 2009 Allocations <strong>2010</strong><br />
Value in balance<br />
sheet <strong>2010</strong><br />
<strong>The</strong> composition of, and changes in, untaxed reserves<br />
Accumulated additional depreciation<br />
Land 3 – 3<br />
Machinery and equipment 1 0 1<br />
Total 4 0 4<br />
121
Financial information <strong>2010</strong><br />
Notes and comments<br />
Note 16 Provisions for pensions<br />
Note 18 Other current liabilities<br />
Provisions for pensions and similar benefits correspond to the actuarially<br />
calculated value of obligations not insured with third parties or<br />
secured through transfers of funds to pension foundations. <strong>The</strong><br />
amount of pensions falling due within one year is included. AB <strong>Volvo</strong><br />
has insured the pension obligations with third parties. Of the amount<br />
reported, 0 (0) pertains to contractual obligations within the framework<br />
of the PRI (Pension Registration Institute) system.<br />
<strong>The</strong> <strong>Volvo</strong> Pension Foundation was formed in 1996. Plan assets<br />
amounting to 224 were contributed to the foundation at its formation,<br />
corresponding to the value of the pension obligations at that time.<br />
Since its formation, net contributions of 25 have been made to the<br />
foundation.<br />
AB <strong>Volvo</strong>’s pension costs amounted to 104 (55).<br />
<strong>The</strong> accumulated benefit obligation of all AB <strong>Volvo</strong>’s pension obligations<br />
at year-end <strong>2010</strong> amounted to 611, which has been secured<br />
in part through provisions in the balance sheet and through transfer of<br />
funds to pension foundations. Net asset value in the Pension Foundation,<br />
marked to market, accrued to AB <strong>Volvo</strong> was 48 higher than the<br />
corresponding pension obligations.<br />
2009 <strong>2010</strong><br />
Wages, salaries and withholding taxes 102 94<br />
Other liabilities 4 2<br />
Accrued expenses and prepaid income 133 173<br />
Total 239 269<br />
No collateral is provided for current liabilities.<br />
Note 19 Contingent liabilities<br />
Of the contingent liabilities amounting to 250,606 (254,299),<br />
250,597 (254,041) pertained to <strong>Group</strong> companies.<br />
Guarantees for various credit programs are included in amounts corresponding<br />
to the credit limits. <strong>The</strong>se guarantees amount to 243,089<br />
(247,010), of which guarantees on behalf of <strong>Group</strong> companies totaled<br />
243,089 (247,010).<br />
At the end of each year, the utilized portion amounted to 108,562<br />
(130,961), including 108,476 (130,872) pertaining to <strong>Group</strong> companies.<br />
Note 17 Non-current liabilities<br />
Non-current debt matures as follows:<br />
2013 10<br />
2016 or later 7<br />
Total 17<br />
Note 20 Cash-flow<br />
Other adjustments of operating income 2009 <strong>2010</strong><br />
Revaluation of shareholdings (4) 116<br />
<strong>Group</strong> contributions and transfer price<br />
adjustments, current year 14,016 (6,673)<br />
Payments of previous years <strong>Group</strong> contributions<br />
and transfer price adjustments 1,351 (14,016)<br />
Other (2) 30<br />
Total 15,361 (20,543)<br />
Further information is provided in notes 5, 6 and 7.<br />
Shares and participations in <strong>Group</strong> companies, net<br />
Investments (11,091) (2,386)<br />
Net investments in shares and<br />
participations in <strong>Group</strong> companies (11,091) (2,386)<br />
Investments and sales of shares in <strong>Group</strong> companies are shown in<br />
note 13.<br />
Shares and participations in<br />
non-<strong>Group</strong> companies, net 2009 <strong>2010</strong><br />
Investments (1) (78)<br />
Disposals – 15<br />
Net investments in shares and<br />
participations in non-<strong>Group</strong> companies (1) (63)<br />
Investments and sales of shares in non-<strong>Group</strong> companies are presented<br />
in note 13.<br />
Increase in loans<br />
Increase in loans is related to the company’s liability in the group<br />
account at <strong>Volvo</strong> Treasury AB. <strong>The</strong> liability has increased by 11,457<br />
(6,894).<br />
122
AB <strong>Volvo</strong>’s holding of shares<br />
Dec 31, 2009 Dec 31, <strong>2010</strong><br />
AB <strong>Volvo</strong>’s holding of shares<br />
and participations in non-<strong>Group</strong> companies 1<br />
Registration<br />
number<br />
Percentage<br />
holding 2<br />
Carrying value,<br />
SEK M<br />
Carrying value,<br />
SEK M<br />
Deutz AG, Germany – 7 286 458<br />
Blue Chip Jet II HB, Sweden 969717-2105 50 206 170<br />
Other investments 26 22<br />
Total carrying value, non-<strong>Group</strong> companies 518 650<br />
1 AB <strong>Volvo</strong>’s holdings of shares and participations include the direct and indirect holdings of VE Commercial Vehicles (VECV). AB <strong>Volvo</strong>’s direct holdings in VECV<br />
amount to SEK 1,845 M. In the consolidated accounts of the <strong>Volvo</strong> group, VECV is reported as a joint venture, consolidated according to the proportionate<br />
method, and accordingly included in the table for <strong>Group</strong> companies below.<br />
2 Percentage figures refer to share capital as well as voting rights.<br />
Dec 31, 2009 Dec 31, <strong>2010</strong><br />
AB <strong>Volvo</strong>’s holding of shares and<br />
participations in major <strong>Group</strong> companies<br />
Registration<br />
number<br />
Percentage<br />
holding<br />
Carrying value,<br />
SEK M<br />
Carrying value,<br />
SEK M<br />
<strong>Volvo</strong> Lastvagnar AB, Sweden 556013-9700 100 8,678 8,678<br />
<strong>Volvo</strong> Truck Center Sweden AB, Sweden 556072-7777 100 – –<br />
<strong>Volvo</strong> Finland AB, Finland – 100 – –<br />
<strong>Volvo</strong> <strong>Group</strong> Belgium NV, Belgium – 100 – –<br />
<strong>Volvo</strong> <strong>Group</strong> UK Ltd, Great Britain – 100 – –<br />
<strong>Volvo</strong> India Ltd, India – 100 – –<br />
<strong>Volvo</strong> Holding Sverige AB, Sweden 556539-9853 100 7,634 7,634<br />
<strong>Volvo</strong> Logistics AB, Sweden 556197-9732 100 – –<br />
BRS Ltd, Great Britain – 100 – –<br />
<strong>Volvo</strong> Construction Equipment North America, Canada – 100 – –<br />
<strong>Volvo</strong> Polska Sp. O.O., Poland – 100 – –<br />
<strong>Volvo</strong> (Southern Africa) Pty Ltd, South Africa – 100 – –<br />
<strong>Volvo</strong> do Brasil Veiculos Ltda, Brazil – 100 – –<br />
Banco <strong>Volvo</strong> (Brasil) SA, Brazil – 100 – –<br />
<strong>Volvo</strong> <strong>Group</strong> Canada Inc., Canada – 100 – –<br />
Prévost Car Inc, Canada – 100 – –<br />
<strong>Volvo</strong> <strong>Group</strong> Australia Pty Ltd, Australia – 100 – –<br />
<strong>Volvo</strong> <strong>Group</strong> Automotive Ticaret, Ltd, Sirketi, Turkey 1 – 100 – –<br />
<strong>Volvo</strong> Holding France SA, France – 100 – –<br />
<strong>Volvo</strong> Trucks France s.a.s., France – 100 – –<br />
<strong>Volvo</strong> Compact Equipment s.a.s., France – 100 – –<br />
<strong>Volvo</strong> CE Europe s.a.s., France – 100 – –<br />
VFS Finance France s.a.s., France – 100 – –<br />
VFS Location France s.a.s., France – 100 – –<br />
123
Financial information <strong>2010</strong><br />
Notes and comments<br />
Dec 31, 2009 Dec 31, <strong>2010</strong><br />
AB <strong>Volvo</strong>’s holding of shares and<br />
participations in major <strong>Group</strong> companies (cont.)<br />
Registration<br />
number<br />
Percentage<br />
holding<br />
Carrying value,<br />
SEK M<br />
Carrying value,<br />
SEK M<br />
Renault Trucks s.a.s., France – 100 – –<br />
Renault Trucks Deutschland GmbH, Germany – 100 – –<br />
Renault Trucks Polska SP Z OO, Poland – 100 – –<br />
Renault Trucks, España, Spain – 100 – –<br />
Renault Trucks Italia Spa, Italy – 100 – –<br />
<strong>Volvo</strong> <strong>Group</strong> Japan Co, Japan – 100 2,886 6,379<br />
UD Trucks Corporation, Japan – 100 3,493 –<br />
DRD Co., Ltd, Japan – 100 – –<br />
UD Trucks Japan Co, Japan – 100 – –<br />
UD Trucks South Africa (Pty) Ltd., South Africa – 80 – –<br />
<strong>Volvo</strong> Bussar AB, Sweden 556197-3826 100 1,882 1,882<br />
<strong>Volvo</strong> Construction Equipment NV, <strong>The</strong> Netherlands – 100 2,582 2,582<br />
<strong>Volvo</strong> Construction Equipment AB, Sweden 556021-9338 100 – –<br />
<strong>Volvo</strong> Maskin AS, Norway – 100 – –<br />
<strong>Volvo</strong> Construction Equipment Europe GmbH, Germany – 100 – –<br />
ABG Algemeinen Baumaschinen GmbH, Germany – 100 – –<br />
AB <strong>Volvo</strong> Penta, Sweden 556034-1330 100 421 421<br />
<strong>Volvo</strong> Aero AB, Sweden 556029-0347 100 2,885 2,885<br />
<strong>Volvo</strong> Aero Norge AS, Norway – 78 – –<br />
VNA Holding Inc., USA – 100 2,491 2,491<br />
<strong>Volvo</strong> <strong>Group</strong> North America Inc., USA – 100 – –<br />
Arrow Truck Sales, Inc., USA – 100 – –<br />
Mack Trucks Inc., USA – 100 – –<br />
<strong>Volvo</strong> Construction Equipment North America Inc., USA – 100 – –<br />
<strong>Volvo</strong> Penta of <strong>The</strong> Americas Inc., USA – 100 – –<br />
<strong>Volvo</strong> Commercial Finance LLC <strong>The</strong> Americas, USA – 100 – –<br />
VFS US LLC, USA – 100 – –<br />
VFS Leasing Co., USA – 100 – –<br />
124
Dec 31, 2009 Dec 31, <strong>2010</strong><br />
AB <strong>Volvo</strong>’s holding of shares and<br />
participations in major <strong>Group</strong> companies (cont.)<br />
Registration<br />
number<br />
Percentage<br />
holding<br />
Carrying value,<br />
SEK M<br />
Carrying value,<br />
SEK M<br />
<strong>Volvo</strong> Financial Services AB, Sweden 556000-5406 100 1,720 1,945<br />
VFS International AB, Sweden 556316-6064 100 – –<br />
VFS Nordic AB, Sweden 556579-1778 100 – –<br />
VFS Financial Services BV, <strong>The</strong> Netherlands – 100 – –<br />
VFS Financial Services Belgium NV, Belgium – 100 – –<br />
VFS Financial Services (UK) Ltd, Great Britain – 100 – –<br />
VFS Deutschland GmbH, Germany – 100 – –<br />
VFS Financial Services Spain EFC, SA, Spain – 100 – –<br />
<strong>Volvo</strong> Finance (Suisse) SA, Switzerland – 100 – –<br />
VFS Vostok, Russia – 100 – –<br />
VFS Romania, Romania – 100 – –<br />
VFS Canada Inc, Canada – 100 – –<br />
VE Commercial Vehicles, Ltd, India 2, 7 – 50 – –<br />
<strong>Volvo</strong> Treasury AB, Sweden 556135-4449 100 13,044 13,044<br />
Sotrof AB, Sweden 556519-4494 100 1,388 1,388<br />
<strong>Volvo</strong> <strong>Group</strong> Real Estate AB, Sweden 556006-8313 100 – –<br />
<strong>Volvo</strong> Korea Holding AB, Sweden 556531-8572 100 2,655 2,655<br />
<strong>Volvo</strong> <strong>Group</strong> Korea Co Ltd, South Korea – 100 – –<br />
<strong>Volvo</strong> China Investment Co Ltd, China – 100 879 1,096<br />
Shanghai Sunwin Bus Co, China 2 – 50 – –<br />
XIAN Silver Bus Co, China 2 – 50 – –<br />
Shandong Lingong Construction Machinery, China – 70 – –<br />
<strong>Volvo</strong> Automotive Finance (China) Ltd, China – 100 491 491<br />
<strong>Volvo</strong> <strong>Group</strong> UK Ltd, Great Britain 3 – 100 413 413<br />
<strong>Volvo</strong> Holding Mexico, Mexico – 100 388 531<br />
<strong>Volvo</strong> Technology Transfer AB, Sweden 556542-4370 100 361 361<br />
<strong>Volvo</strong> Powertrain AB, Sweden 556000-0753 100 498 498<br />
<strong>Volvo</strong> Information Technology AB, Sweden 556103-2698 100 663 663<br />
<strong>Volvo</strong> Parts AB, Sweden 556365-9746 100 200 200<br />
<strong>Volvo</strong> <strong>Group</strong> Insurance Försäkrings AB, Sweden 516401-8037 100 182 182<br />
<strong>Volvo</strong> Business Services AB, Sweden 556029-5197 100 107 107<br />
<strong>Volvo</strong> Danmark Holding AS, Denmark – 100 104 104<br />
VFS Servizi Financiari Spa, Italy 4 – 100 79 79<br />
Kommersiella Fordon Europa AB, Sweden 556049-3388 100 89 1,890<br />
<strong>Volvo</strong> Norge AS, Norway – 100 56 56<br />
<strong>Volvo</strong> Malaysia Sdn, Malaysia – 100 48 48<br />
ZAO <strong>Volvo</strong> Vostok, Russia 5 – 100 34 34<br />
<strong>Volvo</strong> Italia Spa, Italy – 100 556 556<br />
<strong>Volvo</strong> Logistics AB, Sweden 556197-9732 100 85 85<br />
Rossareds Fastighets AB, Sweden 556009-1190 100 26 26<br />
Alviva AB, Sweden 556622-8820 100 25 5<br />
<strong>Volvo</strong> East Asia (Pte) Ltd, Singapore – 100 9 9<br />
<strong>Volvo</strong> Automotive Holding BV, <strong>The</strong> Netherlands – 100 3 3<br />
<strong>Volvo</strong> Information Technology GB Ltd, Great Britain – 100 3 3<br />
Other holdings 6 5<br />
Total carrying value <strong>Group</strong> companies 6 57,062 59,429<br />
1 Total holding by <strong>Volvo</strong> Holding Sverige and <strong>Volvo</strong> Lastvagnar is 100%.<br />
2 Joint venture, reported in accordance with the proportionate consolidation<br />
method in <strong>Volvo</strong>’s consolidated accounts.<br />
3 Total holding by VTC Holding and AB <strong>Volvo</strong> is 100%.<br />
4 Total holding by <strong>Volvo</strong> Italia and AB <strong>Volvo</strong> is 100%.<br />
5 Total holding by AB <strong>Volvo</strong> and <strong>Volvo</strong> Trucks Region Central Europe<br />
is 100%.<br />
6 AB <strong>Volvo</strong>’s share of shareholders’ equity in subsidiaries (including<br />
equity in untaxed reserves) was 90,261 (91,944).<br />
7 AB <strong>Volvo</strong>’s holdings of shares and participations include the direct<br />
and indirect holdings of VE Commercial Vehicles (VECV). AB <strong>Volvo</strong>’s<br />
direct holdings in VECV amount to 1,845. In the consolidated accounts<br />
of the <strong>Volvo</strong> group, VECV is reported as a joint venture, consolidated<br />
according to the proportionate method, and accordingly included in<br />
the table for group companies above.<br />
125
Financial information <strong>2010</strong><br />
Proposed remuneration policy<br />
<strong>The</strong> proposal by the Board of Directors of AB <strong>Volvo</strong> to be<br />
adopted by the <strong>Annual</strong> General Meeting April 6, 2011.<br />
This Policy concerns the remuneration and other terms of employment<br />
for the <strong>Group</strong> Executive Committee of the <strong>Volvo</strong> <strong>Group</strong>. <strong>The</strong><br />
members of the <strong>Group</strong> Executive Committee, including the President<br />
and any possible Executive Vice President, are in the following<br />
referred to as the “Executives”.<br />
This Policy will be valid for employment agreements entered into<br />
after the approval of the Policy by the <strong>Annual</strong> General Meeting and for<br />
changes made to existing employment agreements thereafter.<br />
1. Guiding principles for remuneration and other terms of employment<br />
<strong>The</strong> guiding principle is that the remuneration and the other terms of<br />
employment for the Executives shall be competitive in order to ensure<br />
that the <strong>Volvo</strong> <strong>Group</strong> can attract and retain competent Executives.<br />
<strong>The</strong> annual report <strong>2010</strong> sets out details on the total remuneration<br />
and benefits awarded to the Executives during <strong>2010</strong>.<br />
2. <strong>The</strong> principles for fixed salaries<br />
<strong>The</strong> Executive’s fixed salary shall be competitive and based on the<br />
individual Executive’s responsibilities and performance.<br />
3. <strong>The</strong> principal terms of variable salary and incentive schemes,<br />
including the relation between fixed and variable components<br />
of the remuneration and the linkage between performance and<br />
remuneration<br />
<strong>The</strong> Executives may receive variable salaries in addition to fixed salaries.<br />
<strong>The</strong> variable salary may, as regards the President, amount to a<br />
maximum of 75% of the fixed annual salary and, as regards the other<br />
Executives, a maximum of 60% of the fixed annual salary.<br />
<strong>The</strong> variable salary may be based on i.a. the performance of the<br />
entire <strong>Volvo</strong> <strong>Group</strong> or the performance of the Business Area or Business<br />
Unit where the Executive is employed. <strong>The</strong> performance will be<br />
related to the fulfilment of various improvement targets or the attainment<br />
of certain financial objectives. Such targets will be set by the<br />
Board and may relate to i.a. operating income or cash flow.<br />
<strong>The</strong> Board shall before each <strong>Annual</strong> General Meeting evaluate<br />
whether a share or share-price related incentive program shall be proposed<br />
to the <strong>Annual</strong> General Meeting or not. Such proposal may concern<br />
a program comprising one or several financial years. <strong>The</strong> <strong>Annual</strong><br />
General Meeting decides upon such programs. <strong>The</strong> Board of Directors<br />
has decided to propose to the <strong>Annual</strong> General Meeting 2011 to<br />
approve the adoption of a share-based incentive program relating to<br />
the financial years 2011, 2012 and 2013.<br />
4. <strong>The</strong> principal terms of non-monetary benefits, pension, notice of<br />
termination and severance pay<br />
4.1 Non-monetary benefits<br />
<strong>The</strong> Executives will be entitled to customary non-monetary benefits<br />
such as company cars and company health care. In addition thereto in<br />
individual cases company housing and other benefits may also be<br />
offered.<br />
4.2 Pension<br />
In addition to pension benefits which the Executives are entitled to<br />
according to law and collective bargaining agreements, Executives<br />
resident in Sweden may be offered defined-contribution plans with<br />
annual premiums amounting to SEK 30,000 plus 20% of the pensionable<br />
salary over 30 income base amounts. In the defined-contribution<br />
plan, the pension earned will correspond to the sum of paid-in premiums<br />
and possible return without any guaranteed level of pension<br />
received by the employee. In the defined-contribution plan, no definite<br />
retirement date is set.<br />
Some of the Executives have earlier been entitled to defined-benefit<br />
pension plans, but the majority of the Executives have re-negotiated<br />
these to the new system of defined-contribution plans. In connection<br />
therewith, agreements have in some cases been reached on<br />
individual adjusting premiums in accordance with actuarial calculations.<br />
Previous pension agreements for certain Executives stipulated that<br />
early retirement could be obtained from the age of 60. Such agreements<br />
are no longer signed and the majority of the Executives that<br />
earlier were entitled to such defined-benefit pension plans have<br />
agreed to exchange these for defined-contribution plans without any<br />
defined point of time for retirement. <strong>The</strong> premium amounts to 10% of<br />
the pensionable salary plus individual adjusting premiums based on<br />
actuarial calculations in some cases.<br />
Executives resident outside Sweden or resident in Sweden but having<br />
a material connection to or having been resident in a country other<br />
than Sweden may be offered pension benefits that are competitive in<br />
the country where the Executives are or have been resident or to<br />
which the Executives have a material connection, preferably definedcontribution<br />
plans.<br />
4.3 Notice of termination and severance pay<br />
For Executives resident in Sweden, the termination period from the<br />
Company will be twelve months and six months from the Executive. In<br />
addition thereto, the Executive, provided that termination has been<br />
made by the Company, will be entitled to twelve months severance pay.<br />
Executives resident outside Sweden or resident in Sweden but having<br />
a material connection to or having been resident in a country other<br />
than Sweden may be offered notice periods for termination and severance<br />
payment that are competitive in the country where the Executives<br />
are or have been resident or to which the Executives have a<br />
material connection, preferably solutions comparable to the solutions<br />
applied to Executives resident in Sweden.<br />
5. <strong>The</strong> Board’s preparation and decision-making on issues concerning<br />
remuneration and other terms of employment for the <strong>Group</strong> Executive<br />
Committee<br />
<strong>The</strong> Remuneration Committee is responsible for (i) preparing the<br />
Board’s decisions on issues concerning principles for remuneration,<br />
remunerations and other terms of employment for Executives, (ii) monitoring<br />
and evaluating programs for variable remuneration, both ongoing<br />
and those that have ended during the year, for Executives, (iii) monitoring<br />
and evaluating the application of this Policy, and (iv) monitoring and<br />
evaluating current remuneration structures and levels in the Company.<br />
<strong>The</strong> Remuneration Committee prepares and the Board decides on<br />
(i) terms of employment and remuneration of the President and the<br />
Executive Vice President, if any, and (ii) principles for remuneration<br />
(incl. pension and severance pay) for the <strong>Group</strong> Executive Committee.<br />
<strong>The</strong> Remuneration Committee shall approve proposals on remuneration<br />
of the members of the <strong>Group</strong> Executive Committee.<br />
<strong>The</strong> Remuneration Committee is further responsible for the review<br />
and recommendation to the Board of share and share-price related<br />
incentive programs to be decided upon by the <strong>Annual</strong> General Meeting.<br />
6. Deviations from this Policy<br />
<strong>The</strong> Board of Directors may deviate from this Policy, except as regards<br />
section 3, third paragraph, if there are specific reasons to do so in an<br />
individual case.<br />
7. Information on earlier decisions on remuneration that has not<br />
become due for payment at the time of the <strong>Annual</strong> General Meeting’s<br />
consideration of this Policy<br />
<strong>The</strong> decisions already taken on remuneration to the Executives that has<br />
not become due for payment at the time of the <strong>Annual</strong> General Meeting<br />
2011 fall within the framework of this policy, except that some of the Executives<br />
have a right to receive 24 months severance pay provided they are<br />
above 50 years of age.<br />
<strong>The</strong> policy concerning remuneration and other terms of employment for<br />
the <strong>Group</strong> Executive Committee decided at the <strong>Annual</strong> General Meting<br />
<strong>2010</strong> is provided in note 34 Personnel.<br />
126
Proposed disposition of unappropriated<br />
earnings<br />
AB <strong>Volvo</strong><br />
SEK<br />
Retained earnings 21,634,556,869.50<br />
Income for the period <strong>2010</strong> 10,327,605,961.72<br />
Total retained earnings 31,962,162,831.22<br />
<strong>The</strong> Board of Directors and the President propose that the above<br />
sum be disposed of as follows:<br />
SEK<br />
To the shareholders, a dividend of SEK<br />
2.50 per share 5,068,567,563.00<br />
To be carried forward 26,893,595,268.22<br />
Total 31,962,162,831.22<br />
<strong>The</strong> record date for determining who is entitled to receive dividends is<br />
proposed to be Monday, April 11, 2011.<br />
In view of the Board of Directors’ proposal to the <strong>Annual</strong> General Meeting<br />
to be held April 6, 2011, to decide on the distribution of a dividend of<br />
SEK 2.50 per share, the Board hereby makes the following statement in<br />
accordance with Chapter 18, Section 4 of the Swedish Companies Act.<br />
<strong>The</strong> Board of Directors concludes that the Company’s restricted<br />
equity is fully covered after the proposed dividend. <strong>The</strong> Board further<br />
concludes that the proposed dividend is justifiable in view of the<br />
parameters set out in Chapter 17, Section 3, second and third paragraphs<br />
of the Swedish Companies Act. In connection herewith, the<br />
Board wishes to point out the following.<br />
<strong>The</strong> proposed dividend reduces the Company’s solvency from<br />
53.5% to 50.3% and the <strong>Group</strong>’s solvency from 23.3% to 22.1%,<br />
calculated as per year end <strong>2010</strong>. <strong>The</strong> Board of Directors considers<br />
this solvency to be satisfactory with regard to the business in which<br />
the <strong>Group</strong> is active.<br />
According to the Board of Directors’ opinion, the proposed dividend<br />
will not affect the Company’s or the <strong>Group</strong>’s ability to fulfil their payment<br />
obligations and the Company and the <strong>Group</strong> are well prepared to<br />
handle both changes in the liquidity and unexpected events.<br />
<strong>The</strong> Board of Directors is of the opinion that the Company and the<br />
<strong>Group</strong> have capacity to assume future business risks as well as to<br />
bear contingent losses. <strong>The</strong> proposed dividend is not expected to<br />
adversely affect the Company’s and the <strong>Group</strong>’s ability to make further<br />
commercially justified investments in accordance with the Board of<br />
Directors’ plans.<br />
In addition to what has been stated above, the Board of Directors has<br />
considered other known circumstances which may be of importance for<br />
the Company’s and the <strong>Group</strong>’s financial position. In doing so, no circumstance<br />
has appeared that does not justify the proposed dividend.<br />
If the <strong>Annual</strong> General Meeting resolves in accordance with the Board<br />
of Directors’ proposal, SEK 26,893,595,268.22 will remain of the Company’s<br />
non-restricted equity, calculated as per year end <strong>2010</strong>.<br />
<strong>The</strong> Board of Directors has the view that the Company’s and the<br />
<strong>Group</strong>’s shareholders’ equity will, after the proposed dividend, be sufficient<br />
in relation to the nature, scope and risks of the business.<br />
Had the assets and liabilities not been estimated at their market<br />
value pursuant to Chapter 4, Section 14 a of the Swedish <strong>Annual</strong><br />
Accounts Act, the company’s shareholders’ equity would have been<br />
SEK 193,353,379.00 less.<br />
<strong>The</strong> Board of Directors and the President certify that the annual financial<br />
report has been prepared in accordance with generally accepted<br />
accounting principles and that the consolidated accounts have been<br />
prepared in accordance with the international set of accounting<br />
standards referred to in Regulation (EC) No 1606/2002 of the European<br />
Parliament and of the Council of July 19, 2002 on the application<br />
of international accounting standards, and give a true and fair<br />
view of the position and profit or loss of the Company and the <strong>Group</strong>,<br />
and that the management report for the Company and for the <strong>Group</strong><br />
gives a fair review of the development and performance of the business,<br />
position and profit or loss of the Company and the <strong>Group</strong>, and<br />
describes the principal risks and uncertainties that the Company and<br />
the companies in the <strong>Group</strong> face.<br />
Göteborg, February 24, 2011<br />
Peter Bijur<br />
Board member<br />
Louis Schweitzer<br />
Board Chairman<br />
Jean-Baptiste Duzan<br />
Board member<br />
Leif Johansson<br />
President, CEO and<br />
Board member<br />
Hanne de Mora<br />
Board member<br />
Anders Nyrén<br />
Board member<br />
Ravi Venkatesan<br />
Board member<br />
Lars Westerberg<br />
Board member<br />
Ying Yeh<br />
Board member<br />
Martin Linder<br />
Board member<br />
Mikael Sällström<br />
Board member<br />
Berth Thulin<br />
Board member<br />
Our audit report was issued on February 24, 2011<br />
PricewaterhouseCoopers AB<br />
Göran Tidström<br />
Authorized Public Accountant<br />
Lead Partner<br />
Johan Rippe<br />
Authorized Public Accountant<br />
127
Financial information <strong>2010</strong><br />
Audit report for AB <strong>Volvo</strong><br />
We have audited the annual accounts, the consolidated accounts, the<br />
accounting records and the administration of the Board of Directors<br />
and the President of AB <strong>Volvo</strong> for the year <strong>2010</strong>. <strong>The</strong> company’s<br />
annual accounts and the consolidated accounts are included in the<br />
printed version on pages 24–127. Board of Directors and the President<br />
are responsible for these accounts and the administration of the<br />
company as well as for the application of the <strong>Annual</strong> Accounts Act<br />
when preparing the annual accounts and the application of international<br />
financial reporting standards IFRSs as adopted by the EU and<br />
the <strong>Annual</strong> Accounts Act when preparing the consolidated accounts.<br />
Our responsibility is to express an opinion on the annual accounts, the<br />
consolidated accounts and the administration based on our audit.<br />
We conducted our audit in accordance with generally accepted<br />
auditing standards in Sweden. Those standards require that we plan<br />
and perform the audit to obtain reasonable assurance that the annual<br />
accounts and the consolidated accounts are free of material misstatement.<br />
An audit includes examining, on a test basis, evidence supporting<br />
the amounts and disclosures in the accounts. An audit also<br />
includes assessing the accounting principles used and their application<br />
by the Board of Directors and the President and significant estimates<br />
made by the Board of Directors and the President when preparing<br />
the annual accounts and consolidated accounts as well as<br />
evaluating the overall presentation of information in the annual<br />
accounts and the consolidated accounts. As a basis for our opinion<br />
concerning discharge from liability, we examined significant decisions,<br />
actions taken and circumstances of the company in order to be able<br />
to determine the liability, if any, to the company of any board member<br />
or the President. We also examined whether any board member or the<br />
President has, in any other way, acted in contravention of the Companies<br />
Act, the <strong>Annual</strong> Accounts Act or the Articles of Association.<br />
We believe that our audit provides a reasonable basis for our opinion<br />
set out below.<br />
<strong>The</strong> annual accounts have been prepared in accordance with the<br />
<strong>Annual</strong> Accounts Act and give a true and fair view of the company’s<br />
financial position and results of operations in accordance with generally<br />
accepted accounting principles in Sweden. <strong>The</strong> consolidated<br />
accounts have been prepared in accordance with international financial<br />
reporting standards IFRSs as adopted by the EU and the <strong>Annual</strong><br />
Accounts Act and give a true and fair view of the group’s financial<br />
position and results of operations. <strong>The</strong> Board of Directors’ <strong>Report</strong> is<br />
consistent with the other parts of the annual accounts and the consolidated<br />
accounts.<br />
We recommend to the annual meeting of shareholders that the<br />
income statements and balance sheets of the Parent Company and<br />
the <strong>Group</strong> be adopted, that the profit of the Parent Company be dealt<br />
with in accordance with the proposal in the Board of Directors’ <strong>Report</strong><br />
and that the members of the Board of Directors and the President be<br />
discharged from liability for the financial year.<br />
Göteborg, February 24, 2011<br />
PricewaterhouseCoopers AB<br />
Göran Tidström<br />
Authorized Public Accountant<br />
Lead Partner<br />
Johan Rippe<br />
Authorized Public Accountant<br />
Partner<br />
128
Eleven-year summary<br />
<strong>The</strong> eleven-year summary presents each year in accordance with the<br />
Generally Accepted Accounting Practice (GAAP) for that year. Earlier<br />
years are not restated when new accounting standards are applied. <strong>The</strong><br />
years 1999–2003 are accounted for in accordance with Swedish GAAP<br />
for the respective year. As from 2004 the reporting is based on IFRS.<br />
<strong>The</strong> transition to IFRS is described in note 3 in the 2005 and 2006<br />
<strong>Annual</strong> <strong>Report</strong>s. As from January 1, 2007, the benefits from the synergies<br />
created in the business units are transferred back to the product<br />
areas. Also, as from January 1, 2007, the responsibility for the <strong>Group</strong>’s<br />
treasury operations and real estate has been transferred from <strong>Volvo</strong><br />
Financial Services, which, as from January 1, 2007, only are consolidated<br />
in accordance with the purchase method. Comparison figures for<br />
2006 have been recalculated.<br />
Consolidated income statements<br />
SEK M 2000 2001 2002 2003 2004 2005 2006 2007 2008 2009 <strong>2010</strong><br />
Net sales 130,070 189,280 186,198 183,291 211,076 240,559 258,835 285,405 303,667 218,361 264,749<br />
Cost of sales (104,548) (155,592) (151,569) (146,879) (164,170) (186,662) (199,054) (219,600) (237,578) (186,167) (201,797)<br />
Gross income 25,522 33,688 34,629 36,412 46,906 53,897 59,781 65,805 66,089 32,194 62,952<br />
Research and<br />
development expenses (4,876) (5,391) (5,869) (6,829) (7,614) (7,557) (8,354) (11,059) (14,348) (13,193) (12,970)<br />
Selling expenses (10,140) (15,766) (16,604) (16,866) (19,369) (20,778) (21,213) (26,068) (27,129) (25,334) (24,149)<br />
Administrative expenses (4,974) (6,709) (5,658) (5,467) (5,483) (6,301) (6,551) (7,133) (6,940) (5,863) (5,666)<br />
Other operating income and<br />
expenses 622 (4,096) (4,152) (1,367) (618) (588) (3,466) 163 (1,915) (4,798) (2,023)<br />
Income (loss) from investments<br />
in associated companies 444 50 182 200 27 (557) 61 430 25 (14) (86)<br />
Income from other investments 70 1,410 309 (3,579) 830 37 141 93 69 (6) (58)<br />
Restructuring costs – (3,862) – – – – – – – –<br />
Operating income (loss) 6,668 (676) 2,837 2,504 14,679 18,153 20,399 22,231 15,851 (17,013) 18,000<br />
Interest income and similar credits 1,588 1,275 1,217 1,096 821 654 666 952 1,171 390 442<br />
Interest expenses and<br />
similar charges (1,845) (2,274) (1,840) (1,888) (1,254) (972) (585) (1,122) (1,935) (3,559) (3,142)<br />
Other financial income<br />
and expenses (165) (191) (201) (55) (1,210) 181 (181) (504) (1,077) (392) 213<br />
Income (loss) after<br />
financial items 6,246 (1,866) 2,013 1,657 13,036 18,016 20,299 21,557 14,010 (20,573) 15,514<br />
Income taxes (1,510) 326 (590) (1,334) (3,129) (4,908) (3,981) (6,529) (3,994) 5,889 (4,302)<br />
Income (loss) for the period 4,736 (1,540) 1,423 323 9,907 13,108 16,318 15,028 10,016 (14,685) 11,212<br />
Attributable to<br />
Equity holders of the<br />
Parent Company 4,709 (1,467) 1,393 298 9,867 13,054 16,268 14,932 9,942 (14,718) 10,866<br />
Minority interest 27 (73) 30 25 40 54 50 96 74 33 346<br />
4,736 (1,540) 1,423 323 9,907 13,108 16,318 15,028 10,016 (14,685) 11,212<br />
Consolidated income statements Industrial Operations<br />
SEK M 2000 2001 2002 2003 2004 2005 2006 2007 2008 2009 <strong>2010</strong><br />
Net sales 120,392 180,615 177,080 174,768 202,171 231,191 249,020 276,795 294,932 208,487 257,375<br />
Cost of sales (97,131) (149,477) (145,453) (141,256) (158,453) (180,823) (192,400) (214,160) (232,247) (179,578) (197,480)<br />
Gross income 23,261 31,138 31,627 33,512 43,718 50,368 56,620 62,635 62,685 28,909 59,895<br />
Research and<br />
development expenses (4,876) (5,391) (5,869) (6,829) (7,614) (7,557) (8,354) (11,059) (14,348) (13,193) (12,970)<br />
Selling expenses (9,285) (14,663) (15,393) (15,891) (18,317) (19,616) (19,999) (24,671) (25,597) (23,752) (22,649)<br />
Administrative expenses (4,651) (6,474) (5,464) (5,259) (5,310) (6,147) (6,481) (7,092) (6,921) (5,838) (5,640)<br />
Other operating income and<br />
expenses 309 (3,071) (2,989) (540) 7 (397) (3,275) 249 (1,457) (2,432) (659)<br />
Income from <strong>Volvo</strong> Financial<br />
Services 1,499 325 490 926 1,365 2,033 – – – – –<br />
Income (loss) from investments<br />
in associated companies 341 (86) 126 166 2 (568) 61 428 23 (15) (86)<br />
Income from other investments 70 1,408 309 (3,581) 828 37 141 93 69 (13) (57)<br />
Restructuring costs – (3,862) – – – – – – – – –<br />
Operating income (loss) 6,668 (676) 2,837 2,504 14,679 18,153 18,713 20,583 14,454 (16,333) 17,834<br />
129
Financial information <strong>2010</strong><br />
Eleven-year summary<br />
Consolidated balance sheets<br />
SEK M 2000 2001 2002 2003 2004 2005 2006 2007 2008 2009 <strong>2010</strong><br />
Intangible assets 6,925 17,525 17,045 16,756 17,612 20,421 19,117 36,508 43,958 41,628 40,714<br />
Property, plant and equipment 22,231 33,234 30,799 30,640 31,151 35,068 34,379 47,210 57,270 55,280 54,242<br />
Assets under operating leases 14,216 27,101 23,525 21,201 19,534 20,839 20,501 22,502 25,429 20,388 19,647<br />
Shares and participations 30,481 27,798 27,492 22,206 2,003 751 6,890 2,219 1,953 2,044 2,098<br />
Inventories 23,551 31,075 28,305 26,459 28,598 33,937 34,211 43,645 55,045 37,727 39,837<br />
Customer-financing receivables 41,791 48,784 46,998 46,002 51,193 64,466 64,742 78,847 98,489 81,977 72,688<br />
Interest-bearing receivables 19,228 8,079 5,490 6,632 3,384 1,897 4,116 4,530 5,101 3,044 2,757<br />
Other receivables 26,352 39,946 33,990 32,621 35,747 42,881 42,567 55,152 61,560 50,575 53,154<br />
Non-current assets held for sale – – – – – – 805 – – 1,692 136<br />
Liquid funds 15,968 27,383 25,578 28,735 34,746 36,947 31,099 31,034 23,614 37,910 32,733<br />
Assets 200,743 260,925 239,222 231,252 223,968 257,207 258,427 321,647 372,419 332,265 318,007<br />
Shareholders’ equity 1 88,931 85,576 78,525 72,636 70,155 78,760 87,188 82,781 84,640 67,034 74,121<br />
Provision for postemployment<br />
benefits 2,632 14,647 16,236 15,288 14,703 11,986 8,692 9,774 11,705 8,051 7,510<br />
Other provisions 14,941 18,427 16,721 15,048 14,993 18,556 20,970 27,084 29,076 19,485 18,992<br />
Interest-bearing liabilities 66,233 81,568 72,437 74,092 61,807 74,885 66,957 108,318 145,727 156,852 123,695<br />
Liabilities associated with<br />
assets held for sale – – – – – – 280 – – 272 135<br />
Other liabilities 28,006 60,707 55,303 54,188 62,310 73,020 74,340 93,690 101,271 80,571 93,554<br />
Shareholders’ equity<br />
and liabilities 200,743 260,925 239,222 231,252 223,968 257,207 258,427 321,647 372,419 332,265 318,007<br />
1<br />
of which minority interests 593 391 247 216 229 260 284 579 630 629 1,011<br />
Assets pledged 2,990 3,737 3,610 3,809 3,046 3,255 1,960 1,556 1,380 958 3,339<br />
Contingent liabilities 6,789 10,441 9,334 9,611 9,189 7,850 7,726 8,153 9,427 9,607 11,003<br />
130
Consolidated balance sheets, Industrial Operations<br />
SEK M 2000 2001 2002 2003 2004 2005 2006 2007 2008 2009 <strong>2010</strong><br />
Intangible assets 6,781 17,366 16,919 16,662 17,570 20,348 19,054 36,441 43,909 41,532 40,613<br />
Property, plant and equipment 19,652 30,370 27,789 27,248 27,260 31,330 30,493 47,132 57,185 55,208 54,169<br />
Assets under operating leases 4,245 15,020 11,155 8,976 8,477 10,260 11,822 13,850 16,967 13,539 13,217<br />
Shares and participations 37,366 35,145 34,750 30,022 10,116 10,357 16,565 2,189 1,935 2,025 2,080<br />
Inventories 22,998 30,557 27,564 25,848 28,291 33,583 33,893 43,264 54,084 35,765 38,956<br />
Customer-financing receivables 15 114 99 118 230 1,377 1,193 1,233 975 1,367 1,428<br />
Interest-bearing receivables 19,286 12,426 8,495 9,413 12,127 7,691 13,214 13,701 6,056 8,010 11,153<br />
Other receivables 24,882 38,815 34,256 33,079 36,535 43,992 43,335 55,970 60,586 49,008 52,358<br />
Non-current assets held for sale – – – – – – 805 – – 1,692 136<br />
Liquid funds 10,958 24,874 24,154 28,102 34,628 36,047 29,907 30,026 22,575 37,404 31,491<br />
Assets 146,183 204,687 185,181 179,468 175,234 194,985 200,281 243,806 264,272 245,550 245,602<br />
Shareholders’ equity 88,931 85,576 78,525 72,636 70,155 78,760 87,188 75,129 75,046 58,485 66,101<br />
Provision for postemployment<br />
benefits 2,619 14,632 16,218 15,264 14,677 11,966 8,661 9,746 11,677 8,021 7,478<br />
Other provisions 8,277 14,085 13,893 12,792 14,115 17,164 19,385 25,372 27,015 17,456 17,240<br />
Interest-bearing liabilities 18,233 29,710 22,494 24,677 13,968 13,097 9,779 38,286 46,749 78,890 59,857<br />
Liabilities associated with<br />
assets held for sale – – – – – – 280 – – 272 135<br />
Other liabilities 28,123 60,684 54,051 54,099 62,319 73,998 74,988 95,273 103,785 82,426 94,791<br />
Shareholders’ equity<br />
and liabilities 146,183 204,687 185,181 179,468 175,234 194,985 200,281 243,806 264,272 245,550 245,602<br />
131
Financial information <strong>2010</strong><br />
Eleven-year summary<br />
Consolidated cash-flow statements<br />
SEK bn 2000 2001 2002 2003 2004 2005 2006 2007 2008 2009 <strong>2010</strong><br />
Operating income 6.7 (0.7) 2.8 2.5 14.7 18.2 20.4 22.2 15.9 (17.0) 18.0<br />
Depreciation and amortization 6.3 10.0 10.8 10.2 10.0 9.9 12.4 12.5 13.5 15.2 13.8<br />
Other items not affecting cash (0.4) 0.5 2.0 4.9 (0.1) 0.4 0.7 (0.5) (0.2) 4.4 1.6<br />
Change in working capital (3.3) 6.4 1.0 0.4 (1.4) (4.7) (7.7) (9.9) (23.3) 16.9 4.8<br />
Customer financing receiv ables, net (4.5) (3.7) (5.7) (4.3) (7.4) (7.8) – – – – –<br />
Financial items and income tax (1.3) (2.1) (1.3) (0.9) (0.5) (2.0) (4.3) (5.9) (5.2) (4.6) (5.5)<br />
Cash-flow from operating<br />
activities 3.5 10.4 9.6 12.8 15.3 14.0 21.5 18.4 0.7 14.9 32.7<br />
Investments in fixed assets (5.4) (8.1) (6.7) (6.0) (7.4) (10.3) (10.0) (10.1) (12.7) (10.5) (10.4)<br />
Investments in leasing assets (5.7) (5.8) (5.2) (5.3) (4.4) (4.5) (4.6) (4.8) (5.4) (4.2) (4.8)<br />
Disposals of fixed assets and<br />
leasing assets 2.1 2.6 3.2 2.9 2.4 2.6 3.2 2.9 2.9 3.8 3.1<br />
Shares and participations, net (1.6) 3.9 (0.1) (0.1) 15.1 0.3 (5.8) 0.4 0.0 0.0 (0.1)<br />
Acquired and divested subsidiaries<br />
and other business units, net 0.0 13.0 (0.2) 0.0 (0.1) 0.7 0.5 (15.0) (1.3) 0.2 0.6<br />
Interest-bearing receivables<br />
including marketable securities 11.7 (3.7) (1.5) (2.0) (6.4) (1.3) 7.7 3.6 10.9 (8.9) 6.8<br />
Cash-flow after net investments 4.6 12.3 (0.9) 2.3 14.5 1.5 12.5 (4.6) (4.9) (4.7) 27.9<br />
Increase (decrease) in loans 8.1 6.2 (0.1) 1.9 (8.8) 3.6 (2.6) 28.7 18.2 12.6 (25.7)<br />
Repurchase of own shares (11.8) (8.3) – – (2.5) (1.8) – – – 0.0 –<br />
Cash dividend/payment to<br />
AB <strong>Volvo</strong>’s shareholders (3.1) (3.4) (3.4) (3.4) (3.4) (5.1) (6.8) (20.3) (11.1) (4.1) 0.0<br />
Cash payment to minority – – – – – – – – – – (0.1)<br />
Other 0.0 0.1 0.1 0.1 0.0 0.0 0.0 0.0 0.0 (0.1) 0.0<br />
Change in cash and cash<br />
equivalents excluding<br />
translation differences (2.2) 6.9 (4.3) 0.9 (0.2) (1.8) 3.1 3.8 2.2 3.7 2.1<br />
Translation differences on cash<br />
and cash equivalents 0.3 0.6 (0.7) (0.6) (0.2) 1.1 (0.5) 0.0 1.0 (0.2) (0.4)<br />
Change in cash and cash<br />
equivalents (1.9) 7.5 (5.0) 0.3 (0.4) (0.7) 2.6 3.8 3.2 3.5 1.7<br />
Operating cash flow Industrial Operations<br />
SEK bn 2000 2001 2002 2003 2004 2005 2006 2007 2008 2009 <strong>2010</strong><br />
Operating income 5.2 (1.0) 2.3 1.6 13.3 16.1 18.7 20.6 14.5 (16.3) 17.8<br />
Depreciation and amortization 3.8 7.0 7.8 7.2 7.1 7.3 9.8 10.3 11.8 12.4 11.4<br />
Other items not affecting cash (1.6) 0.0 1.0 4.1 (0.6) 0.2 0.2 (0.4) (0.7) 2.3 0.1<br />
Change in working capital (3.0) 6.8 0.4 0.7 (1.4) (5.6) (3.1) (0.1) (10.9) 4.7 4.6<br />
Financial items and income taxes (0.8) (2.3) (1.1) (0.7) (0.2) (1.9) (3.7) (6.0) (5.0) (4.7) (5.1)<br />
Cash flow from operating<br />
activities 3.6 10.5 10.4 12.9 18.2 16.1 21.9 24.4 9.7 (1.6) 28.8<br />
Investments in fixed assets (5.1) (7.7) (6.3) (5.8) (7.2) (9.9) (9.7) (10.1) (12.6) (10.3) (10.3)<br />
Investments in leasing assets (0.6) (0.5) (0.1) (0.1) (0.3) (0.3) (0.5) (0.2) (0.4) (0.2) (0.3)<br />
Disposals of fixed assets and<br />
leasing assets 0.7 1.1 1.1 0.6 0.7 0.9 0.9 1.1 0.6 0.7 0.8<br />
Operating cash-flow (1.4) 3.4 5.1 7.6 11.4 6.8 12.6 15.2 (2.7) (11.4) 19.0<br />
132
Exports from Sweden<br />
SEK M 2000 2001 2002 2003 2004 2005 2006 2007 2008 2009 <strong>2010</strong><br />
<strong>Volvo</strong> <strong>Group</strong>, total 46,251 50,394 52,730 49,300 62,653 71,133 80,517 88,606 96,571 41,829 72,688<br />
Key ratios<br />
2000 2001 2002 2003 2004 2005 2006 2007 2008 2009 <strong>2010</strong><br />
Gross margin, % 1 19.3 17.2 17.9 19.2 21.6 21.8 22.7 22.6 21.3 13.9 23.3<br />
Research and development<br />
expenses as percentage of<br />
net sales 1 4.1 3.0 3.3 3.9 3.8 3.3 3.4 4.0 4.9 6.3 5.0<br />
Selling expenses as percentage<br />
of net sales 1 7.7 8.1 8.7 9.1 9.1 8.5 8.0 8.9 8.7 11.4 8.8<br />
Administration expenses as<br />
percentage of net sales 1 3.9 3.6 3.1 3.0 2.6 2.7 2.6 2.6 2.3 2.8 2.2<br />
Return on shareholders’ equity, % 5.0 neg 1.7 0.4 13.9 17.8 19.6 18.1 12.1 (19.7) 16.0<br />
Interest coverage, times 1 4.5 neg 2.2 1.9 11.0 16.7 26.1 20.7 8.8 (4.7) 5.9<br />
Self-financing ratio, % 39 92 110 152 163 116 189 153 5 137 270<br />
Self-financing ratio Industrial<br />
Operations, % 72 148 196 243 268 173 235 265 78 (16) 294<br />
Financial position, Industrial<br />
Operations, SEK M 9,392 (7,042) (6,063) (2,426) 18,110 18,675 23,076 (4,305) (29,795) (41,489) (24,691)<br />
Net financial position as<br />
percentage of shareholders'<br />
equity , Industrial Operations 10.6 (8.2) (7.7) (3.3) 25.8 23.7 29.2 (5.7) (39.7) (70.9) (37.4)<br />
Shareholders’ equity as<br />
percentage of total assets 44.3 32.8 32.8 31.4 31.3 30.6 33.7 25.7 22.7 20.2 23.3<br />
Shareholders’ equity as<br />
percentage of total assets,<br />
Industrial Operations 60.8 41.8 42.4 40.5 40.0 40.4 40.6 30.8 28.4 23.8 26.9<br />
Shareholders’ equity excluding<br />
minority interest as percentage of<br />
total assets 44.0 32.6 32.7 31.3 31.2 30.5 33.6 25.6 22.6 20.0 23.0<br />
1 Pertains to the Industrial Operations. For periods up to and including 2006, <strong>Volvo</strong> Financial Services is included and consolidated according to the equity method.<br />
133
Financial information <strong>2010</strong><br />
Eleven-year summary<br />
<strong>Volvo</strong> share statistics<br />
Data per share (adjusted for issues and splits) 1<br />
2000 2001 2002 2003 2004 2005 2006 2007 2008 2009 <strong>2010</strong><br />
Basic earnings, SEK 1 2.24 (0.70) 0.66 0.14 4.72 6.44 8.03 7.37 4.90 (7.26) 5.36<br />
Cash dividend, SEK 1.60 1.60 1.60 1.60 2.50 3.35 10.00 9 5.50 2.00 0 2.50 10<br />
Share price at year-end, SEK (B share) 31.30 35.20 28.40 43.70 52.70 74.90 90.70 108.50 42.90 61.45 118.50<br />
Direct return, % (B share) 2 5.1 4.5 5.6 10.5 8 4.7 4.5 11.0 5.1 4.7 – 2.1<br />
Effective return, % (B share) 3 (23) 17.6 (14.8) 71.2 25.5 48.5 39.8 25.7 (59) 43 97<br />
Price/earnings ratio (B share) 4 14 neg 43 310 11.2 11.6 11.3 14.7 8.8 neg 22.1<br />
EBIT multiple 5 10 25 23 14 9.2 9.3 10.3 9.7 3.6 neg 12.0<br />
Payout ratio, % 6 71 neg 242 1,143 53 52 62 75 41 – 47<br />
Shareholders’ equity, SEK 7 44.40 40.60 37.40 34.60 34 38.80 43 41 41 33 36<br />
Return on shareholders’ equity 5.0 neg 1.7 0.4 13.9 17.8 19.6 18.1 12.1 neg 16.0<br />
1 Basic earnings per share is calculated as income for the period divided<br />
by average number of shares outstanding. <strong>Report</strong>ing according to IFRS<br />
from 2004.<br />
2 Proposed dividend in SEK per share divided by share price at year-end.<br />
3 Share price at year-end, including proposed dividend during the year,<br />
divided by share price at beginning of the year, (2000 includes premium<br />
in connection with repurchase, 2003 includes distribution of shares in<br />
Ainax, 2006 includes a share split 6:1 in which the sixth share was<br />
redeemed by AB <strong>Volvo</strong> for an amount of SEK 5.00 per share).<br />
4 Share price at year-end divided by basic earnings per share.<br />
5 Market value at year-end minus net financial position and minority interests<br />
divided by operating income excluding restructuring costs and<br />
revaluation of shares.<br />
6 Cash dividend divided by basic earnings per share.<br />
7 Shareholders’ equity for shareholders in AB <strong>Volvo</strong> divided by number of<br />
shares outstanding at year-end.<br />
8 Including distribution of shares in Ainax equal to SEK 3.01 (share-split<br />
adjusted) per <strong>Volvo</strong> share in 2004.<br />
9 Including extra payment of SEK 5 through redemption of shares.<br />
10 Proposed by the Board of Directors.<br />
Other share data 2000 2001 2002 2003 2004 2005 2006 2007 2008 2009 <strong>2010</strong><br />
Number of shareholders<br />
at year-end 230,000 214,000 211,000 208,500 202,300 195,442 183,735 197,519 220,192 233,311 240,043<br />
Number of Series A shares outstanding<br />
at year-end, million 124.7 131.7 131.7 131.7 131.5 131.4 131.4 657 657 657 657<br />
Number of Series B shares<br />
outstanding at year-end, million 272.6 287.8 287.8 287.8 278.6 273.1 273.4 1,369 1,371 1,371 1,371<br />
Average number of shares outstanding,<br />
million 421.7 422.4 419.4 419.4 418.5 405.2 404.7 2,025 2,027 2,027 2,027<br />
Number of Series A shares traded in<br />
Stockholm during the year, million 42.4 40.3 27.3 31.4 42.0 39.3 56.4 172.3 308.0 147.0 203.2<br />
Number of Series B shares<br />
traded in Stockholm during the<br />
year, million 391.2 344.4 349.4 404.8 498.0 518.7 617.0 2,712.4 3,130.0 2,713.9 2,272.4<br />
Number of shares traded in ADR,<br />
NASDAQ during the year, million 16.0 15.0 11.0 10.4 24.0 19.8 14.1 113.5 – – –<br />
<strong>The</strong> largest shareholders in AB <strong>Volvo</strong>, December 31, <strong>2010</strong> 1<br />
Number of<br />
shares<br />
% of total<br />
votes<br />
Share<br />
capital, %<br />
Renault s.a.s. 138,604,945 17.5 6.8<br />
Industrivärden 92,445,434 11.1 4.6<br />
Violet Partners LP 43,727,400 5.5 2.2<br />
SHB 2 46,454,585 4.8 2.3<br />
AMF Insurance & Funds 56,042,500 3.9 2.8<br />
AFA Insurance 29,136,945 3.5 1.4<br />
Alecta (pension funds) 69,725,000 3.5 3.4<br />
Swedbank Robur Funds 90,469,158 3.5 4.5<br />
SEB Funds/Trygg Life Insurance 50,605,131 2.6 2.5<br />
Skandia Liv 21,619,796 2.5 1.1<br />
Total 638,830,894 58.4 31.6<br />
Distribution of shares, December 31, <strong>2010</strong> 1<br />
<strong>Volvo</strong> shareholders<br />
Number of<br />
shareholders<br />
% of total<br />
votes 1<br />
Share of<br />
capital, % 1<br />
1–1,000 shares 182,716 2.3 2.8<br />
1,001–10,000 shares 52,572 5.4 7.3<br />
10,001–100,000 shares 4,050 3.1 4.8<br />
100,001– 703 89.2 85.1<br />
Total 240,043 100.0 100.0<br />
1 Based on all registered shares.<br />
AB <strong>Volvo</strong> held 4.7% of the Company’s shares on December 31, <strong>2010</strong>.<br />
1 Based on the number of outstanding shares.<br />
2 Comprises shares held by SHB, SHB Pension Fund, SHB Employee Fund,<br />
SHB Pensionskassa and Oktogonen.<br />
134
Business area statistics<br />
Net sales 1<br />
SEK M 2000 2001 2002 2003 2004 2005 2006 2007 2008 2009 <strong>2010</strong><br />
Trucks Western Europe 30,415 60,841 61,406 63,097 68,664 70,567 80,116 86,035 86,994 58,754 60,139<br />
Eastern Europe 3,158 5,526 6,424 7,004 8,767 9,139 13,166 22,616 22,920 7,120 9,467<br />
North America 17,048 33,630 33,721 28,151 35,154 46,129 50,605 27,255 26,588 21,563 26,901<br />
South America 3,111 3,993 3,277 3,464 5,223 7,657 9,213 11,483 14,680 12,490 21,680<br />
Asia 3,432 4,659 5,919 9,206 12,378 13,551 8,975 26,593 37,515 26,943 35,231<br />
Other markets 1,911 7,919 8,005 6,047 6,693 8,353 9,190 13,910 14,538 12,069 13,887<br />
Total 59,075 116,568 118,752 116,969 136,879 155,396 171,265 187,892 203,235 138,940 167,305<br />
Buses Western Europe 6,767 6,263 6,695 6,153 6,422 6,564 7,390 7,204 6,987 7,269 6,088<br />
Eastern Europe 182 373 409 381 526 578 534 563 334 438 154<br />
North America 7,723 6,847 3,838 2,984 2,960 4,247 4,910 4,630 5,355 5,673 7,200<br />
South America 732 757 366 329 521 2,641 1,537 1,623 1,571 1,235 1,737<br />
Asia 1,269 1,839 2,022 1,447 1,632 1,612 2,003 1,802 2,094 2,749 3,299<br />
Other markets 514 596 705 684 661 947 897 786 971 1,101 2,038<br />
Total 17,187 16,675 14,035 11,978 12,722 16,589 17,271 16,608 17,312 18,465 20,516<br />
Construction Western Europe 10,029 10,326 10,383 11,576 12,443 14,213 18,438 21,852 20,763 11,188 13,471<br />
Equipment<br />
Eastern Europe 255 341 454 772 1,010 1,311 1,888 3,442 4,429 1,799 2,667<br />
North America 5,823 6,145 5,667 5,428 8,601 10,337 11,280 11,170 10,159 5,475 6,267<br />
South America 776 847 709 636 922 1,238 1,358 2,155 2,913 2,578 4,130<br />
Asia 2,484 2,773 3,048 3,707 4,961 5,717 6,903 12,179 13,738 12,957 24,352<br />
Other markets 626 703 751 1,035 1,423 2,000 2,264 2,835 4,077 1,661 2,923<br />
Total 19,993 21,135 21,012 23,154 29,360 34,816 42,131 53,633 56,079 35,658 53,810<br />
<strong>Volvo</strong> Penta Western Europe 3,204 3,789 3,846 4,081 4,723 4,845 5,748 6,290 6,100 4,113 4,221<br />
Eastern Europe 30 38 99 108 184 257 363 508 454 277 285<br />
North America 2,257 2,175 2,261 2,109 2,500 2,832 2,815 2,674 1,947 1,100 1,501<br />
South America 160 213 127 146 142 208 221 274 364 284 335<br />
Asia 794 988 1,141 947 1,324 1,427 1,359 1,624 2,082 2,054 2,008<br />
Other markets 154 177 195 205 184 207 268 349 486 331 366<br />
Total 6,599 7,380 7,669 7,596 9,057 9,776 10,774 11,719 11,433 8,159 8,716<br />
<strong>Volvo</strong> Aero Western Europe 4,651 4,788 3,422 3,951 3,130 3,346 3,674 3,431 3,468 3,914 3,744<br />
Eastern Europe 42 87 28 49 49 60 124 31 29 28 24<br />
North America 5,040 5,841 4,573 3,301 3,127 3,612 3,815 3,723 3,534 3,508 3,599<br />
South America 134 187 177 152 138 168 173 127 58 34 27<br />
Asia 701 708 497 428 400 284 356 234 234 205 233<br />
Other markets 145 173 140 149 81 68 91 100 125 114 81<br />
Total 10,713 11,784 8,837 8,030 6,925 7,538 8,233 7,646 7,448 7,803 7,708<br />
Other and<br />
eliminations 6,825 7,073 6,775 7,041 7,228 7,076 (654) (703) (575) (538) (680)<br />
Net sales Industrial Operations 180,615 177,080 174,768 202,171 231,191 249,020 276,795 294,932 208,487 257,375<br />
Customer Western Europe 6,240 5,314 5,573 5,604 6,114 4,213 4,009 3,845 6,021 5,417 3,909<br />
Finance Eastern Europe 257 360 424 474 499 584 379 639 1,078 1,710 824<br />
North America 2,626 3,216 3,344 2,542 2,432 2,036 2,569 2,467 369 3,004 2,605<br />
South America 452 451 403 358 396 570 608 620 791 1,070 1,156<br />
Asia 0 24 49 65 90 101 45 87 158 435 435<br />
Other markets 103 130 132 110 67 45 38 47 68 75 101<br />
Total 9,678 9,495 9,925 9,153 9,598 7,549 7,648 7,705 8,485 11,711 9,031<br />
Eliminations – (830) (807) (630) (693) 1,819 2,167 905 250 (1,836) (1,658)<br />
<strong>Volvo</strong> <strong>Group</strong> total 130,070 189,280 186,198 183,291 211,076 240,559 258,835 285,405 303,667 218,361 264,749<br />
As of January 1, 2007, the results from the synergies created in the<br />
business units are transferred back to the various business areas. Comparison<br />
figures for 2006 have been restated.<br />
1 Net sales 2000–2001 have been restated in accordance with new organization<br />
effective from 2002.<br />
135
Financial information <strong>2010</strong><br />
Eleven-year summary<br />
Operating income<br />
SEK M 2000 2001 4 2002 2003 3 2004 2 2005 2006 1 2007 2008 2009 <strong>2010</strong><br />
Trucks 5 1,414 (2,066) 1,189 3,951 8,992 11,717 13,116 15,193 12,167 (10,805) 10,112<br />
Buses 440 (916) (94) (790) 158 470 745 231 (76) (350) 780<br />
Construction Equipment 1,594 527 406 908 1,898 2,752 4,072 4,218 1,808 (4,005) 6,180<br />
<strong>Volvo</strong> Penta 484 658 647 695 940 943 1,105 1,173 928 (230) 578<br />
<strong>Volvo</strong> Aero 621 653 5 (44) 403 836 359 529 359 50 286<br />
Customer Finance 1,499 325 490 926 1,365 2,033 1,686 1,649 1,397 (680) 167<br />
Other 616 143 194 (3,142) 923 (598) (684) (762) (731) (994) (102)<br />
Operating income<br />
(loss) <strong>Volvo</strong> <strong>Group</strong> 6,668 (676) 2,837 2,504 14,679 18,153 20,399 22,231 15,851 (17,013) 18,000<br />
As of January 1, 2007, the benefits from the synergies created in the<br />
business units are transferred back to the various business areas. Comparison<br />
figures for 2006 have been restated.<br />
1 Operating income in 2006 includes adjustment of goodwill of neg 1,712,<br />
reported in Trucks.<br />
2 Operating income in 2004 included reversal of write-down of shares in Scania<br />
AB of 915, reported in Other, and write-down of shares in Henlys <strong>Group</strong> Plc of<br />
95, reported in Buses.<br />
3 Operating income in 2003 included write-down of shares in Scania AB and<br />
Henlys <strong>Group</strong> Plc amounting to 4,030, of which 429 was reported in Buses<br />
(Henlys <strong>Group</strong>) and 3,601 was reported in Other (Scania AB).<br />
4 Operating income in 2001 included restructuring costs mainly related to the<br />
integration of Mack Trucks and Renault Trucks of 3,862 of which 3,106 in<br />
Trucks, 392 in Buses and 364 in Construction Equipment.<br />
5 Refers to <strong>Volvo</strong> Trucks for 2000.<br />
Operating margin<br />
% 2000 2001 2002 2003 2004 2005 2006 2007 2008 2009 <strong>2010</strong><br />
Trucks 2.4 (1.8) 1.0 3.4 6.6 7.5 7.7 8.1 6.0 (7.8) 6.0<br />
Construction Equipment 8.0 2.5 1.9 3.9 6.5 7.9 9.7 7.9 3.2 (11.2) 11.5<br />
Buses 2.6 (5.5) (0.7) (6.6) 1.2 2.8 4.3 1.4 (0.4) (1.9) 3.8<br />
<strong>Volvo</strong> Penta 7.3 8.9 8.4 9.1 10.4 9.6 10.3 10.0 8.1 (2.8) 6.6<br />
<strong>Volvo</strong> Aero 5.8 5.5 0.1 (0.5) 5.8 11.1 4.4 6.9 4.8 0.6 3.7<br />
<strong>Volvo</strong> <strong>Group</strong> Industrial<br />
Operations 5.5 (0.4) 1.6 1.4 7.3 7.9 7.9 7.8 5.2 (7.8) 6.9<br />
Number of employees at year-end<br />
Number 1,2 2000 2001 2002 2003 2004 2005 2006 2007 2008 2009 <strong>2010</strong><br />
Trucks 24,320 44,180 43,470 46,900 49,450 50,240 49,900 64,390 64,280 56,505 57,796<br />
Buses 9,060 6,230 6,660 6,680 7,700 7,710 7,760 9,290 8,930 9,541 8,685<br />
Construction Equipment 8,830 7,780 8,410 9,280 9,930 10,290 11,050 19,710 19,810 16,126 16,648<br />
<strong>Volvo</strong> Penta 1,480 1,370 1,410 1,440 1,580 1,560 1,650 3,000 2,940 2,928 2,353<br />
<strong>Volvo</strong> Aero 4,240 4,040 3,660 3,440 3,350 3,460 3,510 3,550 3,510 3,278 3,120<br />
Financial Services 1,220 1,080 1,060 1,060 1,100 1,070 1,010 1,150 1,290 1,234 1,235<br />
Other 5,120 6,240 6,490 6,940 7,970 7,530 8,310 610 620 596 572<br />
<strong>Volvo</strong> <strong>Group</strong>, total 54,270 70,920 71,160 75,740 81,080 81,860 83,190 101,700 101,380 90,208 90,409<br />
1 As of 2007, employees in business units are allocated to the business areas.<br />
2 As of 2009 regular employees are shown, previously temporary employees were also included.<br />
136
Employees<br />
Number 1 2000 2001 2002 2003 2004 2005 2006 2007 2008 2009 <strong>2010</strong><br />
Sweden 25,030 24,350 25,420 26,380 28,530 27,070 27,830 28,660 28,190 22,763 23,073<br />
Europe, excluding Sweden 12,320 27,800 27,130 29,120 28,930 29,650 30,070 32,780 32,940 29,793 29,239<br />
North America 11,410 12,670 12,440 12,270 14,620 15,140 14,820 15,750 14,200 12,640 12,844<br />
South America 2,100 2,090 2,020 2,640 3,110 3,690 3,890 4,640 4,380 4,257 4,322<br />
Asia 2,570 2,550 2,590 3,710 4,130 4,210 4,420 17,150 19,090 18,416 18,535<br />
Other markets 840 1,460 1,560 1,620 1,760 2,100 2,160 2,720 2,580 2,339 2,396<br />
<strong>Volvo</strong> <strong>Group</strong> total 54,270 70,920 71,160 75,740 81,080 81,860 83,190 101,700 101,380 90,208 90,409<br />
1 As of 2009 regular employees are shown, previously temporary employees were also included.<br />
Delivered units<br />
Number 2000 2001 2002 2003 2004 2005 2006 2007 2008 2009 <strong>2010</strong><br />
Heavy-duty trucks (>16 tons) 76,470 117,180 120,200 120,920 152,300 172,242 179,089 172,322 179,962 82,675 123,522<br />
Medium-duty trucks (7–15.9 tons) 5,360 17,310 16,220 15,870 18,800 18,643 14,695 27,933 30,817 21,653 30,657<br />
Light trucks (
Corporate Governance <strong>Report</strong> <strong>2010</strong><br />
<strong>Group</strong> Management<br />
Olof Persson<br />
Leif Johansson Pär Östberg Dennis Slagle Jan-Eric Sundgren<br />
Satoru Takeuchi<br />
Stefano Chmielewski Staffan Zackrisson Per Löjdquist Mikael Bratt Stefan Johnsson<br />
Göran Gummeson<br />
Staffan Jufors<br />
Håkan Karlsson<br />
Eva Persson<br />
Peter Karlsten<br />
Martin Weissburg<br />
138
<strong>Group</strong> Management<br />
Leif Johansson<br />
President and CEO<br />
Born 1951. M. Sc. Engineering. President of AB <strong>Volvo</strong> and<br />
Chief Executive Officer of the <strong>Volvo</strong> <strong>Group</strong> since 1997.<br />
With <strong>Volvo</strong> since 1997. Chairman: ERT (European Round<br />
Table of Industrialists). Board member: Bristol-Myers<br />
Squibb Company, Svenska Cellulosa Aktiebolaget SCA and<br />
<strong>The</strong> Confederation of Swedish Enterprise. Member of the<br />
Royal Swedish Academy of Engineering Sciences. Member<br />
of the <strong>Volvo</strong> Board since 1997. Holdings in <strong>Volvo</strong>, own<br />
and related parties: 540,810 shares, including 349,023<br />
Series B shares.<br />
Staffan Jufors<br />
President of <strong>Volvo</strong> Trucks<br />
Born 1951. Master of Business Administration. President of<br />
<strong>Volvo</strong> Trucks since 2004. President of <strong>Volvo</strong> Penta 1998–<br />
2004. Member of the <strong>Group</strong> Executive Committee since<br />
1998. With <strong>Volvo</strong> since 1975. Board member: Seco Tools<br />
AB. Holdings in <strong>Volvo</strong>, own and related parties: 40,863<br />
shares, including 34,937 Series B shares.<br />
Stefano Chmielewski<br />
President of Renault Trucks<br />
Born 1952. MA M. Sc. Electronics/Automation. President of<br />
Renault Trucks since 2003. Member of the <strong>Group</strong> Executive<br />
Committee since 2003. With <strong>Volvo</strong> since 2001. Holdings in<br />
<strong>Volvo</strong>, own and related parties: None.<br />
Dennis Slagle<br />
President and CEO of North American Trucks<br />
Born 1954. Bachelor of Science. President and CEO of<br />
North American Trucks since November 1, 2009. President<br />
and CEO of Mack Trucks, Inc. since 2008. President and<br />
CEO of <strong>Volvo</strong> Construction Equipment North America<br />
2003–2008. Previously President of L.B. Smith, Inc. Member<br />
of the <strong>Group</strong> Executive Committee since 2008. With<br />
<strong>Volvo</strong> since 2000. Board member: West Virginia Wesleyan<br />
Collage Board of Trustees. Holdings in <strong>Volvo</strong>, own and<br />
related parties: 8,838 Series B shares.<br />
Satoru Takeuchi<br />
President of UD Trucks, included in Trucks Asia<br />
Born 1946. President of UD Trucks since 2007. Member of<br />
the <strong>Group</strong> Executive Committee since 2007. With <strong>Volvo</strong><br />
since 2007. Holdings in <strong>Volvo</strong>, own and related parties:<br />
None.<br />
Håkan Karlsson<br />
President of <strong>Volvo</strong> Buses<br />
Born 1961. M. Sc. Engineering. President of <strong>Volvo</strong> Buses<br />
since 2003. President of <strong>Volvo</strong> Logistics 2000–2003. Member<br />
of the <strong>Group</strong> Executive Committee since 2003. With<br />
<strong>Volvo</strong> since 1986. Holdings in <strong>Volvo</strong>, own and related<br />
parties: 37,333 shares, including 35,842 Series B shares.<br />
Olof Persson<br />
President of <strong>Volvo</strong> Construction Equipment<br />
Born 1964. Bachelor of Business Administration. President<br />
of <strong>Volvo</strong> Aero 2006–2008. President of <strong>Volvo</strong> Construction<br />
Equipment since 2008. Member of the <strong>Group</strong> Executive<br />
Committee since 2006. With <strong>Volvo</strong> since 2006. Holdings in<br />
<strong>Volvo</strong>, own and related parties: 42,250 Series B shares.<br />
Göran Gummeson<br />
President of <strong>Volvo</strong> Penta<br />
Born 1947. President of <strong>Volvo</strong> Penta since 2004. Has held<br />
various positions at <strong>Volvo</strong> Penta since 1991, head of <strong>Volvo</strong><br />
Penta’s European operations 1998–2004. Member of the<br />
<strong>Group</strong> Executive Committee since 2004. With <strong>Volvo</strong> since<br />
1991. Holdings in <strong>Volvo</strong>, own and related parties:<br />
108,962 shares, including 108,862 Series B shares.<br />
Staffan Zackrisson<br />
President of <strong>Volvo</strong> Aero<br />
Born 1953. Master of Science & Engineering. President of<br />
<strong>Volvo</strong> Aero since 2008. Has held various positions at <strong>Volvo</strong><br />
Aero 1979–87 and since 1989. Member of the <strong>Group</strong> Executive<br />
Committee since 2008. With <strong>Volvo</strong> 1979–87 and since<br />
1989. Holdings in <strong>Volvo</strong>, own and related parties:<br />
10,333 Series B shares.<br />
Martin Weissburg<br />
President of <strong>Volvo</strong> Financial Services<br />
Born 1962. Bachelor of Science, Master of Business Administration.<br />
President of <strong>Volvo</strong> Financial Services since May 15,<br />
<strong>2010</strong>. President of <strong>Volvo</strong> Financial Services the Americas<br />
2005–<strong>2010</strong>. Member of the <strong>Group</strong> Executive Committee<br />
since May 15, <strong>2010</strong>. With <strong>Volvo</strong> since 2005. Holdings in<br />
<strong>Volvo</strong>, own and related parties: 4,500 Series B shares.<br />
Peter Karlsten<br />
President of <strong>Volvo</strong> Powertrain<br />
Born 1957. M. Sc. Electrical Engineering. President of <strong>Volvo</strong><br />
Powertrain since 2007. Senior Vice President Technology<br />
for the <strong>Volvo</strong> <strong>Group</strong> since 2007. Head of <strong>Volvo</strong> Trucks in<br />
Brazil 2001–2003. Head of <strong>Volvo</strong>’s North American truck<br />
operations 2003–2007. Member of the <strong>Group</strong> Executive<br />
Committee since 2007. With <strong>Volvo</strong> since 2001. Holdings in<br />
<strong>Volvo</strong>, own and related parties: 142,406 shares, including<br />
142,250 series B shares.<br />
Pär Östberg<br />
Senior Vice President and President Trucks Asia<br />
Born 1962. Master of Business Administration. Senior Vice<br />
President of AB <strong>Volvo</strong> since 2005. Has held various senior<br />
positions in the financial areas in the <strong>Volvo</strong> <strong>Group</strong> since 1990,<br />
most recently as CFO of the <strong>Volvo</strong> <strong>Group</strong> 2005–2008, prior<br />
to that as Senior Vice President and CFO of Renault Trucks<br />
2004–2005. Member of the <strong>Group</strong> Executive Committee<br />
since 2005. With <strong>Volvo</strong> since 1990. Holdings in <strong>Volvo</strong>,<br />
own and related parties: 150,767 shares, including<br />
150,667 Series B shares.<br />
Stefan Johnsson<br />
Senior Vice President<br />
Born 1959. Master of Business Administration. Senior Vice<br />
President of AB <strong>Volvo</strong> responsible for business units, human<br />
resources and coordination of the <strong>Group</strong>’s soft products<br />
business. Senior Vice President of AB <strong>Volvo</strong> and CFO of the<br />
<strong>Volvo</strong> <strong>Group</strong> 1998–2005. President of <strong>Volvo</strong> <strong>Group</strong> Finance<br />
Sweden 1994–1998. Member of the <strong>Group</strong> Executive Committee<br />
since 1998. With <strong>Volvo</strong> since 1987. Board member:<br />
<strong>The</strong> Association of Swedish Engineering Industries, <strong>The</strong><br />
Chalmers University of Technology Foundation and GU<br />
School of Executive Education AB. Holdings in <strong>Volvo</strong>, own<br />
and related parties: 149,198 shares, including 148,667<br />
Series B shares.<br />
Mikael Bratt<br />
Senior Vice President and CFO<br />
Born 1967. Senior Vice President of AB <strong>Volvo</strong> and CFO of<br />
the <strong>Volvo</strong> <strong>Group</strong> since 2008. Responsible for finance, strategy<br />
and business development. Has held various senior<br />
positions in the financial areas in the <strong>Volvo</strong> <strong>Group</strong>, most<br />
recently as Vice President & Head of Corporate Finance at<br />
AB <strong>Volvo</strong>. Member of the <strong>Group</strong> Executive Committee since<br />
2008. With <strong>Volvo</strong> since 1988. Holdings in <strong>Volvo</strong>, own and<br />
related parties: 73,802 shares, including 72,967 Series B<br />
shares.<br />
Eva Persson<br />
Senior Vice President and General Counsel<br />
Born 1953. Master of Laws. Senior Vice President of AB<br />
<strong>Volvo</strong> and General Counsel of the <strong>Volvo</strong> <strong>Group</strong>. Responsible<br />
for legal, compliance, tax and security matters. Member of<br />
the <strong>Group</strong> Executive Committee since 1997. With <strong>Volvo</strong><br />
since 1988. Secretary to the <strong>Volvo</strong> Board since 1997. Board<br />
member: Handelsbanken Region Väst and Norsk Hydro<br />
ASA. Holdings in <strong>Volvo</strong>, own and related parties: 75,823<br />
shares, including 74,407 Series B shares.<br />
Per Löjdquist<br />
Senior Vice President<br />
Born 1949. Senior Vice President of AB <strong>Volvo</strong> responsible<br />
for corporate communications and brand management.<br />
Member of the <strong>Group</strong> Executive Committee since 1997.<br />
With <strong>Volvo</strong> since 1973. Holdings in <strong>Volvo</strong>, own and related<br />
parties: 114,142 shares, including 97,362 Series B shares.<br />
Jan-Eric Sundgren<br />
Senior Vice President<br />
Born 1951. M. Sc. Engineering, PhD in solid state Physics,<br />
Professor in materials science. Senior Vice President of AB<br />
<strong>Volvo</strong> responsible for public and environmental affairs. Member<br />
of the <strong>Group</strong> Executive Committee since 2006. With<br />
<strong>Volvo</strong> since 2006. Chairman: SP Technical Research Institute<br />
of Sweden. Board member: Hogia AB and Lindholmen<br />
Science Park AB. Member of the Royal Swedish Academy of<br />
Engineering Sciences. Holdings in <strong>Volvo</strong>, own and related<br />
parties: 25,202 Series B shares.<br />
Changes in <strong>Group</strong> Executive<br />
Committee<br />
Tony Helsham, Senior Vice President responsible for soft<br />
products, resigned from the <strong>Group</strong> Executive Committee on<br />
March 31, <strong>2010</strong>.<br />
Martin Weissburg has been appointed as new President<br />
of the <strong>Volvo</strong> <strong>Group</strong>’s customer finance company, <strong>Volvo</strong><br />
Financial Services (VFS). Weissburg assumed his new position<br />
on May 15, <strong>2010</strong> and replaced Salvatore L Mauro, who<br />
was appointed new head of the <strong>Volvo</strong> <strong>Group</strong>’s representation<br />
office in New York.<br />
On December 8, <strong>2010</strong> Leif Johansson informed his<br />
intention to resign as CEO of the <strong>Volvo</strong> <strong>Group</strong> in conjunction<br />
with his 60th birthday in the summer of 2011.<br />
139
Corporate Governance <strong>Report</strong> <strong>2010</strong><br />
Board of Directors and Auditors<br />
In October <strong>2010</strong>, the Board visited UD Trucks in Ageo, Japan.<br />
8<br />
13 11<br />
14<br />
10 12<br />
6 1<br />
4<br />
5 7<br />
2<br />
3 9<br />
140
Board members elected by the<br />
<strong>Annual</strong> General Meeting<br />
1. Louis Schweitzer<br />
Chairman of the Board since January 15, <strong>2010</strong><br />
Chairman of the Remuneration Committee<br />
Born 1942. Bachelor of Laws. Board Chairman: Astra-<br />
Zeneca Plc. Board member: BNP-Paribas, L’Oréal and<br />
Véolia. Member of the <strong>Volvo</strong> Board since 2001. Chairman<br />
of the Board since January 15, <strong>2010</strong>. Holdings in <strong>Volvo</strong>,<br />
own and related parties: 40,000 Series B shares.<br />
Principal work experience: Official at French Budget<br />
Department; Chief of Staff of Mr Laurent Fabius (Minister<br />
of Budget, then Minister for Industry and Research, and<br />
Prime Minister), Chairman of the French High Authority<br />
against Discrimination and for Equality, HALDE (2005–<br />
<strong>2010</strong>); numerous positions with Renault S.A. (Chief Financial<br />
Officer and Executive Vice President Finance and<br />
Planning, Chief Operating Officer, Chairman and Chief<br />
Executive Officer).<br />
2. Peter Bijur<br />
Member of the Audit Committee<br />
Born 1942. MBA Marketing, BA Political Science.<br />
Board member: Gulfmark Offshore Inc. Member of the<br />
<strong>Volvo</strong> Board since 2006. Holdings in <strong>Volvo</strong>, own and<br />
related parties: 3,000 Series B shares.<br />
Principal work experience: Numerous positions with Texaco<br />
Inc, retired as Chairman and Chief Executive Officer in 2001.<br />
3. Jean-Baptiste Duzan<br />
Member of the Audit Committee<br />
Born 1946. Graduate of the Ecole Polytechnique. Advisor to<br />
the Chief Executive Officer, Renault S.A. Senior Advisor<br />
Lazard Frères. Board member: Nissan Motor Co. Ltd.<br />
Member of the <strong>Volvo</strong> Board since 2009. Holdings in <strong>Volvo</strong>,<br />
own and related parties: 1,000 Series B shares.<br />
Principal work experience: Began his career at Citibank.<br />
Has held various positions within Renault since 1982 –<br />
director of financial services at Renault V.I.; director of<br />
financial operations; project director for the car model<br />
Safrane; Senior Vice President, Purchasing; and joined the<br />
Renault Management Committee. He was also named<br />
Chairman and Managing Director, Renault Nissan Purchasing<br />
Organization.<br />
4. Leif Johansson<br />
Born 1951. Master Sc Engineering. President of AB <strong>Volvo</strong><br />
and Chief Executive Officer of the <strong>Volvo</strong> <strong>Group</strong> since 1997.<br />
With <strong>Volvo</strong> since 1997. Chairman: ERT (European Round<br />
Table of Industrialists). Board member: Bristol-Myers<br />
Squibb Company, Svenska Cellulosa Aktiebolaget SCA and<br />
<strong>The</strong> Confederation of Swedish Enterprise. Member of the<br />
Royal Swedish Academy of Engineering Sciences. Member<br />
of the <strong>Volvo</strong> Board since 1997. Holdings in <strong>Volvo</strong>, own<br />
and related parties: 540,810 shares, including 349,023<br />
Series B shares.<br />
Principal work experience: Project consultant Indevo;<br />
Assistant to President Centro Maskin Morgårdshammar;<br />
President Husqvarna Motorcyklar; Division Manager Office<br />
Machines Facit Sweden; President Facit; Division Manager<br />
AB Electrolux Major Appliances; Division President AB<br />
Electrolux Major Appliances; Executive Vice President AB<br />
Electrolux; President AB Electrolux; CEO Electrolux <strong>Group</strong>.<br />
5. Hanne de Mora<br />
Born 1960. BA in Economics from HEC in Lausanne, MBA<br />
from IESE in Barcelona. Board Chairman: a-connect<br />
(group) ag. Board member: Sandvik AB. Member of the<br />
<strong>Volvo</strong> Board since <strong>2010</strong>. Holdings in <strong>Volvo</strong>, own and<br />
related parties: 3,000 Series B shares.<br />
Principal work experience: Credit Analyst Den Norske<br />
Creditbank in Luxemburg 1984, various positions within<br />
brand management and controlling within Procter & Gamble<br />
1986–1989, Partner McKinsey & Company, Inc. 1989–<br />
2002, one of the founders and owners, also Chairman of<br />
the Board, of the management company a-connect (group)<br />
ag since 2002.<br />
6. Anders Nyrén<br />
Member of the Remuneration Committee<br />
Born 1954. Graduate of the Stockholm School of Economics,<br />
MBA at UCLA. President and Chief Executive Officer<br />
of AB Industrivärden. Board Chairman: Sandvik AB. Vice<br />
Chairman: Svenska Handelsbanken. Board member: AB<br />
Industrivärden, Ernströmgruppen, SSAB Svenskt Stål AB,<br />
Svenska Cellulosa Aktiebolaget SCA, Telefonaktiebolaget<br />
LM Ericsson and SSE Association. Member of the <strong>Volvo</strong><br />
Board since 2009. Holdings in <strong>Volvo</strong>, own and related<br />
parties: 5,200 Series B shares.<br />
Principal work experience: Has worked for AB Wilhelm<br />
Becker. He has held various positions within STC – Controller,<br />
Executive Vice President and CFO, and President of STC<br />
Venture AB; President and Chief Executive Officer at OM<br />
International AB; Executive Vice President and CFO at<br />
Securum; Director with executive responsibility for Markets<br />
and Corporate Finance at Nordbanken; Executive Vice<br />
President and CFO at Skanska.<br />
7. Ravi Venkatesan<br />
Born 1963. MBA and M Sc Industrial Engineering. Chairman<br />
of Microsoft India and responsible for Microsoft’s marketing,<br />
operational and business development efforts in India.<br />
Board member: Non Profit Advisory Board Harvard Business<br />
School, Advisory Board Indian Institute of Technology.<br />
Member of the <strong>Volvo</strong> Board since 2008. Holdings in <strong>Volvo</strong>,<br />
own and related parties: 700 Series B shares.<br />
Principal work experience: Several leading positions within<br />
the American engine manufacturer Cummins.<br />
8. Lars Westerberg<br />
Chairman of the Audit Committee<br />
Born 1948. M Sc Engineering, Bachelor Business Administration.<br />
Board Chairman: Autoliv Inc., Husqvarna AB and<br />
Vattenfall AB. Board member: SSAB Svenskt Stål AB and<br />
Sandvik AB. Member of the <strong>Volvo</strong> Board since 2007. Holdings<br />
in <strong>Volvo</strong>, own and related parties: 60,000 Series A<br />
shares.<br />
Principal work experience: President and CEO of Gränges<br />
AB, ESAB AB and Autoliv Inc.<br />
9. Ying Yeh<br />
Member of the Remuneration Committee<br />
Born 1948. BA, Literature & International Relations. Vice<br />
President and Chairman of Nalco Company, Greater China<br />
Region. Member of the <strong>Volvo</strong> Board since 2006. Holdings<br />
in <strong>Volvo</strong>, own and related parties: None.<br />
Principal work experience: Journalist NBC, New York.<br />
Numerous positions with the U.S. Government Foreign<br />
Service in Burma, Hong Kong, Taiwan and Beijing. Various<br />
positions with Eastman Kodak in China, latest as President<br />
and Chairman, North Asia Region.<br />
Board members and deputies<br />
appointed by employee organisations<br />
10. Martin Linder<br />
Employee representative. Born 1973. With <strong>Volvo</strong> since<br />
1994. Member of the <strong>Volvo</strong> Board since 2004. Holdings<br />
in <strong>Volvo</strong>, own and related parties: 212 Series A shares.<br />
11. Mikael Sällström<br />
Employee representative. Born 1959. With <strong>Volvo</strong> 1980–<br />
1999 and since 2009. Member of the <strong>Volvo</strong> Board since<br />
2009. Holdings in <strong>Volvo</strong>, own and related parties:<br />
None.<br />
12. Berth Thulin<br />
Employee representative. Born 1951. With <strong>Volvo</strong> since<br />
1975. Deputy member of the <strong>Volvo</strong> Board since 2009<br />
Holdings in <strong>Volvo</strong>, own and related parties: 1,425<br />
Series B shares.<br />
13. Lars Ask<br />
Employee representative. Born 1959. With <strong>Volvo</strong> since 1982.<br />
Deputy member of the <strong>Volvo</strong> Board since 2009. Holdings in<br />
<strong>Volvo</strong>, own and related parties: 406 shares, including 250<br />
Series B shares.<br />
14. Peteris Lauberts<br />
Employee representative. Born 1948. With <strong>Volvo</strong> since<br />
1999. Deputy member of the <strong>Volvo</strong> Board since <strong>2010</strong>.<br />
Holdings in <strong>Volvo</strong>, own and related parties: 156 Series A<br />
shares.<br />
Changes in the Board<br />
Board members elected by the <strong>Annual</strong> General<br />
Meeting<br />
On January 15, <strong>2010</strong>, Finn Johnsson resigned as Chairman<br />
and Board member. In connection therewith, Louis Schweitzer<br />
was appointed new Chairman until the next <strong>Annual</strong><br />
General Meeting.<br />
At the <strong>Annual</strong> General Meeting <strong>2010</strong> Louis Schweitzer<br />
was appointed Chairman of the Board until the next <strong>Annual</strong><br />
General Meeting. Hanne De Mora was appointed new<br />
member of the Board at the <strong>Annual</strong> General Meeting <strong>2010</strong>.<br />
Board members and deputies appointed by<br />
employee organisations<br />
On January 11, <strong>2010</strong>, Margareta Öhlin left her assignment<br />
as deputy. In connection therewith, Peteris Lauberts was<br />
appointed new deputy.<br />
Secretary to the Board<br />
Eva Persson<br />
Born 1953. Master of Laws. Senior Vice President of AB<br />
<strong>Volvo</strong> and General Counsel of the <strong>Volvo</strong> <strong>Group</strong>. Secretary to<br />
the <strong>Volvo</strong> Board since 1997. Holdings in <strong>Volvo</strong>, own and<br />
related parties: 75,823 shares, including 74,407 Series B<br />
shares.<br />
Auditors<br />
PricewaterhouseCoopers AB<br />
Göran Tidström<br />
Authorized Public Accountant.<br />
Lead Partner.<br />
Auditor since 2006.<br />
Other assignments: Auditor of Trelleborg AB, Meda AB and<br />
Kungliga Operan. President of IFAC (International Federation<br />
of Accountants).<br />
Born 1946.<br />
Johan Rippe<br />
Authorized Public Accountant.<br />
Auditor since <strong>2010</strong>.<br />
Other assignments: Auditor of Getinge AB and Elanders<br />
AB.<br />
Born 1968.<br />
141
Corporate Governance <strong>Report</strong> <strong>2010</strong><br />
Corpor ate Governance <strong>Report</strong><br />
During <strong>2010</strong>, the Board focused specifically on the <strong>Group</strong>’s business development taking into<br />
account the earlier uncertainty primarily on the North American and European markets and the<br />
recovery that occurred in <strong>2010</strong> regarding demand for the <strong>Group</strong>’s products. In addition, the Board<br />
focused on development of the <strong>Group</strong>’s operations ongoing in China, Japan and India.<br />
<strong>The</strong> <strong>Volvo</strong> <strong>Group</strong> Corporate Governance Model<br />
Remuneration<br />
Committee<br />
Audit Committee<br />
Business Areas<br />
Corporate bodies in corporate<br />
governance<br />
<strong>The</strong> governance and control of the <strong>Volvo</strong><br />
<strong>Group</strong> is carried out through a number of corporate<br />
bodies. At the <strong>Annual</strong> General Meeting,<br />
the shareholders exercise their voting rights<br />
with regard, for example, to the composition of<br />
the Board of Directors of AB <strong>Volvo</strong> and election<br />
of external auditors and as otherwise<br />
stipulated in the Companies Act. Information<br />
concerning the largets shareholders in AB <strong>Volvo</strong><br />
as of December 31, <strong>2010</strong> is provided in the<br />
Board of Director’s report of <strong>Volvo</strong> on page 57.<br />
<strong>The</strong> notice for <strong>Annual</strong> General Meetings<br />
(and for Extraordinary General Meetings if<br />
any) is, as from the <strong>Annual</strong> General Meeting<br />
2011, made through advertisement in the<br />
Post- and Inrikes Tidningar (Swedish Official<br />
Gazette and on the company’s website).<br />
Announcement that the notice has been published<br />
is advertised in Dagens Nyheter and<br />
Göteborgs-Posten.<br />
An Election Committee, appointed by the<br />
<strong>Annual</strong> General Meeting of AB <strong>Volvo</strong>, proposes<br />
candidates to serve as Board members,<br />
Board Chairman and external auditors. <strong>The</strong><br />
Board is responsible for the <strong>Group</strong>’s long-term<br />
development and strategy, for controlling and<br />
evaluating the company’s operations and for<br />
the other duties set forth in the Companies<br />
Act. In addition, the Board appoints the President<br />
of AB <strong>Volvo</strong>, who is also the Chief Executive<br />
Officer (CEO). <strong>The</strong> duties of the Board are<br />
partly exercised through its Audit Committee<br />
and its Remuneration Committee. <strong>The</strong> CEO is<br />
in charge of the daily management of the<br />
<strong>Group</strong> in accordance with guidelines and<br />
instructions provided by the Board.<br />
<strong>The</strong> CEO is in charge of the daily management<br />
of the <strong>Group</strong> through primarily two different<br />
bodies, the <strong>Group</strong> Executive Committee<br />
and the business areas’ and business units’<br />
Boards of Directors. <strong>The</strong> <strong>Group</strong> Executive Committee<br />
comprises those who report directly to<br />
the CEO. <strong>The</strong> <strong>Group</strong> Executive Committee<br />
meetings, which are led by the CEO, deal with<br />
<strong>Group</strong>-wide issues and issues affecting more<br />
than one business area/unit, and sharing of<br />
information concerning the <strong>Group</strong>’s performance.<br />
<strong>The</strong> CEO or another member of the <strong>Group</strong><br />
Executive Committee is the Chairman of the<br />
Boards of all business areas and business<br />
units, which are comprised mainly of other<br />
Shareholders<br />
<strong>Annual</strong> General Meeting<br />
Board<br />
President<br />
<strong>Group</strong> Executive Committee<br />
Election Commitee<br />
Auditors<br />
Business Units<br />
members of the <strong>Group</strong> Executive Committee.<br />
<strong>The</strong> Boards of the business areas and business<br />
units effect control and follow-ups of business<br />
areas’ and business units’ financial development,<br />
business plans and goals as well as make<br />
decisions regarding, for example, investments.<br />
Swedish Code of Corporate Governance<br />
<strong>Volvo</strong> applies the Swedish Code of Corporate<br />
Governance (the Code), which is available at<br />
www.bolagsstyrning.se.<br />
142
Between January 1, <strong>2010</strong> and December 31,<br />
<strong>2010</strong> <strong>Volvo</strong> did not deviate from any of the regulations<br />
set forth in the Code.<br />
This Corporate Governance <strong>Report</strong> has been<br />
prepared in accordance with the <strong>Annual</strong><br />
Accounts Act and the Code.<br />
Election Committee<br />
<strong>The</strong> Election Committee is the shareholders’<br />
body responsible for submitting to the <strong>Annual</strong><br />
General Meeting the names of candidates to<br />
serve as Chairman at the Meeting and Chairman<br />
and other members of the Board as well<br />
as proposal for fees and other compensations<br />
to be paid to the Board members. In the years<br />
in which election of auditors for <strong>Volvo</strong> shall be<br />
held, the Election Committee presents proposal<br />
for election of auditors and proposal for<br />
fees to be paid to the auditors based on the<br />
preparations carried out by <strong>Volvo</strong>’s Audit Committee.<br />
In addition, the Election Committee, in<br />
accordance with prevailing instructions for<br />
<strong>Volvo</strong>’s Election Committee, presents proposals<br />
for members of the Election Committee<br />
for the following year.<br />
In accordance with the aforementioned<br />
instructions, the Election Committee shall<br />
meet as often as required for the Committee<br />
to be able to fulfill its duties.<br />
<strong>The</strong> Election Committee’s proposal shall be<br />
presented to <strong>Volvo</strong> in sufficient time to be<br />
included in the notice to attend the <strong>Annual</strong><br />
General Meeting and to be published on <strong>Volvo</strong>’s<br />
website at the same time. In conjunction with<br />
the notice to attend the <strong>Annual</strong> General Meeting<br />
is published, the Election Committee shall,<br />
among other things, comment on whether<br />
those persons who are proposed to be elected<br />
as Board members are to be considered as<br />
independent in relation to the company and<br />
company management as well as to major<br />
shareholders in the company and further to<br />
comment on their material assignments and<br />
holding of shares in <strong>Volvo</strong>. Moreover, the Committee<br />
shall report on how it conducted its work.<br />
In accordance with existing instructions, the<br />
<strong>Annual</strong> General Meeting shall select five<br />
members to serve on the Election Committee,<br />
of which four shall represent the largest shareholders<br />
in the company, in terms of the number<br />
of votes, who have expressed their willingness<br />
to participate. In addition, one of the members<br />
shall be the Chairman of the AB <strong>Volvo</strong> Board.<br />
Additionally, the Election Committee can offer<br />
other larger shareholders to appoint one representative<br />
as a member of the Election Committee.<br />
If such an offer is made, it should be<br />
directed in turn to the largest shareholder in<br />
terms of voting rights not already being represented<br />
on the Election Committee. <strong>The</strong><br />
number of members on the Election Committee,<br />
however, may not exceed seven.<br />
<strong>The</strong> Election Committee, which was<br />
appointed at <strong>Volvo</strong>’s <strong>Annual</strong> General Meeting<br />
in <strong>2010</strong> in accordance with the instructions,<br />
comprised <strong>Volvo</strong>’s Chairman Louis Schweitzer,<br />
Thierry Moulonguet, representing Renault<br />
s.a.s., Carl-Olof By, representing AB Industrivärden,<br />
Håkan Sandberg representing Svenska<br />
Handelsbanken, SHB Pension Fund, SHB<br />
Employee Fund, SHB Pensionskassa, and<br />
Oktogonen and Lars Förberg, representing<br />
Violet Partners LP. <strong>The</strong> Election Committee<br />
elected Thierry Moulonguet as Chairman.<br />
Later during <strong>2010</strong>, as offered by the Election<br />
Committee, AMF Pension appointed Ingrid<br />
Bonde as member of the Committee.<br />
<strong>The</strong> Election Committee has decided to<br />
propose to the <strong>Annual</strong> General Meeting 2011<br />
the re-election of Louis Schweitzer, Peter<br />
Bijur, Jean-Baptiste Duzan, Leif Johansson,<br />
Hanne De Mora, Anders Nyrén, Ravi Venkatesan,<br />
Lars Westerberg and Ying Yeh as members<br />
of the Board of Directors. <strong>The</strong> Election<br />
Committee has also decided to propose to the<br />
<strong>Annual</strong> General Meeting 2011 the re-election<br />
of Louis Schweitzer as Chairman of the Board.<br />
<strong>The</strong> Board<br />
During the period January 1, <strong>2010</strong> and January<br />
15, <strong>2010</strong>AB <strong>Volvo</strong>’s Board of Directors consisted<br />
of nine members elected by the <strong>Annual</strong><br />
General Meeting. In addition, the Board had<br />
<strong>The</strong> Board’s composition and attendance at<br />
meetings January 1, <strong>2010</strong> to December 31,<br />
20<br />
Finn Johnsson 1<br />
Audit Remuneration<br />
Board Committee Committee<br />
Peter Bijur 8 6<br />
Jean-Baptiste Duzan 8 6<br />
Leif Johansson 8<br />
Hane de Mora 2 4<br />
Anders Nyrén 8 5<br />
Louis Schweitzer 3 8 5<br />
Ravi Venkatesan 6<br />
Lars Westerberg 8 6<br />
Ying Yeh 4 8 5<br />
Martin Linder,<br />
employee representative 8<br />
Mikael Sällström,<br />
employee representative 8<br />
Berth Thulin,<br />
employee representative 8<br />
Total number of<br />
meetings 8 6 5<br />
1 Left the Board on January 15, <strong>2010</strong>.<br />
2 Was elected member of the Board on the <strong>Annual</strong><br />
General Meeting <strong>2010</strong>.<br />
3 Was appointed Chairman of the Board and Chariman<br />
of the Remuneration Committee as of January 15,<br />
<strong>2010</strong> until the close of the <strong>Annual</strong> General Meeting<br />
<strong>2010</strong>. Was Elected Chairman of the Board on the<br />
<strong>Annual</strong> General Meeting <strong>2010</strong>. Was appointed Chairman<br />
of the Remuneration Committee in connection<br />
with the <strong>Annual</strong> General Meeting <strong>2010</strong>.<br />
4 Member of the Remuneration Committee as of January<br />
15, <strong>2010</strong>.<br />
three members and two deputy members<br />
appointed by employee organizations.<br />
On January 15, <strong>2010</strong>, Finn Johnsson resigned<br />
as Chairman of the Board and Board member.<br />
<strong>The</strong>reby, the number of Board members elected<br />
by the <strong>Annual</strong> General Meeting decreased to<br />
eight. In connection with Finn Johnsson resigning<br />
as Chairman of the Board and Board member,<br />
the Board of Directors appointed Louis Schweitzer<br />
as new Chairman of the Board until the<br />
next <strong>Annual</strong> General Meeting.<br />
Effective from and including the <strong>2010</strong> <strong>Annual</strong><br />
General Meeting, AB <strong>Volvo</strong>’s Board of Directors<br />
comprised nine members elected by the <strong>Annual</strong><br />
General Meeting. In addition, the Board had<br />
three members and two deputy members<br />
appointed by employee organizations. Louis<br />
Schweitzer was elected Board Chairman at the<br />
<strong>2010</strong> <strong>Annual</strong> General Meeting.<br />
AB <strong>Volvo</strong>’s CEO, Leif Johansson, has been a<br />
member of the Board during the entire period.<br />
143
Corporate Governance <strong>Report</strong> <strong>2010</strong><br />
During <strong>2010</strong>, six regular meetings, one statutory<br />
meeting and one extraordinary meeting<br />
were held.<br />
<strong>The</strong> Board has adopted work procedures for<br />
its activities that contain rules pertaining to<br />
the distribution of work between the Board<br />
members, the number of Board meetings,<br />
matters to be handled at regular meetings of<br />
the Board and duties incumbent on the Chairman.<br />
In accordance with these procedures, the<br />
Board’s Chairman shall organize and guide the<br />
Board’s work, be responsible for contacts with<br />
the owners regarding ownership matters and<br />
provide the owners’ viewpoints to the Board,<br />
ensure that the Board receives adequate<br />
information and decision documents for its<br />
work and to control that the Board’s decisions<br />
are complied with. In addition, the work procedures<br />
contain directives concerning the tasks<br />
of the Audit Committee and the Remuneration<br />
Committee respectively. <strong>The</strong> Board has also<br />
issued written instructions specifying how<br />
financial information should be reported to the<br />
Board as well as defining the distribution of<br />
duties between the Board and the President.<br />
<strong>The</strong> <strong>Annual</strong> General Meeting decides on the<br />
fees to be paid to the Board members elected<br />
by the shareholders. <strong>The</strong> <strong>Annual</strong> General Meeting<br />
held on April 14, <strong>2010</strong> approved a fee to the<br />
Board, for the time until the end of the next<br />
<strong>Annual</strong> General Meeting, according to the following:<br />
Chairman of the Board should receive a<br />
fee of SEK 1,500,000 and each of the remaining<br />
members should receive a fee of SEK<br />
500,000, with the exception of the President. In<br />
addition, the Chairman of the Audit Committee<br />
should receive SEK 250,000, the other two<br />
members of the Audit Committee SEK 125,000<br />
each and the members of the Remuneration<br />
Committee SEK 75,000 each.<br />
During the year, the Board reviewed the<br />
business plans and strategies for the various<br />
businesses in the <strong>Volvo</strong> <strong>Group</strong>. <strong>The</strong> Board also<br />
reviewed the financial positions of AB <strong>Volvo</strong><br />
and the <strong>Volvo</strong> <strong>Group</strong> on a regular basis and<br />
acted in order to ascertain that there are efficient<br />
systems in order to follow-up and control<br />
the business and financial position of the<br />
<strong>Volvo</strong> <strong>Group</strong>. In connection therewith, the<br />
Audit Committee was responsible for preparing<br />
for the Board’s work to assure the quality of the<br />
<strong>Group</strong>’s financial reporting through reviewing<br />
the interim reports, the annual report and the<br />
consolidated accounting. In connection therewith,<br />
the Board met with the company’s auditors<br />
during <strong>2010</strong>. <strong>The</strong> Board continuously evaluated<br />
the performance of the CEO.<br />
<strong>The</strong> Board has during <strong>2010</strong>, after preparation<br />
by the renumeration committee, evaluated<br />
<strong>Volvo</strong>’s system for variable salary to senior<br />
executives and has concluded that the structure<br />
applied by <strong>Volvo</strong> as regards targets and<br />
performance periods is well functioning.<br />
During <strong>2010</strong>, the Board focused specifically<br />
on issues related to the <strong>Group</strong>’s business<br />
development taking into account the earlier<br />
uncertainty primarily in the North American<br />
and European markets and the recovery that<br />
occured in <strong>2010</strong> regarding the demand for the<br />
<strong>Group</strong>’s products. Furthermore, the Board<br />
focused on development of the <strong>Group</strong>’s operation<br />
in China, Japan and India.<br />
<strong>The</strong> Board’s work is mainly performed<br />
through Board meetings and through meetings<br />
in the respective committees of the<br />
Board. In addition thereto, the Chairman of the<br />
Board is in regular contact with the CEO in<br />
order to discuss on-going business and to<br />
ensure that the decisions taken by the Board<br />
are executed. An account of each Board member’s<br />
age, main education, professional experience,<br />
assignments in the Company, other<br />
important board memberships, their and<br />
related parties’ ownership of shares in <strong>Volvo</strong><br />
as of February 24, 2011, and the years of<br />
membership on the <strong>Volvo</strong> Board, is presented<br />
in the section Board of Directors and auditors<br />
on page 141.<br />
During <strong>2010</strong>, the Board performed its yearly<br />
evaluation of the Board’s work. <strong>The</strong> Chairman<br />
has informed the Election Committee on the<br />
result of the evaluation.<br />
Independence requirements<br />
<strong>The</strong> Board of Directors of AB <strong>Volvo</strong> must meet<br />
independence requirements pursuant to the<br />
Code. Further, the Audit Committee must<br />
meet independence requirements pursuant to<br />
the Swedish Companies Act. Below follows a<br />
short description of the independence requirements.<br />
<strong>The</strong> independence requirements<br />
mainly state that only one person from the<br />
company’s management may be a member of<br />
the Board, that a majority of the Board members<br />
elected by the General Meeting shall be<br />
independent of the company and the company<br />
management and that at least two of the<br />
Board members elected by the General Meeting<br />
who are independent of the company and<br />
the company’s management shall also be<br />
independent of the company’s major shareholders.<br />
In addition, the Code demands that a<br />
majority of the members in the Audit Committee<br />
shall be independent of the company and<br />
the company management and that at least<br />
one of the members who is independent of the<br />
company and the company management shall<br />
also be independent of the company’s major<br />
shareholders. According to the Swedish Companies<br />
Act, the members of the Audit Committee<br />
may not be employees of the company and<br />
that at least one member of the audit Committee<br />
shall be independent of the company, company<br />
management and the company’s largest<br />
shareholders and shall have accounting and<br />
auditing expertise. With regard to the Remuneration<br />
Committee, the Code sets the requirement<br />
that members of the Remuneration Committee,<br />
with the exception of the Board Chairman if a<br />
member of the Remuneration Committee, shall<br />
be independent of the company and company<br />
management.<br />
Prior to the <strong>Annual</strong> General Meeting <strong>2010</strong>,<br />
considering the above requirements regarding<br />
the Board’s independence, the Election Committee<br />
reported the following understanding<br />
with regard to the Board members who were<br />
elected at the <strong>Annual</strong> General Meeting in <strong>2010</strong>:<br />
Peter Bijur, Hanne De Mora, Anders Nyrén,<br />
Ravi Venkatesan, Lars Westerberg and Ying<br />
Yeh and Anders Nyrén were all considered<br />
independent of the company and company<br />
management as well as of the company’s major<br />
shareholders.<br />
Leif Johansson, as <strong>Volvo</strong>’s CEO, was considered<br />
independent of the company’s major<br />
shareholders but not of the company and company<br />
management.<br />
Louis Schweitzer was stated as representing<br />
Renault s.a.s. on the Board and Jean-Baptiste<br />
144
Duzan is an advisor to the president of Renault<br />
S.A. and was also stated as representing<br />
Renault s.a.s. on the company’s Board. <strong>The</strong>y<br />
were both considered independent of the company<br />
and the company management but were<br />
not, since Renault s.a.s. controled more than 10<br />
percent of the shares and votes in the company,<br />
prior to the <strong>Annual</strong> General Meeting <strong>2010</strong>, considered<br />
as independent of one of the company’s<br />
major shareholders.<br />
Prior to the <strong>Annual</strong> General Meeting 2011,<br />
the Election Committee appointed at the<br />
<strong>Annual</strong> General Meeting <strong>2010</strong>, has however<br />
concluded that Louis Schweitzer is no longer to<br />
be considered as dependent of Renault s.a.s.,<br />
since he is no longer employed by nor has any<br />
assignments for Renault and could no longer<br />
be considered as a representative of Renault on<br />
the company’s Board.<br />
<strong>The</strong> Election Committee must also meet<br />
independence requirements pursuant to the<br />
Code. According to the Code, the majority of<br />
the members of the Election Committee are to<br />
be independent of the company and the company<br />
management. At least one member of the<br />
Election Committee is to be independent of the<br />
company’s largest shareholder in terms of votes<br />
or any group of shareholders that act in concert<br />
in the governance of the company. Neither the<br />
CEO nor other members of the executive management<br />
are to be members of the Election<br />
Committee. If Board members are included in<br />
the Election Committee, these may not constitute<br />
a majority of the Election Committee’s<br />
members. <strong>The</strong> Chairman of the Board of the<br />
company or other Board member may not be<br />
the Chairman of the Election Committee. If<br />
Board members are included in the Election<br />
Committee, not more than one of them may be<br />
dependent in relation to the company’s largest<br />
shareholders. All members of the Election<br />
Committee have been considered to be independent<br />
of the company and the company management.<br />
All members of the Election Committee<br />
except Thierry Moulonguet and Louis<br />
Schweitzer have, prior to being appointed, been<br />
considered to be independent of <strong>Volvo</strong>’s largest<br />
shareholder in terms of votes. This conclusion is<br />
based on the facts that Renault s.a.s. is <strong>Volvo</strong>’s<br />
largest shareholder in terms of votes, that Thierry<br />
Moulonguet represents Renault s.a.s. in<br />
the Election Committee and that Louis Schweitzer<br />
at the time of the <strong>Annual</strong> General Meeting<br />
<strong>2010</strong>, when he was appointed as member<br />
of the Election Comittee, represented Renault<br />
s.a.s. in the Board. As stated above Louis Schweitzer<br />
has however, prior to the <strong>Annual</strong> General<br />
Meeting 2011, been considered as independant<br />
from Renault s.a.s., <strong>Volvo</strong>’s largest<br />
shareholder in terms of votes.<br />
Audit Committee<br />
In December 2002, the Board established an<br />
Audit Committee primarily for the purpose of<br />
overseeing the accounting and financial reporting<br />
processes and the audit of the financial statements.<br />
<strong>The</strong> Audit Committee is responsible for<br />
preparing the Board’s work to assure the quality<br />
of the <strong>Group</strong>’s financial reporting by reviewing<br />
the interim reports, the annual report and consolidated<br />
accounting. In addition, the Audit Committee’s<br />
task is to establish guidelines specifying<br />
what other services, beyond auditing, the company<br />
may procure from the company’s auditors<br />
and to provide guidelines for transactions with<br />
companies and persons closely associated with<br />
<strong>Volvo</strong>.<strong>The</strong> Audit Committee also has the task of<br />
reviewing and overseeing the impartiality and<br />
independence of the company’s auditor. <strong>The</strong><br />
Audit Committee is also responsible for evaluating<br />
the internal and external auditors’ work, providing<br />
the Election Committee with the results of<br />
the evaluation of the eternal auditors and to<br />
assist in preparing proposals for auditors. Finally,<br />
the Audit Committee shall evaluate the quality,<br />
relevance and efficiency of the <strong>Group</strong>’s system<br />
for internal control over financial reporting, internal<br />
audit and risk management.<br />
At the statutory Board meeting following<br />
the <strong>2010</strong> <strong>Annual</strong> General Meeting, Lars Westerberg,<br />
Peter Bijur and Jean-Baptiste Duzan<br />
were appointed members of the Audit Committee.<br />
Lars Westerberg was appointed Chairman<br />
of the Audit Committee.<br />
<strong>The</strong> Audit Committee met with the external<br />
auditors and Head of Internal Audit at the meetings<br />
of the Audit Committee. <strong>The</strong> Audit Committee<br />
has also met separately with the external<br />
auditors and the Head of Internal Audit without<br />
the presence of the company management.<br />
<strong>The</strong> Audit Committee and the external auditors<br />
have among other things discussed the external<br />
audit plan and risk management. <strong>The</strong> Audit<br />
Committee held six meetings during <strong>2010</strong>.<br />
Remuneration Committee<br />
In April 2003, the Board established a Remuneration<br />
Committee for the purpose of preparing<br />
and deciding on issues relating to remuneration<br />
to senior executives in the <strong>Group</strong>. <strong>The</strong> duties of<br />
the Committee include presenting recommendations<br />
for resolution by the Board regarding<br />
terms of employment and remuneration for the<br />
President of AB <strong>Volvo</strong>, principles for remuneration,<br />
including pensions and severance payments,<br />
for other members of the <strong>Group</strong> Executive<br />
Committee, and principles for variable salary<br />
systems, share-based incentive programs, pensions<br />
and severance payment for other senior<br />
executives in the <strong>Group</strong>. In addition, the Remuneration<br />
Committee decides the individual terms<br />
of employment for the other members of the<br />
<strong>Group</strong> Executive Committee in accordance with<br />
the principles established by the Board.<br />
<strong>The</strong> Remuneration Committee shall follow<br />
and evaluate ongoing programs and programs<br />
concluded during the year covering variable<br />
remuneration for the <strong>Group</strong> Executive Committee,<br />
application of the guidelines for remuneration<br />
to senior executives on which the <strong>Annual</strong><br />
General Meeting shall decide and the current<br />
remuneration structures and levels in the <strong>Group</strong>.<br />
<strong>The</strong> Board shall, not later than two weeks prior<br />
to the <strong>Annual</strong> General Meeting, submit a report<br />
on the results of the Remuneration Committee’s<br />
evaluation on the company’s website.<br />
If the Remuneration Committee commissions<br />
external suppliers for its work, it must ensure that<br />
there are no conflicts of interest in relation to<br />
other assignments this supplier may have for the<br />
<strong>Group</strong> or the <strong>Group</strong> Executive Committee.<br />
In conjunction with resigning as Chairman<br />
and member of the Board of the company on<br />
January 15, <strong>2010</strong>, Finn Johnsson also left the<br />
Remuneration Committee. <strong>The</strong>reafter, Ying<br />
Yeh was appointed as a new member of the<br />
Remuneration Committee and Louis Schweitzer<br />
was appointed as the new Chairman of<br />
the Remuneration Committee. At the statutory<br />
meeting of the Board following the <strong>2010</strong><br />
145
Corporate Governance <strong>Report</strong> <strong>2010</strong><br />
<strong>Annual</strong> General Meeting, Louis Schweitzer,<br />
Anders Nyrén and Ying Yeh were appointed<br />
members of the Remuneration Committee.<br />
Louis Schweitzer was named Chairman of the<br />
Remuneration Committee. <strong>The</strong> Remuneration<br />
Committee held five meetings during <strong>2010</strong>.<br />
<strong>Group</strong> Executive Committee<br />
An account of their respective age, principal<br />
education, Board memberships, their and<br />
related parties’ ownership of shares in <strong>Volvo</strong><br />
as of February 24, 2011, and year of joining<br />
<strong>Volvo</strong> for the CEO and each member of the<br />
<strong>Group</strong> Executive Committee is presented in<br />
the <strong>Group</strong> Management section on page 139.<br />
On December 8, <strong>2010</strong>, Leif Johansson notified<br />
AB <strong>Volvo</strong>’s Board of Directors that he<br />
intends to resign as president of AB <strong>Volvo</strong>,<br />
also CEO of the <strong>Volvo</strong> <strong>Group</strong>, in conjunction<br />
with his 60th birthday in the summer of 2011.<br />
External auditing<br />
<strong>Volvo</strong>’s auditors are elected by the <strong>Annual</strong><br />
General Meeting. <strong>The</strong> current auditor is PricewaterhouseCoopers<br />
AB (PwC), which was<br />
elected at the <strong>2010</strong> <strong>Annual</strong> General Meeting<br />
for a period of four years. Two PwC partners,<br />
Göran Tidström and Johan Rippe, are responsible<br />
for the audit of <strong>Volvo</strong>. Göran Tidström is<br />
the Lead Partner.<br />
<strong>The</strong> external auditors discuss the external<br />
audit plan and risk management with the Audit<br />
Committee. <strong>The</strong> auditors review the interim<br />
report for the period January 1 to June 30 and<br />
the annual report and the consolidated accounting.<br />
<strong>The</strong> auditors also express an opinion whether<br />
this Corporate Governance <strong>Report</strong> was prepared<br />
or not and in such respect whether certain information<br />
therein coincides with the annual and<br />
consolidated accounting. <strong>The</strong> auditors report<br />
their findings with regard to the annual report ,<br />
consolidated accounting and the Corporate Governance<br />
<strong>Report</strong> through the audit reports and a<br />
separate opinion regarding the Corporate Governance<br />
<strong>Report</strong>, which they present to the<br />
<strong>Annual</strong> General Meeting. In addition, the auditors<br />
report detailed findings from their reviews to the<br />
Audit Committee twice a year and, once a year,<br />
to the full Board of Directors.<br />
When PwC is retained to provide services<br />
other than the audit, it is done in accordance<br />
with rules decided by the Audit Committee<br />
pertaining to pre-approval of the nature of the<br />
services and the fees.<br />
Disclosure Committee<br />
A Disclosure Committee was established in<br />
2004. <strong>The</strong> Committee contributes to ensuring<br />
that <strong>Volvo</strong> fulfills its obligations according to<br />
applicable legislation as well as to listing rules<br />
to timely disclose to the financial market all<br />
share price sensitive information.<br />
<strong>The</strong> Committee comprises the heads of the<br />
departments Corporate Finance, Internal<br />
Audit, Investor Relations, Corporate Legal,<br />
Business Control and Financial <strong>Report</strong>ing.<br />
Chairman of the Disclosure Committee is the<br />
company’s Senior Vice President responsible<br />
for Corporate Communications.<br />
Outstanding share and share-price<br />
related incentive programs<br />
An account of outstanding share and shareprice<br />
related incentive programs is provided in<br />
Note 34 Employees in the <strong>Group</strong>’s notes.<br />
<strong>Report</strong> on the key aspects of the company’s<br />
and <strong>Group</strong>’s system for internal<br />
controls and risk management in conjunction<br />
with financial reporting<br />
<strong>The</strong> Board is responsible for the internal controls<br />
according to the Swedish Companies Act and the<br />
Code. <strong>The</strong> purpose of this report is to provide<br />
shareholders and other interested parties an<br />
understanding of how internal control is organized<br />
at <strong>Volvo</strong> with regard to financial reporting. <strong>The</strong><br />
report has been prepared in accordance with the<br />
<strong>Annual</strong> Accounts Act. Consequently the report is<br />
limited to internal control over financial reporting.<br />
Introduction<br />
<strong>Volvo</strong> primarily applies internal control principles<br />
introduced by the Committee of Sponsoring<br />
Organizations of the Treadway Commission<br />
(COSO). <strong>The</strong> COSO principles consist of five interrelated<br />
components. <strong>The</strong> components are: control<br />
environment, risk assessment, control activities,<br />
information and communication and follow-up.<br />
<strong>Volvo</strong> has a specific function for internal control.<br />
<strong>The</strong> objective of the Internal Control function<br />
is to provide support for management groups<br />
within business areas and business units, that<br />
allows them to continuously provide good and<br />
improved internal controls relating to financial<br />
reporting. Work that is conducted through this<br />
function is based primarily on a methodology,<br />
which aim is to ensure compliance with directives<br />
and policies, as well as to create good conditions<br />
for specific control activities in key processes<br />
related to financial reporting. <strong>The</strong> Audit<br />
Committee is informed of the result of the work<br />
performed by the Internal Control function within<br />
<strong>Volvo</strong> with regard to risks, control activities and<br />
follow-up on the financial reporting.<br />
<strong>Volvo</strong> also has an Internal Audit function<br />
with the primary task of independently verifying<br />
that companies in the <strong>Group</strong> follow the<br />
principles and rules that are stated in the<br />
<strong>Group</strong>’s directives, policies and instructions for<br />
financial reporting. <strong>The</strong> head of the Internal<br />
Audit function reports directly to the CEO, the<br />
<strong>Group</strong>’s CFO and the Audit Committee.<br />
Control environment<br />
Fundamental to <strong>Volvo</strong>’s control environment is<br />
the business culture that is established within<br />
the <strong>Group</strong> and in which managers and employees<br />
operate. <strong>Volvo</strong> works actively on communications<br />
and training regarding the company’s<br />
basic values as described in <strong>The</strong> <strong>Volvo</strong> Way, an<br />
internal document concerning <strong>Volvo</strong>’s business<br />
culture, and the <strong>Group</strong>’s Code of Conduct,<br />
to ensure that good morals, ethics and<br />
integrity permeate the organization.<br />
<strong>The</strong> foundation of the internal control process<br />
relating to the financial reporting is built<br />
up around the <strong>Group</strong>’s directives, policies and<br />
instructions, as well as the responsibility and<br />
authority structure that has been adapted to<br />
the <strong>Group</strong>’s organization to create and maintain<br />
a satisfactory control environment. <strong>The</strong><br />
principles for internal controls and directives<br />
and policies for the financial reporting are contained<br />
in <strong>Volvo</strong> Financial Policies & Procedures<br />
(FPP), an internal document comprising<br />
all important instructions, rules and principles.<br />
146
Risk assessment<br />
Risks relating to the financial reporting are<br />
evaluated and monitored by the Board through<br />
the Audit Committee inter alia through identifying<br />
what types of risks that typically could be<br />
considered as material and where they would<br />
typically occur. <strong>The</strong> annual evaluation of internal<br />
control activities conducted by the Internal<br />
Control and Internal Audit functions, are based<br />
on a risk-based model. <strong>The</strong> evaluation of the<br />
risk that errors will appear in the financial<br />
reporting is based on a number of criteria.<br />
Complex accounting principles can, for example,<br />
mean that the financial reporting risks being<br />
inaccurate for those posts that are covered by<br />
such principles. Valuation of a particular asset<br />
or liability according to various evaluation criteria<br />
can also constitute a risk. <strong>The</strong> same is<br />
true for complex and/or changing business<br />
circumstances.<br />
Control activities<br />
In addition to the Board of AB <strong>Volvo</strong> and its<br />
Audit Committee, the Boards and management<br />
groups of <strong>Group</strong> companies constitute<br />
the overall supervisory body.<br />
Several control activities are applied in the<br />
ongoing business processes to ensure that<br />
potential errors or deviations in the financial<br />
reporting are prevented, discovered and corrected.<br />
Control activities range from review of outcome<br />
results in management group meetings to<br />
specific reconciliation of accounts and analyses<br />
of the ongoing processes for financial reporting.<br />
CFOs in <strong>Group</strong> companies are ultimately responsible<br />
for ensuring that control activities in the<br />
financial processes are appropriate and in accordance<br />
with the <strong>Group</strong>’s policies and instructions.<br />
<strong>The</strong>y are also responsible for ensuring that authority<br />
structures are designed so that one person<br />
can’t perform an activity and then perform the<br />
control of the same activity. Control activities<br />
within IT security and maintenance are a key part<br />
of <strong>Volvo</strong>’s internal control over financial reporting.<br />
Information and communication<br />
Policies and instructions relating to the financial<br />
reporting are updated and communicated on a<br />
regular basis from management to all affected<br />
employees. In addition, there are a number of<br />
committees and networks within <strong>Volvo</strong> that serve<br />
as forums for information and discussions regarding<br />
issues relating to the financial reporting and<br />
application of internal rules. Included in these<br />
committees and networks are representatives<br />
from the business areas and the <strong>Group</strong>’s staff<br />
units who are responsible for financial reporting.<br />
Work in these committees and networks is<br />
aimed, among other things, at ensuring a uniform<br />
application of the <strong>Group</strong>’s policies, principles and<br />
instructions for the financial reporting and at<br />
identifying and communicating shortcomings<br />
and areas of improvement in the processes for<br />
financial reporting.<br />
Follow-up<br />
Ongoing responsibility for follow-up rests with<br />
the business areas’ management groups and<br />
accounting and controller functions. In addition,<br />
the Internal Audit and the Internal Control<br />
functions conduct follow-up and supervision<br />
in accordance with what is described in<br />
the introduction of this report. More specifically,<br />
the Internal Control function runs and<br />
coordinates evaluation activities through the<br />
“<strong>Volvo</strong> <strong>Group</strong> Internal Control programme”,<br />
which gives a systematic way of evaluating the<br />
quality and effectiveness of the internal control<br />
over financial reporting on a yearly basis. A<br />
yearly evaluation plan is settled and presented<br />
to the Audit Committee. This evaluation programme<br />
comprises three main areas:<br />
1. <strong>Group</strong>-wide controls: Self assessment procedure<br />
carried out by management teams at<br />
business area and business unit level as well<br />
as local company level. Main areas evalu ated<br />
are the adherence to the <strong>Group</strong>’s financial<br />
directives and policies found in FPP along<br />
with <strong>The</strong> <strong>Volvo</strong> Way and the <strong>Group</strong>’s Code of<br />
Conduct.<br />
2. Process controls at transaction levels: Processes<br />
related to the financial reporting are<br />
evaluated by testing of specific routines and<br />
controls based upon the <strong>Group</strong>’s framework<br />
for internal control over financial reporting,<br />
VICS – “<strong>Volvo</strong> Internal Control Standards”.<br />
<strong>The</strong> framework focus on the financial reporting<br />
areas deemed to have a relatively higher risk<br />
for potential errors because e.g. complex<br />
accounting principles, complex or changed<br />
business operations etc.<br />
3. General IT controls: Processes for maintenance,<br />
development and access management<br />
of financial applications are evaluated by testing<br />
of routines and controls.<br />
<strong>The</strong> results of the evaluation activities are<br />
reported to the <strong>Group</strong> management and the<br />
Audit Committee.<br />
Göteborg, February 24, 2011<br />
AB <strong>Volvo</strong> (publ)<br />
Board of Directors<br />
Auditor’s report on the Corporate<br />
Governance <strong>Report</strong><br />
It is the Board of Directors who is responsible<br />
for the Corporate Governance <strong>Report</strong> on pages<br />
142–147 and that it has been prepared in<br />
accordance with the <strong>Annual</strong> Accounts Act.<br />
As a basis for our opinion that the Corporate<br />
Governance <strong>Report</strong> has been prepared and is<br />
consistent with the annual accounts and the<br />
consolidated accounts, we have read the Corporate<br />
Governance <strong>Report</strong> and assessed its<br />
statutory content based on our knowledge of<br />
the company.<br />
In our opinion, the Corporate Governance<br />
<strong>Report</strong> has been prepared and its statutory<br />
content is consistent with the annual accounts<br />
and the consolidated accounts.<br />
Göran Tidström<br />
Authorized Public<br />
Accountant<br />
Lead Partner<br />
Göteborg, February 24, 2011<br />
PricewaterhouseCoopers AB<br />
Johan Rippe<br />
Authorized Public<br />
Accountant
Definitions<br />
Basic earnings per share<br />
Income for the period attributable to shareholders of the Parent Company<br />
divided by the weighted average number of shares outstanding<br />
during the period.<br />
Capital expenditures<br />
Capital expenditures include investments in property, plant and equipment,<br />
intangible assets and assets under operating leases. Investments<br />
in fixed assets included in the <strong>Group</strong>’s cash-flow statement<br />
include only capital expenditures that have reduced the <strong>Group</strong>’s liquid<br />
funds during the year.<br />
Cash-flow<br />
Combined changes in the <strong>Group</strong>’s liquid funds during the fiscal year.<br />
Changes in liquid funds are specified with reference to changes in<br />
operations, operating activities, changes depending on investments in<br />
equipment, fixed assets etc. and financing activities such as changes<br />
in loans and investments.<br />
Diluted earnings per share<br />
Diluted earnings per share is calculated as income for the period<br />
attributable to the Parent Company’s shareholders divided by the<br />
average number of shares outstanding plus the average number of<br />
shares that would be issued as an effect of ongoing share-based<br />
incentive programs and employee stock option programs.<br />
EBITDA<br />
EBITDA is the operating income before depreciation and amortization<br />
of tangible and intangible assets. This key figure is calculated by adding<br />
back depreciation and amortization on the operating income of the<br />
Industrial operations.<br />
Equity ratio<br />
Shareholders’ equity divided by total assets.<br />
Interest coverage<br />
Operating income plus interest income and similar credits divided by<br />
interest expense and similar charges.<br />
Joint ventures<br />
Companies over which the Company has joint control together with<br />
one or more external parties.<br />
Net financial position<br />
Cash and cash equivalents, marketable securities and interest-bearing<br />
short- and long-term receivables reduced by short- and long-term<br />
interest-bearing liabilities and provisions for post-employment benefits.<br />
Operating margin<br />
Operating income divided by net sales.<br />
Return on shareholders’ equity<br />
Income for the period divided by average shareholders’ equity.<br />
Self-financing ratio<br />
Cash-flow from operating activities (see Cash-flow statement) divided<br />
by net investments in fixed assets and leasing assets as defined in the<br />
cash-flow statement.
<strong>Annual</strong> General Meeting, April 6, 2011<br />
<strong>The</strong> <strong>Annual</strong> General Meeting of AB <strong>Volvo</strong> will be held in Göteborg in<br />
Lisebergshallen (entrance from Örgrytevägen) Wednesday, April 6,<br />
2011, at 3:00 p.m.<br />
Notice<br />
Those who wish to participate must be recorded in the share register<br />
maintained by Euroclear Sweden AB on March 31, 2011 and give<br />
notice of intention to attend, not later than March 31, 2011, preferably<br />
before 12:00:<br />
• by telephone, +46 8 402 90 76, beginning March 7, 2011<br />
• by mail addressed to AB <strong>Volvo</strong> (publ), ”AGM”,<br />
P.O. Box 7481, SE-103 98 Stockholm, Sweden<br />
• on AB <strong>Volvo</strong>’s website www.volvogroup.com<br />
When giving notice, shareholders should state their:<br />
• name<br />
• personal number (registration number)<br />
• address and telephone number<br />
• name and personal number (registration number) of the proxy, if any<br />
• name(s) of any accompanying assistant(s)<br />
Shareholders whose shares are held in the trust department of a<br />
bank or by a brokerage firm should, several banking days prior to<br />
March 31, 2011, request temporary owner-registration, so-called<br />
voting-right registration, at the bank or broker holding the shares.<br />
<strong>Volvo</strong>’s Election Committee<br />
<strong>The</strong> following persons are members of <strong>Volvo</strong>’s Election Committee:<br />
Thierry Moulonguet<br />
Ingrid Bonde<br />
Carl-Olof By<br />
Lars Förberg<br />
Håkan Sandberg<br />
Louis Schweitzer<br />
Chairman of the Election Committee,<br />
Renault s.a.s.<br />
AMF Pension<br />
AB Industrivärden<br />
Violet Partners LP<br />
Handelsbanken SHB Pension Fund, SHB<br />
Pensionskassa, SHB Employee Fund and<br />
Oktogonen<br />
Chairman of the AB <strong>Volvo</strong> Board<br />
Preliminary publication dates<br />
<strong>Report</strong> for the first three months 2011 April 27, 2011<br />
<strong>Report</strong> for the first six months 2011 July 22, 2011<br />
<strong>Report</strong> for the first nine months 2011 October 25, 2011<br />
<strong>Report</strong> on 2011 operations February, 2012<br />
<strong>Annual</strong> <strong>Report</strong> 2011 March, 2012<br />
<strong>The</strong> reports are available on www.volvogroup.com on date of publication<br />
and are also sent electronically to shareholders who have advised<br />
<strong>Volvo</strong> that they wish to receive financial information.<br />
Historical and current time series reflecting the <strong>Volvo</strong> <strong>Group</strong>’s<br />
market information and share data are published regularly on<br />
www.volvogroup.com.<br />
Contacts<br />
Investor Relations:<br />
Christer Johansson +46 31-66 13 34<br />
Patrik Stenberg +46 31-66 13 36<br />
Anders Christensson +46 31-66 11 91<br />
John Hartwell +1 212 418 7432<br />
Aktiebolaget <strong>Volvo</strong> (publ) 556012-5790<br />
Investor Relations, VHK<br />
SE-405 08 Göteborg<br />
Sweden<br />
Tel +46 31 66 00 00<br />
Fax +46 31 53 72 96<br />
E-mail: investorrelations@volvo.com<br />
www.volvogroup.com<br />
Among other duties, the Election Committee is responsible for submitting<br />
to the <strong>Annual</strong> General Meeting proposals for candidates to<br />
serve as members of the Board of Directors and Chairman of the<br />
Board. <strong>The</strong> Committee also proposes the amount of the fees to be<br />
paid to the holders of these positions.
AB <strong>Volvo</strong>, Investor Relations