Merano 2009 Environmental Statement English MemcES_2009
Merano 2009 Environmental Statement English MemcES_2009
Merano 2009 Environmental Statement English MemcES_2009

Create successful ePaper yourself
Turn your PDF publications into a flip-book with our unique Google optimized e-Paper software.
ENVIRONMENTAL STATEMENT <strong>2009</strong><br />
MERANO FACTORY
MEMC Electronic Materials S.p.A.<br />
Viale Gherzi, 31<br />
28100 Novara - Italy<br />
Tel. (+39) 0321 334444<br />
Fax. (+39) 0321 691000<br />
Via Nazionale, 59<br />
39012 <strong>Merano</strong> (Bz) - Italy<br />
Tel. (+39) 0473 333333<br />
Fax (+39) 0473 333270<br />
www.memc.com<br />
The subject of this <strong>Environmental</strong> <strong>Statement</strong><br />
is the <strong>Merano</strong> factory of MEMC Electronic Materials S.p.A.<br />
This document has been drawn up to comply with Article 6 of<br />
EC Regulation no. 1221/<strong>2009</strong> dated 25/11/09.<br />
The published data refer to the period 2000-<strong>2009</strong>.<br />
This publication has been edited by The <strong>Environmental</strong> Safety<br />
and Health (ESH) Department<br />
Project Manager: A. Tonini<br />
Editorial Collaboration: C. de Santis, R. Marangon<br />
All Rights Reserved.<br />
Photographs published with kind permission of: Memc<br />
Graphic Design: kdg italia srl
ENVIRONMENTAL STATEMENT <strong>2009</strong><br />
CONTENTS<br />
Introduction 4<br />
General Information 5<br />
The MEMC Electronic Materials Inc. Group 5<br />
The <strong>Merano</strong> Factory 6<br />
Significant developments in <strong>2009</strong> 7<br />
MEMC‘s Policy 8<br />
The Production Process 9<br />
Production 10<br />
<strong>Environmental</strong> Aspects 11<br />
Importance attributed to direct environmental aspects 11<br />
Importance attributed to indirect environmental aspects 13<br />
Direct <strong>Environmental</strong> Aspects 14<br />
Energy Resources 14<br />
Water resources 17<br />
Consumption of raw and auxiliary materials 18<br />
Atmospheric Emissions 21<br />
Water Discharges 26<br />
Waste 30<br />
Reclamation: Ensuring the Safety and Protection<br />
of Soil and Groundwater 33<br />
Noise 33<br />
Polychlorinated Biphenyls and Asbestos 34<br />
Indirect <strong>Environmental</strong> Aspects 35<br />
Managing Relations with Critical Suppliers 35<br />
Activities of Companies Operating On-site 35<br />
Purchase and Transport of Hazardous Substances<br />
and Preparations 35<br />
Communications 36<br />
The <strong>Environmental</strong> Improvement Program 37<br />
Reference Legislation 41<br />
Glossary 43<br />
3
ENVIRONMENTAL STATEMENT <strong>2009</strong><br />
INTRODUCTION<br />
Since 1999, the MEMC site in <strong>Merano</strong> has adopted a UNI EN<br />
ISO 14001-certified <strong>Environmental</strong> Management System, and<br />
since 2002, it has also been listed (no. I-000121) in the European<br />
register of organizations adhering to EMAS (EC Regulation<br />
761/2001).<br />
With respect to the EMAS Regulation, every year MEMC makes<br />
information on the Company available to interested parties with<br />
our <strong>Environmental</strong> <strong>Statement</strong>, which is endorsed by an environmental<br />
examiner. This information includes the results it has obtained<br />
in the environmental field and its programs for environmental<br />
improvement.<br />
This <strong>Environmental</strong> <strong>Statement</strong> consolidates MEMC’s desire to operate<br />
with the maximum transparency with regard to its staff, the<br />
local community, public bodies, as well as nearby companies<br />
and others operating on site.<br />
This report is the second annual revision of the 2008 <strong>Environmental</strong><br />
<strong>Statement</strong> approved on 29 September <strong>2009</strong>. The lay-out<br />
of the previous editions has been maintained to make the report<br />
easier to read, and so that the data can be easily compared with<br />
information from previous years.<br />
The information contained herein is current as of 31 December<br />
<strong>2009</strong> unless otherwise indicated.<br />
4
ENVIRONMENTAL STATEMENT <strong>2009</strong><br />
THE MEMC<br />
ELECTRONIC MATERIALS INC. GROUP<br />
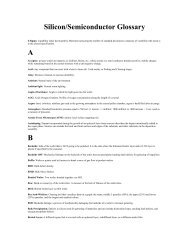
MEMC Electronic Materials Inc. is an international manufacturer<br />
of extra-pure silicon operating in the microelectronic market, and,<br />
since 2004, in the solar photovoltaic market.<br />
The Group has its registered office in St. Peters, Missouri (USA).<br />
It has ten production plants worldwide (three in the United States,<br />
two in Europe, one in Japan, two in Malaysia, one in Taiwan,<br />
and a joint venture with a Korean partner), and covers the entire<br />
globe with its marketing network. In November 2008, MEMC<br />
Electronic Materials Inc. acquired Sun Edison LLC, a North American<br />
leader in the solar sector with branch offices in North America<br />
and Europe (see Figure 1).<br />
MEMC’s production facilities in Europe are operated by MEMC<br />
Electronic Materials S.p.A., which consists of the <strong>Merano</strong> factory<br />
(the subject of this <strong>Environmental</strong> <strong>Statement</strong>) and a factory in Novara<br />
(also the Group’s European headquarters).<br />
MEMC S.p.A.’s customers are leading companies operating in<br />
the microelectronic (IT, telecommunications, mobile telephony,<br />
high-fidelity, transport, electromedical products, industrial electronics)<br />
and solar photovoltaic sectors.<br />
At present, 50% of MEMC’s production in <strong>Merano</strong> is intended<br />
for the solar market, while 50% is for the microelectronic market.<br />
MEMC Electronic Materials Inc. has been listed on the New York<br />
Stock Exchange since 1995 (symbol: WFR).<br />
Fig. 1 - MEMC in the world<br />
5
ENVIRONMENTAL STATEMENT <strong>2009</strong><br />
THE MERANO<br />
FACTORY<br />
MEMC Electronic Materials S.p.A. -<br />
<strong>Merano</strong> Factory<br />
Via Nazionale, 59<br />
39012 <strong>Merano</strong> (BZ), Italy<br />
www.memc.com<br />
info@memc.it<br />
NACE rev. 2. code no.:<br />
20.13<br />
Manufacturer of other inorganic chemical products<br />
ISTAT (ATECO2003) code no.:<br />
24.130<br />
Manufacturer of other inorganic chemical products<br />
The MEMC site in <strong>Merano</strong> produces:<br />
polycrystalline and monocrystalline silicon for microelectronics<br />
and photovoltaics<br />
Dimensions of the site:<br />
Total area 100,723 m 2<br />
Covered area 23,516 m 2<br />
Open area 61,125 m 2<br />
Green area 16,082 m 2<br />
Certifications:<br />
Quality:<br />
ISO9002 in 1991<br />
ISO9001 in 1994<br />
QS9000 in 1999<br />
ISO9001:2000 in 2003<br />
ISO/TS 16949 in 2003<br />
<strong>Environmental</strong>:<br />
ISO14001 in 1999<br />
EMAS in 2002<br />
Safety:<br />
OHSAS 18001 in 2007<br />
Turnover of MEMC S.p.A. in <strong>2009</strong>:<br />
184,355,000 Euros<br />
(data current on 31/12/<strong>2009</strong>)<br />
Manufacturing in a continuous cycle:<br />
weeks/year 52<br />
days/week 7<br />
8-hour shifts/day 3<br />
No. of employees: 444<br />
(34 with college degrees and 144 with high school diplomas)<br />
Grouped into the following departments:<br />
Production 297<br />
M&D / R&D 22<br />
Maintenance 37<br />
Facility innovation 22<br />
Equipment innovation 11<br />
Quality 2<br />
Administration, purchasing, import/export,<br />
personnel, etc. 38<br />
Safety, environment and security 15<br />
6
ENVIRONMENTAL STATEMENT <strong>2009</strong><br />
SIGNIFICANT DEVELOPMENTS<br />
IN <strong>2009</strong><br />
We continued to believe in alternative energy<br />
resources<br />
In <strong>2009</strong>, SunEdison - the leading player in the photovoltaic solar<br />
sector in North America, which was acquired in November by<br />
MEMC Electronic Materials Inc. - received the necessary permits<br />
for developing and building a photovoltaic park in the province<br />
of Rovigo, which is in the Veneto region of Italy.<br />
With an installed capacity of 72 MW, the park will be the largest<br />
in Europe, as it will surpass two current European “megaparks”<br />
in Olmedilla, Spain (60 MW) and Strasskirchen, Germany (50<br />
MW).<br />
With such capacity, the system will generate enough energy in its<br />
first year of full operational capability to power 17,150 homes,<br />
thus contributing to “not release” 41,000 tons of carbon dioxide<br />
into the atmosphere: the equivalent of taking 8,000 cars off the<br />
road.<br />
We continued to develop know-how and<br />
efficiency<br />
With investments in projects for creating new “niche” products<br />
for applications of microelectronics, such as image sensors; with<br />
innovations in new plant systems with the best environmentally<br />
sustainable solutions; with a commitment to developing FBR - an<br />
energy-efficient technology for growing polycrystal; and with the<br />
construction of a district heating system. These projects actively<br />
involved our personnel, who incorporate the environmental variable<br />
into every idea aimed at developing and improving the<br />
company.<br />
We continued to respect the environment<br />
and the laws that protect it, as demonstrated<br />
by the information contained in<br />
this report.<br />
We continued to work hard to improve<br />
our local area<br />
In <strong>2009</strong>, we took a series of steps which we hope will improve<br />
and strengthen our relationship with our local area - with schools,<br />
through projects whose purpose is to share our know-how on<br />
technology and sustainability with students; with the municipal<br />
government and the public transit company, through preparation<br />
of a “Plan for Home-Job Commuting” for our staff, whose goal is<br />
to help reduce traffic on local roads by promoting good habits<br />
such as car pooling, bicycling and public transit (for the future,<br />
we’re even considering agreements with local businesses for selling<br />
electric bicycles to our employees); and through sponsorships<br />
of local sports associations.<br />
7
ENVIRONMENTAL STATEMENT <strong>2009</strong><br />
MEMC‘s<br />
Policy<br />
MEMC’s Policy for the Environment, Health and Safety is a combination<br />
of objectives that the Company pursues to protect the<br />
environment and the health and safety of its staff and the local<br />
population. The Policy is established and signed by the managers<br />
of all departments at the Company, who thus express their full<br />
support and involvement.<br />
8
ENVIRONMENTAL STATEMENT <strong>2009</strong><br />
THE PRODUCTION PROCESS<br />
The <strong>Merano</strong> factory is subdivided into the following four basic<br />
departments:<br />
• polycrystal production (POLY area)<br />
• polycrystal sorting and crushing (LM area)<br />
• monocrystal production (CZ area)<br />
• quality control and shipments (CZ Services area)<br />
The production process is summarized in the following chart.<br />
INCOMING TET<br />
INCOMING TCS<br />
PURCHASED AND PRODUCED<br />
HYDROGEN<br />
POLY AREA<br />
TET HYDROGENATION<br />
TET<br />
TCS<br />
CHLOROSILANE<br />
PURIFICATION<br />
HYDROGEN<br />
PURIFICATION<br />
RECOVERED<br />
CHLOROSILANES<br />
DEPOSITING OF<br />
POLYCRYSTALLINE SILICON<br />
RECOVERED<br />
HYDROGEN<br />
LM AREA<br />
NUGGET<br />
PREPARATION<br />
PHOTOVOLTAIC<br />
POLYCRYSTALLINE<br />
SORTING AND<br />
PACKAGING<br />
PACKING AND<br />
SHIPMENT<br />
CZ AREA<br />
PREPARATION AND<br />
SELECTION OF DOPANT<br />
GROWTH OF<br />
MONOCRYSTAL BARS<br />
PREPARATION AND<br />
SELECTION OF GERMS<br />
CZS AREA<br />
INSPECTION AND<br />
SORTING<br />
PACKING AND<br />
SHIPMENT<br />
9
ENVIRONMENTAL STATEMENT <strong>2009</strong><br />
PRODUCTION<br />
The following data refer to trends in silicon production<br />
(monocrystal and polycrystal) in 2000-<strong>2009</strong>.<br />
The data show the positive trend over the last few years, which<br />
was partially due to the increasing demand for silicon on the<br />
solar photovoltaic market.<br />
Table 1 – Production<br />
PRODUCTION OF SILICION<br />
Year<br />
% t of silicon - 2000=100<br />
2000 100<br />
2001 71<br />
2002 78<br />
2003 87<br />
2004 100<br />
2005 112<br />
2006 118<br />
2007 136<br />
2008 146<br />
<strong>2009</strong> 154<br />
Graph 1 – Production trend<br />
200<br />
Quantity produced<br />
(2000 =100)<br />
150<br />
100<br />
50<br />
0<br />
2000 2001 2002 2003 2004 2005 2006 2007 2008 <strong>2009</strong><br />
Poly<br />
Mono<br />
Total<br />
10
ENVIRONMENTAL STATEMENT <strong>2009</strong><br />
ENVIRONMENTAL ASPECTS<br />
The following paragraphs describe the importance MEMC attributes to its direct and indirect environmental aspects. The information<br />
on the environmental performance of its <strong>Merano</strong> factory is current as of 31 December <strong>2009</strong>.<br />
Importance attributed to direct environmental aspects<br />
Very important<br />
Important<br />
Not important<br />
ENVIRONMENTAL<br />
ASPECTS<br />
IMPACT<br />
NORMAL<br />
CONDITIONS<br />
EMERGENCY<br />
CONDITIONS<br />
PREVIOUS<br />
CONDITIONS<br />
ENERGY RESOURCES<br />
Electrical energy consumption<br />
The primary impact consists of the use of this energy source<br />
by the producer of the energy.<br />
MEMC uses only hydroelectric power from RECS-certified<br />
SELTRADE SpA<br />
Fuel oil and diesel fuel consumption<br />
Consumption of fossil fuels<br />
Natural gas consumption<br />
WATER RESOURCES<br />
Industrial water consumption (groundwater)<br />
Consumption of water from aqueducts (drinking water)<br />
Consumption of groundwater and, to a lesser extent, of<br />
drinking water. Most of the water that is withdrawn is<br />
returned to the environment, even though its temperature<br />
and quality are lower than before.<br />
CONSUMPTION OF RAW MATERIALS<br />
CONSUMPTION OF AUXILIARY MATERIALS USED IN PRODUCTION<br />
Consumption of auxiliary materials used in production<br />
Consumption of renewable and non-renewable resources.<br />
Consumption of auxiliary materials for product testing<br />
Consumption of auxiliary materials for auxiliary plants<br />
Consumption of auxiliary materials for maintenance and<br />
services<br />
Consumption of paper, cardboard, wood, plastic<br />
ATMOSPHERIC EMISSIONS<br />
Emissions released into the atmosphere (HCl, HF, SOX, CO,<br />
CO2, dust, dust from combustion, organic substances)<br />
Emissions released into the atmosphere (NOX)<br />
Emissions dispersed into the atmosphere (combustion<br />
fumes)<br />
Air pollution on the local level, due mainly to the emission<br />
(albeit within legal limits) of dust and acidifying gases and<br />
particles (such as nitrogen oxides, sulphur oxides, acids);<br />
and contribution to the greenhouse effect, due mainly to<br />
CO2 emissions produced by burning fuel oil, diesel fuel,<br />
natural gas and refrigerants.<br />
WATER DISCHARGES<br />
Water discharges (pH, COD, mineral oils, Cu, Zn, Cr, N, Cl-,<br />
suspended solids)<br />
Water discharges (fluorides)<br />
The Company’s discharged waste water flows into the<br />
municipal purification plant. The residues remaining after<br />
treatment are discharged into the Adige river.<br />
11
ENVIRONMENTAL STATEMENT <strong>2009</strong><br />
ENVIRONMENTAL ASPECTS<br />
Importance attributed to direct environmental aspects<br />
Very important<br />
Important<br />
Not important<br />
WASTE<br />
Special hazardous waste<br />
Special non-hazardous waste<br />
The impact mostly derives from subsequent transport and<br />
treatment of the waste produced by MEMC.<br />
If an accident occurs during transport from production<br />
departments to the specially-equipped waste storage area,<br />
the ground at the site may become contaminated with<br />
spilled hazardous substances.<br />
EXTERNAL NOISE<br />
CONTAMINATION OF SOIL<br />
PCB<br />
ODS<br />
ASBESTOS<br />
ODOURS<br />
Acoustic impact on the local level<br />
Contamination of the soil and of the surface aquifer, which<br />
is caused by substances used in the production process or by<br />
contaminants released accidentally.<br />
Contribute to the destruction of the ozone layer<br />
RADIATION<br />
VIBRATION<br />
VISUAL INTRUSION<br />
TRAFFIC<br />
EFFECTS ON BIODIVERSITY<br />
Contributes to local pollution and congestion during times<br />
and periods of heaviest travel<br />
12
ENVIRONMENTAL STATEMENT <strong>2009</strong><br />
ENVIRONMENTAL ASPECTS<br />
Importance attributed to indirect environmental aspects<br />
Very important<br />
Important<br />
Not important<br />
IN-HOUSE ACTIVITIES CONTRACTED OUT<br />
Maintenance and construction companies (building works, assembly, insulation, painting, electrical plants, excavation/earthworks, plant installation and<br />
maintenance, drainage, gardening)<br />
Cleaning of offices and departments, canteen services<br />
ACTIVITIES PERFORMED OUTSIDE THE FACTORY<br />
PURCHASING OF PRODUCTS/SERVICES<br />
Recycling/disposal of non-hazardous waste<br />
Recycling/disposal of hazardous waste<br />
Purchasing of raw materials (TET, TCS, hydrogen)<br />
Purchasing of hazardous chemicals<br />
Purchasing of non-hazardous chemicals, spare parts and other consumable materials<br />
Purchasing of electrical energy<br />
Purchasing of fuel oil and diesel fuel<br />
Purchasing of natural gas<br />
EXTERNAL TRANSPORT<br />
Transport of non-hazardous waste<br />
Transport of hazardous waste<br />
Transport of raw materials (dopants)<br />
Transport of raw materials (TET, TCS)<br />
Transport of hazardous chemicals<br />
Transport of non-hazardous chemicals, spare parts and other consumable materials<br />
Transport of product (silicon)<br />
Transport of product (HCl)<br />
Transport of persons<br />
PROCESSING/USE OF PRODUCT SUPPLIED BY MEMC<br />
Transformation of silicon<br />
Use of chips<br />
Use of photovoltaic cells<br />
Disposal of silicon<br />
Uses of hydrochloric acid<br />
ACTIVITIES IN LOCAL AREA<br />
Communication/awareness raising<br />
Social-economic impact<br />
13
ENVIRONMENTAL STATEMENT <strong>2009</strong><br />
DIRECT ENVIRONMENTAL ASPECTS<br />
Energy Resources<br />
The energy sources used in the <strong>Merano</strong> factory include electrical<br />
energy, fuel oil, diesel fuel and natural gas.<br />
Electrical energy accounts for almost all the energy consumed<br />
by the factory (see Table 2) and is mainly used in processes<br />
involved in the growth of (poly and mono) silicon crystals,<br />
the hydrogenation of TET into TCS, and the production of hydrogen.<br />
Electricity is supplied at high voltage and then transformed<br />
in on-site electrical substations for internal uses at medium and<br />
low voltage.<br />
Graph 2 shows data on the factory’s overall energy consumption<br />
in absolute and specific terms (expressed in TOE or<br />
Tons of Oil Equivalent) for each ton of silicon produced. Tables<br />
2 and 3 and Graphs 3 and 4 show the data broken down<br />
into separate energy sources.<br />
In <strong>2009</strong>, overall consumption noticeably increased due to increased<br />
production, while specific consumption was virtually the<br />
same as in the previous year.<br />
Fuel oil with a low sulphur content is used to feed the boiler,<br />
which heats the thermal oil used in processes that purify and<br />
recycle chlorosilanes.<br />
Diesel fuel and natural gas are used to heat some of the<br />
factory buildings which are not served by the cooling water recovery<br />
system. Diesel fuel is also used in company vehicles (for<br />
internal movement, and for the emergency team), and to power<br />
emergency generators.<br />
Graph 2 – Overall energy consumption (GJ)<br />
Total consumption GJ<br />
1,200,000<br />
1,100,000<br />
1,000,000<br />
900,000<br />
800,000<br />
700,000<br />
600,000<br />
500,000<br />
400,000<br />
300,000<br />
200,000<br />
2000 2001 2002 2003 2004 2005 2006 2007 2008 <strong>2009</strong><br />
1,000<br />
900<br />
800<br />
700<br />
600<br />
500<br />
400<br />
300<br />
200<br />
Specific consumption (GJ/t silicon)<br />
Total consumption GJ<br />
GJ/t silicon<br />
14
ENVIRONMENTAL STATEMENT <strong>2009</strong><br />
DIRECT ENVIRONMENTAL ASPECTS<br />
Graph 3 – Electrical energy consumption<br />
Total consumption (GJ)<br />
1,400,000<br />
1,200,000<br />
1,000,000<br />
800,000<br />
600,000<br />
400,000<br />
200,000<br />
0<br />
2000 2001 2002 2003 2004 2005 2006 2007 2008 <strong>2009</strong><br />
140%<br />
120%<br />
100%<br />
80%<br />
60%<br />
40%<br />
Specific consumption (GJ/t silicon)<br />
Total Poly<br />
Total Mono<br />
Specific<br />
Table 2 – Electrical energy consumption<br />
ELECTRICAL ENERGY CONSUMPTION<br />
YEAR<br />
total<br />
SPECIFIC<br />
GJ GJ/t silicon % (2000=100)<br />
2000 1,008,000 677.7 100.0%<br />
2001 851,650 806.6 119.0%<br />
2002 836,083 724.7 106.9%<br />
2003 886,734 684.6 101.0%<br />
2004 918,644 619.9 91.5%<br />
2005 946,860 566.2 91.3%<br />
2006 948,233 542.1 80.1%<br />
2007 1,011,558 500.0 73.8%<br />
2008 1,051,610 482.9 71.3%<br />
<strong>2009</strong> 1,130,981 492.6 72.7%<br />
Graph 4 - Consumption of fuels<br />
100,000<br />
100.0<br />
Total consumption GJ<br />
90,000<br />
80,000<br />
70,000<br />
60,000<br />
50,000<br />
40,000<br />
30,000<br />
20,000<br />
90.0<br />
80.0<br />
70.0<br />
60.0<br />
50.0<br />
40.0<br />
30.0<br />
20.0<br />
10.0<br />
Specific consumption (GJ / t silicon)<br />
10,000<br />
2000 2001 2002 2003 2004 2005 2006 2007 2008 <strong>2009</strong><br />
0.0<br />
Fuel oil GJ<br />
Diesel fuel GJ Natural Gas GJ GJ/t silicon<br />
15
ENVIRONMENTAL STATEMENT <strong>2009</strong><br />
DIRECT ENVIRONMENTAL ASPECTS<br />
Table 3 – Consumption of fuels<br />
YEAR<br />
Fuel oil<br />
GJ<br />
OVERALL CONSUMPTION Specific Trend<br />
Diesel fuel<br />
GJ<br />
Natural gas<br />
GJ<br />
GJ/t silicon (2000 = 100)<br />
2000 74,650.6 1,444.4 749.4 50.2 100<br />
2001 74,566.9 1,360.7 728.5 71.2 142<br />
2002 66,318.9 1,071.8 695.0 58.6 117<br />
2003 55,182.0 1,239.3 724.3 46.1 92<br />
2004 61,442.2 1,093.6 567.3 42.6 85<br />
2005 60,609.2 1,578.5 716.7 37.6 56<br />
2006 67,319.8 1,513.5 732.7 39.8 79<br />
2007 64,090.7 1,637.5 857.9 32.9 66<br />
2008 62,284.1 749.3 944.1 29.4 60<br />
<strong>2009</strong> 63,320.5 1,309.2 643.9 28.4 57<br />
Notes on the units of measurement used<br />
Starting this year, in compliance with EMAS III regulations, the GJ<br />
is used as the unit of measurement for energy consumption and<br />
energy efficiency.<br />
The following conversion factors were used when calculating the<br />
various indicators in joules:<br />
• 1 MWh = 3.6 GJ (for electrical energy)<br />
• 1 TOE = 41,868 GJ (for fuels)<br />
(sources: IEA; ENEA; World Energy Council)<br />
The decision to start from TOE when expressing fuel consumption<br />
in GJ was based on two “practical” reasons: most importantly,<br />
because MEMC must still report its energy consumption figures<br />
in TOE to FIRE every year, so these values must in any case be<br />
calculated by our Energy Manager; furthermore, unambiguous<br />
formulas for calculating energy consumption in joules from other<br />
units of measurement were not found for all the fuels used by the<br />
company. For example, Legis. Decree no. 115 dated 30 May<br />
08 and directive EC/32/2006 on the efficiency of final uses of<br />
energy and energy services provides conversion factors only for<br />
fuel oil and natural gas.<br />
Energy consumption in TOE is calculated by applying the following<br />
conversion factors, as set out in MICA memorandum<br />
no. 219/F dated 2 March 1992 “Article 19 of Italian Law no.<br />
10/1991“. Obligation to name and receive an annual report<br />
from a Technical Specialist responsible for the conservation and<br />
intelligent use of energy”:<br />
• Diesel fuel: 1 t = 1.08 TOE<br />
• Fuel oil: 1 t = 0.98 TOE<br />
• Natural gas:<br />
1000 Nm3 = 0.82 TOE<br />
• Electrical energy supplied at high voltage:<br />
1 MWh = 0.23 TOE.<br />
16
ENVIRONMENTAL STATEMENT <strong>2009</strong><br />
DIRECT ENVIRONMENTAL ASPECTS<br />
Water resources<br />
Table 4 lists data on the collection of groundwater for industrial<br />
use and for obtaining drinking water. The collection of groundwater<br />
is also shown in Graph 5.<br />
In <strong>2009</strong>, no significant changes occurred in the consumption of<br />
water for industrial use or for obtaining drinking water.<br />
In particular, drinking water is still used mostly in the cafeteria,<br />
in bathrooms, and for testing emergency fixtures (showers and<br />
eye washing stations). The increase in absolute terms in the consumption<br />
of drinking water as compared with previous years was<br />
caused by its additional use by personnel from outside firms who<br />
were working in the construction site that was opened to expand<br />
the facility.<br />
Table 4 – Water collected for use<br />
WATER CONSUMPTION GROUND WATER<br />
YEAR<br />
Total<br />
Specific<br />
Mm³/year m³/kg silicon %<br />
2000 14.64 9.8 100<br />
2001 13.53 12.8 130<br />
2002 13.88 12.0 94<br />
2003 13.28 10.3 85<br />
2004 12.65 8.5 83<br />
2005 11.72 7.0 82<br />
2006 11.31 6.5 66<br />
2007 11.29 5.6 57<br />
2008 10.60 4.9 49<br />
<strong>2009</strong> 11.35 4.9 50<br />
WATER CONSUMPTION DRINKING WATER<br />
YEAR<br />
Total<br />
Specific<br />
Mm3 / year m3/person %<br />
2000 48,222 91.70 100<br />
2001 47,615 96.90 106<br />
2002 39,003 86.30 94<br />
2003 27,442 63.50 69<br />
2004 32,543 75.92 83<br />
2005 41,778 99.24 108<br />
2006 41,112 100.27 109<br />
2007 50,868 121.99 133<br />
2008 47,912 112.73 123<br />
<strong>2009</strong> 64,124 106.87 117<br />
Graph 5 – Consumption of groundwater<br />
16<br />
14<br />
Total consumption (Mil m3)<br />
14<br />
12<br />
10<br />
8<br />
12<br />
10<br />
8<br />
6<br />
Specific consumption m3/kg of silicon<br />
6<br />
2000 2001 2002 2003 2004 2005 2006 2007 2008 <strong>2009</strong><br />
4<br />
Annual consumption<br />
Specific consumption<br />
17
ENVIRONMENTAL STATEMENT <strong>2009</strong><br />
DIRECT ENVIRONMENTAL ASPECTS<br />
Consumption of raw and<br />
auxiliary materials<br />
Table 5 and Graphs 6 and 7 show the trend in specific consumption<br />
of chlorosilanes and hydrogen as compared with the year<br />
2000, which is used as the year of reference.<br />
Likewise, hydrogen consumption does not include the portion produced<br />
by the factory itself, because we believe that the product<br />
purchased on the market has greater impact on the environment.<br />
To this end, we must point out that over the last few years, chlorosilanes<br />
have not been used only to produce polycrystals. Some<br />
of this material is also used to produce the precious mixtures that<br />
are employed to grow expitaxial substrates.<br />
Table 5 – Consumption of chlorosilanes and hydrogen<br />
YEAR<br />
CONSUMPTION OF RAW MATERIALS<br />
Chlorosilanes<br />
% t/t of Poly<br />
2000 = 100<br />
Hydrogen<br />
% t/ of Poly<br />
2000 = 100<br />
2000 100 100<br />
2001 100 237<br />
2002 99 175<br />
2003 100 190<br />
2004 97 179<br />
2005 101 173<br />
2006 101 102<br />
2007 99 127<br />
2008 86 106<br />
<strong>2009</strong> 84 85<br />
Graph 6 – Consumption of chlorosilanes (in equivalent t of TET)<br />
Annual consumption, % ( 2000=100 )<br />
200<br />
150<br />
100<br />
50<br />
0<br />
125<br />
100<br />
75<br />
50<br />
25<br />
0<br />
2000 2001 2002 2003 2004 2005 2006 2007 2008 <strong>2009</strong><br />
Specific consumption (t/t Poly)<br />
Total consumption<br />
Specific consumption<br />
18
ENVIRONMENTAL STATEMENT <strong>2009</strong><br />
DIRECT ENVIRONMENTAL ASPECTS<br />
Graph 7 – Consumption of hydrogen<br />
350<br />
350<br />
Specific consumption (m³/t Poly)<br />
300<br />
250<br />
200<br />
150<br />
100<br />
300<br />
250<br />
200<br />
150<br />
100<br />
Annual consumption, normalized (2000=100)<br />
50<br />
2000 2001 2002 2003 2004 2005 2006 2007 2008 <strong>2009</strong><br />
50<br />
Total consumption<br />
Specific consumption<br />
19
ENVIRONMENTAL STATEMENT <strong>2009</strong><br />
DIRECT ENVIRONMENTAL ASPECTS<br />
The following table shows data for hazardous chemicals and<br />
preparations of which more than 100 kilograms are used annually<br />
in production activities and auxiliary processes.<br />
Table 6 – Consumption of auxiliary materials<br />
CONSUMPTION (in t)<br />
AUXILIARY MATERIALS DANGER SYMBOL 2000 2001 2002 2003 2004 2005 2006 2007 2008 <strong>2009</strong><br />
Hydrochloric Acid 37% Corrosive 2.1 1.5 2.2 2.4 2.1 2.1 1.9 1.6 1.4 1.2<br />
Hydrofluoric Acid 40% Corrosive,<br />
18.9 18.5 24.8 33.6 33.5 36.6 36.9 26.5 20.6 16.4<br />
Highly toxic<br />
Nitric Acid<br />
Corrosive 0.7 0.6 1.1 0.5 1.2 3.2 5.4 4.8 3.6 3.0<br />
65% - 70%<br />
Mixture HNO3/HF/ Corrosive, Toxic 378.1 267.1 315.5 371.5 362.5 325.8 302.7 247.0 231.5 218.1<br />
acetic acid<br />
Caustic Potash 50% Corrosive 32.0 27.3 27.1 30.8 15.6 44.7 25.7 46.4 52.2 68.8<br />
Caustic Soda 50% Corrosive 882.8 423.3 495.0 787.0 1,355.9 853.3 924.9 1,088.5 1,201.6 1,152.4<br />
Ammonia 30% Corrosive,<br />
0.8 0.4 0.5 0.4 0.4 0.4 0.3 0.3 0.3 0.3<br />
<strong>Environmental</strong> hazard<br />
Chromic Anhydride 30% Corrosive, Toxic 2.6 2.5 3.7 4.8 4.7 3.3 2.7 1.7 1.1 1.0<br />
Oxygenated Water Corrosive 5.5 5.7 8.6 8.7 8.6 8.9 9.1 8.0 4.4 3.8<br />
30-33%<br />
Ethyl and isopropyl Highly inflammable, 1.8 0.9 1.2 1.4 1.6 1.6 1.4 0.8 1.4 0.9<br />
alcohol<br />
irritant<br />
Solveclean Harmful - - - 0.2 0.6 0.8 0.8 0.8 0.8 0.8<br />
Fluid combustible oil Toxic 1,832.7 1,816.9 1,616.4 1,344.7 1,497.5 1,473.2 1,640.7 1,562.2 1,518.0 1,543.3<br />
Diesel Toxic 32.7 33.6 25.6 17.4 22.1 20.1 39.0 36.2 16.6 29.0<br />
Freon 22 <strong>Environmental</strong> hazard 2.5 2.3 3.0 3.6 6.8 5.6 8.3 8.1 5.4 8.0<br />
The consumption of diesel fuel increased in <strong>2009</strong> due to the<br />
need to heat a new engineering workshop and a new warehouse<br />
for reserve stocks of materials.<br />
The increase in consumption of potash, on the other hand, was<br />
caused by a greater level of hydrogenation that, in turn, was associated<br />
with the production of polycrystal.<br />
Decreased monocrystal production and a simultaneous increase<br />
in silicon production for the photovoltaic solar market (which<br />
requires different monitoring procedures that use less reagents<br />
as compared with the amounts needed for producing silicon for<br />
the microelectronic market) are the reasons behind the reduced<br />
consumption of hydrofluoric acid, nitric acid, acid mixtures and<br />
chromium trioxide.<br />
With regard to the consumption of Freon, a ban on the use of<br />
virgin HCFCs for the maintenance and repair of equipment went<br />
into effect on January 1, 2010. Thus, as much Freon as possible<br />
was loaded from warehouse stocks into the system last December.<br />
20
ENVIRONMENTAL STATEMENT <strong>2009</strong><br />
DIRECT ENVIRONMENTAL ASPECTS<br />
Atmospheric Emissions<br />
The figure below is a schematic illustration of the operations/<br />
processes that generate significant amounts of atmospheric emissions,<br />
and of the abatement systems used and the substances<br />
released.<br />
Table 7 shows the results of the <strong>2009</strong> monitoring campaign: All<br />
the emissions analyzed were within the prescribed limits.<br />
Emissions at the plant are authorized by the Province of Bolzano,<br />
Italy (with integrated environmental authorization no. 1779 dated<br />
18 June 2008, supplemented by authorization with file no.<br />
519528 dated 16 Sept <strong>2009</strong> for three new points of emission<br />
that are planned for the production of highly doped monocrystal<br />
silicon).<br />
HEATING PLANTS<br />
SO x, NO x, CO, CO ², DUST<br />
ATTACK BY ACIDS<br />
NO x, HF, HCI, CR<br />
FUMES VENTED FROM<br />
HCL STOCKS<br />
HCI<br />
ABATEMENT SYSTEMS USING<br />
WATER (scrubbers)<br />
LOW TEMPERATURE RECOVERY<br />
OF VENTED FUMES -<br />
HYDROGEN WASH<br />
HCI<br />
CENTRAL SUCTION SYSTEM -<br />
MONOCRYSTAL DEPT.<br />
SILICON DUST<br />
REMOVAL OF GRAPHITE FROM<br />
MONOCRYSTAL<br />
GRAPHITE DUST<br />
MECHANICAL FILTERS<br />
ATMOSPHERE<br />
MACHINING<br />
SILICON DUST<br />
PAINTING CABIN<br />
DUST VOC<br />
CUTTERS<br />
SILICON DUST<br />
CZS MACHINING<br />
SILICON DUST<br />
MECHANICAL<br />
FILTERS<br />
SANDBLASTING<br />
CABIN<br />
DUST<br />
MECHANICAL<br />
FILTERS<br />
21
ENVIRONMENTAL STATEMENT <strong>2009</strong><br />
DIRECT ENVIRONMENTAL ASPECTS<br />
Table 7 – Atmospheric emissions. Concentration and mass flows<br />
POINT DESCRIPTION PARAMETER AMOUNT<br />
MEASURED<br />
LEGAL<br />
LIMIT<br />
(*)<br />
HOURLY MASS<br />
FLOW<br />
DAILY MASS<br />
FLOW<br />
ANNUAL MASS<br />
FLOW<br />
MONITORING<br />
FREQUENCY<br />
(*)<br />
E3<br />
E4<br />
Hydrochloric acid<br />
released from Poly dept.<br />
Hydrochloric acid<br />
mg/Nm3 mg/m3 kg/hR kg/dkg kg/y<br />
0.64 30 < 0.00064 < 0.015 < 5.598 Annual<br />
Total dust 67.94 80 0.56864 13.647 4,981.296 Annual<br />
B1d Oxygen 6.32 3% 0.02465 0.592 215.951 Annual<br />
B1e Oxygen 6.25 3% 0.02800 0.672 245.249 Annual<br />
B1d Nitrogen oxides 250.66 400 0.97756 23.461 8,563.441 Annual<br />
Fuel oil-fired heating<br />
B1e Nitrogen oxides 359.81 400 1.61121 38.669 14,114.175 Annual<br />
plant<br />
B1d Sulphur oxides 82.83 1700 0.32303 7.753 2,829.750 Annual<br />
B1e Sulphur oxides 66.69 1700 0.29865 7.168 2,616.161 Annual<br />
B1d Carbon monoxide 26.45 100 0.10315 2.476 903.629 Annual<br />
B1e Carbon monoxide 10.83 100 0.04849 1.164 424.770 Annual<br />
E5<br />
E12<br />
E13<br />
E16<br />
E17<br />
E20<br />
E25<br />
Discharge of residues<br />
from ventilation hoods<br />
after acid cleaning in<br />
POLY, MONO, LM, CZS<br />
depts.<br />
Emissions from graphite<br />
cleaning in CZB dept.<br />
Centralized emissions<br />
from CZA dept.<br />
Emissions from graphite<br />
cleaning in CZB dept.<br />
Centralized emissions<br />
from CZB dept.<br />
Discharge from silicon<br />
dust abatement plant in<br />
LM dept.<br />
Diesel fuel-fired heating<br />
plant for painting cabin<br />
Hydrochloric acid 1.52 30 0.02516 0.604 220.405 Annual<br />
Hydrochloric acid < 0.01 5 < 0.00017 < 0.004 < 1.449 Annual<br />
Total chromium < 0.01 5 < 0.00017 < 0.004 < 1.449 Annual<br />
Nitrogen oxides 0.08 50 0.00139 0.033 12.172 Annual<br />
Total dust - 30 - - - Biennial<br />
SiO2 - 5 - - - Biennial<br />
Total dust - 30 - - - Biennial<br />
SiO2 - 5 - - - Biennial<br />
Total dust - 30 - - - Biennial<br />
Total dust - 30 - - - Biennial<br />
SiO2 - 5 - - - Biennial<br />
Total dust - 30 - - - Biennial<br />
SiO2 - 5 - - - Biennial<br />
Total dust 1.00 80 0.00028 0.001 0.138 Biennial<br />
Nitrogen oxides 111.31 150 0.03072 0.061 15.361 Biennial<br />
Sulphur oxides 2.00 1700 0.00055 0.001 0.276 Biennial<br />
Carbon monoxide 10.21 100 0.00282 0.006 1.409 Biennial<br />
Oxygen 9.06 3% 0.00250 0.005 1.251 Biennial<br />
Bacharach index - 1 - - -<br />
22
ENVIRONMENTAL STATEMENT <strong>2009</strong><br />
DIRECT ENVIRONMENTAL ASPECTS<br />
E26<br />
E27<br />
E32<br />
E33<br />
Discharge from pointing<br />
cabin V.O.C.<br />
Discharge from sandblasting<br />
cabin<br />
Centralized emissions<br />
from CZB dept.<br />
Emissions from grinding<br />
operations in CZS dept.<br />
Total dust < 1.00 3 0.2526 0,076 18.957 Annual<br />
V.O.C. 19.79 150 (**) 0.49993 1.5 374.952 Annual<br />
Total dust 3.49 30 0.01992 0.04 9.958 Biennial<br />
Total dust - 30 - - - Biennial<br />
SiO2 - 5 - - - Biennial<br />
Total dust - 30 - - - Biennial<br />
SiO2 - 5 - - - Biennial<br />
E34<br />
(E21)<br />
Emissions from cutters<br />
CZS dept.<br />
Total dust - 30 - - - Biennial<br />
SiO2 - 5 - - - Biennial<br />
(*) Integrated <strong>Environmental</strong> Authorization, Prot. no. 1779 dated 18/06/2008, section a) Air Sector and Attachment A<br />
(**) For information regarding authorization to release volatile organic compounds (V.O.C.), see part 1, point 5 of Attachment C to Italian Provincial Law no.<br />
8 dated 16 March 2000. This law subdivides the V.O.C. into four classes with different prescribed emission limits that depend on the class and the mass<br />
flow involved.<br />
The legislation specifies that the total concentration of compounds belonging to the same class may not exceed the limits indicated for that class, and that the<br />
total concentration of all compounds analyzed may not exceed the limit indicated for the highest class.<br />
While the monitoring performed by an accredited laboratory shows compliance with the limits for each class, this table only shows the aggregate data.<br />
The following tables and graphs show estimated carbon dioxide<br />
emissions generated from the combustion of fuel oil, diesel fuel<br />
and natural gas, and the estimated emission of carbon dioxide<br />
equivalent calculated from the consumption of the refrigerant gases<br />
known as R22 and R23.<br />
The data show a reduction in the atmospheric emissions from<br />
combustion and refrigerant gases (due to reduced consumption<br />
of fuel oil and refrigerant gases R22 and R23).<br />
Table 8 – CO 2 -Carbon dioxide emissions<br />
CARBON DIOXIDE EMISSIONS<br />
Year<br />
Fuel oil<br />
kt of CO2<br />
Diesel fuel<br />
kt ofCO ²<br />
Annual specific trend<br />
Natural gas<br />
kt of CO2<br />
Total from<br />
combustion<br />
kt of CO ²<br />
Overall<br />
kt CO2/t of silicon<br />
%<br />
2000 5.474 0.1107 0.042 5.623 0.004 100<br />
2001 5.466 0.101 0.041 5.608 0.005 100<br />
2002 4.863 0.079 0.040 4.982 0.004 89<br />
2003 4.046 0.092 0.041 4.179 0.003 74<br />
2004 4.505 0.081 0.032 4.618 0.003 82<br />
2005 4.355 0.126 0.033 4.515 0.003 80<br />
2006 4.936 0.112 0.041 5.089 0.003 91<br />
2007 5.015 0.115 0.049 5.179 0.003 92<br />
2008 4.775 0.057 0.044 4.876 0.002 87<br />
<strong>2009</strong> 4.779 0.099 0.030 4.908 0.002 87<br />
23
ENVIRONMENTAL STATEMENT <strong>2009</strong><br />
DIRECT ENVIRONMENTAL ASPECTS<br />
Graph 8 – Carbon dioxide emissions<br />
Total quantity (kt CO2/ year)<br />
10.000<br />
9.000<br />
8.000<br />
7.000<br />
6.000<br />
5.000<br />
4.000<br />
3.000<br />
2.000<br />
1.000<br />
0.000<br />
Emissions of CO2 generated by combustion<br />
2000 2001 2002 2003 2004 2005 2006 2007 2008 <strong>2009</strong><br />
0.010<br />
0.009<br />
0.008<br />
0.008<br />
0.007<br />
0.006<br />
0.006<br />
0.005<br />
0.004<br />
0.003<br />
0.003<br />
0.002<br />
0.001<br />
0.001<br />
0.000<br />
Specific quantity (kt CO2/ of tsilicon)<br />
Fuel oil GJ<br />
Diesel fuel<br />
Natural Gas<br />
Specific<br />
Table 9 – Carbon dioxide equivalent emissions<br />
Year<br />
CARBON DIOXIDE EQUIVALENT EMISSIONS<br />
Annual specific trend<br />
Total<br />
Total ktCO<br />
R22 ktCO ²<br />
R 23 ktCO ²<br />
R507 ktCO ²<br />
/t<br />
² ktCO of silicon<br />
²<br />
%<br />
2000 3.7 70.3 0.0 74.0 0.05 100<br />
2001 3.5 38.0 0.0 41.5 0.04 80<br />
2002 4.5 57.6 0.0 62.1 0.05 100<br />
2003 5.4 58.0 0.0 63.4 0.05 100<br />
2004 10.1 60.0 0.0 70.1 0.05 100<br />
2005 8.4 170.2 0.0 178.6 0.11 220<br />
2006 12.4 90.2 0.0 102.6 0.06 120<br />
2007 12.2 22.5 0.0 34.6 0.02 47<br />
2008 8.1 14.0 0.0 22.1 0.01 30<br />
<strong>2009</strong> 12.0 0.0 0.0 12.0 0.01 16<br />
24
ENVIRONMENTAL STATEMENT <strong>2009</strong><br />
DIRECT ENVIRONMENTAL ASPECTS<br />
Graph 9 – Carbon dioxide equivalent emissions<br />
Total quantity (kt CO2/ year)<br />
Emissions of equivalent CO2 (values projected 100 years into future)<br />
500<br />
400<br />
300<br />
200<br />
100<br />
0<br />
2000 2001 2002 2003 2004 2005 2006 2007 2008 <strong>2009</strong><br />
1<br />
0.9<br />
0.8<br />
0.7<br />
0.6<br />
0.5<br />
0.4<br />
0.3<br />
0.2<br />
0.1<br />
0<br />
Specific quantity (kt CO2/ of tsilicon)<br />
R22<br />
R23<br />
R507<br />
Specific<br />
Greenhouse gas emissions are monitored by MEMC voluntarily.<br />
In fact, the factory is not included in the field of application<br />
of European Parliament and Council Directive 2003/87/EC,<br />
which implemented a system to trade greenhouse gas emissions<br />
within the European Union. Among other obligations, it requires<br />
obtaining authorization to emit greenhouse gases and mandates<br />
monitoring of emissions over time, with certification of the results<br />
of the monitoring by an accredited body.<br />
MEMC has identified its greenhouse gas sources as the combustion<br />
of fossil fuels (diesel fuel, fuel oil and natural gas) and the<br />
emission of refrigerant gases (R22 and R23).<br />
Combustion generates carbon dioxide (CO2), which is the main<br />
gas causing the greenhouse effect. The quantity of CO2 emitted<br />
by MEMC in <strong>Merano</strong> is estimated by multiplying the consumption<br />
of combustibles by the following conversion factors:<br />
• Between 2000 – 2006, the factors indicated in the CIPE<br />
(Italian Interministerial Economic Planning Committee) Resolution<br />
dated 25th February 1994 entitled “Approval of a National Program<br />
to reduce carbon dioxide emissions by 2000 to the levels<br />
in 1990” are as follows:<br />
• Diesel fuel 1 TOE = 3.10 t CO 2<br />
• Fuel oil 1 TOE = 3.07 t CO 2<br />
• Natural gas 1 TOE = 2.35 t CO 2<br />
• Since 2007, the factors indicated in Italian Directorial Decree<br />
no. Dec/Ras/854/05 dated 1 July 2005 promulgated by the<br />
Italian Ministry for the Environment and Territory and by the Italian<br />
Ministry of Productive Activities have been as follows:<br />
• Diesel fuel 1 ton = 3.173 t CO 2<br />
• Fuel oil 1 ton = 3.21 t CO 2<br />
• Natural gas 1 Std m3= 1.966 t CO 2<br />
• In <strong>2009</strong>, the factors indicated in Resolution no. 14/<strong>2009</strong><br />
from the Italian Ministry for the Environment and for Territorial Protection<br />
and by the Italian Ministry of Productive Activities, regarding<br />
notification of greenhouse gas emissions pursuant to Directive<br />
2003/87/EC, which updated the coefficients contained in the<br />
Directorial Decree cited above, were as follows<br />
• Diesel fuel 1 ton = 3.173 t CO 2<br />
• Fuel oil 1 ton = 3.16 t CO 2<br />
• Natural gas 1 Std m3= 1.957 t CO 2<br />
As for refrigerant gases, a calculation was made of emissions in<br />
terms of “carbon dioxide equivalent” by multiplying the consumption<br />
of gas by the following GWP (Global Warming Potential):<br />
• R22 (CHClF2 chlorodifluoromethane): GWP (100 years) =<br />
1500 (source: IFC Inc USA si GHG Protocol Initiative)<br />
• R23 (CHF3 trifluoromethane): GWP (100 years) =<br />
11700 (source: IPCC Second Assessment Report, 1996)<br />
The Global Warming Potential (GWP) represents the ratio between<br />
the warming caused by a gas over 100 years and the<br />
warming caused by the same quantity of carbon dioxide (CO2)<br />
during the same period. Therefore the value of carbon dioxide<br />
is one.<br />
25
ENVIRONMENTAL STATEMENT <strong>2009</strong><br />
DIRECT ENVIRONMENTAL ASPECTS<br />
Water Discharges<br />
The layout of factory water discharges is shown schematically in<br />
the following figure. It shows the activities and processes that generate<br />
water discharges, the substances they contain, and the on<br />
and off-site treatment systems in which the discharges are channelled<br />
to reduce the pollutant load to the final receiving body.<br />
Factory discharges were authorized by the Province of Bolzano<br />
(with Integrated <strong>Environmental</strong> Authorization no. 1779 dated<br />
18th June 2008) and by the City of <strong>Merano</strong>.<br />
RAIN WATER AND<br />
PIEZOMETERS<br />
CUTTERS IN CZS DEPT.<br />
OIL SLIME<br />
COLLECTION TANK<br />
MECHANICAL<br />
ABATEMENT<br />
Suspended solids<br />
EQUALIZATION<br />
TANK<br />
ADIGE RIVER<br />
CUTTERS IN LM DEPT.<br />
OIL SLIME<br />
COLLECTION TANK<br />
COOLING<br />
WATER<br />
ACID EMISSIONS TREATMENT<br />
ATTACK BY ACIDS<br />
BALANCE TANK<br />
CHEMICAL-PHYSICAL<br />
TREATMENT<br />
Chlorides, fluorides, nitrogen<br />
HYDROGEN WASH<br />
BALANCE<br />
TANK<br />
WASTE TREATMENT<br />
PLANT<br />
MECHANICAL<br />
WORKSHOP<br />
DEOILER<br />
Organic substances<br />
MUNICIPAL WASTE WATER<br />
Organic substances<br />
RAIN WATER<br />
RIO SINIGO<br />
Stream<br />
OVERFLOW FROM COLLECTION<br />
TANKS FOR COOLING, EMERGENCY<br />
AND FIREFIGHTING WATER<br />
The following table and graph show the water volumes directly discharged into the Adige River, which receives most of the effluents<br />
from the manufacturing process.<br />
26
ENVIRONMENTAL STATEMENT <strong>2009</strong><br />
DIRECT ENVIRONMENTAL ASPECTS<br />
Table 10 – Water discharges<br />
FINAL WATER DISCHARGE - QUANTITY DISCHARGED<br />
YEAR<br />
Water discharged into a body of water Water discharged into a treatment plant Water collected Discharged / collected<br />
Mil m³/year Mil m³/year Mil m³/ year %<br />
2000 14.34 - 14.64 98<br />
2001 13.34 - 13.53 99<br />
2002 13.78 - 13.88 99<br />
2003 13.29 0.05 13.29 100<br />
2004 12.47 0.06 12.65 99<br />
2005 11.27 0.06 11.72 97<br />
2006 11.05 0.10 11.31 99<br />
2007 10.93 0.10 11.29 98<br />
2008 10.16 0.09 10.60 97<br />
<strong>2009</strong> 10.27 0.12 11.35 92<br />
27
ENVIRONMENTAL STATEMENT <strong>2009</strong><br />
DIRECT ENVIRONMENTAL ASPECTS<br />
Graph 10 – Water discharges<br />
Quantity discharged ( Mil m3 )<br />
16<br />
14<br />
12<br />
10<br />
2000 2001 2002 2003 2004 2005 2006 2007 2008 <strong>2009</strong><br />
105<br />
100<br />
95<br />
90<br />
Water discharged % water discharged / water collected<br />
Trend (% water discharged / water collected)<br />
The following tables and graphs show the amounts of nitrous nitrogen, nitric nitrogen, fluorides and chlorides discharged directly into<br />
the Adige River. The amounts analyzed are within prescribed limits.<br />
YEAR<br />
Limit (*)<br />
NITROUS NITROGEN (as N)<br />
Maximum<br />
concentration<br />
Average<br />
concentration<br />
mg/ liter mg/ liter mg/ liter<br />
2000 0.6 0.10 0.07<br />
2001 0.6 0.17 0.08<br />
2002 0.6 0.10 0.06<br />
2003 0.6 0.06 0.01<br />
2004 0.6 0.02 0.02<br />
2005 0.6 0.02 0.02<br />
2006 0.6 0.006 0.004<br />
2007 0.6 0.020 0.01<br />
2008 0.6 0.020 0.011<br />
<strong>2009</strong> 0.6 0.030 0.015<br />
YEAR<br />
Limit (*)<br />
FLUORIDES<br />
Maximum<br />
concentration<br />
Average<br />
concentration<br />
mg/ liter mg/ liter mg/ liter<br />
2000 6 1.7 0.6<br />
2001 6 0.5 0.4<br />
2002 6 2.2 0.5<br />
2003 6 0.4 0.3<br />
2004 6 0.8 0.4<br />
2005 6 0.5 0.4<br />
2006 6 0.5 0.3<br />
2007 6 2.1 0.5<br />
2008 6 0.5 0.4<br />
<strong>2009</strong> 6 0.5 0.4<br />
YEAR<br />
Limit (*)<br />
NITRIC NITROGEN (as N)<br />
Maximum<br />
concentration<br />
Average<br />
concentration<br />
mg/ liter mg/ liter mg/ liter<br />
2000 20 10.1 5.6<br />
2001 20 8.4 4.8<br />
2002 20 8.6 5.6<br />
2003 20 6.4 2.7<br />
2004 20 3.6 2.4<br />
2005 20 5.7 2.9<br />
2006 20 2.4 2.0<br />
2007 20 2.17 1.98<br />
2008 20 2.3 2.2<br />
<strong>2009</strong> 20 4.7 2.5<br />
YEAR<br />
Limit (*)<br />
CHLORIDES<br />
Maximum<br />
concentration<br />
Average<br />
concentration<br />
mg/ liter mg/ liter mg/ liter<br />
2000 1200 524.0 136.5<br />
2001 1200 488.8 75.2<br />
2002 1200 381.0 57.6<br />
2003 1200 348.0 22.1<br />
2004 1200 12.0 8.0<br />
2005 1200 12.0 9.8<br />
2006 1200 12.8 8.6<br />
2007 1200 20.0 9.71<br />
2008 1200 16.5 11.14<br />
<strong>2009</strong> 1200 12 8.67<br />
(*) Since 2002, the reference limits have been those set forth by Italian Provincial Law no. 8 dated 18th June 2002.<br />
28
ENVIRONMENTAL STATEMENT <strong>2009</strong><br />
DIRECT ENVIRONMENTAL ASPECTS<br />
Water Discharge Nitrous Nitrogen (N-No²) Legal Limite Maximum Value Average Value<br />
mg/liter<br />
0.7<br />
0.6<br />
0.5<br />
0.4<br />
0.3<br />
0.2<br />
0.1<br />
0<br />
2000 2001 2002 2003 2004 2005 2006 2007 2008 <strong>2009</strong><br />
Water Discharge Nitric Nitrogen (N-No3)<br />
mg/liter<br />
25<br />
20<br />
15<br />
10<br />
5<br />
0<br />
2000 2001 2002 2003 2004 2005 2006 2007 2008 <strong>2009</strong><br />
mg/liter<br />
7<br />
6<br />
5<br />
4<br />
3<br />
2<br />
1<br />
0<br />
Water Discharge Fluorides F<br />
2000 2001 2002 2003 2004 2005 2006 2007 2008 <strong>2009</strong><br />
Water Discharge Chlorides Cl<br />
mg/liter<br />
1400<br />
1200<br />
1000<br />
800<br />
600<br />
400<br />
200<br />
0<br />
2000 2001 2002 2003 2004 2005 2006 2007 2008 <strong>2009</strong><br />
29
ENVIRONMENTAL STATEMENT <strong>2009</strong><br />
DIRECT ENVIRONMENTAL ASPECTS<br />
Waste<br />
Special non-hazardous and<br />
hazardous waste<br />
The following diagrams illustrate the waste produced and include<br />
information on the activities causing it, the way it is handled onsite,<br />
and its final destination (recycling/recovery or disposal).<br />
Figure 2 – Diagram showing the treatment of special non-hazardous waste<br />
PROCESS<br />
GRAPHITE<br />
AMORPHOUS SILICON FROM HCL RECOVERY<br />
QUARTZ AND QUARTZ MIXED WITH SILICON<br />
METALLIC SILICON AND SILICON SCRAPS FOR TESTING<br />
SEPARATED COLLECTION IN FACTORY<br />
DEPARTMENTS AND AT THE<br />
WASTE STORAGE CENTER<br />
SHIPMENT FOR DISPOSAL<br />
(IN 2004 ONLY)<br />
PACKING MATERIALS<br />
MAINTENANCE<br />
PAPER AND CARDBOARD-<br />
PLASTIC<br />
WOOD<br />
GLASS<br />
COPPER WIRE AND<br />
CABLE<br />
IRON AND STEEL<br />
SEPARATED COLLECTION IN FACTORY<br />
DEPARTMENTS AND AT THE<br />
WASTE STORAGE CENTER<br />
SHIPMENT FOR RECYCLING<br />
OFFICES<br />
PAPER AND CARDBOARD<br />
TONER<br />
CARE OF GREEN AREAS<br />
PLANT MATERIALS FOR COMPOST<br />
TREATMENT PLANTS<br />
FLUORIDE AND CHROMIUM SLUDGE<br />
SILICON SLUDGE FROM CZS<br />
VARIOUS OPERATIONS<br />
URBAN-TYPE WASTE<br />
BULKY WASTE<br />
OTHER CODES FOR OCCASIONAL<br />
WASTE<br />
SEPARATED COLLECTION IN FACTORY<br />
DEPARTMENTS AND AT THE<br />
WASTE STORAGE CENTER<br />
SHIPMENT FOR DISPOSAL<br />
30
ENVIRONMENTAL STATEMENT <strong>2009</strong><br />
DIRECT ENVIRONMENTAL ASPECTS<br />
Figure 3 – Diagram showing the treatment of special hazardous waste<br />
ORDINARY MAINTENANCE<br />
USED OIL<br />
OIL FILTERS<br />
LEAD-ACID BATTERIES<br />
COLLECTION IN BARRELS<br />
IN FACTORY DEPTS.<br />
TEMP. STORAGE IN<br />
WASTE CENTER<br />
TRANSFER TO WASTE<br />
COLLECTION CONSORTIUMS<br />
SOLVENTS<br />
SEDIMENT FROM SILANE PURIFICATION COLUMNS<br />
SLUDGE FROM DEOILER<br />
TEMP. STORAGE IN<br />
WASTE CENTER<br />
SHIPMENT FOR<br />
DISPOSAL<br />
WASTE WATER<br />
TREATMENT<br />
OCCASIONAL WASTE<br />
SILICON SLUDGE (LM DEPT.)<br />
HUMAN WASTE<br />
OBSOLETE REAGENTS<br />
ABSORBENT POWDERS<br />
(FOR ABSORBING ACCIDENTAL SPILLS)<br />
SLUDGE FROM CLEANING<br />
OF TANKS AND VATS<br />
TEMP. STORAGE IN<br />
WASTE CENTER<br />
SHIPMENT FOR<br />
DISPOSAL<br />
The following table and graph show the total amounts of special<br />
waste produced by the factory. The table highlights the quantities<br />
sent for recycling and for disposal, as well as the quantity of<br />
waste produced per ton of silicon.<br />
sent for recycling decreased after peaking last year, which was<br />
partially due to the almost total recycling of silica and of certain<br />
materials derived from demolition and maintenance operations<br />
(iron and copper in particular).<br />
It is noted that in <strong>2009</strong>, overall production of waste increased<br />
slightly due to an increase in the production of silicon and to<br />
maintenance operations performed during the year. The portion<br />
Table 11 – Waste production<br />
YEAR<br />
WASTE PRODUCTION<br />
waste disposed of waste recycled total waste specific waste % recycled waste out of<br />
total waste<br />
t/ year t/ year t/ year t/t Si<br />
2000 678 508 1,186 0.80 43%<br />
2001 523 567 1,090 1.03 52%<br />
2002 195 711 906 0.79 78%<br />
2003 704 841 1,545 1.19 54%<br />
2004 692 444 1,136 0.77 39%<br />
2005 833 398 1,230 0.74 32%<br />
2006 775 290 1,065 0.61 27%<br />
2007 557 573 1,130 0.56 51%<br />
2008 397 765 1,162 0.53 66%<br />
<strong>2009</strong> 733 696 1,429 0.62 49%<br />
31
ENVIRONMENTAL STATEMENT <strong>2009</strong><br />
DIRECT ENVIRONMENTAL ASPECTS<br />
Graph 11 – Waste production<br />
1,800<br />
2,0<br />
Annual production (t)<br />
1,500<br />
1,200<br />
900<br />
600<br />
1,6<br />
1,2<br />
0,8<br />
Specific production (t/t of silicon)<br />
300<br />
0,4<br />
0<br />
2000 2001 2002 2003 2004 2005 2006 2007 2008 <strong>2009</strong><br />
Disposed of Recycled Total specific waste<br />
0,0<br />
The following table and graph show the production trends for<br />
hazardous waste alone, both in terms of absolute and<br />
specific amounts. As we have seen in previous <strong>Environmental</strong><br />
<strong>Statement</strong>s, hazardous waste is mostly generated during special<br />
maintenance operations closely tied to production trends, or in<br />
any case which were planned for periods exceeding one year.<br />
Specifically in <strong>2009</strong>, chlorosilanes were cleaned out of the depuration<br />
columns more frequently, maintenance operations were<br />
performed on the De Nora cells, and several pieces of equipment<br />
containing hazardous substances were sent out for disposal.<br />
The increase in waste output is mainly due to the start-up of large<br />
sites for the development of polycrystal production.<br />
In <strong>2009</strong>, reclamation operations generated 30,000 tons of soil,<br />
which were handled by an authorized treatment company so that<br />
they could be used as filler, pursuant to authorization by the Provincial<br />
Agency for the Environment of the Autonomous Province<br />
of Bolzano. The amount of filler was 14000 m3 (see also the<br />
chapter “Reclamation: Ensuring the Safety and Protection of the<br />
Soil and Groundwater”). This data was not combined with the<br />
quantity of waste shown in the table, so that a comparison can<br />
be made with previous years.<br />
Table 12 - Special hazardous waste<br />
HAZARDOUS WASTE PRODUCTION<br />
YEAR<br />
yearly<br />
t/year<br />
t/year/t silicon<br />
specific<br />
% waste production: 2000<br />
= 100<br />
% hazardous waste out of<br />
total waste<br />
2000 37 0.03 100 3%<br />
2001 77 0.07 233 7%<br />
2002 34 0.03 100 4%<br />
2003 13 0.01 33 1%<br />
2004 43 0.03 72 4%<br />
2005 61 0.04 133 5%<br />
2006 78 0.04 133 7%<br />
2007 102 0.05 167 9%<br />
2008 143 0.07 233 12%<br />
<strong>2009</strong> 198 0.09 287 14%<br />
32
ENVIRONMENTAL STATEMENT <strong>2009</strong><br />
DIRECT ENVIRONMENTAL ASPECTS<br />
Graph 12 – Special hazardous waste<br />
220<br />
Annual production (t)<br />
200<br />
180<br />
160<br />
140<br />
120<br />
100<br />
80<br />
60<br />
40<br />
0.10<br />
0.08<br />
0.04<br />
0.02<br />
Specific production (t/t of silicon)<br />
20<br />
0<br />
2000 2001 2002 2003 2004 2005 2006 2007 2008 <strong>2009</strong><br />
0.00<br />
Total waste produced<br />
Specific waste produced<br />
Reclamation: Ensuring the<br />
Safety and Protection of Soil<br />
and Groundwater<br />
MEMC is strongly committed to protecting the soil and groundwater,<br />
and for some time has collaborated with professionals in<br />
this sector to reduce the toxic debt generated on-site by past<br />
operations. MEMC’s reclamation activities over the years, and<br />
monitoring activities currently in progress, were fully described in<br />
the 2004 and 2007 <strong>Environmental</strong> <strong>Statement</strong>s. See these <strong>Statement</strong>s<br />
for further information.<br />
Further contamination of the soil or groundwater is unlikely, given<br />
the equipment and the technical and supervisory measures now<br />
being taken.<br />
In <strong>2009</strong>, the selection and reclamation of soil excavated for our<br />
expansion project continued, in accordance with procedures<br />
contained in plans approved by the City of <strong>Merano</strong> and the Province<br />
of Bolzano. As occurred in the past, soil with contamination<br />
exceeding the thresholds allowed by law was sent to authorized<br />
disposal plants, and soil whose characteristics permitted its reuse<br />
were employed for the necessary filling inside the production facility.<br />
Groundwater barrier and monitoring operations are continuing<br />
as part of a project approved and authorized by the Provincial<br />
Agency for the Environment (Prot. no. 29.6/62.07.07/2593<br />
dated 13 May 2004).<br />
Noise<br />
The Integrated <strong>Environmental</strong> Authorization<br />
dated 18th June 2008 issued by the Province<br />
of Bolzano, and Italian Decree of the President<br />
of the Province no. 39/2008, prescribe compliance<br />
with the following limits:<br />
Values to comply with:<br />
Day (6.00 am - 10.00 pm) Night (10.00 pm - 6.00 am)<br />
IEA DPP IEA DPP<br />
At factory boundary 70 db (A) 65 db (A) 70 db (A) 65 db (A)<br />
At surrounding homes 55 db (A) - 45 db (A) -<br />
33
ENVIRONMENTAL STATEMENT <strong>2009</strong><br />
DIRECT ENVIRONMENTAL ASPECTS<br />
The authorization mandates annual monitoring. Therefore, we<br />
will continue monitoring our acoustic impact by taking annual<br />
measurements based on our internal monitoring program, barring<br />
significant process changes or justified requests by those<br />
involved.<br />
This is also in response to the results of the last monitoring operation<br />
performed from October to November <strong>2009</strong>, which was<br />
carried out by an expert who is a member of the provincial register<br />
of acoustic technicians. The results, which are summarized in<br />
the following figure, are all within the prescribed limits.<br />
Point of measure<br />
(see map)<br />
LAeq by Day<br />
in dBA<br />
LAeq by Night<br />
in dBA<br />
1 59.0 59.0<br />
2 55.0 50.0<br />
3 61.0 60.5<br />
4 58.4 56.0<br />
5 56.0 50.0<br />
6 58.0 55.0<br />
7 57.0* 53.0*<br />
8 60.0* 54.0*<br />
9 64.0* 56.0*<br />
10 63.0* 60.0*<br />
11 64.0* 56.0*<br />
12 63.0* 51.5*<br />
13 64.0* 58.0*<br />
14 64.0 53.5<br />
* It was impossible to eliminate the added noise produced by vehicular<br />
traffic at these points. Such noise proved to be the predominant part of<br />
the noise produced by operations at the production facility.<br />
Polychlorinated Biphenyls and Asbestos<br />
The considerations on these aspects set out in previous <strong>Environmental</strong> <strong>Statement</strong>s remain unvaried.<br />
34
ENVIRONMENTAL STATEMENT <strong>2009</strong><br />
INDIRECT ENVIRONMENTAL ASPECTS<br />
The indirect environmental aspects that MEMC regards as important<br />
are:<br />
• managing relations with suppliers offering materials or<br />
services that are critical to the environment and to safety;<br />
• the activities of third parties operating on-site;<br />
• the purchase and transport of hazardous goods;<br />
• communication activities.<br />
Managing Relations with Critical<br />
Suppliers<br />
The selection of critical suppliers is made on the basis of specific<br />
technical, economic, qualitative and environmental criteria.<br />
These criteria are assessed by a suitable company committee<br />
based on MEMC’s vendor rating procedure before orders are<br />
assigned and, subsequently, at regular periodic intervals. Part<br />
of this evaluation process is based on the evidence provided<br />
by the candidates concerning the precautions they take to protect<br />
the environment: This may include EMAS registration, or ISO<br />
14001 certification, for example. In their absence, the adoption<br />
of specific operational or procedural precautions is considered<br />
favourably. This applies especially when evaluating small or very<br />
small local companies typical of the Alto Adige business system<br />
that collaborate with MEMC in particular for maintenance work,<br />
as described in the next section.<br />
Suppliers of waste management services (those enterprises involved<br />
in the collection, transport, recycling and disposal of the<br />
waste produced by MEMC) are subjected to further checks. In<br />
fact, all mandatory documents are checked in order to confirm<br />
the adequacy and completeness of legal authorizations to carry<br />
out the activities, and the operating site is inspected.<br />
In particular, the Isolazioni Termiche di Agosti Romano company,<br />
in <strong>2009</strong>, offered innovative materials and solutions - with low<br />
environmental impact - for thermally insulating the plant systems at<br />
the factory. These included lighter, less bulky heat shields which<br />
can be replaced quickly in case of leaks and are reusable so they<br />
do not require disposal.<br />
Activities of Companies Operating<br />
On-site<br />
Other companies in charge of maintenance activities regularly<br />
operate on the factory site. These activities include building and<br />
insulation work, painting and electrical installation, as well as<br />
cleaning and canteen services. The expansion project currently<br />
underway has resulted in additional companies working on-site.<br />
MEMC operates in a number of ways when handling relations<br />
with these companies. All third parties operating on-site are informed<br />
of the existing risks in the factory and of the behaviour<br />
that is required in order to carry out their tasks safely and with<br />
respect for the environment. They are also informed of MEMC’s<br />
<strong>Environmental</strong> Policy and of the requirements of the environmental<br />
management system that concern them.<br />
Likewise, in order to organize the work well and maintain an<br />
adequate level of housekeeping, MEMC has selected and<br />
marked out suitable areas where each company can deposit<br />
its materials and waste. Where necessary, these areas are<br />
equipped with waste collection tanks to prevent contaminating<br />
the soil and underground water.<br />
MEMC’s vigilant surveillance procedures include periodic audits<br />
aimed to ensure compliance with its instructions and to maintain<br />
control over the substances used and the waste materials produced.<br />
Purchase and Transport of Hazardous<br />
Substances and Preparations<br />
Before new chemicals and preparations are introduced into the<br />
factory, including those from external companies, they must have<br />
the joint approval from management's representative for the protection<br />
of the environment and the competent doctor, who assess<br />
their hazardous characteristics as a function of various parameters,<br />
including their intended use, the nature of the processes<br />
involved, the presence of other hazardous substances, the type<br />
of exposure, etc. This assessment is made according to the provisions<br />
set out in MEMC’s specific management procedure.<br />
The goods are mostly transported by road, mainly because of<br />
geographic and infrastructural conditions which impede the use<br />
of rail or sea transport.<br />
Nevertheless, MEMC pays particular attention to this aspect.<br />
Qualified personnel check the documents and the vehicles involved,<br />
which are subject to ADR regulations (Carriage of Dangerous<br />
Goods by Road). TET and TCS are at present transported<br />
by rail as far as the <strong>Merano</strong> train station, and then by road<br />
to MEMC. Particular procedures have been adopted for some<br />
time to monitor the railway wagons and road vehicles used to<br />
transport the tanks of chemicals from the railway station to the<br />
factory. The road vehicles are preceded by a technical escort<br />
and a private security company guards the tanks of chemicals at<br />
the <strong>Merano</strong> train station.<br />
35
ENVIRONMENTAL STATEMENT <strong>2009</strong><br />
INDIRECT ENVIRONMENTAL ASPECTS<br />
Communications<br />
Communication is another important tool for relating to the<br />
outside world, which MEMC employs to underline its commitment<br />
to the environment and increase the interest of its numerous internal<br />
and external partners in this issue, to demonstrate its serious<br />
and constant commitment to environmental protection and - last<br />
but not least - remind people of the rootedness of the factory and<br />
the important social role it has always played in the local area.<br />
In this respect, during <strong>2009</strong>:<br />
• A project was launched in the schools in the province for<br />
studying alternative sources of energy, to provide an active contribution<br />
to promulgating a culture of sustainable energy and a<br />
sustainable environment - a field in which Alto Adige is undoubtedly<br />
on the cutting edge in Italy.<br />
• MEMC contributed to the creation of a book entitled “Sinigo.<br />
Con i piedi nell’acqua. Storia di un insediamento italiano<br />
nell’Alto Adige degli anni Venti” (“Sinigo. With feet in the water.<br />
The story of an Italian settlement in Alto Adige in the 1920s”)<br />
by Paolo Valente, published by Alphabeta Verlag, as part of an<br />
historical research project of the City of <strong>Merano</strong>. The book was<br />
sponsored by the City itself.<br />
governments, the SASA transit company in <strong>Merano</strong>), as well as<br />
opportunities that can be implemented directly by the company.<br />
The work that was done and the proposals that were made are<br />
summed up in a “Plan for Home-Job Commuting” that has been<br />
provided over the company’s Intranet to all personnel.<br />
• training and environmental awareness-raising continued to be<br />
given to employees, according to plans set forth in <strong>Environmental</strong><br />
Training and Internal Communication programs;<br />
• a digital copy of the validated 2008 <strong>Environmental</strong> <strong>Statement</strong><br />
was made available to all those involved - in printed form<br />
and on CD-ROM - and was also published on MEMC's website<br />
(www.memc.com).<br />
It should be noted that in response to these projects, the Province<br />
of Bolzano - in a letter dated February 3, 2010 from Christian<br />
Tomasini, the Vice-President of the Province - praised MEMC for<br />
“...its enormous commitment to the ongoing development of new<br />
technologies and processes that pay increasing attention to the<br />
environment, and to the company’s relations with the local area”.<br />
• In <strong>2009</strong>, in cooperation with the Mobility Manager of the<br />
City of <strong>Merano</strong>, a project was begun that is intended to optimize<br />
commuting from home to job by MEMC personnel. The goal is to<br />
provide an active contribution to an effort to reduce traffic, which<br />
was launched by the City and by the Province.<br />
The project has been developed in multiple phases:<br />
• raising the awareness of personnel regarding the theme of<br />
mobility<br />
• a preliminary evaluation whose purpose is to “get to know”<br />
the company’s personnel from the standpoint of mobility, with particular<br />
emphasis on current habits and behaviour, limitations (such<br />
as place of origin, work schedules), needs (such as family responsibilities)<br />
and opportunities (for example, grouping together<br />
personnel in the local area who have similar work schedules and<br />
take the same routes from and to the factory)<br />
• an analysis of the means available for travelling from and<br />
to the factory, with special importance given to public transit<br />
• identification of opportunities for improvement that will be<br />
proposed to local public agencies (the municipal and provincial<br />
36
ENVIRONMENTAL STATEMENT <strong>2009</strong><br />
THE ENVIRONMENTAL IMPROVEMENT<br />
PROGRAM<br />
<strong>2009</strong>-2010-2011 ENVIRONMENTAL PROGRAM<br />
Summary of actions ending in December <strong>2009</strong><br />
IMPROVEMENT ACTION OBJECTIVE DEADLINE<br />
ENERGY CONSUMPTION – NORMAL OPERATING CONDITIONS<br />
OBJECTIVE: Reducing electrical energy consumption<br />
DEPARTMENT<br />
RESPONSIBLE<br />
RESULT<br />
1.A.24 Expand the polycrystal production<br />
process with four new 18-rod reactors<br />
1.A.25 Engineer the hydrogen production<br />
process with a new reactor<br />
1.A.26 Further changes to 5 devices for pulling<br />
monocrystal, by installing better heat shields<br />
(fast pull and recharge process)<br />
Reduce specific consumption of electrical energy<br />
for silicon production by a prototype reactor<br />
by 15%<br />
Reduce by 10% the specific consumption<br />
of electrical energy for TCS produced by a<br />
prototype reactor<br />
Reduce specific consumption of electrical energy<br />
for silicon production by these pullers by 25%<br />
(77.6 kWh/kg Si)<br />
December <strong>2009</strong> Innovation Action completed<br />
Objective reached<br />
December <strong>2009</strong> Innovation Action completed<br />
Results slightly poorer than<br />
expected (7% reduction)<br />
December <strong>2009</strong> Monocrystal production Action completed<br />
Objective reached<br />
WATER CONSUMPTION – NORMAL OPERATING CONDITIONS<br />
OBJECTIVE: Reduce consumption of groundwater<br />
2.A.9 Engineer the water network for the<br />
addition to the poly plant in order to recycle<br />
more of the water<br />
Reduce the specific consumption of well water<br />
from 5.5 m3/kg to 4.5 m3/kg<br />
December <strong>2009</strong> Innovation Rescheduled with final<br />
deadline of December<br />
2011 to meet requirements<br />
associated with the<br />
expansion project<br />
WATER CONSUMPTION – NORMAL OPERATING CONDITIONS<br />
OBJECTIVE: Reduce consumption of drinking water<br />
2.B.1 Inspect the factory water network to<br />
optimize consumption<br />
CONSUMPTION OF AUXILIARY MATERIALS USED IN PRODUCTION<br />
OBJECTIVE: Reduce consumption of fuels (fuel oil and diesel fuel)<br />
4.A.11 Dispose of diesel fuel-fired air compressor<br />
(sandblasting cabin)<br />
ATMOSPHERIC EMISSIONS<br />
OBJECTIVE: Reduce atmospheric emissions of CO2<br />
6.E.1 Engineer the distribution system for heat<br />
produced from fossil fuels<br />
Install flow meters and take measures to reduce<br />
consumption by 10%<br />
December <strong>2009</strong> Innovation Rescheduled with final<br />
deadline of December<br />
2011 to meet requirements<br />
associated with the<br />
expansion project<br />
Save 10,000 l of diesel fuel/year December <strong>2009</strong> Innovation Rescheduled with final<br />
deadline of December<br />
2011 to meet requirements<br />
associated with the<br />
expansion project<br />
Reduce production of CO2 by reducing specific<br />
consumption of fuel oil from 2.4 t CO2/t of<br />
silicon to 2.1 t CO2/t of silicon<br />
December <strong>2009</strong> Innovation Action completed<br />
Positive results: final figure<br />
is specific consumption of<br />
2.17 t CO2/t of silicon<br />
WASTE<br />
OBJECTIVE: Reduce waste from charge of polysilicon<br />
10.B.5 Optimize packaging process for<br />
shipments by using recycled paper<br />
Stop using preformed packaging made of<br />
expanded polystyrene<br />
June 2010 Innovation Action completed<br />
Objective reached<br />
37
ENVIRONMENTAL STATEMENT <strong>2009</strong><br />
THE ENVIRONMENTAL IMPROVEMENT<br />
PROGRAM<br />
2010-2010-2011 ENVIRONMENTAL PROGRAM<br />
IMPROVEMENT ACTION OBJECTIVE DEADLINE<br />
ENERGY CONSUMPTION – NORMAL OPERATING CONDITIONS<br />
OBJECTIVE: Reducing electrical energy consumption<br />
1.A.27 Engineering and starting up a “High<br />
energy efficiency reactor” used for growing<br />
polycrystal<br />
Reduce by 25% the specific consumption of<br />
electrical energy to produce silicon produced in<br />
the reactor<br />
December 2010<br />
Innovation<br />
DEPARTMENT<br />
RESPONSIBLE<br />
1.A.28 District heating. Implementation of<br />
systems that exchange heat for civil purposes<br />
at the local distribution agency<br />
Reduction in the energy required for cooling<br />
fluids in cooling towers (estimated at 50 MW/<br />
season)<br />
Spring 2011<br />
Innovation<br />
1.A.29 District heating. Implementation of<br />
systems that exchange heat for civil purposes<br />
at the local distribution agency<br />
Reduce energy/hour (when burning raw<br />
materials), estimated at 35*103 MJ<br />
Spring 2011<br />
Innovation<br />
1.A.30 Implementation of electronic (inverter)<br />
control of the speed of electric motors (with<br />
total power rating of approx. 0.5 MW)<br />
Reduce the consumption of electrical energy<br />
used for powering the motors<br />
December 2011<br />
Innovation<br />
1.A.31 Installation of heat recovery systems<br />
that use exhaust gases to preheat the feed mix<br />
Reduce energy consumption (0.11 kWh/Kg of<br />
TET fed into the plant)<br />
December 2010<br />
Innovation<br />
1.A.32 Installation of new Pyrochemshield and<br />
Pyroflexchem insulation technology to replace<br />
old insulation<br />
Reduce energy consumption and be able to<br />
reuse the insulation after it is removed.<br />
December 2010<br />
Polycrystal<br />
WATER CONSUMPTION – NORMAL OPERATING CONDITIONS<br />
OBJECTIVE: Reduce consumption of groundwater<br />
2.A.9 Engineer the water network for the<br />
addition to the poly plant so that more of the<br />
water is recycled<br />
Reduce the specific consumption of well water<br />
from 5.5 m3/kg to 4.5 m3/kg<br />
December 2011<br />
Innovation<br />
2.A.10 Engineer the water network for the<br />
addition to the poly plant so that more of the<br />
water is recycled<br />
Install evaporation towers to cool the circulating<br />
water that is used instead of well water<br />
December 2010<br />
Innovation<br />
WATER CONSUMPTION – NORMAL OPERATING CONDITIONS<br />
OBJECTIVE: Reduce consumption of drinking water<br />
2.B.1 Inspect the factory water network to<br />
optimize consumption<br />
Install flow meters and take measures to reduce<br />
consumption by 10%<br />
December 2011<br />
Innovation<br />
38
ENVIRONMENTAL STATEMENT <strong>2009</strong><br />
CONSUMPTION OF AUXILIARY<br />
MATERIALS USED IN PRODUCTION<br />
CONSUMPTION OF AUXILIARY MATERIALS USED IN PRODUCTION<br />
OBJECTIVE: Reduce consumption of fuels (fuel oil and diesel fuel)<br />
4.A.5 Replace certain plant components with<br />
new, high-efficiency components. Increase<br />
efficiency of hydrochloric acid recycling<br />
plants, resulting in less use of the soda fume<br />
abatement columns<br />
Estimated 10% reduction in consumption of<br />
caustic soda<br />
December 2010<br />
Innovation<br />
4.A.10 Build a natural gas-fired heating plant<br />
to replace the current fuel oil-fired plant<br />
use natural gas instead of fuel oil.<br />
Reduce specific consumption from 0.7 TOE/t<br />
silicon to 0.6 TOE/t of silicon<br />
December 2011<br />
Innovation<br />
4.A.11 Dispose of diesel fuel-fired air compressor<br />
(sandblasting cabin)<br />
Save 10,000 l of diesel fuel/year December 2011 Innovation<br />
4.A.12 Increase the efficiency of the boilers in<br />
the central heating plant and optimize the heat<br />
recovery loop<br />
Estimated 5% reduction in the consumption of<br />
fuel oil<br />
December 2010<br />
Polycrystal<br />
4.A.13 Recovery - by cryogenic cleaning - of<br />
graphite left after the processing cycle<br />
Estimated 1% reduction in the use of graphite December 2010 CZ<br />
4.A.14 Implementation and validation of new<br />
chemical attack processes for highlighting<br />
defects in crystallography<br />
Estimated 40% reduction in the consumption of<br />
chromium mix<br />
December 2010<br />
CZ<br />
ATMOSPHERIC EMISSIONS<br />
OBJECTIVE: Reduce atmospheric emissions of CO2<br />
6.E.1 Increase the efficiency of the boilers in<br />
the central heating plant and optimize the heat<br />
recovery loop<br />
Reduce CO2 production due to reductions in fuel<br />
oil consumption<br />
December 2010<br />
Polycrystal<br />
6.E.2.a Build a natural gas-fired heating plant<br />
to replace the current fuel oil-fired plant<br />
Reduce production of CO2 by 20% due to the<br />
specific difference between fuel oil and natural<br />
gas<br />
December 2011<br />
Innovation<br />
6.E.2.b Build a natural gas-fired heating plant<br />
to replace the current fuel oil-fired plant<br />
Drastically reduce the production of dust due to<br />
combustion of gas instead of fuel oil<br />
December 2011<br />
Innovation<br />
6.E.2.c Build a natural gas-fired heating plant<br />
to replace the current fuel oil-fired plant<br />
Drastically reduce the production of SO2 due to<br />
combustion of gas instead of fuel oil<br />
December 2011<br />
Innovation<br />
39
ENVIRONMENTAL STATEMENT <strong>2009</strong><br />
CONSUMPTION OF AUXILIARY<br />
MATERIALS USED IN PRODUCTION<br />
WASTE<br />
OBJECTIVE: Reduce the emissions produced by waste<br />
10.B.6 Replacement of the filter press that<br />
separates and packs down the fraction of SiO2<br />
suspended in the HCl solution<br />
A 2.5% decrease is expected in the specific<br />
quantity of sludge per unit of silicon produced<br />
December 2010<br />
Polycrystal<br />
ODS<br />
OBJECTIVE: Eliminate the use of R22<br />
12.5 Replace the FREON 22 refrigerating fluid<br />
in the entire CDI plant with new fluid<br />
Replace Freon 22 with an alternative substance December 2010 Innovation<br />
NOISE<br />
OBJECTIVE: Reduce noise around the perimeter of the facility<br />
15.1 Install special silencers on components of<br />
the plant that are identified as sources of noise<br />
emissions<br />
Estimated reduction in the noise level along the<br />
northern side of the facility<br />
December 2010<br />
PAS<br />
TRAFFIC<br />
OBJECTIVE: Reduce traffic generated by transport of raw materials<br />
21.1 Build a natural gas-fired heating plant to<br />
replace the current fuel oil-fired plant<br />
Reduce industrial vehicle traffic by 68,000 km/<br />
year<br />
December 2011<br />
Innovation<br />
21.2 Replace certain plant components with<br />
new, high-efficiency components. Increase<br />
efficiency of hydrochloric acid recycling<br />
plants resulting in less use of the soda fume<br />
abatement columns<br />
Reduce industrial vehicle traffic by 6,000 km/<br />
year<br />
December 2010<br />
Innovation<br />
21.3 Engineer the process to reduce<br />
the production of chlorosilane mixture<br />
intended for the external market (-30%)<br />
Reduce rail traffic in an amount equal to 60<br />
boxcars, for a total of 100,000 km<br />
December 2010<br />
Polycrystal<br />
EMERGENCY SITUATIONS<br />
OBJECTIVE: Reduce the risk and effects of soil contamination<br />
E.18.6 Use suitable resins to coat the vats at<br />
the bottom of the soda columns that abate<br />
gases leaving the reactors<br />
Reduce presumed leaks and improve the aquifer December 2010 Polycrystal<br />
40
ENVIRONMENTAL STATEMENT <strong>2009</strong><br />
REFERENCE LEGISLATION<br />
The following table shows the main requirements set out in the regulations in force for those environmental aspects judged to be important,<br />
and the respective position of the MEMC factory in <strong>Merano</strong>.<br />
ENVIRONMENTAL<br />
ASPECT<br />
REFERENCE LAW REQUIREMENTS MEMC‘S POSITION<br />
ENERGY CONSUMPTION<br />
It. L. 10/91<br />
Annual report on the factory’s total<br />
consumption of primary sources, and<br />
appointment of an Energy Manager<br />
Send a report on consumption and name<br />
an Energy Manager by April 30 of each<br />
year<br />
WATER CONSUMPTION<br />
It. R.D. 1775/33<br />
It. Leg. D. 152/06<br />
It. P.L. 8/02<br />
Report existing wells<br />
Report re-drilling of existing wells<br />
Report sent and concession received for the<br />
extraction of underground water<br />
Reports sent and thirty-year concession<br />
received for use of wells<br />
ATMOSPHERIC<br />
EMISSIONS<br />
WATER DISCHARGES<br />
It. Leg. D. 152/06<br />
It. P.L. 8/00<br />
IPPC:<br />
It. Leg. D. 59/2005<br />
It. P.L.. 14/03<br />
It. Leg. D. 152/06<br />
It. P.L. 8/02<br />
IPPC:<br />
It. Leg. D. 59/2005<br />
It. P.L.. 14/03<br />
Integrated <strong>Environmental</strong> Authorization<br />
Compliance with prescribed limits<br />
Integrated <strong>Environmental</strong> Authorization<br />
issued by the Province of Bolzano 18th<br />
June 2008<br />
Valid until 18th June 2016<br />
NOISE<br />
It. L.. 447/95<br />
It. D. of Pres. of Prov. Council 4/89<br />
IPPC:<br />
It. Leg. D. 59/2005<br />
It. P.L. 66/78<br />
WASTE<br />
Law 152/06 and associated regulations<br />
A<br />
P.L. 04/06<br />
Compliance with the volume limits and times<br />
for temporary dumping of waste within<br />
factory grounds.<br />
Keep a register on the loading and unloading<br />
of oil.<br />
Compile the accompanying form.<br />
Report to the Chamber of Commerce on the<br />
type and quantity of waste produced and<br />
disposed of (MUD environmental report<br />
form)<br />
Temporary dumping managed in prescribed<br />
manners.<br />
Registers and forms compiled and kept for<br />
the periods and in the ways prescribed.<br />
Completed MUD filed by<br />
April 30 of each year<br />
DM 17.12.<strong>2009</strong><br />
“SISTRI”<br />
PCB It. Pres. D. 216/88<br />
Enrolment in the SISTRI and use of its portal<br />
for recording the movements of waste<br />
(loading/unloading logs, forms, MUDs)<br />
Report to the Provincial administration on<br />
the presence within the factory of devices,<br />
plants or fluids containing PCB in concentrations<br />
in excess of 50 ppm<br />
Enrolment carried out, now awaiting its<br />
activation<br />
First report filed on 29 May<br />
1989, second report filed on 21<br />
February 1990<br />
41
ENVIRONMENTAL STATEMENT <strong>2009</strong><br />
REFERENCE LEGISLATION<br />
SUBSTANCES THAT HARM<br />
THE OZONE LAYER<br />
Regulation 1005/<strong>2009</strong>/CE<br />
Inventory of devices containing substances<br />
that may deplete the ozonosphere. Implementation<br />
of measures to prevent emissions<br />
of such substances during maintenance<br />
operations<br />
Keep a register on the loading/unloading<br />
and check for leakages.<br />
An inventory was made of equipment<br />
that contains Freon 22 (the only substance<br />
harmful to the ozone layer which is used at<br />
the factory). This inventory will be updated<br />
if modifications are made.<br />
Technical and operational measures were<br />
taken to prevent the emission of such<br />
substances into the atmosphere<br />
Leakage tests are performed.<br />
As of 1 January 2010, it is no longer<br />
possible to use virgin HCFCs (such as R22)<br />
for cooling purposes<br />
Inventory of materials on site that may<br />
contain asbestos<br />
Presentation of reclamation plans for<br />
disposing of goods containing asbestos<br />
Upgrade plant systems to use an alternative<br />
refrigerant<br />
ASBESTOS<br />
It. Pres. D. 215/88<br />
Inventory updated annually<br />
Reclamation plans presented for all the<br />
removal operations carried out<br />
CHEMICALS<br />
It. Leg. D. 81/08<br />
It. Leg. D. 334/99<br />
It. L. 40/00<br />
EC/1907/2006 Regulation<br />
Periodic analyses of risks<br />
Notification and information provided to<br />
the public<br />
Safety report<br />
Appointment of consultant for the safe<br />
transport of dangerous goods<br />
Consultant’s annual report on transport<br />
safety and dangerous goods<br />
Risk analysis document pursuant to It. Leg.<br />
D. 81/08<br />
sent to Province of BZ, It. Ministry of Environment<br />
and City of <strong>Merano</strong> (October 2000)<br />
Sent to Government Commissioner, Province<br />
of BZ (October 2000)<br />
Consultant appointed<br />
Annual report drawn up<br />
Pre-registration of products subject to<br />
REACH<br />
Registration with REACH<br />
SOIL<br />
CONTAMINATION<br />
It. Leg. D. 152/06<br />
It. D. of Prov. Council 1072/05 Reclamation of contaminated sites Reclamation completed<br />
ECHO-MANAGEMENT SYSTEMS<br />
EC/1221/<strong>2009</strong> Regulation<br />
Implementation of an echo-management<br />
and auditing system.<br />
Completion of an environmental analysis;<br />
definition of policy, targets and plans.<br />
Preservation of the echo-management and<br />
auditing system and compliance with the<br />
new EU Regulation technical criteria.<br />
42
ENVIRONMENTAL STATEMENT <strong>2009</strong><br />
GLOSSARY<br />
CONTINUOUS IMPROVEMENT OF ENVIRONMENTAL<br />
PERFORMANCE<br />
The process of improving the measurable results in an organization’s<br />
environmental management system, regarding the important<br />
environmental aspects of said organization.<br />
EMAS<br />
An EU system of environmental management and auditing to<br />
which organizations may adhere on a voluntary basis to evaluate<br />
and improve their environmental performance, and provide information<br />
to the public concerning said performance. The system<br />
was instituted by Regulation no. 1221/<strong>2009</strong> of the European<br />
Parliament and Council. In order to adhere to EMAS, organizations<br />
must be equipped with an environmental management<br />
system conforming to ISO Standard 14001, and must publish an<br />
<strong>Environmental</strong> <strong>Statement</strong> containing all the organization’s information<br />
concerning the environment. Adhesion to EMAS is only granted<br />
after having satisfied an inspection visit by an independent,<br />
private inspector, and a further inspection of its documents (also<br />
with respect to compliance with the environmental regulations in<br />
force) by the appropriate competent public body.<br />
ENVIRONMENTAL MANAGEMENT SYSTEM<br />
That part of a company’s overall management system including<br />
the organizational structure, planning activities, responsibilities,<br />
practices, procedures, processes and resources to draft, put into<br />
practice, attain, re-examine and maintain active the environmental<br />
policy.<br />
ENVIRONMENTAL PERFORMANCE<br />
Results obtained from an organization's management of environmental<br />
aspects.<br />
ISO 14001<br />
International standard specifying the requirements of an <strong>Environmental</strong><br />
Management System, which, when integrated with other<br />
management priorities, helps organizations reach their environmental<br />
and economic objectives.<br />
TOXIC DEBT<br />
<strong>Environmental</strong> debt, pollution of one or more environmental matrixes<br />
(soil, sub-soil, groundwater, air, surface waters) generated<br />
by activities carried out in the past.<br />
ENVIRONMENT<br />
The context in which an organization works, including the air,<br />
water, land, natural resources, flora, fauna, and human beings<br />
and their inter-relationships. The context extends from within an<br />
organization to the global system.<br />
ENVIRONMENTAL ASPECT<br />
An element of the activities, products or services of an organization<br />
that may interact with the environment.<br />
ENVIRONMENTAL AUDIT<br />
A management tool including a systematic, documented, periodic<br />
and objective evaluation of an organization’s performance, its<br />
management system and the procedures it implements to protect<br />
the environment.<br />
ENVIRONMENTAL IMPACT OR EFFECT<br />
Any change in the environment - whether negative or an improvement<br />
- that is totally or partly caused by the environmental aspects<br />
of an organization.<br />
43
ENVIRONMENTAL STATEMENT <strong>2009</strong><br />
The subject of this <strong>Environmental</strong> <strong>Statement</strong> for the year <strong>2009</strong> is<br />
the <strong>Merano</strong> factory of MEMC Electronic Materials S.p.A.<br />
This document has been edited in compliance with Article 6 of<br />
EC Regulation 1221/<strong>2009</strong> dated 19th March 2001.<br />
The published data refer to the period 2000/<strong>2009</strong>.<br />
This <strong>Environmental</strong> <strong>Statement</strong> was drawn up by the ESH department,<br />
and approved by the Management Committee: Managing<br />
Director of MEMC S.p.A., factory directors in Novara and <strong>Merano</strong>,<br />
and the Directors of the Materials, Technologies and Human<br />
Resources departments.<br />
Project Manager: A. Tonini<br />
Editorial collaboration: C. de Santis, R. Marangon<br />
This <strong>Environmental</strong> <strong>Statement</strong> was approved by the environmental<br />
inspector at ERM Certification & Verification Services Ltd, 2nd<br />
Floor, Exchequer Court, 33 St Mary Axe, London EC3A 8AA<br />
(numero UK-V0013), on 5/11/2010. The next evaluation will<br />
be carried out by 5/2011. The next annual updating of the<br />
<strong>Environmental</strong> <strong>Statement</strong> will take place in 2011.<br />
For any further information or clarifications, please contact:<br />
- Andrea Tonini – RSPP/RDPA, MEMC <strong>Merano</strong> – Tel: +39 0473<br />
333408 – Fax: 0473.333.140 - @ atonini@memc.it<br />
- Claudio De Santis – Environment Manager, MEMC <strong>Merano</strong> –<br />
Tel: +39 0473 333214 – Fax: 0473.333.140 -<br />
@ cdesantis@memc.it<br />
All rights reserved.<br />
Graphic design project: kdg italia srl<br />
44