Annual Report 2008-2009 - Bharat Petroleum
Annual Report 2008-2009 - Bharat Petroleum
Annual Report 2008-2009 - Bharat Petroleum

Create successful ePaper yourself
Turn your PDF publications into a flip-book with our unique Google optimized e-Paper software.
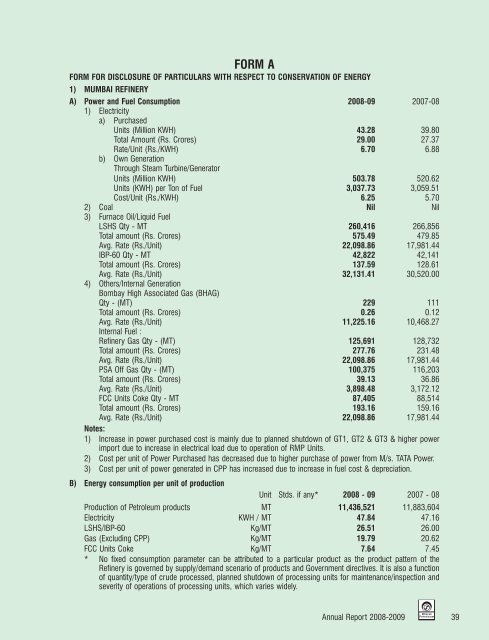
FORM A<br />
FORM FOR DISCLOSURE OF PARTICULARS WITH RESPECT TO CONSERVATION OF ENERGY<br />
1) MUMBAI REFINERY<br />
A) Power and Fuel Consumption <strong>2008</strong>-09 2007-08<br />
1) Electricity<br />
a) Purchased<br />
Units (Million KWH) 43.28 39.80<br />
Total Amount (Rs. Crores) 29.00 27.37<br />
Rate/Unit (Rs./KWH) 6.70 6.88<br />
b) Own Generation<br />
Through Steam Turbine/Generator<br />
Units (Million KWH) 503.78 520.62<br />
Units (KWH) per Ton of Fuel 3,037.73 3,059.51<br />
Cost/Unit (Rs./KWH) 6.25 5.70<br />
2) Coal Nil Nil<br />
3) Furnace Oil/Liquid Fuel<br />
LSHS Qty - MT 260,416 266,856<br />
Total amount (Rs. Crores) 575.49 479.85<br />
Avg. Rate (Rs./Unit) 22,098.86 17,981.44<br />
IBP-60 Qty - MT 42,822 42,141<br />
Total amount (Rs. Crores) 137.59 128.61<br />
Avg. Rate (Rs./Unit) 32,131.41 30,520.00<br />
4) Others/Internal Generation<br />
Bombay High Associated Gas (BHAG)<br />
Qty - (MT) 229 111<br />
Total amount (Rs. Crores) 0.26 0.12<br />
Avg. Rate (Rs./Unit) 11,225.16 10,468.27<br />
Internal Fuel :<br />
Refinery Gas Qty - (MT) 125,691 128,732<br />
Total amount (Rs. Crores) 277.76 231.48<br />
Avg. Rate (Rs./Unit) 22,098.86 17,981.44<br />
PSA Off Gas Qty - (MT) 100,375 116,203<br />
Total amount (Rs. Crores) 39.13 36.86<br />
Avg. Rate (Rs./Unit) 3,898.48 3,172.12<br />
FCC Units Coke Qty - MT 87,405 88,514<br />
Total amount (Rs. Crores) 193.16 159.16<br />
Avg. Rate (Rs./Unit) 22,098.86 17,981.44<br />
Notes:<br />
1) Increase in power purchased cost is mainly due to planned shutdown of GT1, GT2 & GT3 & higher power<br />
import due to increase in electrical load due to operation of RMP Units.<br />
2) Cost per unit of Power Purchased has decreased due to higher purchase of power from M/s. TATA Power.<br />
3) Cost per unit of power generated in CPP has increased due to increase in fuel cost & depreciation.<br />
B) Energy consumption per unit of production<br />
Unit Stds. if any* <strong>2008</strong> - 09 2007 - 08<br />
Production of <strong>Petroleum</strong> products MT 11,436,521 11,883,604<br />
Electricity KWH / MT 47.84 47.16<br />
LSHS/IBP-60 Kg/MT 26.51 26.00<br />
Gas (Excluding CPP) Kg/MT 19.79 20.62<br />
FCC Units Coke Kg/MT 7.64 7.45<br />
* No fixed consumption parameter can be attributed to a particular product as the product pattern of the<br />
Refinery is governed by supply/demand scenario of products and Government directives. It is also a function<br />
of quantity/type of crude processed, planned shutdown of processing units for maintenance/inspection and<br />
severity of operations of processing units, which varies widely.<br />
<strong>Annual</strong> <strong>Report</strong> <strong>2008</strong>-<strong>2009</strong> 39