Eco Today - Mar10:ET Master Page 2007 - ASKnLearn
Eco Today - Mar10:ET Master Page 2007 - ASKnLearn
Eco Today - Mar10:ET Master Page 2007 - ASKnLearn

Create successful ePaper yourself
Turn your PDF publications into a flip-book with our unique Google optimized e-Paper software.
60<br />
50<br />
40<br />
30<br />
20<br />
10<br />
0<br />
36.0<br />
’92<br />
37.8<br />
’93<br />
39.1<br />
’94<br />
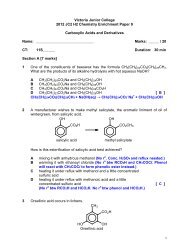
Figure 3: China’s savings ratio in 1992-<strong>2007</strong> (%)<br />
38.4<br />
’95<br />
37.2<br />
’96<br />
37.7<br />
37.8<br />
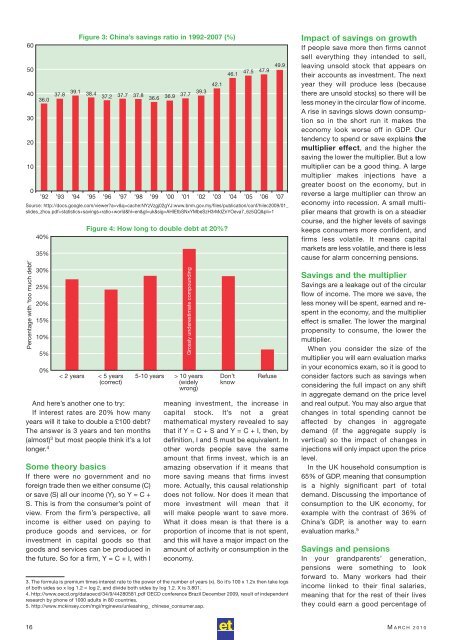
And here’s another one to try:<br />
If interest rates are 20% how many<br />
years will it take to double a £100 debt?<br />
The answer is 3 years and ten months<br />
(almost) 3 but most people think it’s a lot<br />
longer. 4<br />
Some theory basics<br />
If there were no government and no<br />
foreign trade then we either consume (C)<br />
or save (S) all our income (Y), so Y = C +<br />
S. This is from the consumer’s point of<br />
view. From the firm’s perspective, all<br />
income is either used on paying to<br />
produce goods and services, or for<br />
investment in capital goods so that<br />
goods and services can be produced in<br />
the future. So for a firm, Y = C + I, with I<br />
36.6<br />
36.9<br />
37.7<br />
39.3<br />
42.1<br />
46.1<br />
47.5<br />
47.9<br />
49.9<br />
’97 ’98 ’99 ’00 ’01 ’02 ’03 ’04 ’05 ’06 ’07<br />
Source: http://docs.google.com/viewer?a=v&q=cache:NYzVzgj02gYJ:www.bnm.gov.my/files/publication/conf/hilec2009/01_<br />
slides_zhou.pdf+statistics+savings+ratio+world&hl=en&gl=uk&sig=AHIEtbSNxYMbeSzH3rMdZnYOeva7_6z5QQ&pli=1<br />
Percentage with ‘too much debt’<br />
40%<br />
35%<br />
30%<br />
25%<br />
20%<br />
15%<br />
10%<br />
5%<br />
0%<br />
< 2 years<br />
Figure 4: How long to double debt at 20%?<br />
< 5 years<br />
(correct)<br />
5-10 years > 10 years<br />
(widely<br />
wrong)<br />
Don’t<br />
know<br />
Refuse<br />
meaning investment, the increase in<br />
capital stock. It’s not a great<br />
mathematical mystery revealed to say<br />
that if Y = C + S and Y = C + I, then, by<br />
definition, I and S must be equivalent. In<br />
other words people save the same<br />
amount that firms invest, which is an<br />
amazing observation if it means that<br />
more saving means that firms invest<br />
more. Actually, this causal relationship<br />
does not follow. Nor does it mean that<br />
more investment will mean that it<br />
will make people want to save more.<br />
What it does mean is that there is a<br />
proportion of income that is not spent,<br />
and this will have a major impact on the<br />
amount of activity or consumption in the<br />
economy.<br />
3. The formula is premium times interest rate to the power of the number of years (x). So it’s 100 x 1.2x then take logs<br />
of both sides so x log 1.2 = log 2, and divide both sides by log 1.2. X is 3.801.<br />
4. http://www.oecd.org/dataoecd/34/9/44280581.pdf OECD conference Brazil December 2009, result of independent<br />
research by phone of 1000 adults in 80 countries.<br />
5. http://www.mckinsey.com/mgi/mginews/unleashing_ chinese_consumer.asp.<br />
Grossly underestimate compounding<br />
Impact of savings on growth<br />
If people save more then firms cannot<br />
sell everything they intended to sell,<br />
leaving unsold stock that appears on<br />
their accounts as investment. The next<br />
year they will produce less (because<br />
there are unsold stocks) so there will be<br />
less money in the circular flow of income.<br />
A rise in savings slows down consump -<br />
tion so in the short run it makes the<br />
economy look worse off in GDP. Our<br />
tendency to spend or save explains the<br />
multiplier effect, and the higher the<br />
saving the lower the multiplier. But a low<br />
multiplier can be a good thing. A large<br />
multi plier makes injections have a<br />
greater boost on the economy, but in<br />
reverse a large multiplier can throw an<br />
economy into recession. A small multi -<br />
plier means that growth is on a steadier<br />
course, and the higher levels of savings<br />
keeps consumers more confident, and<br />
firms less volatile. It means capital<br />
markets are less volatile, and there is less<br />
cause for alarm concerning pensions.<br />
Savings and the multiplier<br />
Savings are a leakage out of the circular<br />
flow of income. The more we save, the<br />
less money will be spent, earned and respent<br />
in the economy, and the multiplier<br />
effect is smaller. The lower the marginal<br />
propensity to consume, the lower the<br />
multiplier.<br />
When you consider the size of the<br />
multiplier you will earn evaluation marks<br />
in your economics exam, so it is good to<br />
consider factors such as savings when<br />
considering the full impact on any shift<br />
in aggregate demand on the price level<br />
and real output. You may also argue that<br />
changes in total spending cannot be<br />
affected by changes in aggregate<br />
demand (if the aggregate supply is<br />
vertical) so the impact of changes in<br />
injections will only impact upon the price<br />
level.<br />
In the UK household consumption is<br />
65% of GDP, meaning that consumption<br />
is a highly significant part of total<br />
demand. Discussing the importance of<br />
consumption to the UK economy, for<br />
example with the contrast of 36% of<br />
China’s GDP, is another way to earn<br />
evaluation marks. 5<br />
Savings and pensions<br />
In your grandparents’ generation,<br />
pensions were something to look<br />
forward to. Many workers had their<br />
income linked to their final salaries,<br />
meaning that for the rest of their lives<br />
they could earn a good percentage of<br />
16 M ARCH 2010