Eco Today - Mar10:ET Master Page 2007 - ASKnLearn
Eco Today - Mar10:ET Master Page 2007 - ASKnLearn
Eco Today - Mar10:ET Master Page 2007 - ASKnLearn

You also want an ePaper? Increase the reach of your titles
YUMPU automatically turns print PDFs into web optimized ePapers that Google loves.
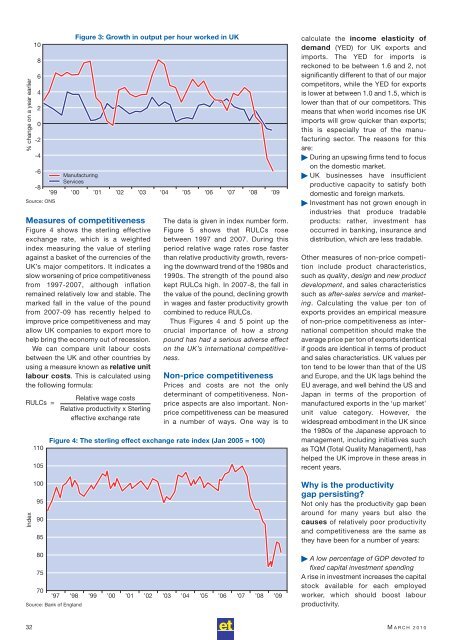
% change on a year earlier<br />
10<br />
8<br />
6<br />
4<br />
2<br />
0<br />
-2<br />
-4<br />
-6<br />
Manufacturing<br />
Services<br />
-8<br />
’99 ’00 ’01 ’02 ’03 ’04 ’05 ’06 ’07 ’08 ’09<br />
Source: ONS<br />
Measures of competitiveness<br />
Figure 4 shows the sterling effective<br />
exchange rate, which is a weighted<br />
index measuring the value of sterling<br />
against a basket of the currencies of the<br />
UK’s major competitors. It indicates a<br />
slow worsening of price competitiveness<br />
from 1997-<strong>2007</strong>, although inflation<br />
remained relatively low and stable. The<br />
marked fall in the value of the pound<br />
from <strong>2007</strong>-09 has recently helped to<br />
improve price competitiveness and may<br />
allow UK companies to export more to<br />
help bring the economy out of recession.<br />
We can compare unit labour costs<br />
between the UK and other countries by<br />
using a measure known as relative unit<br />
labour costs. This is calculated using<br />
the following formula:<br />
RULCs =<br />
Index<br />
110<br />
105<br />
100<br />
95<br />
90<br />
85<br />
80<br />
75<br />
70<br />
Figure 3: Growth in output per hour worked in UK<br />
Relative wage costs<br />
Relative productivity x Sterling<br />
effective exchange rate<br />
The data is given in index number form.<br />
Figure 5 shows that RULCs rose<br />
between 1997 and <strong>2007</strong>. During this<br />
period relative wage rates rose faster<br />
than relative productivity growth, revers -<br />
ing the downward trend of the 1980s and<br />
1990s. The strength of the pound also<br />
kept RULCs high. In <strong>2007</strong>-8, the fall in<br />
the value of the pound, declining growth<br />
in wages and faster productivity growth<br />
combined to reduce RULCs.<br />
Thus Figures 4 and 5 point up the<br />
crucial importance of how a strong<br />
pound has had a serious adverse effect<br />
on the UK’s international competitive -<br />
ness.<br />
Non-price competitiveness<br />
Prices and costs are not the only<br />
determinant of competitiveness. Nonprice<br />
aspects are also important. Nonprice<br />
competitiveness can be measured<br />
in a number of ways. One way is to<br />
Figure 4: The sterling effect exchange rate index (Jan 2005 = 100)<br />
’97 ’98 ’99 ’00 ’01 ’02 ’03 ’04 ’05 ’06 ’07 ’08 ’09<br />
Source: Bank of England<br />
calculate the income elasticity of<br />
demand (YED) for UK exports and<br />
imports. The YED for imports is<br />
reckoned to be between 1.6 and 2, not<br />
significantly different to that of our major<br />
competitors, while the YED for exports<br />
is lower at between 1.0 and 1.5, which is<br />
lower than that of our competitors. This<br />
means that when world incomes rise UK<br />
imports will grow quicker than exports;<br />
this is especially true of the manu -<br />
facturing sector. The reasons for this<br />
are:<br />
During an upswing firms tend to focus<br />
on the domestic market.<br />
UK businesses have insufficient<br />
productive capacity to satisfy both<br />
domestic and foreign markets.<br />
Investment has not grown enough in<br />
industries that produce tradable<br />
products: rather, investment has<br />
occurred in banking, insurance and<br />
distribution, which are less tradable.<br />
Other measures of non-price competi -<br />
tion include product charac teristics,<br />
such as quality, design and new product<br />
development, and sales characteristics<br />
such as after-sales service and market -<br />
ing. Calculating the value per ton of<br />
exports provides an empirical measure<br />
of non-price competi tiveness as inter -<br />
national competition should make the<br />
average price per ton of exports identical<br />
if goods are identical in terms of product<br />
and sales charac teristics. UK values per<br />
ton tend to be lower than that of the US<br />
and Europe, and the UK lags behind the<br />
EU average, and well behind the US and<br />
Japan in terms of the proportion of<br />
manufactured exports in the ‘up market’<br />
unit value category. However, the<br />
widespread embodiment in the UK since<br />
the 1980s of the Japanese approach to<br />
manage ment, including initiatives such<br />
as TQM (Total Quality Management), has<br />
helped the UK improve in these areas in<br />
recent years.<br />
Why is the productivity<br />
gap persisting?<br />
Not only has the productivity gap been<br />
around for many years but also the<br />
causes of relatively poor productivity<br />
and competitiveness are the same as<br />
they have been for a number of years:<br />
A low percentage of GDP devoted to<br />
fixed capital investment spending<br />
A rise in investment increases the capital<br />
stock available for each employed<br />
worker, which should boost labour<br />
productivity.<br />
32 M ARCH 2010