Annual Report 2005 (60 pages / 1.3MB) - JAL | JAPAN AIRLINES
Annual Report 2005 (60 pages / 1.3MB) - JAL | JAPAN AIRLINES
Annual Report 2005 (60 pages / 1.3MB) - JAL | JAPAN AIRLINES

Create successful ePaper yourself
Turn your PDF publications into a flip-book with our unique Google optimized e-Paper software.
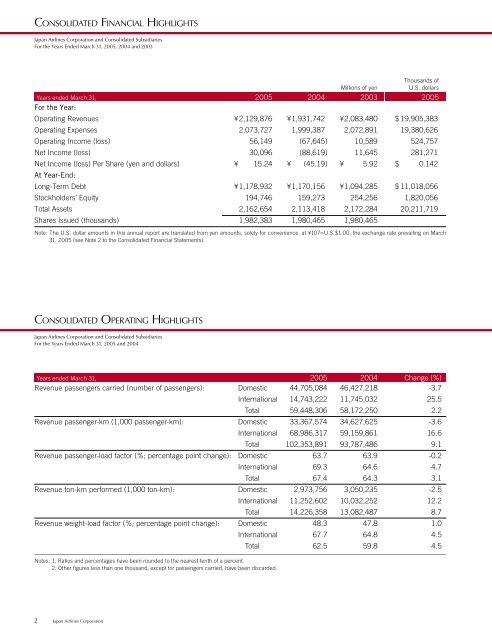
CONSOLIDATED FINANCIAL HIGHLIGHTS<br />
Japan Airlines Corporation and Consolidated Subsidiaries<br />
For the Years Ended March 31, <strong>2005</strong>, 2004 and 2003<br />
Thousands of<br />
Millions of yen<br />
U.S. dollars<br />
Years ended March 31, <strong>2005</strong> 2004 2003 <strong>2005</strong><br />
For the Year:<br />
Operating Revenues ¥2,129,876 ¥1,931,742 ¥2,083,480 $ 19,905,383<br />
Operating Expenses 2,073,727 1,999,387 2,072,891 19,380,626<br />
Operating Income (loss) 56,149 (67,645) 10,589 524,757<br />
Net Income (loss) 30,096 (88,619) 11,645 281,271<br />
Net Income (loss) Per Share (yen and dollars) ¥ 15.24 ¥ (45.19) ¥ 5.92 $ 0.142<br />
At Year-End:<br />
Long-Term Debt ¥1,178,932 ¥1,170,156 ¥1,094,285 $ 11,018,056<br />
Stockholders’ Equity 194,746 159,273 254,256 1,820,056<br />
Total Assets 2,162,654 2,113,418 2,172,284 20,211,719<br />
Shares Issued (thousands) 1,982,383 1,980,465 1,980,465<br />
Note: The U.S. dollar amounts in this annual report are translated from yen amounts, solely for convenience, at ¥107=U.S.$1.00, the exchange rate prevailing on March<br />
31, <strong>2005</strong> (see Note 2 to the Consolidated Financial Statements).<br />
CONSOLIDATED OPERATING HIGHLIGHTS<br />
Japan Airlines Corporation and Consolidated Subsidiaries<br />
For the Years Ended March 31, <strong>2005</strong> and 2004<br />
Years ended March 31, <strong>2005</strong> 2004 Change (%)<br />
Revenue passengers carried (number of passengers): Domestic 44,705,084 46,427,218 -3.7<br />
International 14,743,222 11,745,032 25.5<br />
Total 59,448,306 58,172,250 2.2<br />
Revenue passenger-km (1,000 passenger-km): Domestic 33,367,574 34,627,625 -3.6<br />
International 68,986,317 59,159,861 16.6<br />
Total 102,353,891 93,787,486 9.1<br />
Revenue passenger-load factor (%; percentage point change): Domestic 63.7 63.9 -0.2<br />
International 69.3 64.6 4.7<br />
Total 67.4 64.3 3.1<br />
Revenue ton-km performed (1,000 ton-km): Domestic 2,973,756 3,050,235 -2.5<br />
International 11,252,<strong>60</strong>2 10,032,252 12.2<br />
Total 14,226,358 13,082,487 8.7<br />
Revenue weight-load factor (%; percentage point change): Domestic 48.3 47.8 1.0<br />
Notes: 1. Ratios and percentages have been rounded to the nearest tenth of a percent.<br />
2. Other figures less than one thousand, except for passengers carried, have been discarded.<br />
International 67.7 64.8 4.5<br />
Total 62.5 59.8 4.5<br />
2 Japan Airlines Corporation